 Open Access Article
Creative Commons Attribution 3.0 Unported Licence
Multiscale analysis of triglycerides using X-ray scattering: implementing a shape-dependent model for CNP characterization†
Ivana A
Penagos
 ab,
Fien
De Witte
 a,
Tom
Rimaux
bc,
William
Chèvremont
 d,
Isabel
Pintelon
 ef,
Koen
Dewettinck
 ab and
Filip
Van Bockstaele
 *ab
*ab
aFood Structure and Function Research Group (FSF), Ghent University, Coupure Links 653, 9000 Ghent, Belgium. E-mail: Filip.VanBockstaele@UGent.be
bVandemoortele Centre ‘Lipid Science and Technology’, Ghent University, Coupure Links 653, 9000 Ghent, Belgium
cVandemoortele R&D Centre, Prins Albertlaan 79, 8870 Izegem, Belgium
dESRF – The European Synchrotron, 38043 Grenoble, France
eLaboratory of Cell Biology and Histology, University of Antwerp, Universiteitsplein 1, 2610 Wilrijk, Belgium
fAntwerp Centre For Advanced Microscopy (ACAM), University of Antwerp, Universiteitsplein 1, 2610 Wilrijk, Belgium
First published on 4th June 2024
Abstract
In the last decade, research has focused on examining the fundamental interactions occurring in triglycerides, aiming to comprehend the self-assembly of crystalline nanoplatelets (CNPs) and their role in forming larger hierarchical structures essential for fat functionality. Microscopy research on CNPs frequently requires disruptive preparatory techniques, such as deoiling and sonication, to achieve quantitative outcomes. Conversely, X-ray scattering has proven to be an advantageous method for studying triglycerides, as little sample is needed to quantify the system's hierarchical structures. Specifically, ultra-small-angle X-ray scattering (USAXS) has emerged as a fitting technique for studying CNPs, owing to its length scale range falling between 25 nm and 3.49 μm. In this study, we characterized four different 30% fat dilutions of stearic acid-based fats in triolein, with various purities and preparation protocols. Samples were characterized by combining diverse microscopy techniques (cryo-SEM, TEM, polarized light and phase contrast microscopy) with synchrotron-radiation X-ray scattering (WAXS, SAXS, and USAXS). A shape-dependent model for the interpretation of USAXS data is proposed, overcoming some of the drawbacks linked to previously utilized models. CNPs are modeled as polydisperse parallelepipeds, and the aggregates are characterized by fractal dimensionality. This model offers novel insights into CNP cross-section, as well as aggregation. In the long run, we hope that the model will increase our understanding of CNP conformation and interactions, helping us design new fat systems on the mesoscale.
1. Introduction
Over the past few decades, attention has been focused on studying the primary building blocks of triglycerides.1–8 The core goal is to understand how edible fat molecules self-assemble and how their aggregation plays a role in the formation of macroscale structures responsible for fat functionality.9Edible fats are complex food systems with intricate geometrical arrangements.2 During the crystallization process of triglycerides (TAG), TAG molecules self-assemble into distinct structures at different length scales. A graphical representation is provided in Fig. 1. At a nanoscopic level, inter- and intramolecular interactions between TAG molecules result in packing arrangements (polymorphs – α, β′, and β) and specific configurations (2L or 3L).10–14 TAG molecules then self-assemble into lamellar phases, which stack epitaxially due to van der Waals forces forming anisotropic crystalline nanoplatelets (CNPs).9,13,15,16 CNPs then aggregate into larger agglomerates, forming different domain sizes, including crystallites and crystal clusters.1 Eventually, polycrystalline spherulites, also known as flocs, will interact with each other, determining the macrostructure and functionality of soft matter fat systems. Each level greatly influences the functionality and applicability of lipids, as the overall size and morphology of the different aggregation levels determine key macroscopic properties (i.e., texture, solid fat content, and oil binding capacity).9,13
 | ||
| Fig. 1 Representation of the different aggregation levels in TAGs. The naming of the levels is based on Mishra et al.,1 with one exception: “domain” is here replaced by crystalline nanoplatelet (“CNP”).17 | ||
The first systematic study to identify the primary unit was done by Acevedo and Marangoni in 2010.2 The authors set up a series of transmission electron microscopy (TEM) experiments that allowed the identification of the primary building blocks, so-called CNPs. These CNPs, formed by the stacking of lamellae, are considered to be the basis of the complex supramolecular structural hierarchy in TAG crystal networks.18 A considerable number of experiments were performed to describe and quantify these CNPs, seeking to understand how composition and processing parameters would alter their nature.2–8 Alternatively, a more recent study conducted by Mishra et al.1 successfully utilized atomic force microscopy (AFM) to characterize crystallites and their corresponding lamellar domains. Their findings suggest that within 1 nm and 10 μm, there are at least three different domain sizes, namely lamellae (at the nanometre level), domains (here named CNPs, of about hundred nanometres) and crystallites (at the micrometre level). These methodologies, however, require intense disruption of the fat crystal network, as preparatory methods such as deoiling and sonication are necessary to obtain quantitative results.
In order to overcome the burdens of sample preparation, in 2013, X-ray scattering was first used to study CNPs. X-ray scattering is a powerful technique to study the submicroscopic structural organization of materials. It allows the determination of the dimensionality at different length scales by analysing the measured scattering intensities using appropriate structural models.19 X-ray scattering is a well-established technique that has helped the understanding of several multi-level hierarchical systems.20 It is a particularly well-suited technique for investigating concentrated and opaque samples, such as TAGs, which are prone to structural damage when performing microscopic experiments (i.e. deoiling).9,21
Peyronel et al. pioneered the use of USAXS for the study of CNPs. The first USAXS experiments reported for fat crystal networks were conducted in the Advanced Photon Source, Argonne National Laboratory, utilizing a Bonse-Hart instrument that allowed data collection in the range of 30 nm to 10 μm.3
In the context of their research, two analytical models were utilized to process USAXS data. The first model utilized is the unified fit model.3 Although helpful, the unified fit model fails to account for the shape of the particle. In fact, in the calculation of the CNP equivalent radius (RCNP), the model assumes that the CNPs are monodisperse spheres, an assumption known to be false and that can yield an overestimation of the actual scattering particle.21,22 Therefore, this model disregards the anisotropic nature of the primary scatterer. In addition, the unified fit model has certain drawbacks, as it remains relatively unstable at the crossover point from the Guinier region to the power law regime (which occurs at a rather arbitrary value of q).21,23 The interpretation when analysing polydisperse multi-level systems, such as triglycerides, must be done with utmost care.
To compensate for the lack of shape-dependency of the unified fit model, a second model is suggested. In the context of triglycerides, the Guinier–Porod model has only been utilized to obtain the s-factor, indicative of the shape of the primary scattering units.3
Although the efforts so far have been considerable, little to no attention has been put on the morphological features of the CNPs. In fact, many of these morphological features have not been taken into account when studying fat crystal networks and, therefore, have not been implemented in the modelling, interpretation or design of new fat systems.
In this article, we propose a new model for the interpretation of USAXS data. The proposed model responds to the need for modelling the data based on assumptions in real space rather than curve fitting. In fact, unlike previous models, this is a shape-dependent model, and the output contains information on the cross-section of CNPs, as well as their aggregation. Thus, by modelling the USAXS range, we were able to fully characterize the mesoscale of triglyceride systems, from the primary building blocks (CNPs) to their aggregation.
To engage in the model discussion, we presented certain measurements as examples. We combine wide-angle X-ray scattering (WAXS), small angle X-ray scattering (SAXS) and ultra-small angle X-ray scattering (USAXS) to study, at various length scales, four different stearic acid based systems (from the angstrom level up to the micrometre level). We characterize the SAXS and USAXS ranges with different available models and compare the output. Whenever possible (in the case of length scale overlap), the findings were compared to ex situ microscopic techniques, such as transmission electron microscopy (TEM) or cryo-SEM (cryogenic scanning electron microscopy), which allowed us to validate the findings of the scattering models.
2. Materials and methods
2.1 Materials
Triolein (OOO) (>99%, CAS 122-32-7) and tristearin (SSS) (>99%, CAS 555-43-1) were acquired from Nu-Chek-Prep Inc (Elysian, MN, USA). Fully hydrogenated rapeseed oil (FHRO) and high oleic sunflower oil (HOSO) were kindly provided by Vandemoortele R&D (Izegem, Belgium). The predominant fatty acid in FHRO was stearic acid (18![[thin space (1/6-em)]](https://www.rsc.org/images/entities/char_2009.gif) :
:![[thin space (1/6-em)]](https://www.rsc.org/images/entities/char_2009.gif) 0) at around ∼90.2%. Small amounts of palmitic acid (16
0) at around ∼90.2%. Small amounts of palmitic acid (16![[thin space (1/6-em)]](https://www.rsc.org/images/entities/char_2009.gif) :
:![[thin space (1/6-em)]](https://www.rsc.org/images/entities/char_2009.gif) 0) and arachidic acid (20
0) and arachidic acid (20![[thin space (1/6-em)]](https://www.rsc.org/images/entities/char_2009.gif) :
:![[thin space (1/6-em)]](https://www.rsc.org/images/entities/char_2009.gif) 0) were present at ∼5.4% and ∼1.8% respectively. Acetone (>99%, CAS 67-64-1), n-hexane (>99%, CAS 110-54-3) and isobutanol (>99%, CAS 78-83-1) were acquired from ChemLab (Zedelgem, Belgium). Quartz glass capillaries (diameter <1.5 mm, 80 mm length, 0.01 mm thickness, Q-15-001-80) were acquired from WJM-Glas Müller GMBH (Berlin, Germany). Polypropylene disposable syringes (1 ml INJEKT® Solo, B. Braun, Melsungen, Germany) and needles (STERICAN® needles 21 G 0.8 mm × 120 mm) were utilized to transfer the TAG dilutions into the quartz capillaries.
0) were present at ∼5.4% and ∼1.8% respectively. Acetone (>99%, CAS 67-64-1), n-hexane (>99%, CAS 110-54-3) and isobutanol (>99%, CAS 78-83-1) were acquired from ChemLab (Zedelgem, Belgium). Quartz glass capillaries (diameter <1.5 mm, 80 mm length, 0.01 mm thickness, Q-15-001-80) were acquired from WJM-Glas Müller GMBH (Berlin, Germany). Polypropylene disposable syringes (1 ml INJEKT® Solo, B. Braun, Melsungen, Germany) and needles (STERICAN® needles 21 G 0.8 mm × 120 mm) were utilized to transfer the TAG dilutions into the quartz capillaries.
2.2 Statically crystallized sample preparation
A 30% (w/w) dilution of tristearin (SSS) in triolein (OOO) was meticulously weighed (1 g) in a 5 ml beaker. The sample was melted to 80 °C for at least 15 minutes. Once molten, the sample was transferred into a quartz capillary using a pre-heated disposable polypropylene syringe. Each capillary was measured to make sure the diameter did not exceed 1.3 mm. The procedure was then repeated for a second dilution of 30% (w/w) FHRO in HOSO (200 g in a 250 ml beaker).Samples were crystallized four weeks before synchrotron experiments. For this, an altered HFSX350 Linkam stage that allows precise temperature control of samples in capillaries was utilized (Xenocs, Grenoble, France). Samples were melted to 80 °C for 15 minutes to erase crystal memory, after which they were crystallized following the appropriate cooling protocol. Samples were stored in a thermostatic cabinet until transported to the ESRF in a portable mini car refrigerator set at 15 °C (Vevor, USA).
2.3 Pilot scale sample preparation
Pilot scale samples were prepared with a benchtop scraped surface heat exchanger (SSHE) (Het Stempel B.V., Zwijndrecht, The Netherlands). The process was carried out using a micropump and a micro-SSHE (a volume of 29 ml), equipped with a set of scraping knives on the rotor axis. This device allowed for shear crystallization, mimicking industrially relevant conditions. For further specifications on the device, the reader is referred elsewhere.24 For the trial, 4 kg of 30% dilution of FHRO in HOSO were used as the fat base. The inlet temperature of the melt was set to 77 °C, the flow rate was set to 5 kg h−1 and the SSHE rotation had a value of 500 rpm. For the X-ray scattering experiments, a small amount of sample was gathered immediately after production (in the outlet point) and placed in-between a galvanized metallic washer (5.3 × 10 mm). The sample was sealed in between two 9 mm Kapton tape dots (0.05 mm thickness) (PrintTec B.V., Geldermalsen, The Netherlands). For the microscopy experiments, the crystallized fat system was stored in 200 ml containers. Samples were then stored in a thermostatic cabinet set at 15 °C until transported to the ESRF in a portable mini car refrigerator (also set at 15 °C) (Vevor, San Bernardino, CA, USA).2.4 Cryo-SEM microscopy
Visualization of CNPs was performed utilizing a cryogenic electron scanning microscope (cryo-SEM). For this, a three-step methodology was utilized. To ensure replicability of the procedure, visualizations were replicated at least twice.The software Image J Fiji was utilized for size measurements. At least 50 different measurements were performed per sample.
2.5 Transmission electron microscopy (TEM)
For the TEM visualization, sample preparation and sample deoiling followed the same procedure as described in the cryo-SEM section. Prior to the visualization, negative staining was necessary. For this, solutions with the lipid crystals were diluted in 1 M tris-buffered saline (TBS). C-Flat™ carbon film gold 300 mesh EM grids (Jena Bioscience, Jena, Germany) were placed in a glow-discharger. Then, 4 μl of the sample was deposited onto the EM grids and left to incubate for 1 min. Excess solution was removed by quickly touching the grid edge with filter paper. Subsequently, the EM grids were washed twice with tris-buffer and aqua dest before transferring the grids to a drop of 2% uranyl acetate. After 1 min, the excess solution was removed, and the EM grids were air-dried before imaging. EM grids were evaluated in a transmission electron microscope, Tecnai G2 Spirit BioTWIN (FEI, Eindhoven, The Netherlands) at 120 kV.2.6 Polarized light microscopy
Polarized light micrographs were captured employing a Leica DM2500 microscope (Wetzlar, Germany) equipped with a Leica MC170 HD colour camera. A small amount of sample was placed between a glass slip and a coverslip and then placed under the microscope. For the statically crystallized samples, a Linkam PE120 Peltier system equipped with a T95 system controller was used. Each sample was brought to 80 °C for 15 minutes to erase crystal memory. Crystallization then occurred as the sample was cooled down from 80 °C to 15 °C at a rate of 1 °C min−1 or 10 °C min−1 (slow vs. fast cooling). The sample was kept at 15 °C for 15 minutes isothermally. For the pilot scale sample, a small amount of sample was placed between a glass slip and a coverslip and then placed under the microscope at 15 °C. The acquisition was performed with a Leica Microscope Lens HCX PL Fluotar 20×/0.50 utilizing the software Leica Application Suite (LAS) V4.3. At least ten different images were acquired each time.2.7 Phase contrast microscopy
For phase contrast microscopy, a Leica DM2500 LED microscope (Wetzlar, Germany), equipped with a Leica K3C colour camera, was utilized. Samples were prepared as explained in Section 2.6. The acquisition was performed with an HC PL FLUOTAR 40×/0.80 PH2 objective, utilizing the software Leica LAS X. At least five different images were acquired each time.2.8 X-ray scattering experiments
X-ray scattering experiments were performed using a TRUSAXS instrument of the European Synchrotron Radiation Facility (ESRF), Grenoble, France (beamline ID02). The wavelength was 1.013 Å (12.230 keV).26 The setup and data reduction are described in a great level of detail in Appendix 1 (ESI†).2.9 Short spacings
WAXS profiles were utilized to identify polymorphisms. For this, a Python script was utilized to find the relevant peaks. Eqn (1) was used to convert from inverse scattering vector q (nm−1) to real space spacings d (nm). | (1) |
2.10 Long spacings
Similarly, a Python script was utilized to find the peak positions in the SAXS area. After background subtraction, the peaks were fitted to a Gaussian curve, and the full width at half maximum (FWHM) was calculated for the three available peak reflections (001, 002 and 003). In each case, the equivalent d-value was calculated (eqn (1)), and the d-spacing was obtained from the linear interpolation of all recorded positions (Appendix 3, ESI†).27 An alternative method for calculating long spacings has been previously described by Acevedo (2018),17 where the d-spacing is calculated utilizing only the first small angle reflection (d001). The differences between calculation methods were found to be negligible for the systems reported here.2.11 CNP thickness and micro-strain determination
The average crystallite size (DSchr) was calculated from the SAXS profiles. For this, three alternate methods were utilized. First, the well-known Scherrer equation was used (eqn (2)), | (2) |
Alternatively, the first-order SAXS peak (001) was utilized to obtain crystallite thickness distribution, following the procedure described by Rondou et al.29–31 with some minor modifications (Appendix 4, ESI†). From the distribution, the corresponding volume weighted average crystallite size was also calculated.
Finally, a Williamson–Hall plot was utilized for determining the impact of microstrain (noted as ε) and crystallite size (noted as DWH). For this, eqn (3) was utilized.
 | (3) |
![[thin space (1/6-em)]](https://www.rsc.org/images/entities/char_2009.gif) cos(θhkl) of all recorded SAXS peaks (001, 002, 003), ε and D were calculated (Appendix 5, ESI†). Instrumental peak broadening was calculated, and the resulting differences were found to be negligible (Appendix 6, ESI†).
cos(θhkl) of all recorded SAXS peaks (001, 002, 003), ε and D were calculated (Appendix 5, ESI†). Instrumental peak broadening was calculated, and the resulting differences were found to be negligible (Appendix 6, ESI†).
2.12 Area per chain determination
The area per chain can be calculated differently depending on the polymorphic form. Each polymorphic form has a different unit cell arrangement; consequently, the calculation method for the area per chain is different. Whenever a beta polymorphic form is identified, the area per chain can be calculated following the methods described by Tenorio-Garcia et al.32 (Appendix 2, ESI†).3. Results
3.1 Microscopy results
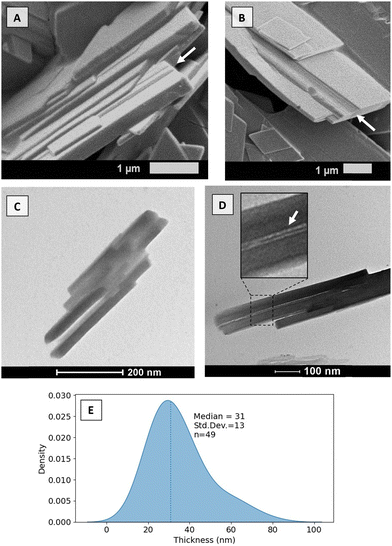
Given the hierarchical nature of fats, a comprehensive imaging strategy is necessary to capture the diverse length scales encompassed. Here, we combine cryogenic scanning electron microscopy (cryo-SEM), transmission electron microscopy (TEM), polarized light microscopy (PLM) and phase contrast microscopy (PCM).To begin with, cryo-SEM and TEM were employed to visualize the lamellae structures (Fig. 2). From the microscopy results, it was possible to corroborate the lamellar stacking (white arrows) for a slow-cooled and fast-cooled 30% SSS dilution in OOO. Although measuring the lamellae through microscopy remains impossible at the given scale, the length scale seems to correspond to the expected order of magnitude (of around 4.5 nm – see 3.2 X-ray scattering results). As seen in Fig. 2C and D, upon stacking, the lamellae formed a secondary domain size, here called CNPs. The thickness of such a structure was measured via the TEM microscopies (n = 49), and the resulting kernel density estimators are presented in Fig. 2E. The median thickness was found to be around 31 nm for the 30% SSS cooled at 10 °C min−1 to 15 °C.
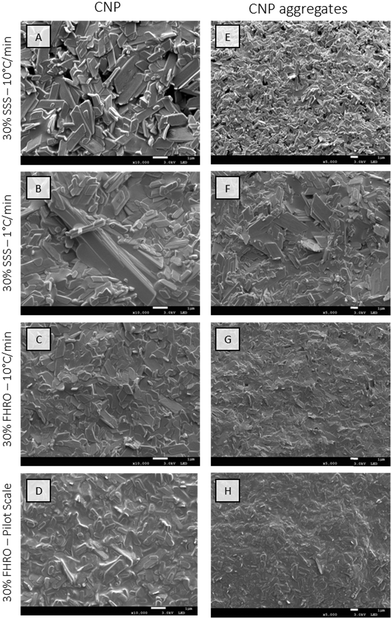
Furthermore, cryo-SEM was used to elucidate the morphology of the CNPs and their aggregation behaviour. For this, two different magnification levels were used (Fig. 3). A higher magnification was utilized to visualize the smallest building blocks (Fig. 3A–D). These are visualized as platelets with relatively smooth surfaces and are assumed to be the previously reported CNPs. These results align, in terms of conformation, with the TEM microscopy results presented by Acevedo for SSS systems.2 The primary units are, therefore, identified as platelet-like structures characterized by length, width and thickness. When comparing the results in terms of shape and homogeneity, three main conclusions can be made. First, pure systems, composed of SSS, display bigger platelets with more consistent shapes when compared to their commercial counterparts (FHRO systems). Second, shear crystallization modifies the general platelet configuration, as corners seem to be eroded by shear crystallization. Third, slow cooled systems seem to have a high size polydispersity, as CNPs formed vary broadly in size.
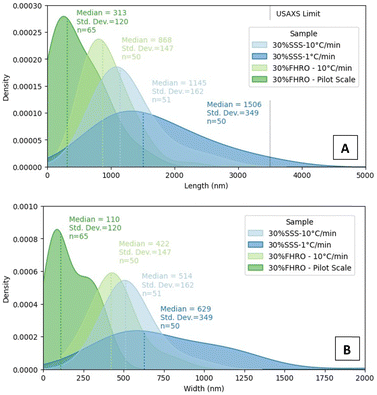
Interestingly, regardless of the size differences, all measured samples seemed to keep a quasi-constant aspect ratio (as presented in Appendix 7 (ESI†), through similar regression slopes). Lower magnifications were also utilized to visualize the population behaviour of the CNPs (Fig. 3E–H), as aggregates are probably destroyed during the deoiling procedure. In all cases, CNPs are represented in a disordered manner. The acquired images served as crucial inputs for quantifying their dimensions, specifically the width and length, as presented in the kernel density estimators in Fig. 4. The size of CNPs follows the order 30% FHRO-pilot scale < 30% FHRO – 10 °C min−1 < 30% SSS – 10 °C min−1 < 30% SSS – 1 °C min−1. The reader must interpret these results comparatively and within their length scale, rather than their absolute value, as measurement of cryo-SEM images can be subject to depth artifacts (due to the limited imaging depth). In addition, results are based on a limited number of platelets (n > 50).
Unsurprisingly, the size of the CNPs depends highly on the processing conditions, as fast-cooled systems appear to be smaller than the slow-cooled ones. This result is expected, as Acevedo et al. had previously reported that, for a 50% FHCO in HOSO, fast cooling led to smaller platelet dimensions than slow cooling.6 Later studies also confirmed the findings, as slow cooling created longer and wider CNPs at several different concentration levels.33,34 In addition, the application of shear resulted in smaller CNPs, with a homogeneous size distribution. These results also align with the work of Acevedo, where shear decreased the CNP length and width. The output is explained as shear enhances nucleation kinetics and mass and heat transfer in the melt.33 Although the trend remained consistent, the overall size range of the SSS system seemed to differ from the previous literature, as bigger values were found in this study.2 Differences were attributed to modifications in the deoiling procedure, as in this study, no shear or sonication was applied to the sample before measurement.
In the microscopic range, fat systems showed a clear tendency to form clusters. The floc formation was studied utilizing both PCM and PLM. Fig. 5 reveals pronounced differences in the microstructural features. The discrepancies between the four treatments become markedly noticeable when examined under a PCM, where the contrasting sizes and arrangements of the microstructures are more vividly apparent. FHRO formed the smallest flocs. Specifically, the pilot scale sample depicts the smaller units, followed by the fast cooled treatment. In contrast, 30% SSS forms expansive spherulites, and the slow cooled sample is characterized by larger and more open structures.
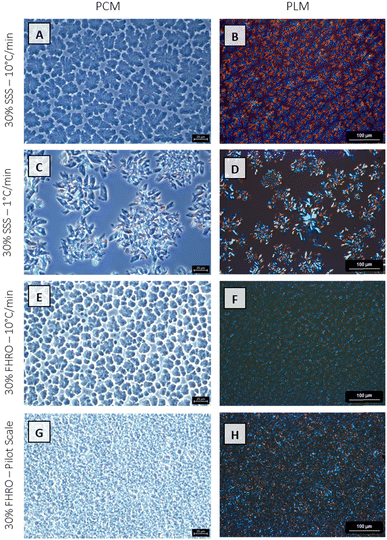 | ||
| Fig. 5 Phase contrast microscopy (PCM) and polarized light microscopy (PLM) images of the four different stearic acid samples. | ||
3.2 X-ray scattering results
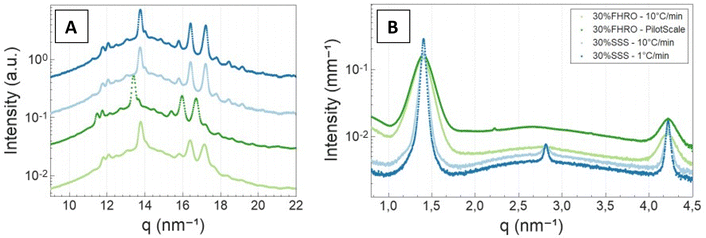 | ||
| Fig. 6 Wide angle X-ray scattering (A) and small angle X-ray scattering (B) results. A vertical shift (factor of 5) was performed in (A) for better visualization. | ||
| Sample | 30% SSS | 30% FHRO | ||||||
|---|---|---|---|---|---|---|---|---|
| Cooling rate | 10 °C min−1 | 1 °C min−1 | 10 °C min−1 | Pilot scale | ||||
| Short spacing | q (nm−1) | d (nm) | q (nm−1) | d (nm) | q (nm−1) | d (nm) | q (nm−1) | d (nm) |
| d 10 | 17.20 | 0.37 | 17.20 | 0.37 | 17.14 | 0.37 | 16.70 | 0.38 |
| d −11 | 16.41 | 0.38 | 16.41 | 0.38 | 16.39 | 0.38 | 15.96 | 0.39 |
| d 01 | 13.75 | 0.46 | 13.76 | 0.46 | 13.78 | 0.46 | 13.40 | 0.47 |
| Identified polymorph | β | β | β | β | ||||
| Area per chain (nm2) | 0.1876 | 0.1875 | 0.1877 | 0.1981 | ||||
| Sample | 30% SSS | 30% FHRO | ||||||||||||||
|---|---|---|---|---|---|---|---|---|---|---|---|---|---|---|---|---|
| Cooling rate | 10 °C min−1 | 1 °C min−1 | 10 °C min−1 | Pilot scale | ||||||||||||
| Miller index | q (nm−1) | d (nm−1) | FWHM (nm−1) | q (nm−1) | d (nm−1) | FWHM (nm−1) | q (nm−1) | d (nm−1) | FWHM (nm−1) | q (nm−1) | d (nm−1) | FWHM (nm−1) | ||||
| 001 | 1.40 | 4.48 | 0.06 | 1.39 | 4.47 | 0.04 | 1.39 | 4.52 | 0.14 | 1.40 | 4.49 | 0.16 | ||||
| 002 | 2.81 | 2.23 | 0.08 | 2.81 | 2.23 | 0.04 | 2.78 | 2.26 | 0.18 | 2.69 | 2.34 | 0.25 | ||||
| 003 | 4.22 | 1.49 | 0.06 | 4.22 | 1.49 | 0.04 | 4.21 | 1.49 | 0.15 | 4.22 | 1.49 | 0.15 | ||||
| Domain size (nm) | 4.47 | 4.47 | 4.48 | 4.51 | ||||||||||||
| Identified stacking | 2L(β) | 2L(β) | 2L(β) | 2L(β) | ||||||||||||
| CNP thickness (nm) – Scherrer | 92.8 | 151.1 | 39.02 | 36.36 | ||||||||||||
| CNP thickness (nm) – BWA | 59.8 | 71.7 | 28.78 | 25.9 | ||||||||||||
| CNP thickness (nm) – WH plot | 86.3 | 152.5 | 36.75 | 28.93 | ||||||||||||
| Microstrain (%) – WH plot | 4.90 × 10⁻⁴ | 5.60 × 10⁻⁴ | 1.00 × 10⁻³ | 2.30 × 10⁻³ | ||||||||||||
Additionally, the slow-cooled stearic acid sample was characterized by a thinner peak (1 °C min−1) and higher intensity than the fast-cooled one (10 °C min−1). This result is indicative of larger crystallite sizes as FWHM is inversely proportional to the crystallite magnitude (eqn (2)). Employing the Scherrer equation, the average crystallite size for all triglyceride samples was calculated (Table 2). Notably, the slow-cooled 30% SSS sample exhibited the largest crystallite thickness at 151.1 nm, followed by the fast-cooled 30% SSS sample at 92.8 nm. The FHRO samples followed in close proximity, measuring 39.02 nm when statically cooled at 10 °C min−1 and 36.36 nm when crystallized in a SSHE. The corresponding CNP thickness distributions are available in Fig. 7. In the case of the FHRO, some compositional broadening can be expected, as the recorded profile can be the summation of various closely distributed d-spacings.
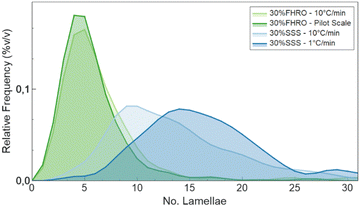 | ||
| Fig. 7 CNP thickness distribution obtained following the BWA method.29–31 | ||
A Williamson–Hall plot was employed to discern the crystalline microstrain, revealing significantly lower levels of strain when compared to the previous literature on fat systems (our results always fall below 1 × 10⁻³) (Table 2).42 Thus, both the Scherrer equation and the W–H plot yielded similar crystallite size results. The average crystallite size for all 30% fat dispersions seemed to follow the sequence 30% SSS – 1 °C min−1 > 30% SSS – 10 °C min−1 > 30% FHRO – 10 °C min−1 > 30% FHRO – pilot scale.
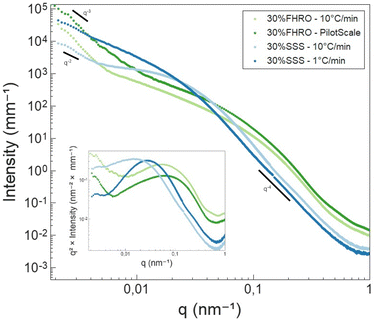
In the high q-region, all scattering curves decayed in intensity with a power-law close to q−4. Local slopes indicate characteristics of the surface roughness/compactness of a specific structural level.21 A slope of 4 suggests that the CNPs formed have well-defined interfaces and are compact objects with sharp interfaces.21 In the context of fat systems, previous interpretations are linked to surface roughness, where a slope of 4 is interpreted as a smooth surface.43
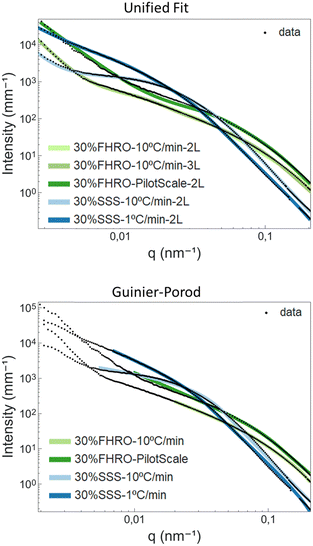
As the q-value decreases (q < 0.05 nm−1), a notable feature in the curves emerges in the form of a distinct Guinier bend. These knees exhibit variability across the different samples, providing a clear indication of differences in conformation within the examined systems. This result suggests that the mesoscale is modified both by TAG purity and processing conditions. The same data are presented in the inset of Fig. 8 through a Kratky representation (q2I(q) vs. q), which allows a better visualization of the bend. In fact, in this representation, the Guinier inflection appears as a peak, which can assist in interpreting the CNP conformation. The location of the peak provides information on the size of the cross-section. From Fig. 8, we can infer that the CNPs of the two FHRO samples have smaller cross-sections, followed by the 30% SSS – 10 °C min−1 and ultimately the 30% SSS – 1 °C min−1.
Fig. 8 also reveals that, for the FHRO samples and the fast cooled 30% SSS sample, a secondary slope is visible in the lowest q-range. This additional slope suggests a secondary aggregation level and the difference between slopes in this region suggests changes in the aggregation behaviour between samples. This range will be interpreted through fractal dimensionality. For the slow cooled 30% SSS sample, this feature is not fully resolved in the available q-range, suggesting that the crystallites aggregate at higher dimensions than 3.5 μm (the detection limit of USAXS). This result aligns with the findings presented in the microscopy section, as some of the CNPs are found to be out of the 3.5 μm range.
As highlighted in the Introduction section, exploring the USAXS range in triglycerides is particularly intriguing due to its capacity to disclose essential details about CNPs and CNP aggregates. The scattering profile in this context exhibits numerous degrees of freedom (CNP shape, CNP size, CNP aggregation, fractality, polydispersity, etc.). However, a substantial amount of structural information is lost upon transforming from the real space (d) into the reciprocal space (q). As the USAXS range does not present sharp characteristic feats (e.g., peaks), it is necessary to utilize models to retrieve information from this area.
Table 3 presents the results for the unified fit and Guinier-Prod models. SasView 5.0.444 was used as a fitting software. The corresponding fits are available in Fig. 9. Further information on the models can be found in Appendix 8 (ESI†). In the case of the 30% FHRO – 10 °C min−1, two different unified fits were performed, one assuming 2 levels of aggregation and one assuming 3 levels.
| Sample | Scattering unit | Parameter | Levels | 30% SSS | 30% FHRO | |||
|---|---|---|---|---|---|---|---|---|
| Cooling rate | 10 °C min−1 | 1 °C min−1 | 10 °C min−1 | Pilot scale | ||||
| Unified fit | 2 | 2 | 2 | 3 | 2 | |||
| CNP | R gCNP | nm | 77.06 | 134.17 | 100.16 | 42.24 | 33.31 | |
| R CNP | nm | 99.48 | 173.21 | 129.31 | 54.53 | 43 | ||
| P CNP | — | 4.2 | 3.83 | 2.26 | 3.44 | 3.9 | ||
| D fCNP | — | 4.2 | 2.17 | 2.26 | 2.56 | 2.1 | ||
| Fractal | Diffuse | Surface | Mass | Surface | Surface | |||
| q-min | 0.0054 | 0.007 | 0.02 | 0.05 | 0.01 | |||
| q-max | 0.2 | 0.2 | 0.2 | 0.4 | 0.2 | |||
| Intermediate level | R gINT | nm | — | — | — | 119.97 | — | |
| R INT | nm | — | — | — | 154.88 | — | ||
| P INT | — | — | — | — | 1.11 | — | ||
| D fINT | — | — | — | — | 154.88 | — | ||
| Fractal | — | — | — | — | Mass | — | ||
| q-min | — | — | — | — | 0.008 | — | ||
| q-max | — | — | — | — | 0.025 | — | ||
| CNP aggregates | P Agg | — | 4.12 | 2.19 | 3.9 | 3.91 | 2.85 | |
| D fAgg | — | >4 | 2.19 | 2.1 | 2.09 | 2.85 | ||
| Fractal | Diffuse | Mass | Surface | Surface | Mass | |||
| q-min | 0.0021 | 0.0021 | 0.0021 | 0.0021 | 0.0028 | |||
| q-max | 0.004 | 0.006 | 0.004 | 0.004 | 0.004 | |||
| Guinier–Porod | CNP | s | — | 0.62 | 1.62 | 1.44 | 1.6 | |
From the unified fit model, we can recognize two parameters associated with the CNP size, namely RgCNP and RCNP. RCNP is calculated based on RgCNP, following the assumption of monodisperse spherical scatterers (eqn (A7), ESI†). Table 3 confirms that the smaller CNPs are obtained for the 30% FHRO – pilot scale, while the biggest CNPs are reported for the slow cooled 30% SSS dispersion. Interestingly, whenever 2 levels were used for the fit, the 30% SSS crystallized at 10 °C min−1 exhibits smaller CNPs than the fast-cooled 30% FHRO. These results are not in line with the order suggested in the microscopy findings, as well as the initial Kratky plot interpretation. Conversely, whenever 3 levels are assumed, the order of magnitude is respected, as the fast cooled 30% FHRO sample has smaller CNPs than its pure counterpart.
Regarding fractal dimensionality, the factor P was utilized, following the interpretation suggested by Pink et al.18 Peyronel often reports a fixed slope of 4 (PCNP), which is interpreted as a smooth-surfaced scatterer.3 As seen in Table 3, PCNP, associated with the surface of the CNPs, was close to 4 for most samples (suggesting sharp interfaces and smooth surfaces). These findings align with those of Peyronel for similar systems,43 as well as the neat surfaces visualized through a cryo-SEM (see Section 3.1 – Microscopy results). However, the result obtained for the 30% FHRO – 10 °C min−1 whenever two levels were assumed did not seem to follow the norm, as the fit yielded a PCNP value of 2.26. This slope would be traditionally interpreted as mass fractal, indicative of density fluctuations21 and a loose conformation. This result is not in accordance with the cryo-SEM images (Fig. 3) nor portrays the expected surface configuration for highly homogeneous FHRO CNPs. In contrast, whenever 3 levels were utilized for the fit, the surface roughness of the CNPs seems to have an appropriate magnitude of 3.4, indicative of a surface fractal.
At this point, a critical discussion concerning the selection of levels in the unified fit is imperative. In fact, based on the microscopy results, there are no indications of the existence of an intermediate aggregation level at a nanometre scale (as suggested by the RINT of 154 nm in the 3 level fit), and therefore, phenomenologically speaking, a two level model should be the most appropriate. However, whenever the transition between two levels covers a broad q-range, the model requires the addition of the “artificial” level in order to deliver phenomenologically sound outputs (e.g. appropriate RCNP and PCNP).
In addition, a noteworthy aspect of concern in the unified fit relates to the reported practice of adjusting the number of levels in the model based on the fit quality.45 Although seemingly pragmatic for enhancing fit performance, this practice raises questions about the physical validity of the added levels. In other words, by adding an additional aggregation level, there is a risk that, in pursuit of achieving an optimal fit, the inclusion of additional aggregation levels might be driven more by the exigencies of the fitting process rather than by a grounded physical justification of the existence of a specific aggregation level. When interpreting scattering data, it is essential to have alternative techniques to support the hypothesis of additional aggregation levels (e.g., TAG woods).
3.3 Proposed model
Based on the previous discussion, it seems imperative to generate a shape-dependent model that can better represent the morphology of CNPs and their aggregation behaviour. Eqn (4) presents the simplest model to describe scattering data.| I(q) = K·〈P(q)〉·〈S(q)〉 | (4) |
| K = VP·ϕV·(Δρ)2 | (5) |
The chemical formula and mass density were used to calculate the scattering length density (ρ) of SSS and OOO utilizing the SasView SLD Calculator.44 Given that that the main triglyceride in all cases is SSS and that all profiles analysed are in the β form, the density of SSS in the β phase was used for calculating the ρ of the solid TAGs (mass density = 1.03 g cm−3).10 The solvent was assumed to be mostly composed of triolein, and therefore, the scattering length density of triolein was utilized (mass density = 0.915 g cm−3).46 The resulting ρ was found to be 9.82 × 10⁻⁶ Å−2 for SSS and 8.67 × 10⁻⁶ Å−2 for OOO. The model here proposed accounts only for the solid contributions. In fact, as experimentally observed, the scattering from the liquid oil fraction remains always below the scattering of the solid fat (Appendix 9, ESI†).
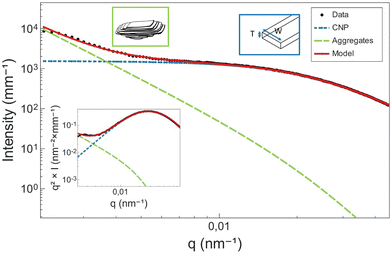
The orientation- and size-averaged form factor of the particles was calculated following a parallelepiped model47,48 and implemented in SasView.44 As a result, in the USAXS scattering data, the shoulder appearing between 0.005 and 0.3 nm−1 is attributed to the cross-section of the CNPs (Fig. 10). Differently sized CNPs result then in shoulders placed in different q-ranges. As the peak in the Kratky plot is shifted to lower q, an increase in the cross-section of CNPs is suggested.
In order to better understand what information in the model is relevant, a simple sensitivity analysis was conducted (see Appendix 10, ESI†). Here, variations in the parallelepiped dimensions, including thickness, width and length, were systematically studied, and the outcome model was plotted. The intention behind this analysis was to identify which factors modify features in the intermediate bend. In principle, only the factors that have an impact on the knee should be taken into account. Notably, variations in thickness and width had a discernible impact on the modelling of the Guinier bend. Conversely, changes in length predominantly affected the low q part of the curve. This region, as mentioned before, is heavily influenced by the scattering of CNP aggregates, and therefore, it is not advised to conclude in terms of length. In this study, we limit the interpretation of the model to the cross-section of the CNPs (thickness and width).
In the low q-region, whenever a protruding slope is visible (attributed to the aggregation of CNP domains), the structure factor can be modelled using a power-law dependence, assuming the formation of fractal aggregates. The structure factor is defined in eqn (6).
 | (6) |
 | (7) |
It remains relevant to disclose that the model described here was inspired by similar models existing in the literature. Patil et al.19 used a comparable approximation to extract structural parameters from SAXS data on organic thin films (poly(3-hexylthiopene)) for solar cell applications. Their scattering results, similar to those reported here for fats, include three areas, including (1) a Braggs reflection in a high q-region, (2) a broad shoulder in intermediate q-ranges and (3) a power law at low q. Similar to triglycerides, the Braggs reflection was linked to lamellar stacking and the power law was attributed to bigger amorphous domains. The intermediate and low-q domains were modelled with a combination of a cylinder form factor and a Debye–Bueche structure–function. There, the shoulder was attributed to the cross-section of the polydisperse cylinders (primary scattering units), whereas the signal from the amorphous network was also parametrized utilizing fractal dimensionality.19 In addition, a secondary inspirational model was presented by Newbloom et al. In their work, also linked to organic photovoltaics, poly(3-hexylthiopene)s,47 and poly(3-alkylthophene)s,49 scattering results were modelled by combining a parallelepiped model (to model the polymer rectangular cross-section) and a power law to determine the fractal dimension of bigger aggregates. Again, the scattering profiles were found to be very similar to those of triglyceride systems.
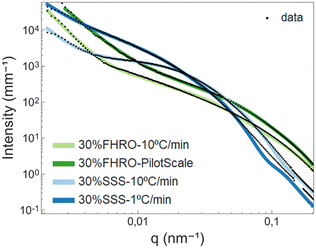 | ||
| Fig. 11 Proposed model curve fitting results. In black, the fitted data and in coloured lines, the resulting fits. | ||
| Sample | 30% SSS | 30% FHRO | ||||
|---|---|---|---|---|---|---|
| Cooling rate | 10 °C min−1 | 1 °C min−1 | 10 °C min−1 | Pilot scale | ||
| CNP | Thickness | nm | 41 | 57 | 12 | 15 |
| Width | nm | 96 | 192 | 68 | 47 | |
| Polydispersity | — | 0.3 | 0.3 | 0.3 | 0.3 | |
| Cross section | nm2 | 3892 | 10![[thin space (1/6-em)]](https://www.rsc.org/images/entities/char_2009.gif) 938 938 |
836 | 718 | |
| No. lamellae | — | 10 | 13 | 3 | 4 | |
| T/W ratio | — | 0.4 | 0.3 | 0.2 | 0.3 | |
| CNP aggregates | P | — | 3.3 | 2.72 | 3.8 | 2.42 |
| D f | — | 2.7 | 2.7 | 2.2 | 2.4 | |
| Fractal | — | Surface | Mass | Surface | Mass | |
In terms of CNP thickness, when comparing the model results to the TEM data (for the 30% SSS – 10 °C min−1) (Fig. 2), we can conclude that the results are in sensible agreement, as TEM microscopy suggest a thickness of 31 nm (equivalent to around 7 lamellae), while the model output was 41 nm (about 10 lamellae). This deviation is considered acceptable, as the overall order of magnitude is well represented by the results. Moreover, the output is in agreement with the order obtained in the SAXS results. Particularly interesting is the alignment between the crystallite thickness distribution obtained via de the BWA approximation (see Fig. 7) and the model results. In fact, the peak of each of the distributions is notably close to the obtained thickness, suggesting a good method cross-validation.
At this point, a discussion concerning the limitations of the Scherrer equation is necessary. Whenever the crystallite size exceeds a certain threshold, typically within the range of 100–200 nm, peaks become too narrow, and inevitably, the Scherrer equation is subject to big errors.17 The sizes reported here for the 30% SSS – 1 °C min−1 are within this range, and therefore, results are within the limits of the method. Moreover, distortions in crystal packing or instrumental broadening can further contribute to inaccuracies in size characterization utilizing the Scherrer equation. The model proposed herein bypasses the constraints of the Scherrer equation, offering an alternative method for quantifying CNP thickness in a different q-range.
As seen in Table 4, while the CNP thickness seems to be dominated by the purity of the triglyceride, the width is clearly influenced by the processing conditions. In fact, the slow-cooled 30% SSS system exhibited wider platelets than the fast-cooled equivalent. This result confirms the generalized findings of Acevedo et al., suggesting that slow-cooled samples form wider CNPs.33,34 In addition, it was also possible to confirm that shear crystallization reduced platelet width significantly,33 although the same finding could not be corroborated for thickness.
While the general conclusions remain valid, there are some deviations in the absolute width values. In fact, modelled values appear to be smaller than those measured in the microscopy section. In this case, the USAXS results are deemed more reliable, as cryo-SEM results are bound to have diverse sources of errors. In fact, unlike TEM, cryo-SEM is better suited for surface characterization rather than cross-section measurements, and therefore depth artifacts need to be considered when performing the measurements. In addition, cryo-SEM measurements are limited to a subset of platelets, which restricts the analysis to a small subgroup of nanostructured elements (n ≈ 50). Finally, cryo-SEM results are subject to extensive sample handling, including deoiling, which can have important consequences in sample dissolution and re-crystallization in the solvent.
In the lower section of Table 4, data concerning the aggregation behaviour are presented. The interpretation remains consistent with that provided in the unified fit section. For both rapidly cooled systems, 30% SSS and 30% FHRO, P lies between 3 and 4, indicating tight CNP packing and surface fractality. In contrast, slow-cooled 30% SSS and 30% FHRO pilot scale samples exhibited fractal dimensions ranging from 2.4 to 2.7, indicative of mass fractals, suggesting looser conformations.
4. Conclusions
In this study, for the first time, a shape-dependent model to interpret triglyceride USAXS data was proposed. The model, covering two orders of magnitude, describes the CNPs as polydisperse parallelepipeds, while describing the crystallites (CNP aggregates) through fractal dimensionality. The fit yields information on the cross-section of the CNPs, providing an alternative to the Scherrer equation for thickness calculation. In addition, the proposed model bypasses some of the limitations associated with the unified fit model, as it accounts for the morphological features of the primary scattering unit and removes the need to add an artificial level whenever the transition between two levels covers a broad q-range.To validate the proposed model, four stearic acid based samples crystallized through different protocols were characterized. The average CNP size for all 30% fat dispersions seemed to follow the sequence (from smaller to bigger): 30% FHRO – pilot scale, 30% FHRO – 10 °C min−1, 30% SSS – 10 °C min−1, and finally 30% SSS – 1 °C min−1. These results were consistent across different methods (X-ray scattering and microscopy) and models (unified fit and proposed models) utilized. We anticipate that the implementation of this model will significantly enhance our capacity to characterize CNPs, thereby advancing our understanding of the mesoscale dynamics dominating triglyceride systems.
Author contributions
Conceptualization: I. A. P., T. R., K. D., F. V. B.; data curation: I. A. P., W. C.; formal analysis: I. A. P., F. V. B.; funding acquisition: I. A. P., K. D., F. V. B.; investigation: I. A. P., F. D. W., T. R., W. C.; methodology: I. A. P., F. D. W., T. R., W. C., I. P., F. V. B.; project administration: K. D., F. V. B.; resources: K. D., F. V. B.; software: I. A. P., F. D. W.; supervision: T. R., K. D., F. V. B.; visualization: I. A. P., I. P.; writing – original draft: I. A. P.; and writing – reviewing and editing: F. D. W., T. R., W. C., I. P., K. D., F. V. B.Data availability statement
Following the ESRF data policy, the raw XRS data are made openly accessible to the public via 10.15151/ESRF-DC-1543611960. Any additional data that substantiate the outcomes of this research are publicly and openly available in Zenodo at 10.5281/zenodo.10693917.Conflicts of interest
The authors declare no conflict of interest. The funders had no role in the design of the study, in the collection, analyses, or interpretation of data, in the writing of the manuscript, or in the decision to publish the results.Acknowledgements
The Research Foundation—Flanders (FWO) is acknowledged for providing the grants 1SA5321N in support of the PhD candidate Ivana A. Penagos and 1128923N in support of the PhD candidate Fien De Witte. The European Synchrotron Radiation Facility (ESRF) was recognized for providing financial support for the synchrotron-assisted XRS experiments in the beamline ID-02 (proposal numbers ME-1606, ME-1607 and ME-1642). The Hercules foundation is recognized for its financial support for the SEM JEOL JSM-7100F equipped with the cryogenic transfer system Quorum PP3000T (grant number FWO Hercules AUGE-09-029) and the XRS Xenocs Xeuss 3.0 (grant number FWO Hercules AUGE-17-029). The transmission electron microscope, Tecnai Spirit G2 Biotwin (AUHA-08-004), was funded by a medium-scale research infrastructure grant of the FWO. Vandemoortele Lipids NV is acknowledged for financially supporting the UGent Vandemoortele Centre on ‘Lipid Science and Technology’ and for providing access to their pilot scale and microscopy facility. This work benefited from the use of the SasView application, originally developed under the NSF award DMR-0520547. SasView contains the code developed with funding from the European Union's Horizon 2020 research and innovation programme under the SINE2020 project, grant agreement no. 654000. Dr Theyencheri Narayanan is thanked for the interesting discussions and relevant input, key for the production of this work. Benny Lewille, Kato Rondou, Nathaniel J. Hendrik and Griet Spaepen are thanked for their continuous support in conducting the Synchrotron experiments. Margot Dombrecht is acknowledged for the help during TEM visualization. Juan Sebastian Murillo Moreno is thanked for the help in the pilot scale trials and Joost Coudron is acknowledged for his help with phase contrast microscopy. This research reflects the views of the authors only, and hence, none of the above parties should be held responsible for the information contained here.References
- K. Mishra, N. Kummer, J. Bergfreund, F. Kampf, P. Bertsch, R. Pauer, G. Nystrom, P. Fischer and E. J. Windhab, Controlling lipid crystallization across multiple length scales by directed shear flow, J. Colloid Interface Sci., 2023, 630(Pt A), 731–741 CrossRef CAS PubMed.
- N. C. Acevedo and A. G. Marangoni, Characterization of the Nanoscale in Triacylglycerol Crystal Networks, Cryst. Growth Des., 2010, 10(8), 3327–3333 CrossRef CAS.
- F. Peyronel, J. Ilavsky, G. Mazzanti, A. G. Marangoni and D. A. Pink, Edible oil structures at low and intermediate concentrations. II. Ultra-small angle X-ray scattering of in situ tristearin solids in triolein, J. Appl. Phys., 2013, 114(23), 234902 CrossRef.
- F. Peyronel, N. C. Acevedo, D. A. Pink and A. G. Marangoni, Supramolecular Assembly of Fat Crystal Networks from the Nanoscale to the Mesoscale, Crystallization of Lipids: Fundamentals and Applications in Food, Cosmetics, and Pharmaceuticals, 2018, 143–181 Search PubMed.
- P. R. R. Ramel Jr, F. Peyronel and A. G. Marangoni, Characterization of the nanoscale structure of milk fat, Food Chem., 2016, 203, 224–230 CrossRef PubMed.
- N. C. Acevedo, F. Peyronel and A. G. Marangoni, Nanoscale structure intercrystalline interactions in fat crystal networks, Curr. Opin. Colloid Interface Sci., 2011, 16(5), 374–383 CrossRef CAS.
- F. Maleky, A. K. Smith and A. Marangoni, Laminar shear effects on crystalline alignments and nanostructure of a triacylglycerol crystal network, Cryst. Growth Des., 2011, 11(6), 2335–2345 CrossRef CAS.
- N. C. Acevedo, J. M. Block and A. G. Marangoni, Critical laminar shear-temperature effects on the nano-and mesoscale structure of a model fat and its relationship to oil binding and rheological properties, Faraday Discuss., 2012, 158(1), 171–194 RSC.
- F. Peyronel, B. Quinn, A. G. Marangoni and D. A. Pink, Ultra Small Angle X-Ray Scattering for Pure Tristearin and Tripalmitin: Model Predictions and Experimental Results, Food Biophys., 2014, 9(4), 304–313 CrossRef.
- A. Van Langevelde, K. Van Malssen, F. Hollander, R. Peschar and H. Schenk, Structure of mono-acid even-numbered β-triacylglycerols, Acta Crystallogr., Sect. B: Struct. Sci., 1999, 55(1), 114–122 CrossRef CAS PubMed.
- J. B. van Mechelen, R. Peschar and H. Schenk, Structures of mono-unsaturated triacylglycerols. I. The β1 polymorph, Acta Crystallogr., Sect. B: Struct. Sci., 2006, 62(6), 1121–1130 CrossRef CAS PubMed.
- L. Jensen and A. Mabis, Crystal structure of β-tricaprin, Nature, 1963, 197(4868), 681–682 CrossRef CAS.
- A. G. Marangoni, N. Acevedo, F. Maleky, E. Co, F. Peyronel, G. Mazzanti, B. Quinn and D. Pink, Structure and functionality of edible fats, Soft Matter, 2012, 8(5), 1275–1300 RSC.
- D. M. Small, Lateral chain packing in lipids and membranes, J. Lipid Res., 1984, 25(13), 1490–1500 CrossRef CAS.
- M. Van den Tempel, Mechanical properties of plastic-disperse systems at very small deformations, J. Colloid Sci., 1961, 16(3), 284–296 CrossRef CAS.
- C. J. Nederveen, Dynamic mechanical behavior of suspensions of fat particles in oil, J. Colloid Sci., 1963, 18(3), 276–291 CrossRef CAS.
- N. C. Acevedo Characterization of the Nanostructure of Triacylglycerol Crystal Networks, Structure-Function Analysis of Edible Fats, 2018, pp. 1–19 Search PubMed.
- D. A. Pink, B. Quinn, F. Peyronel and A. G. Marangoni, Edible oil structures at low and intermediate concentrations. I. Modeling, computer simulation, and predictions for X ray scattering, J. Appl. Phys., 2013, 114(23), 234901 CrossRef.
- N. Patil, T. Narayanan, L. Michels, E. T. B. Skjønsfjell, M. Guizar-Sicairos, N. Van den Brande, R. Claessens, B. Van Mele and D. W. Breiby, Probing Organic Thin Films by Coherent X-ray Imaging and X-ray Scattering, ACS Appl. Polym. Mater., 2019, 1(7), 1787–1797 CrossRef CAS.
- T. Narayanan, W. Chèvremont and T. Zinn, Small-angle X-ray scattering in the era of fourth-generation light sources, J. Appl. Crystallogr., 2023, 56, 939–946 CrossRef CAS PubMed.
- T. Narayanan, Small-Angle Scattering, Structure from Diffraction Methods, 2014, pp. 259–324 Search PubMed.
- G. Beaucage, Approximations leading to a unified exponential power-law approach to small-angle scattering, J. Appl. Crystallogr., 1995, 28, 717–728 CrossRef CAS.
- B. Hammouda, A new Guinier–Porod model, J. Appl. Crystallogr., 2010, 43(4), 716–719 CrossRef CAS.
- I. A. Penagos, J. S. Murillo Moreno, K. Dewettinck and F. Van Bockstaele, Carnauba Wax and Beeswax as Structuring Agents for Water-in-Oleogel Emulsions without Added Emulsifiers, Foods, 2023, 12(9), 1850 CrossRef PubMed.
- M. A. Rogers, A. K. Smith, A. J. Wright and A. G. Marangoni, A Novel Cryo-SEM Technique for Imaging Vegetable Oil Based Organogels, J. Am. Oil Chem. Soc., 2007, 84(10), 899–906 CrossRef CAS.
- T. Narayanan, M. Sztucki, P. Van Vaerenbergh, J. Leonardon, J. Gorini, L. Claustre, F. Sever, J. Morse and P. Boesecke, A multipurpose instrument for time-resolved ultra-small-angle and coherent X-ray scattering, J. Appl. Crystallogr., 2018, 51(Pt 6), 1511–1524 CrossRef CAS PubMed.
- Y. Pratama, S. Burholt, D. L. Baker, A. Sadeghpour, E. Simone and M. Rappolt, Polymorphism of a Highly Asymmetrical Triacylglycerol in Milk Fat: 1-Butyryl 2-Stearoyl 3-Palmitoyl-glycerol, Cryst. Growth Des., 2022, 22(10), 6120–6130 CrossRef CAS PubMed.
- J. I. Langford and A. J. C. Wilson, Scherrer after sixty years: A survey and some new results in the determination of crystallite size, J. Appl. Crystallogr., 1978, 11(2), 102–113 CrossRef CAS.
- K. Rondou, F. De Witte, T. Rimaux, W. Dewinter, K. Dewettinck, J. Verwaeren and F. Van Bockstaele, Multiscale analysis of monoglyceride oleogels during storage, J. Am. Oil Chem. Soc., 2022, 99(11), 1019–1031 CrossRef CAS.
- R. den Adel, K. van Malssen, J. van Duynhoven, O. O. Mykhaylyk and A. Voda, Fat crystallite thickness distribution based on SAXD peak shape analysis, Eur. J. Lipid Sci. Technol., 2018, 120(9), 1800222 CrossRef.
- V. A. Drits, D. D. Eberl and J. Środoń, XRD Measurement of Mean Thickness, Thickness Distribution and Strain for Illite and Illite-Smectite Crystallites by the Bertaut-Warren-Averbach Technique, Clays Clay Miner., 1998, 46(1), 38–50 CrossRef CAS.
- E. Tenorio-Garcia, A. Araiza-Calahorra, M. Rappolt, E. Simone and A. Sarkar, Pickering Water-in-Oil Emulsions Stabilized Solely by Fat Crystals, Adv. Mater. Interfaces, 2023, 10(31), 107601 Search PubMed.
- N. C. Acevedo and A. G. Marangoni, Toward Nanoscale Engineering of Triacylglycerol Crystal Networks, Cryst. Growth Des., 2010, 10(8), 3334–3339 CrossRef CAS.
- F. Maleky, N. C. Acevedo and A. G. Marangoni, Cooling rate and dilution affect the nanostructure and microstructure differently in model fats, Eur. J. Lipid Sci. Technol., 2012, 114(7), 748–759 CrossRef CAS.
- M. Kellens, W. Meeussen, R. Gehrke and H. Reynaers, Synchrotron radiation investigations of the polymorphic transitions of saturated monoacid triglycerides. Part 1: Tripalmitin and tristearin, Chem. Phys. Lipids, 1991, 58(1), 131–144 CrossRef CAS.
- M. Kellens, W. Meeussen and H. Reynaers, Crystallization and phase transition studies of tripalmitin, Chem. Phys. Lipids, 1990, 55(2), 163–178 CrossRef CAS.
- M. Kellens, W. Meeussen, C. Riekel and H. Reynaers, Time resolved X-ray diffraction studies of the polymorphic behaviour of tripalmitin using synchrotron radiation, Chem. Phys. Lipids, 1990, 52(2), 79–98 CrossRef CAS.
- K. Sato, Polymorphic transformations in crystal growth, J. Phys. D: Appl. Phys., 1993, 26(8B), B77 CrossRef CAS.
- L. Pellegrino, G. Tyagi, E. S. J. Robles and J. T. Cabral, Phase behaviour of model triglyceride ternary blends: triolein, tripalmitin and tristearin, Phys. Chem. Chem. Phys., 2022, 24(48), 29413–29422 RSC.
- C. V. Kulkarni, W. Wachter, G. Iglesias-Salto, S. Engelskirchen and S. Ahualli, Monoolein: a magic lipid?, Phys. Chem. Chem. Phys., 2011, 13(8), 3004–3021 RSC.
- G. Mazzanti, M. Li, A. G. Marangoni and S. H. Idziak, Effects of shear rate variation on the nanostructure of crystallizing triglycerides, Cryst. Growth Des., 2011, 11(10), 4544–4550 CrossRef CAS.
- H. Koizumi, K. Kimura, M. Takagi, S. Michikawa, Y. Hirai, K. Sato and S. Ueno, Effect of accumulated strain on fat bloom in CBS-based compound chocolates, CrystEngComm, 2023, 25(32), 4562–4567 RSC.
- F. Peyronel and D. A. Pink, Ultra-Small Angle X-ray Scattering, Structure-Function Analysis of Edible Fats, 2018, pp. 267–285 Search PubMed.
- M. Doucet, J. H. Cho, G. Alina, Z. Attala, J. Bakker, W. Bouwman, P. Butler, K. Campbell, T. Cooper-Benun, C. Durniak, L. Forster, M. Gonzalez, R. Heenan, A. Jackson, S. King, P. Kienzle, J. Krzywon, R. Murphy, T. Nielsen, L. O'Driscoll, W. Potrzebowski, S. Prescott, R. Ferraz Leal, P. Ozyczko, T. Snow and A. Washington, SasView version 5.0.4. 5.0.4 ed., ed. W. Potrzebowski and A. Jackson, Zenodo, 2021 Search PubMed.
- F. Peyronel, Ultra Small Angle X-Ray Scattering Studies of Triacylglycerol Crystal Networks, University of Guelph, Guelph, Ontario, Canada, 2014 Search PubMed.
- M. J. O'Neil, The Merck index: an encyclopedia of chemicals, drugs, and biologicals, RSC Publishing, 2013 Search PubMed.
- G. M. Newbloom, F. S. Kim, S. A. Jenekhe and D. C. Pozzo, Mesoscale morphology and charge transport in colloidal networks of poly(3-hexylthiophene), Macromolecules, 2011, 44(10), 3801–3809 CrossRef CAS.
- R. Nayuk and K. Huber, Formfactors of Hollow and Massive Rectangular Parallelepipeds at Variable Degree of Anisometry, Zeitschrift für Physikalische Chemie, 2012, 226(7–8), 837–854 CrossRef CAS.
- G. M. Newbloom, P. de la Iglesia and L. D. Pozzo, Controlled gelation of poly(3-alkylthiophene) s in bulk and in thin-films using low volatility solvent/poor-solvent mixtures, Soft Matter, 2014, 10(44), 8945–8954 RSC.
Footnote |
| † Electronic supplementary information (ESI) available. See DOI: https://doi.org/10.1039/d4sm00259h |
| This journal is © The Royal Society of Chemistry 2024 |

