 Open Access Article
Aluminum zinc oxide nanostructures with customized size and shape by non-aqueous synthesis†
S.
Zellmer‡
,
A.
Kockmann‡
,
I.
Dosch
,
B.
Temel
and
G.
Garnweitner
*
Institute for Particle Technology and Laboratory for Emerging Nanometrology, Technische Universität Braunschweig, Volkmaroder Str. 5, 38104 Braunschweig, Germany. E-mail: g.garnweitner@tu-braunschweig.de
First published on 10th July 2015
Abstract
The non-aqueous sol–gel synthesis of aluminum zinc oxide (AZO) nanocrystals with controllable size and morphology at comparatively low temperatures is presented. By varying the reaction chemistry, customized aluminum zinc oxide nanorods and nanospheres with adjustable composition and tailored morphology between 0D and 1D were obtained. We furthermore show that the bandgap can be engineered by the Al content. Additionally, the growth kinetics and the influence of various process parameters such as the reaction temperature and precursor concentration as well as the scale-up from a 45 mL autoclave to a 500 mL reactor were investigated.
1. Introduction
Aluminum zinc oxide (AZO) as a transparent conductive material is considered a cheap alternative to indium tin oxide (ITO) due to its similar optical and electrical properties.1–6 Besides its high transparency in the visible region, the n-type semiconductor aluminum zinc oxide offers low resistivity and good stability for use in thin-film solar cells, touch panels, displays or light-emitting diodes.7–12 The use of preformed nanoparticles of transparent conductive oxides (TCOs) is becoming an increasingly attractive alternative to thin film deposition techniques, offering great benefits for printable electronics. This necessitates the availability of high-quality nanocrystals with customized particle size and shape as well as a defined doping level for controlled properties and optimum performance.13,14Generally, liquid phase-based processes have shown to be advantageous for the synthesis of metal oxides with high purities at moderate temperatures. Recently, different hydrothermal processes have been discussed in the literature for the synthesis of AZO nanostructures with high crystallinity at low reaction temperatures.15,16 However, the obtained products usually are composed of nanoparticles with a broad size distribution and variations in morphology. Another promising strategy is the non-aqueous or solvothermal synthesis which has been proven capable of synthesizing a variety of metal oxides, resulting in high crystallinity, adjustable doping levels and narrow particle size distributions.17,18 In contrast to the typical sol–gel synthesis, aromatic organic solvents such as benzyl alcohol, amines or ketones were used to realize moderate reaction rates during the synthesis, resulting in more homogeneous products with defined morphologies.18,19
The first investigations to synthesize Al-doped ZnO nanostructures using the non-aqueous synthesis were carried out using microwave-assisted procedures, wherein essentially roundish nanoparticles were obtained and utilized to prepare transparent conducting films.13,20,21
In this contribution, we show that the synthesis of AZO nanocrystals can be successfully accomplished also by conventional heating in a reactor. By careful adjustment of the reaction chemistry, the morphology of the nanocrystals can be tuned between 0D and 1D, which is shown to be due to the different functional groups of the used solvents. Combining precise control of the reaction chemistry with knowledge about the influence of other reaction parameters allowed us to produce AZO nanocrystals with both tailored size and morphology as well as tailored composition and thus adjustable electronic and optical properties.
2. Experimental
2.1 Synthesis of AZO nanocrystals
Zinc acetylacetonate hydrate (powder, Aldrich), aluminum acetylacetonate (Al(acac)3, 99%, Aldrich) and aluminum isopropoxide (Al(OiPr)3, ≥98%, Aldrich) were used as precursors for the preparation of AZO nanoparticles. The concentrations of the precursors were in the range of 6.35 up to 152.36 g L−1, whilst the content of the aluminum precursor was varied between 1.0 and 30 mol%, as described below. As reaction media, the pure solvents benzyl alcohol (BnOH, ≥99.9%, Fluka) and benzylamine (BnNH2, ≥99.0%, Fluka) as well as mixtures of benzyl alcohol and benzylamine (25, 50 and 75 vol% BnNH2 in BnOH) were utilized. For the nanocrystal synthesis at different scales, steel autoclaves equipped with Teflon liners (45 mL) and alternatively a 500 mL steel reactor furnished with an additional glass liner (Parr instruments) were used to achieve reaction temperatures of 80 to 200 °C and reaction times between 30 min and 96 h. Unless stated otherwise, a precursor concentration of 50.8 g L−1 (with 2.5 mol% Al) was utilized with a reaction temperature of 200 °C and a reaction time of 24 h. After the synthesis, the particles were separated from the reaction medium using centrifugation (10 min at 7500 rpm), washed twice with chloroform and dried at room temperature under vacuum for 1 day.2.2 Characterization
Powder X-ray diffraction (PXRD) (CuKα radiation; Empyrean Cu LEF HR goniometer; Empyrean series 2, PANalytical, PIXcel-3D detector; Si wafer; 20–90°, step size 0.05°) was utilized to determine the phase and crystallinity. ICP-OES (Varian 715-ES) was performed for the determination of the Al content in the synthesized nanoparticles. TEM images of the different samples were taken with a LEO 922 A (Carl Zeiss) as well as a Tecnai G2 F20 TMP (FEI) at 200 kV. UV-Vis measurements were carried out using a UV-3100PC spectrophotometer by VWR; concentrations of 10 g L−1 were used and measured in an optical range of 600 to 220 nm. The amount of bound organics at the particle surface was measured using thermogravimetric analysis (Mettler Toledo TGA/DSC) under oxygen flow in the range of 25–800 °C at 10 °C min−1.3. Results and discussion
3.1 Influence of the reaction chemistry
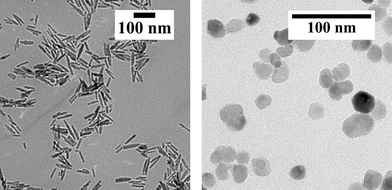
Typically, ZnO occurs in the hexagonal wurtzite structure with lattice parameters of a = 3.2499 and c = 5.2066 Å.22,23 The synthesized AZO nanoparticles maintained as well the wurtzite structure of ZnO. Based on different aspects, such as the surface energy and various material properties, anisotropic crystal growth along the c-axis can be observed22,24 and is commonly found for the water-based synthesis of ZnO nanoparticles.25Fig. 1 shows the PXRD patterns of the AZO nanoparticles obtained in benzyl alcohol and in benzylamine using precursor concentrations of 50.8 g L−1 and 25.4 g L−1, respectively, in comparison to the reference pattern for ZnO (ICSD database, no. 98-016-5010). In both cases, highly crystalline products with all reflections matching the wurtzite phase are found. The samples consist of nanosized crystallites as recognized by the signal broadening, with sizes calculated by the Scherrer equation to be about 12 nm (benzyl alcohol sample) and 25 nm (benzylamine sample) from the (010) reflection. Particularly the (002) reflection however appears significantly sharper for the benzyl alcohol sample, and the crystal size was calculated to be about 40 nm from this reflection, indicating the formation of rod-shaped AZO nanoparticles with preferred growth in the crystallographic l direction. For the benzylamine sample, comparable broadening of all the reflections suggests similar dimensions in all crystal directions. The TEM images of the products obtained from the two systems are shown in Fig. 2, clearly evidencing the different morphologies. Furthermore, the diameter and length of the AZO nanorods were determined on average to be about 12 and 45 nm, respectively; hence, the particles are single crystalline and the crystallite size can be equalized with the primary particle size. In comparison to the synthesis in 45 mL steel autoclaves, AZO spheres and rod-shaped nanoparticles with a similar morphology and particle size were obtained after performing the synthesis under identical conditions in the 500 mL reactor (see the ESI,† Fig. S10).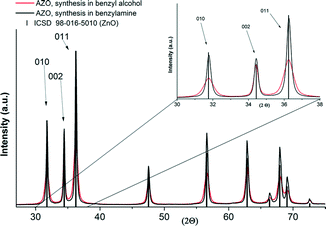 | ||
| Fig. 1 PXRD pattern of the obtained AZO nanoparticles compared to the ZnO reference (ICSD database, no. 98-016-5010). | ||
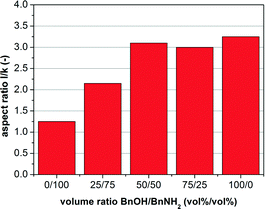
To analyze the influence of the solvent on the crystal growth, in particular the effect of benzyl alcohol, solvent mixtures of benzylamine and benzyl alcohol were used to synthesize AZO nanoparticles. In the following, the nanocrystal size and morphology of the different samples are discussed based on the crystal sizes in the l and k dimensions as determined from the (010) and (002) reflections in the measured XRD patterns using the Scherrer equation. Therefore, the integral properties of the samples rather than the data from exemplary TEM images were taken into account. Fig. 3 shows the aspect ratio l/k calculated from these sizes as a function of the used solvent composition for a standard precursor concentration of 50.8 g L−1. As the h and k directions are equivalent in the hexagonal lattice, the dimensions of the nanocrystals in these directions will be similar, which is confirmed by the TEM images. With an increase in the amount of the hydroxyl group-bearing species BnOH in the solvent mixture, higher aspect ratios, i.e. rod-shaped AZO nanocrystals, were obtained. Whereas lower volume fractions of the alcohol show a pronounced influence of the alcohol concentration on the aspect ratio, for a 50/50 vol% mixture apparently saturation is reached and further increase in the alcohol concentration does not result in significant changes in the nanocrystal morphology. Hence, we infer that the particle morphology can be controlled via the content of hydroxyl groups in the reaction system, having a much stronger influence on crystal growth than the presence of amino groups. The XRD patterns and TEM images of these samples, confirming the morphology transition from 0D to 1D, can be found in the ESI† section, Fig. S1 and S2.
The higher affinity of benzyl alcohol to the particle surface and thus the stronger influence on the particle growth were further investigated using thermogravimetric analysis (ESI,† Fig. S3). An increase in the volume content of benzyl alcohol in the solvent mixture leads to higher amounts of bound organics at the particle surface, which proves the higher affinity of BnOH to the particle surface as compared to BnNH2.
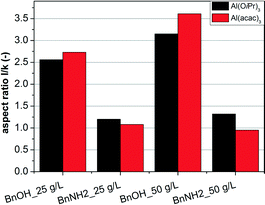
On the other hand, both aluminum acetylacetonate (Al(acac)3) and aluminum isopropoxide (Al(OiPr)3) were used as aluminum precursors. The calculated aspect ratios of nanocrystals obtained for the two precursors are shown in Fig. 4 for the different solvents and different precursor concentrations (for the corresponding XRD patterns see the ESI,† Fig. S4 and S5).
Again, it is clearly visible that the synthesis of AZO nanoparticles leads to the formation of AZO nanorods in BnOH, with aspect ratios ranging between 2.5 and 3.6 depending on the precursor concentration, and spherical AZO nanocrystals in BnNH2, with aspect ratios around 1.0. The influence of the aluminum precursor is however minor. Al(acac)3 resulted in slightly higher aspect ratios for the synthesis in BnOH and smaller aspect ratios in BnNH2 as compared to the particles synthesized with Al(OiPr)3 as precursor. This effect may be attributed to the different side products of the precursors, as the formation of isopropanol for the synthesis using Al(OiPr)3 would lead to higher aspect ratios in BnNH2 due to the higher concentration of alcohols in the system, but might act as a competing agent in the BnOH-based synthesis, limiting the effect of benzyl alcohol. Generally, the morphology of the forming AZO nanocrystals is mainly controlled by the chemistry of the used solvent rather than the chosen aluminum precursor. Due to these results and the toxicity of Al(acac)3, Al(OiPr)3 was used for all further investigations.
3.2 Influence of the precursor concentration
The precursor concentration was varied between 6.35 and 152.36 g L−1, to investigate its influence on the size and shape of the AZO nanocrystals. To demonstrate the dependence of nanocrystal dimensions on the precursor concentration, the determined nanocrystal sizes are shown in the crystallographic k and l directions for the AZO nanocrystals prepared in BnOH at different precursor concentrations, however using a constant ratio of 2.5 mol% Al(OiPr)3 (Fig. 5a). Due to the preferred growth direction, an increase in the precursor concentration leads to consequent further growth in the l direction. Notably, the particle size in the k direction is constant for all precursor concentrations. This clearly indicates that crystal growth is blocked in the k direction and the presence of higher amounts of precursor results in larger elongation of the nanorods.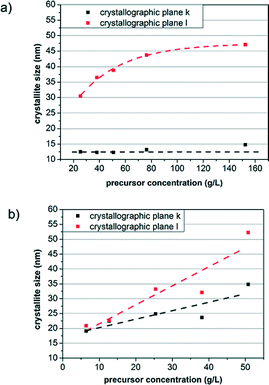 | ||
| Fig. 5 Crystallite size as a function of the precursor concentration of a) the AZO nanorods synthesized in benzyl alcohol and b) the AZO nanocrystals prepared in benzylamine. | ||
On the other hand, the concentration dependence of the crystallite size in the two crystallographic directions is strongly different for the spherical AZO nanoparticles (Fig. 5b). For higher concentrations, stronger crystal growth is observed in both directions. As a result of the higher surface energy of the (001) crystal faces, growth of the AZO nanoparticles in the l direction is slightly enhanced, which becomes more pronounced with increasing availability of monomer species. However, in comparison to the formation of AZO nanocrystals in the BnOH system, the use of BnNH2 as a solvent does not lead to strongly preferred growth in the l direction; hence nanocrystals with an aspect ratio of around 1 can be formed. Moreover, the nanocrystal size can be adjusted by the precursor concentration (for the corresponding XRD patterns see the ESI,† Fig. S6 and S7).
3.3 Influence of the Al doping
As an alternative to indium tin oxide as TCO for different applications, AZO nanoparticles with controllable doping concentrations are desired in order to tailor the electronic properties. To investigate the incorporation of Al into the crystal lattice as well as the influence of the aluminum doping on the resulting morphology, the concentration of added Al(OiPr)3 was varied between 1 and 30 mol%. Firstly, using ICP-OES analysis, the expected linear increase in the aluminum content of the nanocrystals was confirmed for both solvents (Fig. 6). Whilst the doping level can nicely be tuned by the amount of precursor, the Al contents of the samples are significantly lower than the initial content in the system. Notably, whilst previously saturation of the doping level at about 10 mol% was reported for microwave-based synthesis13 under the conditions applied, here significantly higher doping levels could be achieved especially in BnOH. On the other hand, the aluminum doping level had no significant effect on the resulting morphologies for both systems (cf. the ESI,† Fig. S8).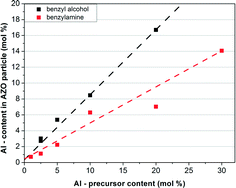 | ||
| Fig. 6 Al content of the AZO nanoparticles measured by ICP-OES as a function of the content of added aluminum precursor. | ||
Furthermore, the optical properties of the resulting nanocrystals were determined using UV-Vis measurements. Fig. 7 displays the spectra of spherical AZO nanocrystals (with an actual content of 1 and 2.5 mol% Al) compared to the undoped spherical ZnO particles prepared in BnNH2. All AZO particles were measured as stable dispersion in ethanol, having primary particle sizes of about 40 nm. A blueshift of the absorption for the Al-doped nanocrystals can clearly be observed in comparison to the undoped spherical particles.
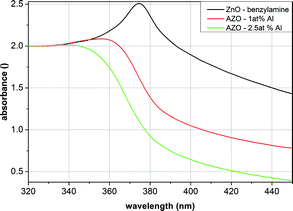 | ||
| Fig. 7 UV-Vis measurements of ZnO as well as the AZO nanoparticles synthesized in benzylamine with different Al contents. | ||
The bandgap of a crystalline semiconductor can be calculated via the Kubelka–Munk equation for direct allowed transitions:
| (hv × α)2 = A(hv − Eg) | (1) |
To derive the optical bandgap of the measured nanocrystals, the Tauc plot based on eqn (1) was applied to the measured UV-Vis spectra (Fig. 8). The extrapolation of the linear part of the curve can be used to determine the value of the excitation energy from the intersection with the abscissa. For the undoped ZnO nanocrystals prepared in BnNH2, an optical bandgap of 3.07 eV was calculated. For the spherical AZO nanocrystals, an increase in the bandgap energy was found, reaching about 3.24 eV for a doping level of 2.5 mol% (see the ESI,† Fig. S9, for the bandgap energies for different doping levels). In contrast, the rod-shaped ZnO nanocrystals showed a bandgap of about 3.3 eV as expected (the usual literature values range between 3.15 and 3.4 eV),24–26 and did not change significantly for increased Al doping levels. The comparably low bandgap of the synthesized spherical nanocrystals is attributed to their high crystallinity and larger size (about 40 nm in all the directions) as compared to the rod-shaped AZO nanocrystals (having a diameter of only 12.5 nm and, only in the l direction, a length of 40 nm). In comparison to the products of other studies, also the influence of the organics might play a role.13,26 The increase in bandgap energy with the Al concentration has been reported in a similar fashion before.13,26–28 For higher doping levels, a plateau at about 3.25 eV for the spherical nanocrystals, and at about 3.32 eV for the nanorods was found (see the ESI,† Fig. S9). This performance is well-known for n-type semiconductors and can be explained by the Burstein–Moss effect. With successful doping of ZnO with Al3+ ions, the Zn2+ ions in the lattice are substituted and one additional electron is located in the conduction band. If an electron occupies the lowest state in the conduction band, an excited electron from the valence band needs more energy to reach a higher state, because the Pauli principle prohibits it from occupying the same state.22,23
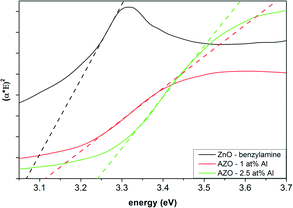 | ||
| Fig. 8 Tauc plot of the AZO nanocrystals with different doping concentrations as compared to the undoped ZnO nanoparticles (all samples prepared in benzylamine). | ||
3.4 Influence of the reaction time and temperature
To investigate the growth kinetics of the AZO nanocrystals, experiments under variation of the reaction time from 30 min to 72 h were performed for the synthesis in BnOH and BnNH2 at 200 °C with a precursor concentration of 50.8 g L−1 (2.5 mol% Al(OiPr)3). The calculated crystallite sizes for the obtained samples are presented in Fig. 9a, for the BnOH system, and in Fig. 9b, for the BnNH2 system.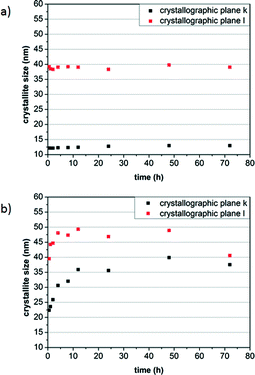 | ||
| Fig. 9 Influence of the reaction time on the crystallite size of the AZO nanocrystals synthesized in benzyl alcohol (a) and benzylamine (b). | ||
Surprisingly, in the BnOH synthesis, nanorods with an aspect ratio of around 3.2 are already formed after a short reaction time of 30 min, showing a size of approximately 12 nm in the crystallographic plane k and 40 nm in the crystallographic plane l. No significant further growth is observed for longer reaction times, pointing to a fast formation process in the alcohol. In contrast, growth of the AZO nanocrystals in BnNH2 is much slower, with an exponential increase in the crystal size in both directions being determined within the first 12 h. Notably, the nanocrystals are elongated initially with an aspect ratio of about 2.0 but become rather spherical in the course of the reaction over the following hours. This ripening process is also expressed by a slight decrease in size in the crystallographic l direction for long reaction times, pointing to a stabilization of the spherical crystal morphology in BnNH2. This different particle growth can be attributed to the different binding affinities of BnOH and BnNH2 to the nanocrystals as discussed above. We furthermore propose that BnOH strongly coordinates with all crystal faces, preventing any growth and resulting in 1D nanocrystals that already form after initial crystallization. In contrast, BnNH2 shows weaker binding but stabilizes the (001) crystal faces, resulting in the formation of 0D nanocrystals after ripening. The tendency of amines to favor the growth in the h and k directions over the l direction at high concentrations is well-known for the synthesis of ZnO in alkylamines.29
Moreover, the influence of the reaction temperature was investigated between 80 and 200 °C. Here, a precursor concentration of 50.8 g L−1 (2.5 mol% Al(OiPr)3) was used with a reaction time of 24 h. As clearly visible in Fig. 10, no significant influence of the reaction temperature on the resulting aspect ratio of AZO nanorods in BnOH was determined. For the synthesis of AZO nanocrystals in BnNH2, however, a decrease in the aspect ratio with higher reaction temperatures from 1.7 down to 1.2 was identified. Thus, to form spherical particles, a reaction temperature of 200 °C is necessary, which again indicates a ripening effect, which is clearly enhanced at higher temperatures, as responsible for the formation of spherical nanocrystals.
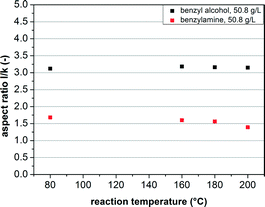 | ||
| Fig. 10 Influence of the reaction temperature on the aspect ratio of the AZO nanocrystals prepared in BnOH and BnNH2. | ||
4. Conclusions
In this study, we presented an easy and controllable approach to synthesize AZO nanocrystals with customized size and morphology. The morphology of the synthesized nanostructures strongly depends on the reaction chemistry, which is crucially influenced by the used solvent. Spherical nanoparticles were formed in benzylamine, whereas in benzyl alcohol as well as mixtures with high volume contents of the alcohol, AZO nanorods are obtained. Detailed studies revealed that this can be attributed to the different binding affinities of the solvents to the nanocrystals, with BnOH showing strong binding, preventing any further growth or ripening, whereas BnNH2 shows less strong binding to the surface, and ripening effects lead to spherical nanoparticles after long reaction times. Furthermore, our approach allowed the preparation of highly crystalline particles at low reaction temperatures between 80 and 200 °C at different scales up to 500 mL. The level of doped aluminum could be varied by adjusting the Al precursor concentration, allowing the synthesis of nanocrystals with not only tailored size and morphology but also tuned optical properties and bandgap energy.Acknowledgements
The authors gratefully acknowledge P. Schmidt, Institute of Geoecology, TU Braunschweig, for ICP-OES measurements. Furthermore, we thank Dr. I.-C. Masthoff, Institute for Particle Technology, TU Braunschweig, as well as Axel Freytag and Dr. N. C. Bigall, Institute of Physical Chemistry and Electrochemistry and Laboratory of Nano and Quantum Engineering, Leibniz University Hannover, for the TEM images.Notes and references
- S. Hartner, A. Moazzam, C. Schulz, M. Winterer and H. Wiggers, Nanotechnology, 2009, 20, 1–8 CrossRef PubMed.
- R. G. Gordon, MRS Bull., 2000, 25, 52–57 CrossRef CAS.
- E. Fortunato, D. Ginley, H. Hosono and D. C. Paine, MRS Bull., 2007, 32, 242–247 CrossRef CAS.
- V. Bhosle, A. Tiwari and J. Narayan, Appl. Phys. Lett., 2006, 88, 032106 CrossRef PubMed.
- N. Neves, R. Barros, E. Antunes, J. Calado, E. Fortunato, R. Martins and I. Ferreira, J. Eur. Ceram. Soc., 2012, 32, 4381–4391 CrossRef CAS PubMed.
- J. B. Shim, H. S. Kim, H. Chang and S.-O. Kim, J. Mater. Sci.: Mater. Electron., 2011, 22, 1350–1356 CrossRef CAS.
- Z. Lu, J. Zhou, A. Wang, N. Wang and X. Yang, J. Mater. Chem., 2011, 21, 4161–4167 RSC.
- N. G. Dhere, Sol. Energy Mater. Sol. Cells, 2006, 90, 2181–2190 CrossRef CAS PubMed.
- X. Jiang, F. L. Wong, M. K. Fung and S. T. Lee, Appl. Phys. Lett., 2003, 83, 1875–1877 CrossRef CAS PubMed.
- T. Minami, Semicond. Sci. Technol., 2005, 20, S35–S44 CrossRef CAS.
- Y. Furubayashi, T. Hitosugi, Y. Yamamoto, K. Inaba, G. Kinodo, Y. Hirose, T. Shimada and T. Hasegawa, Appl. Phys. Lett., 2005, 86, 252101 CrossRef PubMed.
- T. Strachowski, E. Grzanka, W. Lojkowski, A. Presz, M. Godlewski, S. Yatsunenko, H. Matysiak, R. R. Piticescu and C. J. Monty, J. Appl. Phys., 2007, 102, 073513 CrossRef PubMed.
- L. Luo, M. D. Rossell, D. Xie, R. Erni and M. Niederberger, ACS Sustainable Chem. Eng., 2013, 1, 152–160 CAS.
- R. Buonsanti, A. Llordes, S. Aloni, B. A. Helms and D. L. Milliron, Nano Lett., 2011, 11, 4706–4710 CrossRef CAS PubMed.
- R. R. Mohan, K. Sambath and K. Rajendran, J. Mater. Sci.: Mater. Electron., 2015, 26, 1748–1755, DOI:10.1007/s10854-014-2603-x.
- Z. Chen, G. Zhan, Y. Wu, X. He and Z. Lu, J. Alloys Compd., 2014, 587, 692–697 CrossRef CAS PubMed.
- G. Garnweitner and M. Niederberger, J. Mater. Chem., 2008, 18, 1171–1182 RSC.
- M. Niederberger and G. Garnweitner, Chem. – Eur. J., 2006, 12, 7282–7302 CrossRef CAS PubMed.
- G. Garnweitner, N. Tsedev, H. Dierke and M. Niederberger, Eur. J. Inorg. Chem., 2008, 890–895 CrossRef CAS PubMed.
- E. Hammarberg, A. Prodi-Schwab and C. Feldmann, J. Colloid Interface Sci., 2009, 334, 29–36 CrossRef CAS PubMed.
- I. Bilecka and M. Niederberger, Electrochim. Acta, 2010, 55, 7717–7725 CrossRef CAS PubMed.
- B. Ludi and M. Niederberger, Dalton Trans., 2013, 42, 12554–12568 RSC.
- S. C. Abrahams and J. L. Bernstein, Acta Crystallogr., Sect. B: Struct. Crystallogr. Cryst. Chem., 1969, 25, 1233–1236 CrossRef CAS.
- Ü. Özgür, Y. I. Alivov, C. Liu, A. Teke, M. A. Reshchikov, S. Dogan, V. Avrutin, S.-J. Cho and H. Morkoç, J. Appl. Phys., 2005, 98, 041301 CrossRef PubMed.
- B. Wen, Y. Huang and J. J. Boland, J. Phys. Chem. C, 2008, 112, 106–111 CAS.
- S. Suwanboon, P. Amornpitoksuk, A. Haidoux and J. C. Tedenac, J. Alloys Compd., 2008, 462, 335–339 CrossRef CAS PubMed.
- Y. Zhang, Y. Yang, J. Zhao, R. Tan, W. Wang, P. Cui and W. Song, J. Mater. Sci., 2011, 46, 774–780 CrossRef CAS.
- H. Zhou, H. Wang, K. Zheng, Z. Gu, Z. Wu and X. Tian, RSC Adv., 2014, 4, 42758–42763 RSC.
- Z. Zhang, M. Lu, H. Xu and W.-S. Chin, Chem. – Eur. J., 2007, 13, 632–638 CrossRef CAS PubMed.
Footnotes |
| † Electronic supplementary information (ESI) available: Aspect ratios of the AZO nanocrystals synthesized in the 500 mL reactor system and for different Al doping levels; thermogravimetric analysis of the AZO nanocrystals; optical bandgap of the AZO nanoparticles and nanorods; further XRD patterns and TEM images. See DOI: 10.1039/c5ce00629e |
| ‡ The authors contributed equally to this study. |
| This journal is © The Royal Society of Chemistry 2015 |

