Facile hydrothermal synthesis of carbon nanoparticles and possible application as white light phosphors and catalysts for the reduction of nitrophenol†
Hari Krishna Sadhanala,
Jayakrishna Khatei‡
and
Karuna Kar Nanda*
Materials Research Centre, Indian Institute of Science, Bangalore-560012, India. E-mail: nanda@mrc.iisc.ernet.in; Fax: +91 80 2360 7316; Tel: +91 80 2293 2996
First published on 6th January 2014
Abstract
We report a simple hydrothermal synthesis of highly reproducible carbon nanoparticles in a size range between 2 and 7 nm from a single precursor sucrose without either surface passivating agents or acids and bases. The carbon nanoparticles can be used as white light phosphors, especially for ultraviolet light emitting diodes and metal-free catalyst for the reduction of nitrophenol.
Introduction
Carbon based nanoparticles (CNPs) are generally referred as carbon nanocrystals with size less than 10 nm. The precisely control of the diameter of the CNPs is interesting in optoelectronics because of their size-dependent optical and electrical properties. Furthermore, CNPs have drawn great attention because of their unequalled optical and electronic properties.1–20 The photoluminescence (PL) of CNPs has been studied extensively with potential applications such as fluorescent probes for bioimaging21,22 and biosensing1–3,23–25 due to their low toxicity and excellent biocompatibility.26 Luminescence of CNPs is reported to be size-dependent27 as well as excitation-dependent.28 It has also been shown that they can be used as white light phosphors.CNPs including graphene quantum dots have been synthesized from nanodiamonds,23 graphite,1–4 carbon nanotubes,5,6 carbon soots,7 candle soot,8,9 green tea,10 sucrose with oil acid,11 sodium citrate,12 active carbon,13 graphite oxide,14 citric acid,15 glucose,16,17 resin,18 orange juice,29 and coffee powder.30 However, the large scale synthesis of CNPs by one-step strategy without any passivation or acids and bases is still a challenge in this field. Herein, we report a new facile one-pot hydrothermal synthesis of CNPs from a single green precursor i.e. sucrose without any acid or alkali treatment during synthesis (Fig. S1a†). The average size varies between 2 and 7 nm when the duration of the synthesis is between 2 and 3 h. CNPs exhibit color tunable photoluminescence properties. We also report on the size- and excitation-dependent luminescence of CNPs. The PL spectra reveal a strong excitation-dependency and a very weak size-dependency emission. Interestingly, the carbon nanoparticles emit white light with ultraviolet excitation and can be used as white light phosphors. Furthermore, the CNPs can also be used for the reduction of 4-nitrophenol (4-NP) in the presence of NaBH4.
Results and discussion
The mechanism for the formation of CNPs is shown in Fig. 1a. The CNPs were formed from sucrose through five steps:31–34 (1) fragmentation of sucrose occurs under hydrothermal treatment, followed by (2) ring opening of hydrolyzed compounds, (3) formation of furfural compounds and weak organic acids due to the dehydration and decomposition followed by (4) polymerization of furfural compounds in the presence of hydronium ion generated from the weak organic acids that act as catalyst in the subsequent reaction steps. This is due to the high pressure created in the Teflon coated flask. Finally, (5) carbonization occurs through sudden burst which leads to nucleation and formation of CNPs.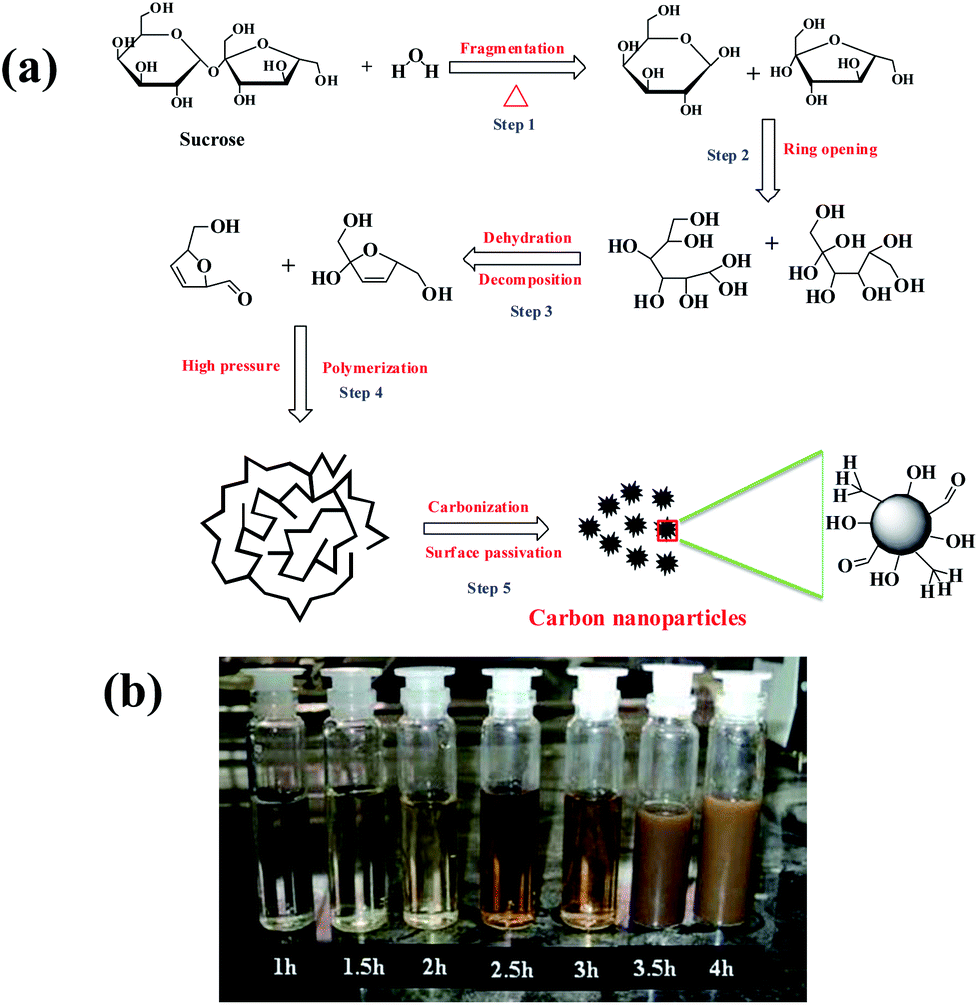 | ||
| Fig. 1 (a) Plausible mechanism for the formation of CNPs. (b) Optical images of CNPs under visible light. | ||
An optical image of CNPs grown for different duration is shown in Fig. 1b, Fig. 2 and S1b–e† show the morphology of CNPs synthesized from sucrose via hydrothermal route (reaction temperature is 180 °C) for various heating time (1.0, 2.0, 2.5, 3.0 and 4.0 h). Transmission electron microscope (TEM) micrographs (Fig. 2a and c) show the relatively narrow size distribution of CNPs between 2 and 7 nm which is similar to that of other reported CNPs.1,7 High resolution TEM (HRTEM) micrographs shown in Fig. 2b and d reveal the high crystallinity of CNPs with a d-spacing of ∼0.34–0.36 nm. X-ray diffraction (XRD) patterns of the CNPs prepared at various heating time (Fig. S2 in ESI†) reveal a broad diffraction peak at 22.0–22.84 which is believed to be due to the small size of the CNPs. The calculated d-spacing is 0.3889–0.4035 nm which is in good agreement with graphite (002) plane. The difference in d-spacing between the bulk graphite and the CNPs is attributed to the presence of –O–H, –C–H, and –C–O–R at the edges of the CNPs, which enlarges the d-spacing of graphene layers.19,35,36 Furthermore, a similar difference in d-spacings obtained from HRTEM and XRD has been observed by others.35,36
 | ||
| Fig. 2 (a and c) TEM, (b and d) HRTEM of CNPs. | ||
Fig. 3a shows the FTIR spectra of the CNPs at different duration of synthesis for concentration of 2 wt% and we observed –C![[double bond, length as m-dash]](https://www.rsc.org/images/entities/char_e001.gif) C– stretching at 1643 cm−1 which is characteristic and a primary band due to sp2 carbon in the CNPs. The broad peak centered at 3447 cm−1 reveals the presence of O–H group. The absorptions at 1425 and 2920 cm−1 reveal the existence of C–H group. The absorption at 1020 cm−1 is due to the C–O group.35,36 Over all, FTIR data corroborate the scheme proposed in Fig. 1a. The presence of functional groups O–H, C–H, and C–O–R located at the surface of the CNPs act as a passivating layer for these CNPs. These functional groups help in the solubility of CNPs in water as well as influence the photoluminescence properties which will be discussed later.
C– stretching at 1643 cm−1 which is characteristic and a primary band due to sp2 carbon in the CNPs. The broad peak centered at 3447 cm−1 reveals the presence of O–H group. The absorptions at 1425 and 2920 cm−1 reveal the existence of C–H group. The absorption at 1020 cm−1 is due to the C–O group.35,36 Over all, FTIR data corroborate the scheme proposed in Fig. 1a. The presence of functional groups O–H, C–H, and C–O–R located at the surface of the CNPs act as a passivating layer for these CNPs. These functional groups help in the solubility of CNPs in water as well as influence the photoluminescence properties which will be discussed later.
 | ||
| Fig. 3 (a) FTIR spectra and (b) Raman spectra of CNPs. (c) UV absorption of CNPs obtained at different heating times. The arrows represent the red-shift of the absorption spectra. | ||
Fig. 3b shows the Raman spectra of CNPs for different duration of synthesis. It may be noted that IG is comparable to ID and IG/ID is increasing with the duration of the synthesis. Overall, Raman studies reveal a graphitic (–CC–) nature of the CNPs with lot of defects present. Fig. 3c shows the UV-Visible spectra of as prepared CNPs synthesized at different temperatures. In our case we noticed two absorption peaks, one at 227 nm and another at 283 nm, which are blue shifted as compared to that for synthesized by hydrothermal graphene oxide reduction method (230 nm and 320 nm).37 The optical density of these two peaks increases as the heating time increases (Fig. 3c for 2 wt% sucrose solution). The absorption peaks at 283 and 227 nm correspond to n to π* transition of –CO and π to π* transition of C–C and CC bonds of CNPs, respectively.35,38 Unlike inorganic quantum dots, the two main absorption peaks are independent of the size as the position of the absorption peak remains unchanged with increasing heating time.
The PL spectra of different CNPs with different excitation are shown in Fig. 4a–d. In this context, we would like to mention that the fluorescence intensity is within 0.01% for GQDs synthesized in different batches. This indicates that the result on the synthesis of CNPs is highly reproducible. The emission energy as a function of excitation energy for different CNPs is shown in Fig. S3.† It is evident that the emission energy is not only excitation-dependent but also size-dependent. It is also clearly apparent that the emission wavelength depends strongly on the excitation wavelength but weakly on the size of the CNPs. The luminescence spectra are red-shifted as the size of the CNPs increases. This is in good agreement with inorganic quantum dots but inconsistent with that reported for carbon quantum dots (CQDs) synthesized by physical vapour deposition.39 It has been shown that the band gap opens up when the size of CNPs is ∼1 nm and the band gap is 0.65 eV for 0.4 nm. The luminescence observed in the visible region for CNPs in 2–7 nm range is an indicative of multiple chromophore or fluorophore system involved with aromatic compound. Furthermore, the size-dependent luminescence suggests that the CNPs core also influence the properties. With increasing size, the surface to volume ratio of the CNPs decreases and as a result the emissive trap states get modified. In the present case the emissive surface traps self-passivated by sucrose become luminescent and the size dependent PL behaviour follows the usual quantum confinement effect. Fig. 4e shows the PL spectra of CNPs taken by diluting the solution. It is interesting to note that the luminescence intensity increases very rapidly followed by a slight decrease as shown in Fig. 4(f). The PL spectra are also blue-shifted followed by a complex variation (Fig. S3 of ESI†). With the increase in dilution, the spacing between CNPs increases, thereby decreasing the interference among them. As a result, the intensity increases and the PL spectra are blue-shifted. When the dilution is increased further, the intensity is expected to decrease as the concentration of the luminescent centre decreases.
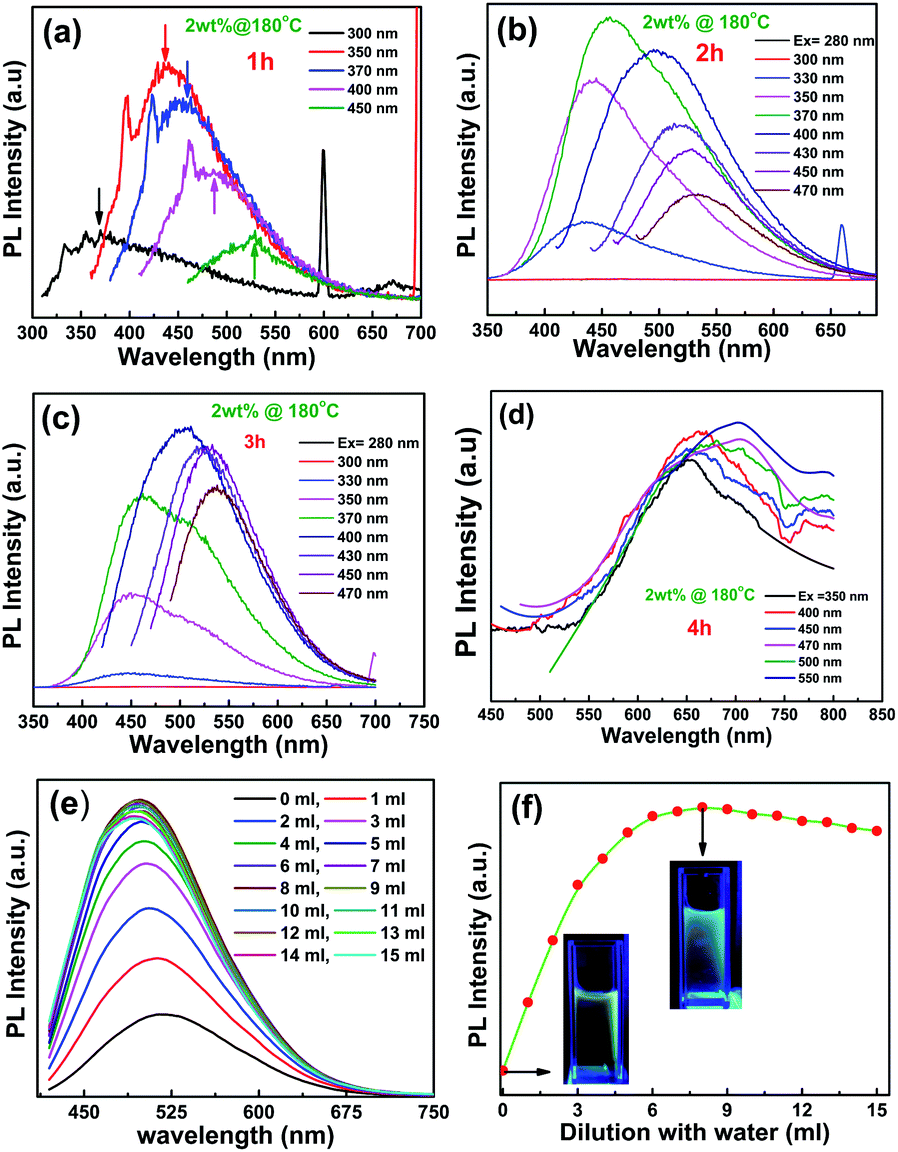 | ||
| Fig. 4 (a–d) Different excitation luminescence of CNPs grown for 1, 2, 3 and 4 h. (e) PL spectra of CNPs (grown for 2.5 h) acquired by diluting the solution and (f) the intensity as a function of dilution. The excitation wavelength is 400 nm. Insets show the photographs of CNPs with UV (365 nm) illumination. | ||
It is interesting to note that the PL spectra are excitation-dependent (Fig. S4 of ESI†). When the samples are excited above 283 nm, the 1 h synthesized CNPs show deep ultraviolet emission where the 2.5 and 4 h samples show broad emission covering blue, green and red (Fig. 5a). The CIE diagram for 2.5 h CNPs shown in Fig. 5b indicates white light emission with a CIE coordinate of (0.33, 0.33) and CIE diagram of 4 h also reveals the white light emission (Fig. S5 of ESI). It may be noted here that blue luminescence is due to the intrinsic states, while the green luminescence is due to oxygeneous group. With increasing duration of synthesis there is the possibility of formation of more trap states arising from different functional groups in the CNPs and the emissive nature of these trap states1 could be the reason for the observed white emission.
 | ||
| Fig. 5 (a) PL of CNPs with 280 nm and (b) CIE diagram for 2.5 h CNPs with 280 nm excitation. | ||
Irrespective of the PL mechanism, white light emission is observed which can be explored for white light emission. In this context, it may be noted that AlGaN based light emitting diodes (LEDs)40 from Sensor Electronic Technology Inc. (SETi) and Seoul Semiconductor (SSC) with emission wavelength of 265 nm and 280 nm are available.
Reduction of 4-nitrophenol to 4-aminophenol
It is highly desirable to develop efficient and eco-friendly catalysts to produce 4-aminophenol (4-AP) as it is a powerful industrial intermediate in manufacturing many analgesic and antipyretic drugs, hair drying agents, and anticorrosion lubricants. As the reduction of 4-NP yields 4-AP, we have explored our CNPs for the same. Fig. 6a represents the UV-Vis absorption spectra of reaction medium when CNPs are added. We noted that the absorbance at 400 nm, which corresponds to the 4-nitrophenolate ion, decreases while the absorbance peak at 295 nm related to the 4-aminophenolate ion increases. The rate constant for the reduction of 4-NP in the presence of CNPs is estimated to be 1.42 × 10⁻³ s−1 and the reaction follows pseudo zero order kinetics (Fig. S6 of ESI†). This is different from the reduction of NP by Au@rGO,41 Pd NPs and CNT/PiHP/Pd NPs hybrids42 and similar to that for nitrogen doped graphene.43 The two isobestic points at 268 and 311 nm reveal clear and visible conversion of 4-NP without side products.44,45 The reaction was completed in 12 min, which is similar to the reduction of 4-NP by Au@rGO41 and different from wood nanomaterials supported Pt NPs.46 Fig. 6c shows the optical photographs of the 4-nitrophenolate ion (yellow) that is reduced to colourless 4-aminophenolate ion.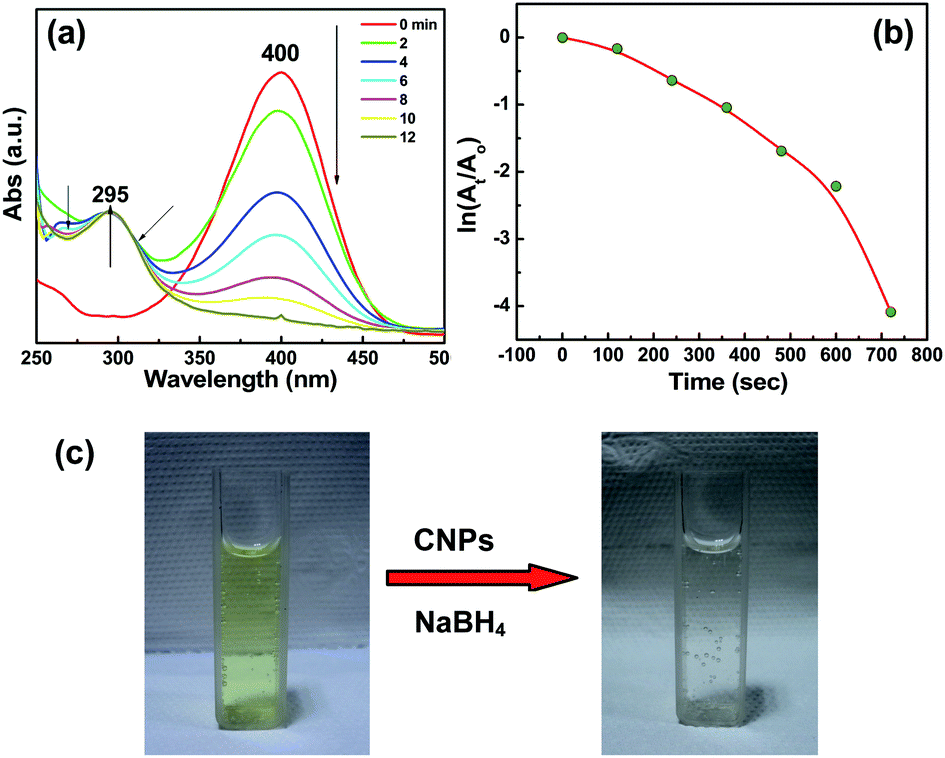 | ||
| Fig. 6 (a) Time dependent UV-Vis absorption spectra of 4-NP. (b) Plot of ln (At/Ao) versus time at 400 nm. (c) Optical photographs of the solution before and after the reaction is complete. | ||
Conclusion
In summary, we report a facile synthesis of CNPs from a single green precursor i.e. sucrose by hydrothermal method using Teflon lined stainless steel autoclave inside a muffle furnace unlike microwave heating. Photoluminescence studies of CNPs revealed size-dependent as well as excitation-dependent luminescence. Overall, they can be explored as white light phosphors and catalysts for the metal free reduction of 4-nitrophenol to 4-aminophenol in the presence of NaBH4.Acknowledgements
The authors acknowledge the Department of Science and Technology (DST) for the financial support. The authors also acknowledge IISc for the financial assistance in acquiring a 200 kV FETEM.Notes and references
- S. N. Baker and G. A. Baker, Angew. Chem., Int. Ed., 2010, 49, 6726 CrossRef CAS PubMed
.
- S. J. Yu, M. W. Kang, H. C. Chang, K. M. Chen and Y. C. Yu, J. Am. Chem. Soc., 2005, 127, 17604 CrossRef CAS PubMed
- Y. P. Sun, B. Zhou, Y. Lin, W. Wang, K. A. S. Fernando and P. Pathak, et al., J. Am. Chem. Soc., 2006, 128, 7756 CrossRef CAS PubMed
- L. Cao, X. Wang, M. J. Meziani, F. Lu, H. Wang and P. G. Luo, et al., J. Am. Chem. Soc., 2007, 129, 11318 CrossRef CAS PubMed
- S. T. Yang, L. Cao, P. G. Luo, F. Lu, X. Wang and H. Wang, et al., J. Am. Chem. Soc., 2009, 131, 11308 CrossRef CAS PubMed
- L. Y. Zheng, Y. W. Chi, Y. Q. Dong, J. P. Lin and B. B. Wang, J. Am. Chem. Soc., 2009, 131, 4564 CrossRef CAS PubMed
- X. Y. Xu, R. Ray, Y. L. Gu, H. J. Ploehn, L. Gearheart and K. Raker, et al., J. Am. Chem. Soc., 2004, 126, 12736 CrossRef CAS PubMed
- H. Liu, T. Ye and C. Mao, Angew. Chem., Int. Ed., 2007, 46, 6473 CrossRef CAS PubMed
- A. Khanam, S. K. Tripathi, D. Roy and M. Nasim, Colloids Surf., B, 2013, 102, 63 CrossRef CAS PubMed
- P.-C. Hsu, P.-C. Chen, C.-M. Ou, H.-Y. Chang and H.-T. Chang, J. Mater. Chem. B, 2013, 1, 1774 RSC
- B. Chen, F. Li, S. Li, W. Weng, H. Guo, T. Guo, X. Zhang, Y. Chen, T. Huang, X. Hong, S. You, Y. Lin, K. Zeng and S. Chen, Nanoscale, 2013, 5, 1967 RSC
- Y. Guo, Z. Wang, H. Shao and X. Jiang, Carbon, 2013, 52, 583 CAS
- J. Zhou, C. Booker, R. Li, X. Zhou, T. K. Sham and X. Sun, et al., J. Am. Chem. Soc., 2007, 129, 744 CrossRef CAS PubMed
- H. P. Liu, T. Ye and C. D. Mao, Angew. Chem., Int. Ed., 2007, 46, 6473 CrossRef CAS PubMed
- Y. Dong, N. Zhou, X. Lin, J. Lin, Y. Chi and G. Chen, Chem. Mater., 2010, 22, 5895 CrossRef CAS
- Q. Wang, H. Zheng, Y. Long, L. Zhang, M. Gao and W. Bai, Carbon, 2011, 49, 3134 CrossRef CAS PubMed
- A. B. Bourlinos, A. Stassinopoulos, D. Anglos, R. Zboril, M. Karakassides and E. P. Giannelis, Small, 2008, 4, 455 CrossRef CAS PubMed
- H. Peng and J. Travas-Sejdic, Chem. Mater., 2009, 21, 5563 CrossRef CAS
- H. Li, X. He, Y. Liu, H. Huang, S. Lian and S. Lee, et al., Carbon, 2011, 49, 605 CrossRef CAS PubMed
- R. Liu, D. Wu, S. Liu, K. Koynov, W. Knoll and Q. Li, Angew Chem., Int. Ed., 2009, 48, 4597 Search PubMed
- M. Bruchez, M. Moronne, P. Gin, S. Weiss and A. P. Alivisatos, Science, 1998, 281, 2013 CrossRef CAS
- X. H. Gao, Y. Y. Cui, R. M. Levenson, L. W. K. Chung and S. M. Nie, Nat. Biotechnol., 2004, 22, 969 CrossRef CAS PubMed
- H. Peng, L. Zhang, T. H. M. Kjaellman, C. Soeller and J. Travas-Sejdic, J. Am. Chem. Soc., 2007, 129, 3048 CrossRef CAS PubMed
- W. C. W. Chan and S. M. Nie, Science, 1998, 281, 2016 CrossRef CAS
- Y. T. Long, C. Kong, D. W. Li, Y. Li, S. Chowdhury and H. Tian, Small, 2011, 7, 1624 CAS
- H. Sun, L. Wu, N. Gao, J. Ren and X. Qu, ACS Appl. Mater. Interfaces, 2013, 5, 1174 CAS
- J. Peng, W. Gao, B. K. Gupta, Z. Liu, R. Romero-Aburto and L. Ge, Nano Lett., 2012, 12, 844 CrossRef CAS PubMed
- P. Yu, X. Wen, Y.-R. Toh and J. Tang, J. Phys. Chem. C, 2012, 116, 25552 CAS
- S. Sahu, B. Behera, T. K. Maitib and S. Mohapatra, Chem. Commun., 2012, 48, 8835 RSC
- P.-C. Hsu, Z.-Y. Shih, C.-H. Lee and H.-T. Chang, Green Chem., 2012, 14, 917 RSC
- X. Sun and Y. Li, Angew. Chem., Int. Ed., 2004, 43, 597 Search PubMed
- C. Liu, P. Zhang, F. Tian, W. Li, F. Li and W. Liu, J. Mater. Chem., 2011, 21, 13163 RSC
- Y. Li, E. J. Lee, W. Cai, K. Y. Kim and S. O. Cho, ACS Nano, 2008, 2, 1108 CAS
- B. De and N. Karak, RSC Adv., 2013, 3, 8286 RSC
- L. Tang, R. Ji, X. Cao, J. Lin, H. Jiang, X. Li, K. S. Teng, C. M. Luk, S. Zeng, J. Hao and S. P. Lau, ACS Nano, 2012, 6, 5102 CrossRef CAS PubMed
- C. M. Luk, L. B. Tang, W. F. Zhang, S. F. Yu, K. S. Teng and S. P. Lau, J. Mater. Chem., 2012, 22, 22378 RSC
- D. Pan, J. Zhang, Z. Li and M. Wu, Adv. Mater., 2010, 22, 734 CrossRef CAS PubMed
- J. Lu, P. S. E. Yeo, C. K. Gan, P. Wu and K. P. Loh, Nat. Nanotechnol., 2011, 6, 247 CrossRef CAS PubMed
- M. Lonfat, B. Marsen and K. Sattler, Chem. Phys. Lett., 1999, 313, 539 CrossRef CAS
- C. Pernot, M. Kim, S. Fukahori, T. Inazu, T. Fujita, Y. Nagasawa, A. Hirano, M. Ippommatsu, M. Iwaya, S. Kamiyama, I. Akasaki and H. Amano, Appl. Phys. Express, 2010, 3, 061004 CrossRef
- B. K. Barman and K. K. Nanda, Chem. Commun., 2013, 49, 8949 CAS
- H. Li, L. Han, J. Cooper-White and I. L. Kim, Green Chem., 2012, 14, 586 RSC
- X. Kong, Z. Sun, M. Chen, C. Chen and Q. Chen, Energy Environ. Sci., 2013, 6, 3260 CAS
- N. Velghe and A. Claeys, Analyst, 1983, 108, 1018 RSC
- Y. Mei, Y. Lu, F. Polzer, M. Ballauff and M. Drechsler, Chem. Mater., 2007, 19, 1062 CrossRef CAS
- X. Lin, M. Wu, D. Wu, S. Kuga, T. Endo and Y. Huang, Green Chem., 2011, 13, 283 RSC
Footnotes |
| † Electronic supplementary information (ESI) available. See DOI: 10.1039/c3ra47527a |
| ‡ Present address: Interdisciplinary School of Green Energy, Ulsan National Institute of Science and Technology (UNIST), Banyeon-ri 100, Ulsan 689-805, Korea. |
| This journal is © The Royal Society of Chemistry 2014 |