
One-step surfactant-free controllable synthesis and tunable up-conversion/down-shifting white light emissions of Sr2YF7 crystals doped with Ln3+ ions†
Dingyi
Shen
a,
Yini
Mao
a,
Jun
Yang
 a,
Lu
Cao
b,
Juntao
Ning
b and
Shanshan
Hu
*a
a,
Lu
Cao
b,
Juntao
Ning
b and
Shanshan
Hu
*a
aSchool of Chemistry and Chemical Engineering, Southwest University, Chongqing 400715, China. E-mail: hushan3@swu.edu.cn
bChongqing Songshuqiao Middle School, Chongqing 401147, China
First published on 22nd September 2020
Abstract
In this work, uniform and monodisperse Sr2YF7 spheres were successfully synthesized via a facile one-step hydrothermal route without employing any surfactant. Particularly, a well-defined morphology of Sr2YF7 crystals ranging from spherical to octahedral shape was first achieved by adjusting the pH values. In addition, the spherical products doped with 6% Ln3+ (Ln = La, Ce, Pr, Sm, Gd, and Dy) show different sizes ranging from 300 to 600 nm. The Sr2YF7 crystals also exhibit excellent multicolor DS/UC luminescence properties after doping with different Ln3+ ions. Energy transfer from Tb3+ to Eu3+ was observed in Sr2YF7 crystals; the Sr2YF7:Dy3+ crystals showed nearly white light emission under UV excitation; Sr2YF7:Yb3+/Er3+/Tm3+ crystals could produce pure white light with a CIE color coordinate of (0.3123, 0.3005) by controlling the doping concentrations of Er3+ and Tm3+ ions under 980 nm excitation. The as-prepared phosphors may potentially serve as light, color displays and markers in biological imaging.
1 Introduction
Nowadays, inorganic rare earth (RE) materials doped with trivalent lanthanide ions (Ln3+) are drawing attention greatly because of their wide application in various devices such as white light-emitting diodes,1 solid-state lasers,2 solar cells,3 and sensors.4 Among the many inorganic rare earth luminescent matrix materials,5–7 rare earth fluoride is of particular interest due to its toxicity-free nature and high stability compared to some organic dyes and semiconductor quantum dots,8,9 as well as its utmost efficiency for up-conversion emission.10 It is well known that fluoride materials have low lattice phonon energy to effectively reduce phonon-assisted nonradiative relaxation according to theoretical calculations.11Thus far, there have been several approaches to prepare RE-based fluorides with controllable phases, morphologies and chemical compositions.12 The three most common methods are thermal decomposition, high-temperature coprecipitation and hydro(solvo)-thermal synthesis, respectively. However, the first two ways may also bring some inevitable problems like complex experimental conditions, pollution and safety concerns13–15 despite high manufacturing yields. It seems that the hydrothermal method suits better to gain highly crystalline fluoride materials under relatively mild conditions (convenient, simple and environment-friendly). Generally, surfactants were employed to control the morphology and shapes during the preparation of materials by a wet chemical method. In fact, it is difficult to remove the residual surfactants entirely and they may even further affect the phosphors' luminous quenching centers and luminescence properties.16 Therefore, it is of significant importance to find a proper way to simplify the synthetic process of RE-based fluorides without any additives in the premise of desirable results.
Up to now, much effort has been made for the synthesis of RE-based fluorides (RE = Y, La, Ce, Pr, Nd, Sm, Eu, Gd, Tb, Dy, Ho, Er, Tm, Yb and Lu) with controllable crystalline phases, shapes and sizes.17–20 In the family of Y3+-based fluorides, except for NaYF4,21 YOF,22 LiYF4 (ref. 23) and BaYF5,24 Sr2YF7, as an important matrix for Ln3+ ions to fabricate up-conversion (UC) or down-shifting (DS) phosphors, has aroused much research interest. Recently, Chen's group has reported Sr2YF7:Ln3+ nanoparticles for biodetection by a thermal decomposition method;20 Xia has prepared Sr2LnF7:Yb3+, Er3+ (Ln = Y, Gd) nanocrystals by an EDTA-assisted method;25 Ma reported ultrasmall face-centered cubic Sr2YF7:Yb3+, Er3+/Yb3+, Tm3+ nanocrystals under the condition of oleic acid;26 Han's group has also made the hierarchical microspheres Sr2YF7:Eu3+ by a hydrothermal method.27 Although several attempts have been made for the synthesis of Ln3+-doped Sr2YF7, only color emissions were produced, as previously reported in the literature. To date, a systematic survey on the optical properties, in particular UC and DS white light emission of Ln3+ in the Sr2YF7 host, is still lacking. To gain deep insights into the understanding of the electronic structure and optical properties (in particular, white light emission) of Ln3+ ions in the Sr2YF7 host is of vital importance for optimizing their optical performance for potential applications.
Here, we produced uniform and monodisperse Sr2YF7:Ln3+ microcrystals by a facile one-pot hydrothermal approach without any surfactant. The morphologies and sizes of the Sr2YF7 microcrystals could be easily adjusted by doping with different Ln3+ ions and changing the pH values. We performed a study of multi-doping Ln3+ ions in the Sr2YF7 host. The prepared Sr2YF7:Ln3+ (Ln = Dy, Tb, Eu, Yb, Er, Tm) phosphors showed tunable DS/UC luminescence properties. Specifically, we first found the energy transfer of Tb3+ → Eu3+ and obtained white light emission of tri-doped Yb3+–Er3+–Tm3+ in the Sr2YF7 host, respectively.
2 Experimental section
Chemicals
RE2O3 (RE = Yb, Er, Ho, Dy, Gd, Eu, Sm and La) (99.99%), Ce(NO3)3 (99.99%), Tb4O7 (99.99%) and Pr6O11 (99.99%) were acquired from Goring High-tech Material Corporation Limited (China). Strontium chloride (SrCl2), sodium tetrafluoroborate (NaBF4), sodium hydroxide (NaOH), and hydrochloric acid (HCl) were purchased from Aladdin Industrial Corporation (China) and used without further purification. RECl3 (RE = Yb, Er, Ho, Dy, Tb, Gd, Eu, Sm, Pr and La) were prepared by dissolving the corresponding rare earth oxides in dilute HCl and then evaporating the excess HCl.Synthesis
In a typical synthesis for the preparation of the Sr2YF7 host, 2 mmol SrCl2, 1 mmol YCl3 solution and 30 mL deionized water were added together to form a transparent solution by stirring in a 100 mL beaker for 15 minutes. Subsequently, 8 mmol NaBF4 was added dropwise into the above solution under vigorous stirring. The pH was adjusted to the required value by adding 1 mol L−1 NaOH solution dropwise. The volume of the system was finally maintained at 35 mL. After the process of enough stirring, the obtained solution was transferred into a Teflon bottle held in a stainless steel autoclave, sealed and kept at 220 °C for 24 h, and then cooled to room temperature naturally. The final products were centrifuged, washed several times with deionized water and ethanol, and then dried at 80 °C for 12 h. Other samples (Sr2YF7:Ln3+) were synthesized by a similar method except for using different stoichiometric ratios of rare earth ions.Characterization
Powder X-ray diffraction (XRD) measurements were performed using a Purkinje Genera Instrument MSALXD3 under the condition of Cu Kα radiation (λ = 0.15406 nm) at a scanning rate of 8° min−1 from 20° to 70° with 2θ, 20 mA and 36 kV. The morphology and energy-dispersive spectrometry of the samples were inspected using a field emission scanning electron microscope (FE-SEM, XL30, Philips) operating at an accelerating voltage of 10 kV. The DS PL measurements were conducted using a Hitachi F-7000 spectrophotometer equipped with a 150 W xenon lamp as the excitation source. The UC PL measurements were carried out using a 980 nm laser with MDL-N-980-8W as the excitation source. The luminescence decays were recorded using an FLSP920 fluorescence spectrophotometer and a Shimadzu R9287 photomultiplier (200–900 nm) accompanied by a liquid nitrogen-cooled InGaAs (800–1700 nm) diode as the detector. All the measurements were performed at room temperature.3 Results and discussion
3.1. Phase identification and morphology of Sr2YF7 hosts
Sr2YF7 has a tetragonal crystal structure with a space group of I4/mcm (a = b = 11.416 Å, c = 13.291 Å and Z = 10). As shown in Fig. 1a, the well-defined diffraction peaks of the obtained products can fit well with the standard data of Sr2YF7 (JCPDS no. 53-0675). The crystallite size of the samples can be estimated from the Scherrer equation, D = 0.941λ/β![[thin space (1/6-em)]](https://www.rsc.org/images/entities/char_2009.gif) cosθ, where D is the average grain size, the factor 0.941 is characteristic of spherical objects, λ is the X-ray wavelength (0.15405 nm), and θ and β are the diffraction angle and full-width at half-maximum (FWHM, in radian) of an observed peak, respectively. The strongest peaks (302) at 2θ = 26.976° were used to calculate the average crystallite size (D) of the Sr2YF7 host. The estimated average crystallite size is about 26 nm.
cosθ, where D is the average grain size, the factor 0.941 is characteristic of spherical objects, λ is the X-ray wavelength (0.15405 nm), and θ and β are the diffraction angle and full-width at half-maximum (FWHM, in radian) of an observed peak, respectively. The strongest peaks (302) at 2θ = 26.976° were used to calculate the average crystallite size (D) of the Sr2YF7 host. The estimated average crystallite size is about 26 nm.
 | ||
| Fig. 1 XRD pattern (a) and SEM image (b) of the as-synthesized Sr2YF7 host under the conditions of Sr2+/Y3+/BF4− = 2:1:8 and pH = 3. Sr2YF7 has the stoichiometric ratio of Sr:Y:F = 2:1:7, so we use excess NaBF4 to get pure-phase Sr2YF7 products. | ||
The SEM indicates that the morphology of products shows uniform and monodisperse spheres with a diameter of 500 nm, as shown in Fig. 1b. Moreover, the high-magnification SEM image (inset of Fig. 1b) clearly shows that the obtained product is polycrystalline,28,29 as it further actually consists of many smaller grains with a size of 20–40 nm. The size is basically in agreement with the results estimated from the above-mentioned Scherrer equation (26 nm). Because smaller nanograins contribute more to the broadening of the diffraction peaks, the average nanocrystal size estimated from the Scherrer equation is smaller than that determined from the SEM topology in the case of Sr2YF7 spheres.30 The barely low agglomeration of spherical particles are beneficial for practical applications like form coating and ceramic. Generally speaking, the phase and morphology of nano/micromaterials not only depend on the aimed compounds' intrinsic structures but also involve many experiment factors like types of raw materials, pH values, doping ions, temperatures and reaction times. Here, we used NaBF4 as a F− source and kept the other conditions unchanged (temperature, reaction time and free-surfactant). The effects of pH values and various doping rare earth ions on the phase/morphology of crystals are discussed in detail next.
 | ||
| Fig. 2 XRD patterns of the Sr2YF7 host with different pH values. | ||
To precisely analyse the influence of pH values on the morphological evolution, the SEM images are provided in Fig. 3. First, the pH is 3 during the process of preparation. As shown in Fig. 3a, the original Sr2YF7 host consists of numerous uniform and monodisperse spheres whose surfaces are consisting of many smaller grains with a size of 20–40 nm (Fig. 1b). When the pH was adjusted to 4 (Fig. 3b), it was obvious that the morphology of crystals remained unchanged, which implied the coexistence of sphere-like and octahedron-like shapes. The shapes were assembled by many rhombus-like nanoparticles, showing a faceted morphology.31 Small particles have high surface energy and the nanoparticles quickly aggregate together to reduce the energy.32,33 Upon further addition of NaOH to the solution (pH = 5), the morphologies of the obtained crystals all converted into octahedral shapes (Fig. 3c). At pH = 7, most of the octahedral shapes become larger and some even combination of polyhedral structures (Fig. 3d). The schematic of the morphological evolution can be seen in Fig. 3e.
 | ||
| Fig. 3 SEM images of Sr2YF7 crystals prepared at different pH values: (a) pH = 3, (b) pH = 4, (c) pH = 5, and (d) pH = 7. Schematic of the morphological evolution (e). | ||
By continuously increasing the pH value, abnormal phase transition occurs and the resulting product consists of many smaller nanoparticles forming irregular aggregations. Thus, we can infer that various pH values are the key elements influencing the morphology and phase of the final products. During the synthetic process, F− ions are released from the hydrolysis of NaBF4:
| BF4− + 3H2O → 3HF + F− + H3BO3 |
 | ||
| Fig. 4 XRD patterns of Sr2YF7:6% Ln3+. | ||
The doped Ln3+ ions indeed make some subtle differences in the host.37 This is the reason that the obtained monodisperse spheres of Sr2YF7 in the presence of 6% doped Ln3+ ions become bigger from La3+ to Dy3+ (Fig. 5). Once the lanthanide dopants from La3+ to Dy3+ with a radius ranging from 1.1 Å to 0.97 Å were mixed into the crystal lattice of Sr2YF7, the size of the Sr2YF7 microspheres composed of nanoparticles was remarkably changed with an average diameter ranging from 300 nm to 600 nm (Fig. S1†). In fact, the substitution of Y3+ ions with Ln3+ ions with a larger radius could decelerate the anisotropic crystalline growth, and the electron charge density of surface relevantly increases, which can substantially slow the diffusion rate of F− ions towards the surface of the rare-earth fluoride crystal nuclei as a result of charge repulsion.28,39
 | ||
| Fig. 5 SEM images of Sr2YF7 doped with different Ln3+ ions: (a) 6% La3+, (b) 6% Ce3+, (c) 6% Pr3+, (d) 6% Sm3+, (e) 6% Gd3+ and (f) Dy3+, respectively. | ||
3.2. Luminescence properties
After investigating the effect of pH values and doped Ln3+ ions on the morphology and phase of the Sr2YF7 host, it was reported that Sr2YF7 is an excellent host to contain various rare earth ions for rich luminescence. Herein, we are devoted to the DS/UC luminescence properties including Dy3+, Tb3+ and Eu3+ single-doped, Tb3+/Eu3+, Yb3+/Er3+ and Yb3+/Tm3+ co-doped and Yb3+/Er3+/Tm3+ tri-doped in the Sr2YF7 host. We used solid samples for all the luminescence measurements at room temperature.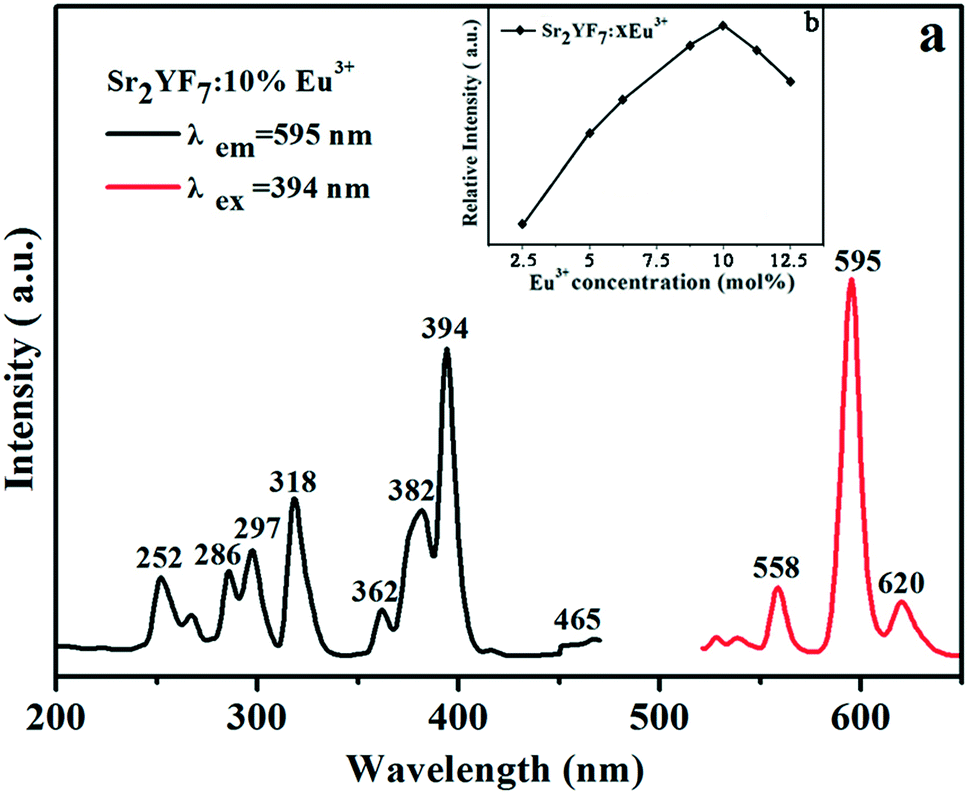 | ||
| Fig. 6 PL excitation (left) and emission (right) spectra of Sr2YF7:10% Eu3+ (a) and PL emission intensity at 595 nm with different Eu3+ concentrations (b). | ||
To find the optimum doping concentration (doping concentration when the sample shows the highest emission) in Sr2YF7:Tb3+ and Sr2YF7:Dy3+, different results are given in Fig. S2.†Fig. 7A displays the PL spectra of the acquired Sr2YF7:18% Tb3+ phosphors. When monitored with the 547 nm emission of Tb3+ (5D4 → 7F5), the excitation spectrum consists of a strong band with maximum at 217 nm in the range of 200–300 nm and several weak peaks in the range of 300–400 nm, corresponding to the spin-allowed f → d transition and f → f transitions of Tb3+ ions, respectively. Under 217 nm UV excitation, the emission spectrum exhibits the 5D4 → 7Fj (j = 3, 4, 5, 6) transitions of Tb3+ ions. Four narrow peaks centered at 490 nm, 547 nm, 587 nm and 624 nm, originating from 5D4 → 7F6 (490 nm) in the blue region, 5D4 → 7F5 (547 nm) in the green region, and 5D4 → 7F4 (587 nm) and 5D4 → 7F3 (624 nm) in the red region. Apparently, the 5D4 → 7F5 transition at 547 nm is the dominant peak. For the Sr2YF7:2% Dy3+ sample (Fig. 7B), it can be easily seen that there are several sharp excitation bands at 325 nm, 350 nm, 364 nm and 388 nm, corresponding to the transitions of Dy3+ ions (6H15/2 → 6P3/2, 6P7/2, 6P5/2, 4F7/2). Upon excitation at 350 nm, the as-prepared Sr2YF7:2% Dy3+ phosphors show nearly white emission when viewed with naked eyes (illustration in Fig. 7B). The emission spectrum consists of two main peaks at 482 nm and 575 nm, which are ascribed to the magnetic dipole (4F9/2 → 6H15/2) and electric dipole transitions (4F9/2 → 6H13/2) of Dy3+ ions, respectively.42 Just like Eu3+ 5D0–7F2, the Dy3+ 4F9/2–6H13/2 emission belongs to hypersensitive transitions with ΔJ = 2, which is strongly influenced by the surrounding environment. When Dy3+ is located at a lower-symmetry local site, this emission transition will be stronger in its emission spectra.43–45 Here, the former (4F9/2 → 6H15/2) is stronger than the latter (4F9/2 → 6H13/2), indicating that Dy3+ ions are located in a high symmetrical chemical environment just like Eu3+ ions in the host.43–45
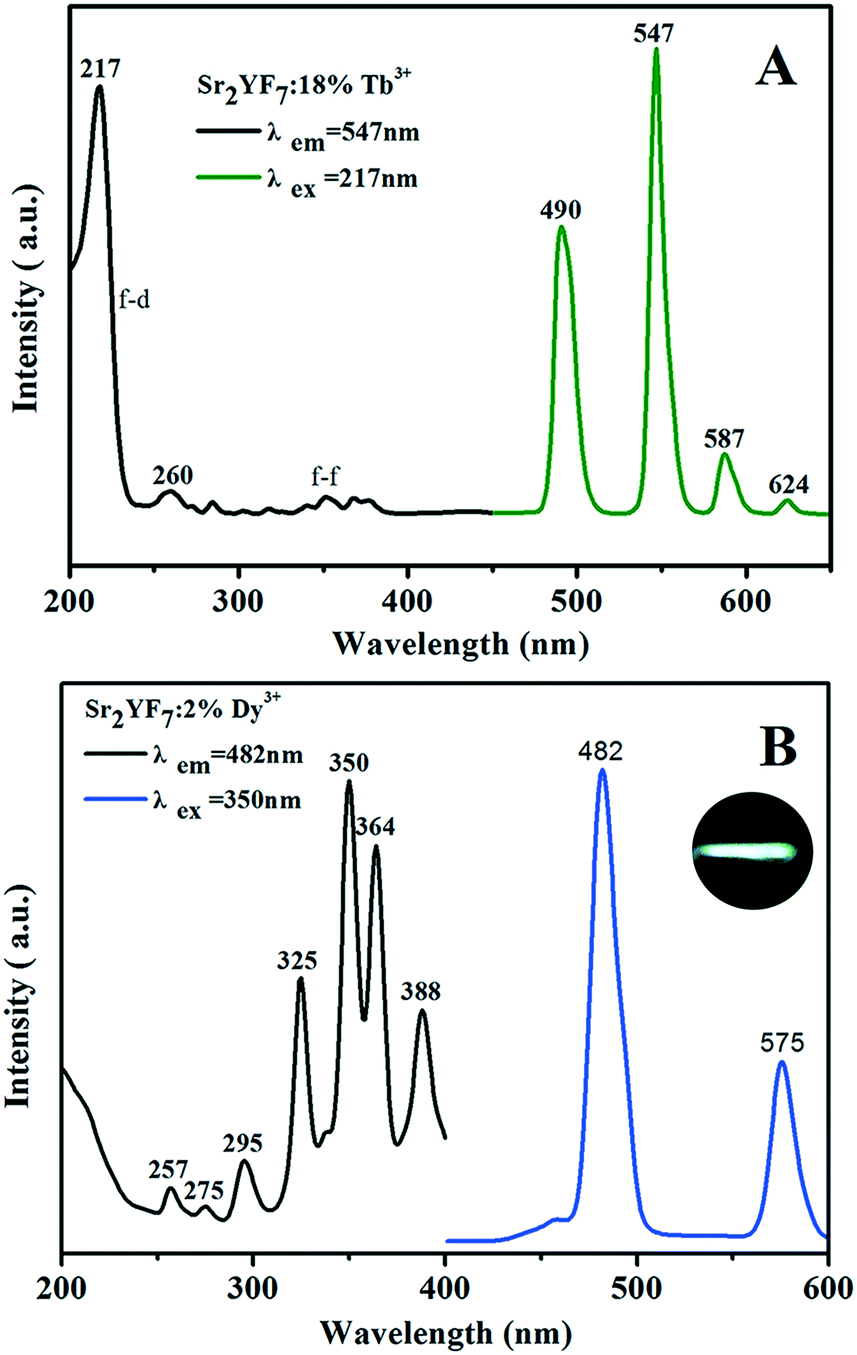 | ||
| Fig. 7 PL excitation (left) and emission (right) spectra of Sr2YF7:18% Tb3+ (A) and Sr2YF7:2% Dy3+ (B), respectively. In addition, the luminescence photo of the Sr2YF7:2% Dy3+ crystals under excitation at 350 nm UV light (illustration in B). | ||
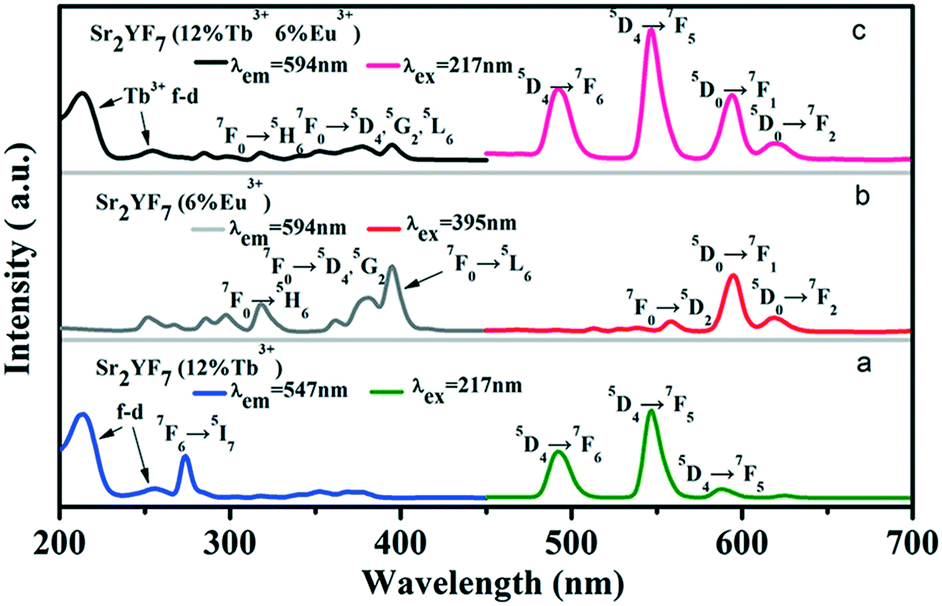
On the basis of doping Tb3+ and Eu3+ ions separately in the Sr2YF7 host, next we attempt to dope Tb3+ and Eu3+ ions simultaneously in the sample (Fig. 8). The PL spectra of Sr2YF7:12% Tb3+ (Fig. 8a) and Sr2YF7:6% Eu3+ (Fig. 8b) both contain the characteristics of Tb3+ and Eu3+ ion peaks, respectively. However, when doping 6% Eu3+ ions in Sr2YF7:12% Tb3+, the spectrum of Sr2YF7:12% Tb3+/6% Eu3+ sample presents significant difference, as shown in Fig. 8c. Under monitoring at 594 nm of Eu3+ ions in Fig. 8c, the main excitation peaks are just like that in Fig. 7a except from a few weak transition lines of Eu3+ ions at 318 nm (7F0 → 5H6), 362 nm (7F0 → 5D4), 382 nm (7F0 → 5G2) and 394 nm (7F0 → 5L6), respectively. It is worthwhile to notice that the co-doped emission spectrum (λex = 217 nm) consists of not only the narrow peaks of Tb3+ ions at 490 nm (5D4 → 7F6) and 547 nm (5D4 → 7F5) but also the narrow peaks of Eu3+ ions at 594 nm (5D0 → 7F1) and 620 nm (5D0 → 7F2). Analyzing the results shown in Fig. 8c, the presence of the excitation bands and lines of Tb3+ (217 nm) in the excitation spectrum monitored with Eu3+ emission (594 nm) clearly indicates that an energy transfer has occurred from Tb3+ to Eu3+ in the Sr2YF7:12% Tb3+/6% Eu3+ sample.46–51 Since excited at 217 nm of Tb3+, the emission spectrum also exists the peaks of Eu3+ ions centered at 594 and 620 nm besides the peaks of Tb3+ ions, also suggesting clearly that the energy transfer from Tb3+ to Eu3+ has occurred in the Sr2YF7:12% Tb3+/6% Eu3+ sample.46–51
 | ||
| Fig. 8 PLE and PL spectra of Sr2YF7:12% Tb3+ (a), Sr2YF7:6% Eu3+ (b) and Sr2YF7:12% Tb3+/6% Eu3+ (c) crystals. | ||
As we all know, the acceptor has no influence on the decay time of a donor when the radiative energy transfer processes are dominating in certain materials. However, the acceptor has a great influence on the decay time of a donor when the nonradiative energy transfer processes are dominating. With the increase in the concentration of acceptors, the decay time of the donor decreases gradually. Similar to the double exponential luminescence decay of Tb3+ in the Sr2YF7:12% Tb3+ sample, the luminescence decay curve of Tb3+ in the Sr2YF7:12% Tb3+/6% Eu3+ sample can also be well fitted into a double exponential function (Fig. 9). In addition, the life time τ for the 5D4 state of Tb3+ is determined to be 0.228 ms in the Sr2YF7:12% Tb3+/6% Eu3+ sample, which is much shorter than that in the Sr2YF7:12% Tb3+ (0.559 ms) sample. Obviously, the shortening of the life time in Sr2YF7:12% Tb3+/6% Eu3+ with respect to Sr2YF7:12% Tb3+ is due to the occurrence of the energy transfer from Tb3+ to Eu3+ in the former sample.46–51
 | ||
| Fig. 9 Decay curves for the luminescence of Tb3+ in Sr2YF7:12% Tb3+ and T Sr2YF7:12% Tb3+/6% Eu3+, respectively. | ||
 | ||
| Fig. 10 UC emission spectra of Sr2YF7:x% Yb3+/1% Er3+ (A) and Sr2YF7:15% Yb3+/y% Tm3+ (B) under 980 nm excitation, respectively. | ||
After a range of experiments about Sr2YF7:Yb3+/Er3+ and Sr2YF7:Yb3+/Tm3+ products, we observed that Sr2YF7:15% Yb3+/0.5% Er3+ phosphors showed yellow light with a CIE color coordinate of (0.3705, 0.3835) and Sr2YF7:15% Yb3+/0.5% Tm3+ showed blue light with a CIE color coordinate of (0.1612, 0.0961) in Fig. 11A-a and b, respectively. According to the color superposition principle, it is very possible to obtain UC white light by adjusting the appropriate doping content of Yb3+/Er3+/Tm3+ ions in the Sr2YF7 host. To prove our conjecture, a series of attempts were made next. First, we have synthesized Sr2YF7:15% Yb3+/0.5% Er3+/0.5% Tm3+ nanocrystals based on the previous reports.55 It can be noted that the emission spectrum of the Sr2YF7:15% Yb3+/0.5% Er3+/0.5% Tm3+ sample (Fig. 11A-c) is composed of peaks at 465 nm and 476 nm due to the 1D2 → 3F4 and 1G4 → 3H6 transitions of Tm3+ ions in the blue region, green emissions at 522 nm and 540 nm from the 2H11/2 → 4I5/2 and 4S3/2 → 4I5/2 transitions as well as red emission at 652 nm ascribed to 4F9/2 → 4I5/2 of Er3+ ions, respectively. The red emission also involved the 1G4 → 3F4 transition of Tm3+ ions at 646 nm despite its lower intensity, whose contribution in the red region can be neglected.56 In addition, the sample of Sr2YF7:15% Yb3+/0.5% Er3+/0.5% Tm3+ shows white light with pale blue when viewed with naked eyes (Fig. 11A-c).
 | ||
| Fig. 11 (A) UC PL spectra of Sr2YF7:Yb3+/Er3+/Tm3+ and their corresponding luminescence photos under 980 nm excitation; (B) intensity ratios of RGB for the group c/d/e A; and (C) CIE chromaticity coordinates of group a/b/e in A. | ||
It is well known that Yb3+ ions play an important role in sensitizing Er3+/Tm3+ ions because of their larger absorption cross section at around 980 nm and longer excited state lifetime. The energy transfer generates as a result of the spectral overlap between the emission 2F5/2 → 2F7/2 of Yb3+ ions and the absorption 4I11/2 → 4I15/2 of Er3+ ions as well as the absorption 3H5 → 3H6 of Tm3+ ions. As for Sr2YF7:Yb3+/Er3+, first of all, the photons are mostly absorbed by Yb3+ ions under excitation at 980 nm. It further transfers the energy to Er3+ ions to the 4F7/2 level, which then relax to 2H11/2, 4S3/2 and 4F9/2 levels by nonradiative relaxation. At last, the energy in these levels return to the ground state, resulting in green emissions at 522 nm and 540 nm (2H11/2 → 4I5/2, 4S3/2 → 4I5/2) and red emission at 652 nm (4F9/2 → 4I5/2). With respect to Sr2YF7:Yb3+/Tm3+, it has been proved that the energy transfer process between Yb3+ ions and Tm3+ ions is the three-photon process. First, the photons can be absorbed by the 2F5/2 level of Yb3+. Then, the nonresonant ET1 takes place to excite Tm3+ ions into the excited states 3H5, relaxing subsequently to the 3F4 state. The 3F4 level of Tm3+ is excited into 3F2 and 3F3 levels by nonresonant ET2 process, and then Tm3+ ions return to the 3H6 state. Finally, the nonresonant ET3 populates the 1G4 level, which emits 474 nm (1G4 → 3H6) and 650 nm (1G4 → 3F4). The detailed energy level diagrams about Sr2YF7:Yb3+/Er3+, Yb3+/Tm3+ and Yb3+/Er3+/Tm3+ are illustrated in Fig. 12.
 | ||
| Fig. 12 Energy level diagrams of the Yb3+, Er3+ and Tm3+ ions as well as the proposed UC mechanisms. | ||
The key to acquire the pure white light is properly enhancing the relative intensity of red emission.12 The reduction of the green to red (G/R) ratio mainly concerns two energy transfer processes. One is the energy transfer from Er3+ ions to Yb3+ ions, resulting in the decrease of green (2H11/2, 4S3/2 → 4I5/2) emissions. Another is the transfer energy from excited Yb3+ ions to Er3+ ions, which can directly populate the 4F9/2 level originating from 2F5/2(Yb3+) + 4I13/2(Er3+) → 2F7/2(Yb3+) + 4F9/2(Er3+). However, some energy transfer processes between Er3+ ions and Tm3+ ions might also work in the complex system as follows: 3H4(Tm3+) + 4I13/2(Er3+) → 3H6(Tm3+) + 4S3/2(Er3+); 1G4(Tm3+) + 4I15/2(Er3+) → 3F4(Tm3+) + 4F9/2(Er3+). The ultraviolet emission is hardly detected in a tri-doped Sr2YF7 system according to the available conclusion.10 In addition, the intensity ratios of the red to the green (R/G) emission increases gradually upon decreasing Tm3+ ions. Therefore, we conceived the idea of averaging the dopant concentrations of Er3+ ions and Tm3+ ions to obtain white light. The up-conversion emission spectra of Sr2YF7:Yb3+/Er3+/Tm3+ crystals with various concentrations of Er3+ and Tm3+ ions are shown in Fig. 11A-c–e. The relative intensity ratios of RGB were calculated by integral area of red band, green band and blue band from spectra.57 From the corresponding information illustrated in Fig. 11B, we can directly observe the ratios of red band, green band and blue band of group c, d and e. The R/G ratio increases from 1 to 1.35 (inset of Fig. 11B). Ultimately, the target products Sr2YF7:15% Yb3+/0.4% Tm3+/0.3% Er3+ generate ideal UC white light, whose CIE color coordinate was calculated to be (0.3123, 0.3005) under a 980 nm pump with a power density of about 2 W cm−2, as displayed in Fig. 11C (point e).
Conclusion
In summary, uniform and monodisperse Sr2YF7 spherical crystals have been successfully synthesized via a facile one-step hydrothermal route without any surfactant. We found that the pH values can change the morphology from spherical to octahedral shape and the various doped Ln3+ ions are beneficial to form different sizes of crystals ranging from 300 to 600 nm. The obtained Sr2YF7:Ln3+ (Ln = Dy, Tb, Eu, Tb/Eu, Yb/Er, Yb/Tm and Yb/Er/Tm) crystals show multicolor DS/UC luminescence properties. The energy transfer from Tb3+ ions to Eu3+ ions was observed in the Sr2YF7 host; the Sr2YF7:0.5% Dy3+ crystals show the nearly white emission under UV excitation at 217 nm; the ideal UC white light-emitting tri-doped Sr2YF7:15% Yb3+/0.4% Er3+/0.3% Tm3+ with a CIE color coordinate of (0.3123, 0.3005) was prepared under 980 nm excitation. In view of their simple production route and good properties, the Sr2YF7:Ln3+ materials may have potential applications in lighting, display devices and biological imaging.Conflicts of interest
There are no conflicts of interest to declare.Acknowledgements
This project is financially supported by the National Undergraduate Training Program for Innovation and Entrepreneurship of Southwest University, China (201710635040).Notes and references
- P. Du, X. Huang and J. S. Yu, Chem. Eng. J., 2018, 337, 91–100 CrossRef CAS.
- S. Sivakumar, F. C. J. M. van Veggel and M. Raudsepp, J. Am. Chem. Soc., 2005, 127(36), 12464–12465 CrossRef CAS.
- X. Chen, D. F. Peng, Q. Ju and F. Wang, Chem. Soc. Rev., 2015, 44, 1318–1330 RSC.
- X. Hu, J. Gong, L. Zhang and J. C. Yu, Adv. Mater., 2008, 20(24), 4845–4850 CrossRef CAS.
- Y. Zhang, X. J. Li, Z. Y. Hou and J. Lin, Nanoscale, 2014, 6, 6763–6771 RSC.
- R. P. Cao, C. L. Liao, F. Xiao, G. T. Zheng, W. Hu, Y. M. Guo and Y. X. Ye, Dyes Pigm., 2018, 574–580 CrossRef CAS.
- F. W. Kang, H. S. Zhang, L. Wondraczek, X. B. Yang, Y. Zhang, D. Y. Lei and M. Y. Peng, Chem. Mater., 2016, 28(8), 2692–2703 CrossRef CAS.
- M. Wang, C. C. Mi, W. X. Wang, C. H. Liu, Y. F. Wu, Z. R. Xu, C. B. Mao and S. K. Xu, ACS Nano, 2009, 3, 1580–1586 CrossRef CAS.
- C. J. Boyer, F. Vetrone, A. L. Cuccia and A. J. Capobianco, J. Am. Chem. Soc., 2006, 128, 7444–7445 CrossRef.
- Y. H. Yang, D. T. Tu, W. Zheng, Y. S. Liu, P. Huang, E. Ma, R. F. Li and X. Y. Chen, Nanoscale, 2014, 6, 11098 RSC.
- F. Auzel, Chem. Rev., 2004, 104, 139–174 CrossRef CAS.
- B. Zhao, D. Y. Shen, J. Yang, S. S. Hu, X. J. Zhou and J. F. Tang, J. Mater. Chem. C, 2017, 5, 3264–3275 RSC.
- Y. S. Liu, D. T. Tu, H. M. Zhu and X. Y. Chen, Chem. Soc. Rev., 2013, 42, 6924 RSC.
- L. Xu, J. Shen, C. Lu, Y. Chen and W. Hou, Cryst. Growth Des., 2009, 9, 3129–3136 CrossRef CAS.
- Y. J. Ding, X. Teng, H. Zhu, L. L. Wang, W. B. Pei, J. J. Zhu, L. Huang and W. Huang, Nanoscale, 2013, 5, 11928 RSC.
- Z. Wang, J. Hao and H. L. W. Chan, J. Mater. Chem., 2010, 20, 3178 RSC.
- M. Haase and H. Schafe, Angew. Chem., Int. Ed., 2011, 50, 5808 CrossRef CAS.
- G. Wang, Q. Peng and Y. Li, Acc. Chem. Res., 2011, 44, 322 CrossRef CAS.
- F. Wang, Y. Han, C. S. Lin, Y. Lu, J. Wang, J. Xu, H. Chen, C. Zhang, M. Hong and X. Liu, Nature, 2010, 463, 1061 CrossRef CAS.
- B. Y. Chen, B. Dong, J. Wang, S. Zhang, L. Xu, W. Yu and S. W. Song, Nanoscale, 2013, 5, 8541 RSC.
- Z. L. Qiu, J. Shu and D. P. Tang, Anal. Chem., 2018, 90(1), 1021–1028 CrossRef CAS.
- Y. Zhang, D. L. Geng, X. J. Kang, M. M. Shang, Y. Wu, X. J. Li, H. Z. Lian, Z. Y. Cheng and J. Lin, Inorg. Chem., 2013, 52(22), 12986–12994 CrossRef CAS.
- V. Mahalingam, F. Vetrone, R. Naccache, A. Speghini and J. A. Colloidal Capobianco, Adv. Mater., 2009, 21, 4025 CrossRef CAS.
- Q. Liu, Y. Sun, T. S. Yang, W. Feng, C. G. Li and F. Y. Li, J. Am. Chem. Soc., 2011, 133, 17122 CrossRef CAS.
- Z. G. Xia, P. Du and L. B. Liao, Phys. Status Solidi, 2013, 210(9), 1734–1737 CrossRef CAS.
- M. Ma, C. F. Xu, L. W. Yang, Q. B. Yang and J. G. Lin, J. Alloys Compd., 2012, 525, 97–102 CrossRef CAS.
- L. W. Han, S. S. Xie, M. Wang, T. M. Sun, Q. Liu, G. Q. Jiang, Y. J. Shi and Y. F. Tang, Mater. Lett., 2019, 241–244 CrossRef CAS.
- Y. Ai, D. T. Tu, W. Zheng, Y. S. Liu, J. T. Kong, P. Hu, Z. Chen, M. D. Huang and X. Y. Chen, Nanoscale, 2013, 5, 6430–6438 RSC.
- A. Escudero, E. Moretti and M. Ocaña, CrystEngComm, 2014, 16, 3274–3283 RSC.
- J. Yang, Z. W. Quan, D. Y. Kong, X. M. Liu and J. Lin, Cryst. Growth Des., 2007, 7(4), 730–735 CrossRef CAS.
- X. D. Feng, Dean C. Sayle, Zhong Lin Wang, M. Sharon Paras, Brian Santora and A. C. Sutorik, Science, 2006, 312(5579), 1504–1508 CrossRef CAS.
- C. X. Li, Z. W. Quan, P. P. Yang, S. S. Huang, H. Z. Lian and J. Lin, J. Phys. Chem. C, 2008, 112, 13395 CrossRef CAS.
- R. Q. Li, L. L. Li, W. W. Zi, J. J. Zhang, L. Liu, L. C. Zou and S. C. Gan, New J. Chem., 2015, 39, 115–121 RSC.
- B. Zhao, D. Y. Shen, J. Yang, S. S. Hu, X. J. Zhou and J. F. Tang, J. Mater. Chem. C, 2017, 5, 3264–3275 RSC.
- M. Wang, Q. L. Huang, J. M. Hong, X. T. Chen and Z. L. Xue, Cryst. Growth Des., 2006, 6, 2169 CrossRef CAS.
- X. Wang and Y. Li, Angew. Chem., Int. Ed., 2002, 41, 4790–4793 CrossRef CAS.
- D. Q. Chen and Y. S. Wang, Nanoscale, 2013, 5, 4621–4637 RSC.
- H. Cao, B. Xia, N. Xu and C. Zhang, J. Alloys Compd., 2004, 376(1–2), 282–286 CrossRef CAS.
- Y. S. Liu, D. T. Tu, H. M. Zhu and X. Y. Chen, Chem. Soc. Rev., 2013, 42, 6924 RSC.
- B. Zhao, L. Yuan, S. S. Hu, X. M. Zhang, X. J. Zhou, J. F. Tang and J. Yang, CrystEngComm, 2016, 18, 8044 RSC.
- F. F. Chi, X. T. Wei, Y. G. Qin, F. Li, Y. H. Chen, C. K. Duan and M. Yin, Phys. Chem. Chem. Phys., 2017, 19, 12473–12479 RSC.
- D. L. Geng, M. M. Shang, D. M. Yang, Y. Zhang, Z. Y. Cheng and J. Lin, J. Mater. Chem., 2012, 22, 23789–23798 RSC.
- M. Yu, J. Lin, Z. Wang, J. Fu, S. Wang, H. J. Zhang and Y. C. Han, Chem. Mater., 2002, 14, 2224–2231 CrossRef CAS.
- J. Yang, C. X. Li, Z. W. Quan, C. M. Zhang, P. P. Yang, Y. Y. Li, C. C. Yu and J. Lin, J. Phys. Chem. C, 2008, 112, 12777–12785 CrossRef CAS.
- X. F. Xu, J. X. Zhao, H. Feng, Z. C. Gao, L. Guan, Y. Yang, F. H. Wang, D. W. Wang and X. Li, J. Lumin., 2020, 226, 117356 CrossRef CAS.
- J. Yang, C. M. Zhang, C. X. Li, Y. N. Yu and J. Lin, Inorg. Chem., 2008, 47(16), 7262–7270 CrossRef CAS.
- Y. N. Mao, L. Jiang, R. Ye, J. Yang and S. S. Hu, CrystEngComm, 2020, 22, 564–572 RSC.
- W. P. Xia, Y. F. Zhang, J. Xiong, S. S. Hu, J. Yu, Y. F. Zhang, Y. X. Wan and J. Yang, CrystEngComm, 2019, 21, 339–347 RSC.
- L. Zhou, J. Yang, S. S. Hu, Y. Luo and J. Yang, J. Mater. Sci., 2015, 50, 4503–4515 CrossRef CAS.
- S. Li, N. Guo, Q. M. Liang, Y. Ding, H. T. Zhou, R. Z. Ouyang and W. Lü, Spectrochim. Acta, Part A, 2018, 190, 246–252 CrossRef CAS.
- H. L. Li, G. X. Liu, J. X. Wang, X. T. Dong and W. S. Yu, J. Lumin., 2017, 186, 6–15 CrossRef CAS.
- E. J. Reszczyńska, T. Grzyb, J. W. Sobczak, W. Lisowski, M. Gazda, B. Ohtani and A. Zaleska, Appl. Catal., B, 2015, 163, 40–49 CrossRef.
- M. K. Gnanasammandhan, N. M. Idris, A. Bansal, K. Huang and Y. Zhang, Nat. Protoc., 2016, 11, 688–713 CrossRef CAS.
- J. Xie, J. X. Bin, M. Guan, H. K. Liu, D. X. Yang, J. G. Xue, L. B. Liao and L. F. Mei, J. Lumin., 2018, 200, 133–140 CrossRef CAS.
- H. L. Qiu, G. Y. Chen, L. Sun, S. W. Hao, G. Han and C. H. Yang, J. Mater. Chem., 2011, 21, 17202 RSC.
- J. Yang, C. M. Zhang, C. Peng, C. X. Li, L. L. Wang, R. T. Chai and J. Lin, Chem. – Eur. J., 2009, 15, 4649–4655 CrossRef CAS.
- Q. B. Wu, S. T. Lin, Z. X. Xie, L. Q. Zhang, Y. N. Qian, Y. D. Wang and H. Y. Zhang, Appl. Surf. Sci., 2017, 424, 164–169 CrossRef CAS.
Footnote |
| † Electronic supplementary information (ESI) available. See DOI: 10.1039/d0ce00280a |
| This journal is © The Royal Society of Chemistry 2020 |