
 Open Access Article
 This Open Access Article is licensed under a
 Creative Commons Attribution 3.0 Unported Licence
Designing yield stress fluids for advanced materials processing using derivatives of pH-responsive branched co-polymer surfactants†
Emma L.
Jones
 ab,
Zhidong
Luo
b,
Rishav
Agrawal
b,
Sean
Flynn
b,
Megan
Carr
c,
Will
Sharratt
b and
Esther
García-Tuñón
*bc
ab,
Zhidong
Luo
b,
Rishav
Agrawal
b,
Sean
Flynn
b,
Megan
Carr
c,
Will
Sharratt
b and
Esther
García-Tuñón
*bc
aThe Leverhulme Research Centre for Functional Materials Design, UK
bSchool of Engineering, University of Liverpool, UK. E-mail: egarciat@liverpool.ac.uk
cMaterials Innovation Factory, University of Liverpool, UK
First published on 16th April 2025
Abstract
Through careful formulation design from a structure–properties perspective, this work demonstrates the potential of pH-responsive branched co-polymer surfactants (BCSs) in emulsion engineering and advanced materials processing. A library of BCS derivatives, with controlled spatial distribution of hydrogen bonding motifs and different branching levels, is synthesised via a modified Strathclyde method with varying conditions in solids content and PEGMA chain length. High dilution during the co-polymerisation leads to linear co-polymers, while an increase of monomers concentration favours branching reactions. This diverse set of BCSs can be exploited to stabilise pH-responsive suspension and emulsions containing activated charcoal (AC) or strontium titanate (STO) to create an array of yield stress soft materials. Large amplitude oscillatory shear (LAOS) experiments reveal their diverse rheological properties and yielding behaviours, that correlate primarily with powders properties and concentration, the degree of branching of BCS macromolecules, and to some extent, with the PEGMA length or BCS molecular weight. Based on the rheological characterisation, two formulations are selected and optimised for direct coagulation casting of AC suspensions and direct ink writing (DIW) of STO to create macroscopic structures. The optimised STO emulsion gels for DIW show a dramatic shift in printing behaviour before and after triggering the pH-controlled assembly. LAOS analyses using Fourier-transform (FT) rheology and the sequence of physical processes (SPP) confirm that the pH triggered assembly of STO emulsion gels results in the transition from a stable microstructure that shows a smooth flow transition, to an aggregated and unstable microstructure that becomes easily disrupted under shear. The higher harmonics and SPP analysis enable the correlation of yielding and printing behaviours. Overall, the findings highlight the critical role that BCSs play in providing electro-steric stabilisation of suspensions and emulsion gels in the processing of advanced materials. Combining polymer chemistry, formulation design and rheology, we optimise responsive formulations to create complex macroscopic structures with hierarchical features.
1 Introduction
Developing reliable and tunable processing strategies is key to expand the range of advanced materials (e.g. ceramics,1,2 2D materials,3,4 perovskites,5 and porous organic cages6 to name a few) that can be used in engineering solutions to issues such as the climate crisis and the rollout of alternative renewable energy sources. The ability to process these materials while preserving their functional properties is crucial to their application.1 The choice of additives (e.g. surfactants, rheology modifiers, dispersants, flocculants and curing agents) incorporated in formulations to aid processing should not limit nor damage the functional performance. An ideal formulation is simple, non-toxic (water-based) and with a minimal amount of additives to achieve the required rheology and processability. This is of particular importance in the processing of materials that must undergo drying and sintering post-processing steps without compromising their properties due to binders removal.7,8Surfactants are key additives in formulations, where their amphiphilic nature enables a “plethora” of solution-processed applications through the stabilisation of hydrophobic nanomaterials in water.7–10 Surfactants with chemical moieties able to undergo reversible changes in response to external stimuli are particularly promising to precisely control both interfacial and bulk solution behaviours.11–13 These surfactants enable formulation of “smart” systems such as emulsions14,15 nanoparticles12 and emulsified suspensions10,16 that aid the facile processing of advanced materials through the design of complex fluids with tunable rheology.17–19 In these systems, triggering a change in the surfactant structure, conformation or charge by modifying the pH, ionic strength or exposing to light, for example, can lead to significant yet reversible changes in formulation properties.
Branched co-polymer surfactants (BCSs), a class of stimuli-responsive macromolecular amphiphiles,14,15,20 have been previously investigated for their use as drug delivery systems, facilitated by their pH-mediated switchable behaviour. BCSs are synthesised through free radical polymerisation (Strathclyde methodology) of poly(ethylene glycol)methacrylate (PEGMA), methacrylic acid (MAA) and ethylene glycol dimethacrylate (EGDMA) primary chains capped with hydrophobic DDT chain ends.20 These BCSs undergo on-demand pH-triggered destabilisation of oil-in-water emulsions,14 or assembly into structured, gel-like soft solids.15 This responsive behaviour has been shown to be driven by a more complex process involving polymer restructuring, and at least two types of inter-polymer interactions.21
Owing to their controlled aggregation, BCSs have been exploited as multi-functional additives (e.g. stabilising, binding and as rheology modifiers) for ceramics and graphene based materials.10,16,17 At high pH, BCS provides electro-steric stabilisation of ceramic particles (and other materials) in water that show nearly Newtonian or slightly viscoelastic behaviour. When triggering the assembly through a pH-switch below the pKa, particles and/or droplets form a physical gel with elasto-visco-plastic behaviours.16 The responsive behaviour of BCSs can be exploited to design complex (yield stress) fluids19 for advanced materials fabrication methods, for example in casting and direct ink writing (DIW). DIW requires careful design and understanding of soft materials with specific rheological properties and yielding behaviours.22,23
Here we first produce and examine a library of BCS derivatives (BCSdev) using modifications to the original BCS Strathclyde methodology by carrying out co-polymerisations of PEGMA macromonomers with different chain lengths and dilution conditions (from 10 to 50 wt% solids, Section 3.1). The subtle differences in co-polymer composition and topology are then exploited to formulate two materials as model systems, activated charcoal (AC) and strontium titanate (STO). AC is studied as the “stretch” material based on its limited water-processability. STO is chosen as a model ceramic oxide with functional properties in photo-catalytic applications.
Using BCS derivatives to stabilise and control the aggregation of AC suspensions and STO emulsions, we systematically investigate the properties of the resultant library of yield stress fluids using oscillatory rheology (Section 3.2). The results from this “scouting” study using large amplitude oscillatory shear (LAOS)24 inform the selection of two final formulations with potential for casting (AC, Section 3.3.1) and DIW (STO, Section 3.3.2).
Using transient data collection, complementary mathematical frameworks (Fourier-transform rheology,25,26 and the sequence of physical processes, SPP27–29) this work provides a quantitative comparison of STO formulations’ non-linearities, yielding processes and flow instabilities before and after aggregation driven by the pH-responsive behaviour. The elastic Lissajous–Bowditch plots, G′, G′′,  and the dissipation ratio (ϕ)30 show distinctive trends that correlate with printing resolution.23
Bringing together polymer chemistry, formulation design, complex fluids and rheology, this work provides a multi-disciplinary approach to design DIW ceramic feedstocks, and to study the underlying structure–rheology relationship that impact the shape fidelity that can be achieved during the DIW process. These findings open up new opportunities to fabricate hierarchical structures using functional materials.
2 Materials and methodologies
2.1 Reagents and materials
Poly(ethylene glycol)methyl ether methacrylate (PEGMA, average Mn 950 g mol−1, 500 g mol−1 or 350 g mol−1), methacrylic acid (MAA), ethylene glycol dimethacrylate (EGDMA), 1-dodedanethiol (DDT), tetramethylsilane (TMS), glucono-δ-lactone (GdL), dodecane, deuterated methanol (MeOD), and sodium nitrate (NaNO3) were purchased from Sigma Aldrich and used as received. Azobis(isobutyronitrile) (AIBN) was purchased from Sigma Aldrich and recrystalised from methanol (MeOH) prior to use. Activated charcoal (AC) powders were purchased from Sigma Aldrich and milled with ceramic milling balls for 24 hours prior to use. Strontium titanate (SrTiO3; STO) micropowders were purchased from Alfa Aesar and milled with ceramic milling balls for 24 hours prior to use. Ethanol (EtOH), methanol and petroleum ether, purchased from Fischer Scientific, were of standard laboratory grade. Sodium hydroxide (NaOH) and 37% hydrochloric acid (HCl) were purchased from Fisher Scientific and diluted in deionised H2O to produce 0.1 M and 1.0 M stock solutions of each. Pluronic® F-127 was purchased from Sigma Aldrich and dissolved in distilled H2O to yield a 25 wt% stock solution. This stock was stored in a refrigerator at ≈4 °C.2.2 Analytical techniques
1H nuclear magnetic resonance (NMR) spectra of the BCSs synthesised in this work were recorded in MeOD using a Bruker Avance spectrometer operating at 400 MHz. Chemical shifts (δ) are reported in parts per million (ppm) and TMS was used as an internal standard for 1H NMR spectra. All NMR spectra were analysed using TopSpin 3 (Bruker, licensed to the University of Liverpool).Triple detection size exclusion chromatography (TD-SEC) was performed using a Malvern OMNISEC resolve/reveal system equipped with refractive index, viscometry and dual-angle light scattering detectors; a mobile phase of water, MeOH (20 v/v%), sodium nitrate (0.05 M) and NaOH (0.004 M) were employed with a flow rate of 0.8 mL min−1; two Viscotek GMPWXL columns and an additional guard column were used with an oven temperature of 40 °C to determine the molar mass, molar mass distribution and Mark–Houwink α values. Aqueous pullulan and dextran solutions were used for universal calibration. The results for each co-polymer are given as an average with errors given as standard deviation from the mean.
pH measurements were taken with a SevenCompact S220 pH/Ion meter with InLab Expert Pro-ISM probe, calibrated daily using pH 4, 7 and 10 buffer solutions.
2.3 Synthesis of “original” BCS
The following procedure describes a typical synthesis of a branched co-polymer surfactant (BCS, that corresponds to sample L1 in this work) targeting a 1![[thin space (1/6-em)]](https://www.rsc.org/images/entities/char_2009.gif) :1 stoichiometric molar ratio of methacrylic acid (MAA) to ethylene glycol (EG) units as described by Woodward et al. using the Strathclyde methodology, DDT-p(PEGMA0.5-co-MAA9.5-co-EGDMA1.0).14 PEGMA (Mn = 950 g mol−1, 0.500 g, 0.53 mmol, 0.5 eq.), MAA (0.861 g, 10.00 mmol, 9.5 eq.), EGDMA (0.209 g, 1.05 mmol, 1.0 eq.), DDT (0.213 g, 1.05 mmol, 1.0 eq.), AIBN (0.009 g, 0.05 mmol, 0.5 eq.) and ethanol (EtOH, 16.121 g, 90 wt% w.r.t. total mass) were added to an oven dried round bottomed flask. The flask was sealed and purged with N2 for 30 minutes before the addition of TMS (0.2 mL, stored under N2). The flask was heated to 70 °C and stirred for 48 hours. The reaction was quenched by rapid cooling to 0 °C in an ice bath. Aliquots (ca. 100 μL) prior to and post reaction (t0 and tf, respectively) were taken for 1H NMR analysis. The solution was dried in vacuo before redissolution in minimal EtOH and precipitated into cold petroleum ether twice to yield a viscous, opaque oil. The polymer was dried in vacuo at 40 °C for 24 hours and characterised via1H NMR and TD-SEC. Syntheses were completed in triplicate to verify the reliability before larger scale syntheses were performed for complex fluid formulation.
:1 stoichiometric molar ratio of methacrylic acid (MAA) to ethylene glycol (EG) units as described by Woodward et al. using the Strathclyde methodology, DDT-p(PEGMA0.5-co-MAA9.5-co-EGDMA1.0).14 PEGMA (Mn = 950 g mol−1, 0.500 g, 0.53 mmol, 0.5 eq.), MAA (0.861 g, 10.00 mmol, 9.5 eq.), EGDMA (0.209 g, 1.05 mmol, 1.0 eq.), DDT (0.213 g, 1.05 mmol, 1.0 eq.), AIBN (0.009 g, 0.05 mmol, 0.5 eq.) and ethanol (EtOH, 16.121 g, 90 wt% w.r.t. total mass) were added to an oven dried round bottomed flask. The flask was sealed and purged with N2 for 30 minutes before the addition of TMS (0.2 mL, stored under N2). The flask was heated to 70 °C and stirred for 48 hours. The reaction was quenched by rapid cooling to 0 °C in an ice bath. Aliquots (ca. 100 μL) prior to and post reaction (t0 and tf, respectively) were taken for 1H NMR analysis. The solution was dried in vacuo before redissolution in minimal EtOH and precipitated into cold petroleum ether twice to yield a viscous, opaque oil. The polymer was dried in vacuo at 40 °C for 24 hours and characterised via1H NMR and TD-SEC. Syntheses were completed in triplicate to verify the reliability before larger scale syntheses were performed for complex fluid formulation.
2.4 Synthesis of BCS derivatives
A library of water-soluble BCS derivatives was synthesised via DDT-mediated free radical co-polymerisations of MAA, PEGMA and EGDMA using slight modifications to the method described in Section 2.3.20 Initial polymer syntheses (S1, M1 and L1, Table 1) varied PEGMA chain lengths (number average molecular weights Mn, of 300, 500 and 950 g mol−1) and therefore in co-monomer distributions within BCS primary chains, whilst limiting chain branching at high-dilution in line with previously reported BCS syntheses.14,15 BCS co-polymerisations were conducted using comparable initial molar ratios of the bifunctional comonomer, EGDMA, to chain transfer agent, DDT ([EGDMA]0/[DDT]0 = 0.90–1.09). To achieve an equimolar ratio of hydrogen bond donor and acceptor units,15 all polymer syntheses targeted equimolar ratios of MAA and PEG repeat units in the resulting BCS; this required targeting initial MAA to PEGMA molar ratios in Table 1 when using PEGMA macromonomers with Mn values of 950, 500 and 300 g mol−1 respectively. Conversion and concentration ratios were determined from 1H NMR as explained in the ESI† (Fig. S1 and S2).
| Polymer | 1H NMR (MeOD) | |||||
|---|---|---|---|---|---|---|
| BCSdev | Mon. conc. (wt%) | Formula |
|
|
|
Conversion (%) |
| L1 | 10 | DDT-P(PEGMA0.5-co-MAA8.4-EGDMA1.1) | 11.4 | 0.90 | 0.056 | 83.1 |
| L3 | 30 | DDT-P(PEGMA0.5-co-MAA8.8-EGDMA1.0) | 12.3 | 0.94 | 0.054 | 99.7 |
| L5 | 50 | DDT-P(PEGMA0.5-co-MAA8.4-EGDMA0.9) | 11.8 | 0.83 | 0.056 | 99.9 |
| M1 | 10 | DDT-P(PEGMA1.0-co-MAA8.3-EGDMA1.0) | 14.0 | 1.09 | 0.108 | 91.7 |
| M3 | 30 | DDT-P(PEGMA1.0-co-MAA7.4-EGDMA0.9) | 12.1 | 0.96 | 0.118 | 97.7 |
| M5 | 50 | DDT-P(PEGMA1.0-co-MAA7.7-EGDMA0.7) | 12.0 | 0.82 | 0.114 | 99.4 |
| S1 | 10 | DDT-P(PEGMA2.0-co-MAA6.8-EGDMA1.0) | 12.3 | 1.05 | 0.226 | 99.8 |
| S3 | 30 | DDT-P(PEGMA2.0-co-MAA7.0-EGDMA1.0) | 11.2 | 0.96 | 0.223 | 100 |
| S5 | 50 | DDT-P(PEGMA2.0-co-MAA7.4-EGDMA0.8) | 11.4 | 0.81 | 0.213 | 100 |


2.5 Powders characterisation
Particle sizing was conducted on a Malvern Mastersizer 3000 fitted with a HydroMV dispersion unit via static laser light scattering. Sizes were calculated as the average of 3 samples, each with 10 measurements taken, with errors given as the standard deviation from the mean.Water contact angle (WCA) determination was performed using a Kruss DSA100E Dynamic Shape Analyser from sessile droplets at room temperature on an 8 mm pellet formed from dry material. The baseline was fitted manually, and the angle determined using a Young–Laplace fitting method. For BCS-stabilised samples, glass slides were coated in a small amount of each suspension and allowed to dry overnight under IR irradiation.
Brunauer–Emmett–Teller (BET). Surface area isotherms were generated in triplicate using a Micromeritic 3-Flex 3500 multi-port high throughput gas adsorption analyser. Errors are given as the standard deviation from the mean.
Scanning electron microscopy (SEM) imaging was performed on a Hitachi S-4800 SEM. Samples were mounted on aluminium SEM stubs using a carbon tape and edges painted with PELCO conductive silver paint. These samples were subsequently coated with chromium in a Q150T Plus sputter coater for 90 seconds.
Results for activated charcoal (AC, Fig. S4 and S5, ESI†) and strontium titanate (STO, Fig. S6 and S7) are included in the ESI.†
2.6 Formulation process
BCS powders for each BCS derivative were dispersed in distilled water using NaOH 1 M to adjust the pH to 7.5 until a transparent, homogeneous stock solution was obtained. Stock solutions for the “scouting” study in Section 3.2 contained 1.2 wt% BCS w.r.t. the stock solution volume. STO optimised formulations for DIW were prepared with a 2 wt% BCS stock solution. These were subsequently used as a base to prepare a library of formulations containing activated charcoal (AC) or strontium titanate (SrTiO3, STO). Each powdered material (AC and STO) was fully characterised both pre and post-milling to ensure that there was no significant differences in the chemistry, structure, or purity as a result of the milling process (Fig. S4–S7, ESI†). The details for each formulation and corresponding rheological metrics are included in Table 3.:decane volume rations of 60:40. Emulsification conditions were fixed at 24000 rpm for 2 min.
AC suspensions could not be emulsified to produce stable formulations. This is likely due to the presence of large particles with irregular shapes. AC suspensions were directly assembled (without the emulsification step) to study their rheology and shaping ability (Sections 4 and 5 respectively).
2.7 Rheological measurements
A strain controlled rheometer ARES G2 (TA Instruments) has been used for all the rheological measurements with slightly different settings for the “scouting” study in Section 3.2, and the advanced characterisation performed on selected DIW formulations in Section 3.4.In large amplitude oscillatory shear (LAOS) measurements, an oscillatory input strain is applied on the material, and the resultant output stress is measured for every prescribed strain amplitude. A wide range of strain amplitude values (γ0, between 0.01% and 500%) enable us to investigate the structure deformation from small amplitude oscillatory shear (SAOS) to LAOS.24 The ARES G2 rheometer and the TRIOS software allow to collect the strain amplitude sweep data in either correlation mode or transient mode. The former provides the first-harmonic moduli, G′, G′′ and the latter provides the raw strain/stress waveforms.
Preliminary LAOS tests were performed for all formulations (Table 3) to study the behaviour of each BCS derivative within our library and to compare the resultant properties of each formulation. These “scouting” LAOS tests were performed using the correlation data collection option in the TRIOS software and a 40 mm cross hatched/stainless steel serrated upper parallel plate fitted with a solvent trap. Water was placed at the top of the geometry within the rim to ensure that drying was minimised during the data collection. An exponential closure profile was set to minimise altering the structure of the sample prior measurement. The gap was set at 1 mm and the temperature fixed at 25 °C. Strain amplitude values (γ0) ranged between 0.01% and 500%, with a fixed oscillation frequency of 0.5 Hz. The first-harmonic moduli, G′, G′′ are given by the TRIOS software.
STO formulations for DIW (Section 3.4) are compared using LAOS analysis on transient data (raw signals),23 collected for 3 cycles of oscillation for every strain amplitude at a frequency of 1024 points per cycle. The measurement gap was 1 mm, using 40 mm stainless steel sandblasted parallel plates with a solvent trap. The temperature was maintained at 23 °C using a Peltier plate. Drying was prevented by placing a thin layer of low viscosity oil at the edge of the sample.
LAOS analyses are widely use to characterise yield stress fluids (e.g. BCSs,20 branched polymer melts,31 and DIW22). The analysis of LAOS transient data is carried out using existing mathematical frameworks: Fourier-transform (FT) rheology,25,26 and the sequence of physical processes (SPP).27 These complementary frameworks provide valuable insights on the underlying yielding process and its role in printing performance.23 These mathematical frameworks are explained in more detail in the ESI† and previous publications.23,25,27 From these analyses we determine characteristic rheological metrics for each STO formulation: storage and loss moduli (G′ and G′′ respectively), stress value at the onset of non-linearities (σnl) and the relative intensity of the third w.r.t. the first harmonic I3/I1 obtained through the FT analysis, stress overshoot or maximum stress value in the amplitude sweep (σmax), stress value at the moduli crossover (flow stress, σf, G′ = G′′), and the dissipation ratio (ϕ,30 eqn (S3) in ESI†). Elastic Lissajous–Bowditch (LB) curves (σ/σ0vs. γ/γ0) are used to present the raw data. The SPP inter-cycle trajectories are presented in Cole–Cole plots  in Section 3.4.
2.8 Casting and direct ink writing (DIW)
AC suspensions (1 wt% BCS-M3 and 12 vol% AC powders w.r.t. water volume) were directly poured into moulds (coated with a thin layer of grease to facilitate de-moulding) with different shapes immediately after adding GδL (2 wt% w.r.t. total volume) to trigger particle assembly. The samples were left to dry under ambient conditions, which led to even shrinking. Once dry, samples were easily detached from the walls and de-moulded.STO formulations for DIW (2 wt% BCS-L5 and 47 vol% AC powders w.r.t. water volume, emulsified with NR–decane with a 60:40 ratio, Table 3) were prepared using sieved (raw) STO powders. DIW is carried out using a custom built robocaster6,23 with three individual syringe plungers connected to linear actuators driven by an Aerotech A3200 machine controller using G-code. Selected STO emulsified suspensions (BCSL5-STO 47 vol% suspension emulsified with 40 vol% decane (60:40 ratio) at 24000 rpm for 2 min) at different pH values (≈11 and 3 respectively) are carefully loaded into a 5 mL syringe (Nordson, EFD) with a spatula to avoid air bubbles being trapped inside. Desired 3D printed parts are designed using the software RoboCad (v5, by 3D Inks, Oklahoma) that generates the G-code for the Aerotech motion composer. The parts are printed straight onto acrylic or alumina substrates using stainless steel nozzles with a tip diameter of 0.51 mm. Printing settings were optimised for each STO formulation to achieve a continuous filament,32 with extrusion (Ve) and motion (Vm) velocities of 1.2 and 1 mm s−1 respectively for the sample at pH ≈ 11, and 1.5 and 1 mm s−1 at pH ≈ 3. Once a printed part is completed, it is left to dry at room temperature ≈22 °C for 48 hours. The DIW set up is equipped with an in situ-visualisation system FLIR Blackfly S-BFS-U3-32S4M with a Nikon 35 mm f/2 wide-angle lens to record at 10 fps at 3.14 MP resolution.
2.9 Fluorescence microscopy and image analysis
47-STO BCSL5 emulsions were prepared using 40 mL decane dyed with 1 mL of ethanol-Nile red (NR) stock solution (1 mg mL−1) used as fluorescent probe. Images were taken using an Olympus IX73 inverted microscope with LED fluorescence excitation light source (CL-pE300lite-DC-SB), DP75 camera and filter sets optimised for TRED (exciter: 540 to 580 nm, beam splitter: 600 nm, barrier: 620 to 650 nm).Image analysis to determine droplet size was conducted either directly on fluorescence microscopy images, and indirectly through pore size measurement from SEM images. The latter were analysed by randomly measuring the longest inner diameters of 100 pores (reported as mean value and standard deviation in this manuscript).
3 Results and discussion
3.1 Library of BCS derivatives
Using a modified free radical polymerisation method,14 enabled us to synthesise a library of BCS (Fig. 1) derivatives. Varying the monomer concentration (between 10 and 50 wt%) and the chain length of PEGMA macromonomers (with labels: S, M and L-series) enabled the manipulation of co-polymer composition and topology.33 Co-polymers with a wide range of molecular weights and branched architectures (Tables 1 and 2) provide a degree of control over the properties of pH-responsive emulsions and emulsified suspensions.20 | ||
| Fig. 1 (a) Free radical polymerisation scheme using a modification of the Strathclyde method to produce BCS derivatives in this work. (b) Illustrated representation of a BCS macromolecule, where DDT, PEGMA, MAA and EGDMA monomers are represented schematically and pictorially. | ||
| Polymer | TD-GPC/SEC (MeOH/H2O) | ||||
|---|---|---|---|---|---|
| BCSdev | Mon. conc. (wt%) | Formula | M w (g mol−1) | M n (g mol−1) | Đ |
| L1 | 10 | DDT-P(PEGMA0.5-co-MAA8.4-EGDMA1.1) | 24700 |
12700 |
1.94 |
| L3 | 30 | DDT-P(PEGMA0.5-co-MAA8.8-EGDMA1.0) | 64500 |
21500 |
2.99 |
| L5 | 50 | DDT-P(PEGMA0.5-co-MAA8.4-EGDMA0.9) | 749000 |
80500 |
10.96 |
| M1 | 10 | DDT-P(PEGMA1.0-co-MAA8.3-EGDMA1.0) | 40000 |
19900 |
2.01 |
| M3 | 30 | DDT-P(PEGMA1.0-co-MAA7.4-EGDMA0.9) | 169300 |
36700 |
4.62 |
| M5 | 50 | DDT-P(PEGMA1.0-co-MAA7.7-EGDMA0.7) | 876700 |
115700 |
7.59 |
| S1 | 10 | DDT-P(PEGMA2.0-co-MAA6.8-EGDMA1.0) | 67200 |
21400 |
3.16 |
| S3 | 30 | DDT-P(PEGMA2.0-co-MAA7.0-EGDMA1.0) | 75300 |
33100 |
2.26 |
| S5 | 50 | DDT-P(PEGMA2.0-co-MAA7.4-EGDMA0.8) | 655100 |
89300 |
7.34 |
700 and 67200 g mol−1 for L1 and S1 respectively, Table 2). Therefore, these co-polymers (S1, M1 and L1) may perhaps be better described as linear or cyclised co-polymer surfactants (LCS).
 | ||
| Fig. 2 (a) Overlaid TD-SEC chromatograms showing the refractive index (RI) signal against the retention volume (mL) for co-polymers synthesised at high dilution (10 wt% monomers concentration, L1, M1 and S1). Traces with broad mono modal peaks are associated with linear or cyclised co-polymers. (b) Overlaid TD-SEC chromatograms for the L-series (L1, L3 and L5) showing a considerable broadening of the traces when monomer concentration increases up to 50 wt% (for L5), which evidences an increase in branching. | ||
 | ||
| Fig. 3 Schematic representations of the proposed structures for the library of BCS derivatives synthesised in this work. High-dilution co-polymerisation (10 wt% monomers concentration) results in linear polymers (S1, M1 and L1) that are likely cyclised with a globular structure. As the monomers concentration increases, the degree of branching also increases, with an average of two primary chains for the co-polymers made at 30 wt%, 4 (S5), and 6 (M5 and L5) for those synthesised at 50 wt%. The vinyl repeat units per chain end (DDT) is very similar for all co-polymers ≈11–12. | ||
The absence of branching in M1 and L1 co-polymerisations (involving PEGMA950 and PEGMA500 macromonomers) could be attributed to remaining pendant vinyl groups at monomer conversions below 95%. However, the absence of high molecular weight branched species in S1 co-polymerisation (PEGMA300, which achieved >99% vinyl conversion and thus consumed the vast majority of pendant vinyl groups) indicates that another factor is responsible for the suppression of branching reactions. It is known that high dilution can also suppress branched co-polymer formation by selectively promoting the consumption of pendant vinyl groups through intramolecular cyclisation reactions over intermolecular branching.36,37
Increasing the PEGMA length provides a way to control the spatial distribution of hydrogen bond donor and acceptor motifs throughout BCSs macromolecular structures. This is because we fix an equimolar PEGMA to MAA ratio in the synthesis of BCS with different PEGMA lengths (PEGMA950, PEGMA500 and PEGMA300), and the relative PEG content in each PEGMA monomer decreases with chain length (w.r.t. the monomer molas mass, 0.89, 0.80 and 0.66 respectively). Longer PEGMA monomers (L-series) provide fewer side chains sparely distributed in the co-polymer architecture, while short PEGMA monomers (S-series) can provide more and evenly distributed side chains (Fig. 3). The formation of linear BCS analogues (LCS) at high-dilution, provides an opportunity to evaluate the role of co-polymer topology in the LAOS fingerprints of BCSdev formulations (in Sections 3.2 and 3.4).
With the simultaneous modification of both, solids content and PEGMA length, the [EGDMA]0/[DDT]0 ratio at which the mixture reaches the percolation threshold varies for each derivative (Table 1). The shift in gelation threshold is expected in line with other methods such as transfer-dominated branching radical telomerisation (TBRT).41 For medium and short PEGMA chains at high dilution (S1 and M1, at 10 wt% solids), the [EGDMA]0/[DDT]0 ratios that were accessible before gelation are 1.09 and 1.05 respectively (Table 1), in agreement with other reports using the Strathclyde method. As the solids content increases, co-polymerisations at [EGDMA]0/[DDT]0 = 1 for the three PEGMA macromonomers at 50 wt% solids, and for PEGMA950 at 30 wt%, led to gel formation (due to the prevalence of excessive branching reactions). The [EGDMA]0/[DDT]0 ratio needs to drop below 1 for 30 wt% solids and under 0.85 for 50 wt% (Table 1). Adjusting this ratio enables the isolation of soluble BCSdev with different PEGMA chains (S, M and L) and dilution conditions (Table 1).
Vinyl conversions for M3 and S3 co-polymerisations (conducted at 30 wt% solids and [EGDMA]0/[DDT]0 = 0.96) reach values ≥98% (Table 1), which are above the threshold for branching reactions. However, TD-SEC results show that dispersity values, Đ, vary for different PEGMA macromonomers at 30 wt% solids (4.62 and 2.26 for M3 and S3 respectively, Table 2). The RI traces for M3 and S3 also show consistent differences in branching extent and molecular weight distribution (e.g. M3 co-polymers are branched with a wide distribution, Table 2 and Fig. S3, ESI†). This is likely due to the inherent variation in the weight fraction of the PEG substituent, which has a considerable impact on branched co-polymer formation.35,42
Adjusting the [EGDMA]0/[DDT]0 ratio to 0.94 when conducting the co-polymerisation with PEGMA950 at 30 wt% solids resulted in the formation of a soluble BCSdev (L3, Tables 1 and 2). The reactions conducted at 50 wt% solids required greater reductions of the [EGDMA]0/[DDT]0 ratio to avoid the formation of cross-linked gelled networks due to extensive branching. By reducing this ratio down to 0.81–0.83 it was possible to form soluble BCSdev derivatives (L5, M5 and S5 in Tables 1 and 2) at 50 wt% solids for the three PEGMA macromonomers. Increasing the monomers concentration up to 50 wt% leads to higher molecular weights (Table 2) with broader distributions (Fig. 2 and Fig. S3, ESI†). For example, despite reducing the [EGDMA]0/[DDT]0 ratio from 1.09 to 0.82, the Mn increases from 19900 g mol−1 for M1 to 115700 g mol−1 for M5 as the monomers concentration increases from 10 to 50 wt% (Table 2). The increase in both, molecular weight and dispersity, Đ, are characteristic of branched co-polymer formation.43
Considering that LCS co-polymers S1, M1 and L1, resemble the primary chains of the analogous branched species S5, M5 and L5 (formed at higher reaction concentrations), we can estimate the average number of primary chains per BCSdev (by dividing Mn values by that of the equivalent LCS, e.g. for M3:  ). M1, M3 and M5 contain ≈1, 2 and 6 primary chains respectively (L1, L3 and L5 show the same trends and values, Fig. 3).
Tuning the reaction conditions of the Strathclyde synthesis, enables the production of new pH responsive co-polymers containing systematic variations in spatial distribution of hydrogen bonding motifs and macromolecular topology (Fig. 3). The subtle changes in co-polymer structure can be exploited in the formation and yielding of hierarchical self-assemblies containing droplets, particles, or both.
3.2 BCS-derivatives as formulation additives to create yield stress fluids
The pH-responsive behaviour of BCSs has been exploited in drug delivery and to control the assembly of oil/water emulsions15 and emulsified ceramic suspensions,10,16 thus enabling the processing of advanced materials (Al2O3, SiC,44 and graphene oxide17). BCS derivatives (S, M and L series) can aid the processing of AC and STO in water and decane:water emulsions. Each formulation shows distinctive LAOS fingerprints (Fig. S4–S7, ESI†), which serve as a first screening to select promising formulations for further study. The following rheological indicators suggest that the material exhibits a yield stress without structural disruption in the solid-to-liquid transition: (1) a minimal or absent stress overshoot in the flow transition region (or no apparent signs of structural disruption), (2) values >10 kPa (measure of material strength), (3) σf > 100 Pa (or “yield stress”), (4) and FTI−1 → 1 (measure of the extent of the flow transition region) (Table 3).
 (w.r.t. a G′ value within the LVR, taken at γ0 = 0.05%)
| Formulation |
|
γ nl (%) | σ nl (Pa) | γ max (%) | σ max (Pa) | γ crossover (%) | σ crossover (Pa) | FTI−1 (σnl/σcrossover) | FTImax−1 (σnl/σmax) | |
|---|---|---|---|---|---|---|---|---|---|---|
| a Stress overshoot in the σ0vs. γ0 plot only takes place in one of the runs. b Selected formulations for Section 3.3. | ||||||||||
| L-series | 12-AC L3 | 5700 ± 100 | 0.15 ± 0.01 | 8 ± 1 | 2 | 25 ± 2 | 10 ± 5 | 20 ± 1 | NA | 0.3 ± 0.0 |
| 12-AC L5 | 2300 ± 700 | 0.19 ± 0.03 | 3 ± 1 | 3 ± 1 | 13 ± 3 | 10 ± 1 | 10 ± 2 | NA | 0.3 ± 0.1 | |
| 47-STO L3 | 101800 ± 30800 |
0.07 ± 0.01 | 56 ± 8 | NA | NA | 22 ± 2 | 276 ± 44 | 0.2 ± 0.1 | NA | |
| 47-STO L5 | 73600 ± 20900 |
0.13 ± 0.06 | 83 ± 15 | NA | NA | 20 ± 1 | 450 ± 230 | 0.2 ± 0.1 | NA | |
| M-series | 12-AC M1 | 44700 ± 13600 |
0.12 ± 0.01 | 46 ± 11 | 3 ± 1 | 250 ± 40 | 12 ± 6 | 147 ± 16 | NA | 0.1 ± 0.0 |
| 12-AC M3 | 11900 ± 1100 |
0.24 ± 0.04 | 26 ± 2 | NA | NA | 3 ± 1 | 50 ± 3 | 0.5 ± 0.0 | NA | |
| 12-AC M5 | 48900 ± 7800 |
0.24 ± 0.01 | 11 ± 2 | 2.4 ± 0.1 | 22 ± 4 | 2.8 ± 0.3 | 22 ± 4 | NA | 0.5 ± 0.0 | |
| 47-STO M1 | 105900 ± 17200 |
0.07 ± 0.01 | 77 ± 7 | NA | NA | 13 ± 3 | 308 ± 6 | 0.3 ± 0.0 | NA | |
| 47-STO M3 | 50200 ± 9100 |
0.13 ± 0.02 | 64 ± 1 | NA | NA | 16 ± 1 | 225 ± 24 | 0.3 ± 0.0 | NA | |
| 47-STO M5 | 23300 ± 2800 |
0.39 ± 0.0 | 89 ± 11 | NA | NA | 14 ± 2 | 280 ± 40 | 0.3 ± 0.0 | NA | |
| S-series | 12-AC S1 | 58700 ± 1100 |
0.11 ± 0.01 | 87 ± 40 | 5 ± 1 | 510 ± 320 | 20 ± 8 | 212 ± 88 | NA | 0.2 ± 0.0 |
| 12-AC S3 | 7800 ± 800 | 0.11 ± 0.01 | 7 ± 1 | 1.2 ± 0.1 | 17 ± 1 | 2.0 ± 0.2 | 16 ± 1 | NA | 0.4 ± 0.0 | |
| 12-AC S5 | 7500 ± 1500 | 0.07 ± 0.0 | 16 ± 5 | 2 ± 0 | 23 ± 0 | 2.7 ± 0.2 | 31 ± 8 | NA | 0.5 ± 0.0 | |
| 47-STO S1 | 40300 ± 2700 |
0.07 ± 0.0 | 28 ± 2 | NA | NA | 9 ± 2 | 133 ± 4 | 0.2 ± 0.0 | NA | |
| 47-STO S3 | 24600 ± 1300 |
0.09 ± 0.01 | 23 ± 1 | 6 ± 1 | 115 ± 1 | 12 ± 1 | 108 ± 2 | NA | 0.2 ± 0.0 | |
| 47-STO S5 | 31600 ± 4800 |
0.08 ± 0.01 | 25 ± 6 | 14 ± 1 | 117 ± 14 | 14 ± 4 | 132 ± 18 | NA | 0.2 ± 0.0 | |
| DIW | 47-STO L5(2) | 483500 ± 53000 |
0.10 ± 0.02 | 460 ± 130 | 3 ± 1 | 1820 ± 570 | 4 ± 1 | 1670 ± 450 | NA | 0.3 ± 0.0 |
| pH ≈ 11 | ||||||||||
| DIW | 47-STO L5(2) | 481100 ± 207700 |
0.12 ± 0.03 | 570 ± 360 | 1.5 ± 0.4 | 1300 ± 820 | 8 ± 2 | 650 ± 270 | NA | 0.4 ± 0.0 |
| pH ≈ 3 | ||||||||||
The LAOS fingerprints for all AC-BCSdev formulations show that PEGMA side chain length and branching degree result in different yielding behaviours. AC formulations prepared with the linear or cyclised analogues (LCS, from co-polymerisations at 10 wt% solids, AC-S1 and AC-M1) show type I behaviour24 and a stress overshoot in the flow transition region (between the end of the LVR and the moduli cross-over, G′ = G′′). The storage and loss moduli show a considerable standard deviation in this region (Fig. 4a and Fig. S8a, ESI†), with a noticeable stress maximum (σmax) in the σ0vs. γ0 plot (Fig. 4c and Fig. S8c, ESI†). Large uncertainty and stress overshoots are associated with microstructure disruption and flow instabilities.22 AC-S1 and M1, both exhibit a narrow linear viscoelastic region (LVR), and high G′ and G′′ values, with stress overshoots of ≈250 and 500 Pa respectively. These overshoots (σmax) take place at small strain amplitudes (≈3 and 5% for AC-M1 and S1 respectively, Table 3). Considering only characteristic values at the moduli-crossover could be misleading and result in the underestimation of σcrossover and the flow transition index, FTI−1 (that provides a measure of the extent of the flow transition region and flowability).23,45 When a stress overshoot takes place before the moduli crossover, σmax should be used as a point of reference, to define the flow transition region and the FTI−1 (Table 3).22 An abrupt yielding would correspond to FTI−1 → 1, while FTI−1 → 0 corresponds to a gradual flow transition.23 The FTI−1, in isolation, has its own limitations to capture the underlying physical processes, but combined with other metrics helps capturing distinctive behaviours.23 In short, with intense stress overshoots, AC-M1 and S1 formulations would be expected to cause issues during processing.
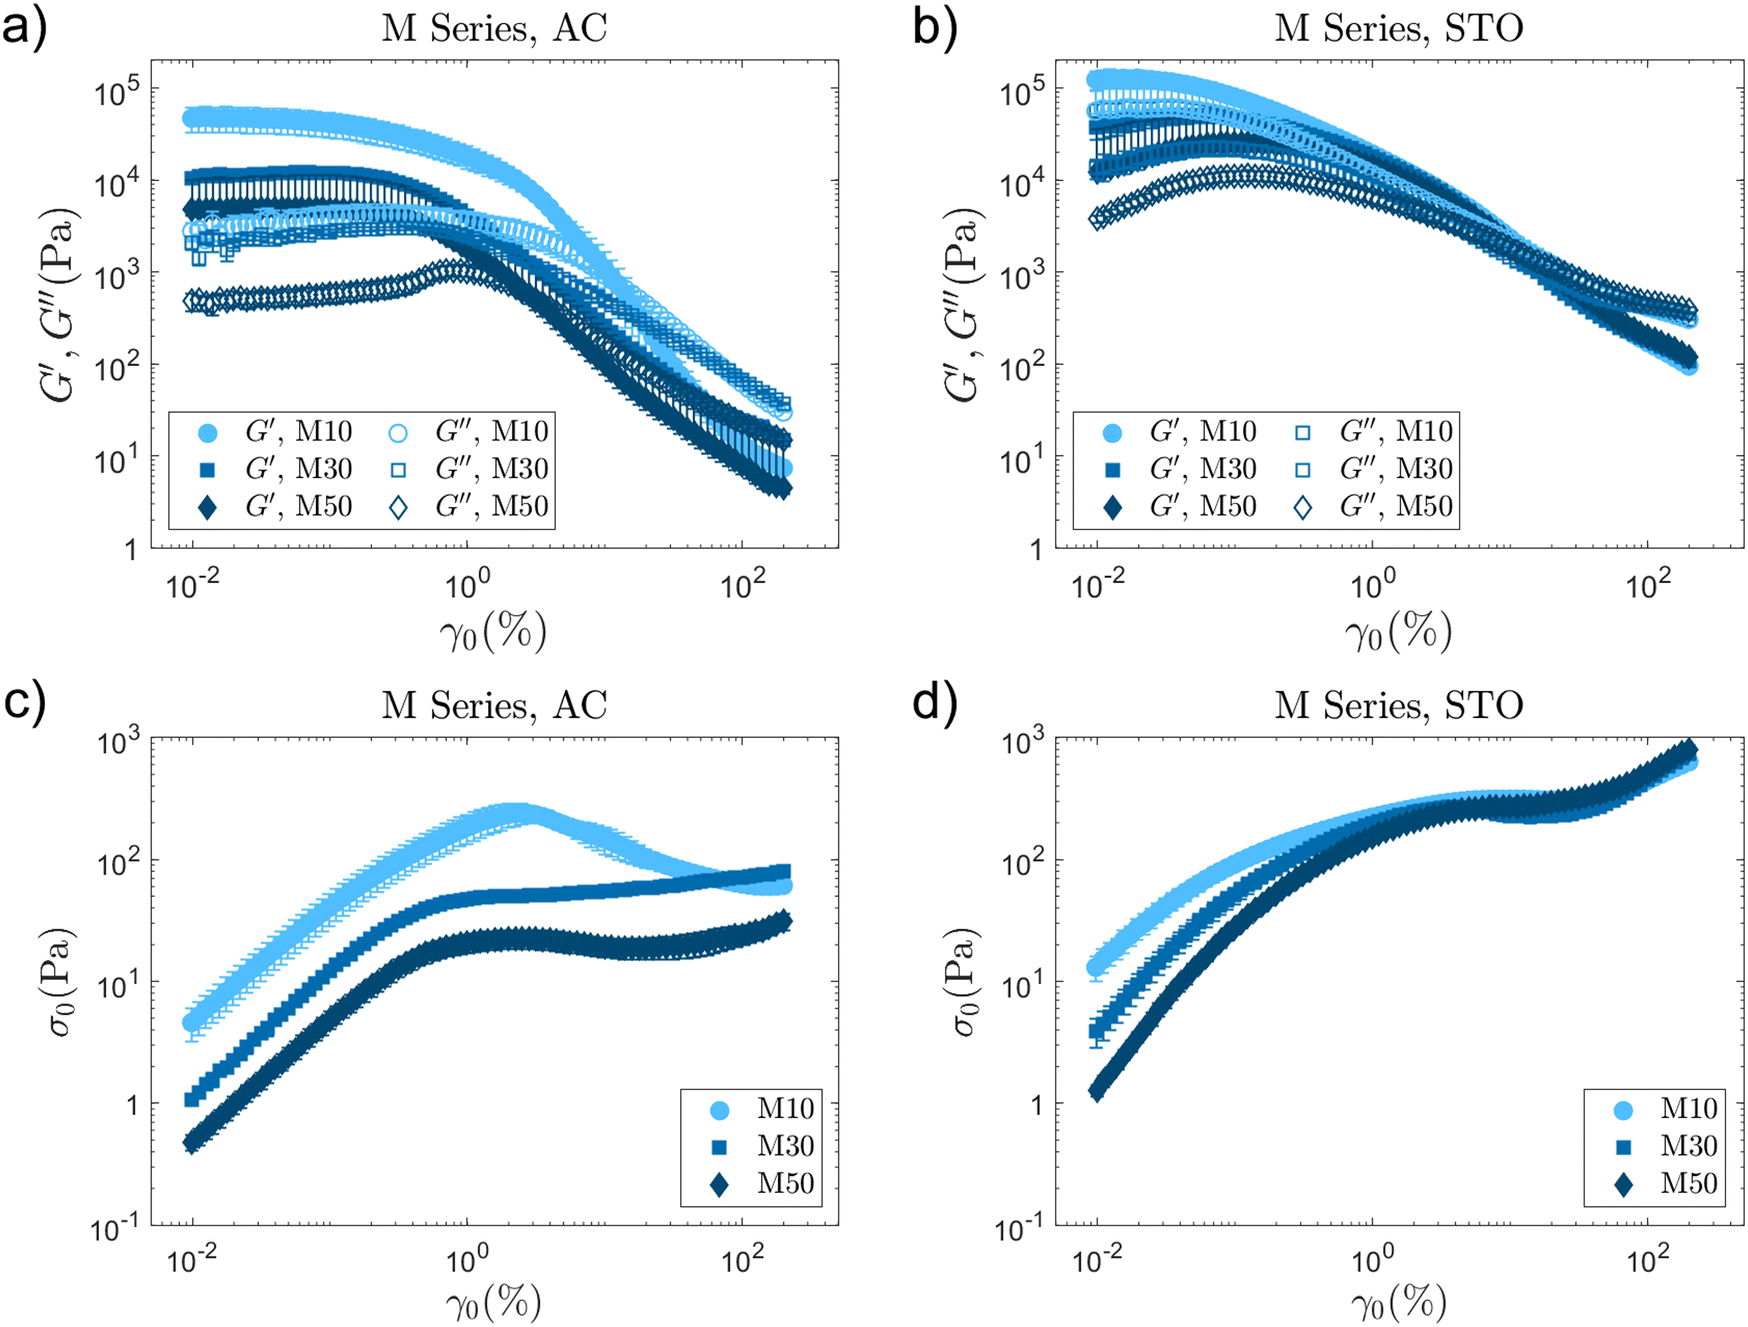 | ||
| Fig. 4 LAOS results for the M-Series BCSdev formulations for both materials, AC and STO. Graphs in (a) and (b) include the evolution of storage (G′) and loss moduli (G′′) in the amplitude sweep for AC and STO respectively. Plots in (c) and (d) show the evolution of σ0 with increasing maximum strain amplitude γ0 for AC and STO respectively. Linear co-polymer analogue (M1) combined with AC shows a characteristic overshoot in the flow transition region. STO-M series formulations show similar LAOS fingerprints with very subtle differences. | ||
LCSs fail to produce stable gels with a consistent and smooth flow transition, while any branched BCSdev (S, M and L, co-polymerised at 30 and 50 wt% solids) show similar and more reliable trends in the flow transition region (Table 3, S3, S5 (Fig. S8, ESI†), M3, M5 (Fig. 4), and L3, L5 (Fig. S9, ESI†)). Each has a well defined extensive LVR region and shows a smoother transition without intense overshoots in the σ0vs. γ0 plots.
Branched co-polymers can form soft AC gels with low stiffness and material strength.23 The 12-AC M3 sample stands out amongst the AC formulations (Table 3) without a stress overshoot in the flow transition region. It also shows a slight type III behaviour24 with a G′′ overshoot within the flow transition region just before the crossover (Fig. 4a). This overshoot is associated with the energy transitions (recoverable and unrecoverable processes) taking place during the yielding phenomenon.46 This sample with  requires relatively small stress values to enter the non-linear regime (σnl ≈ 26 Pa), which then reaches a plateau around the moduli crossover (σcrossover ≈ 50 Pa and γcrossover ≈ 3%). The results suggest that this formulation could be used for direct coagulation casting to create complex shapes through directed assembly (Section 3.3.1). The limited amount of AC powders that can be stabilised (12 vol%) results in formulations with insufficient strength for DIW.23
STO emulsified suspensions exhibit behaviours and trends that differ from those observed for AC formulations (S, M and L series in Fig. 4, Fig. S8 and S9 respectively, ESI†). This evidences that the variations in BCSdev co-polymer architecture play different roles depending on the interfaces (particles and/or droplets) that the BCSdev molecules are stabilising. The rheological properties of AC and STO formulations will vary with the nature of the interfaces involved, and the interactions that emerge between BCS molecules and those interfaces. In AC formulations, BCSdev macromolecules only interact with AC particles (large, irregular shapes, hydrophobic, with high surface area). However, in STO formulations (emulsified suspensions) there are two types of BCSdev–surface interactions, on STO particles and decane droplets. The latter provides anchoring points for the DDT chain ends in BCS molecules, thus helping with the stabilisation of the emulsion (Section 3.3).
LAOS results for STO formulations are consistent and reproducible with small standard deviations (Fig. 4b, Fig. S8b and S9b, ESI†). Most STO samples in this library do not show a stress overshoot in the flow transition region (Table 3). For each PEGMA length series (S, M and L), the branching degree does not seem to have a strong impact on formulation properties (Fig. S8b and S9b, ESI†). The σ0vs. γ0 plots also follow similar trends within each series (Fig. 4d, Fig. S8d and S9d, ESI†). However, increasing the PEGMA side chain in branched co-polymers leads to an increase of material strength, perhaps due to the ability of the branches to reach further to establish a network. The STO-L5 formulation with  and σcrossover ≈ 450 Pa meets the material strength criteria,23 thus showing potential for DIW. This formulation is further optimised and studied in Sections 3.3.2 and 3.4.
3.3 Shaping BCS-derivative formulations
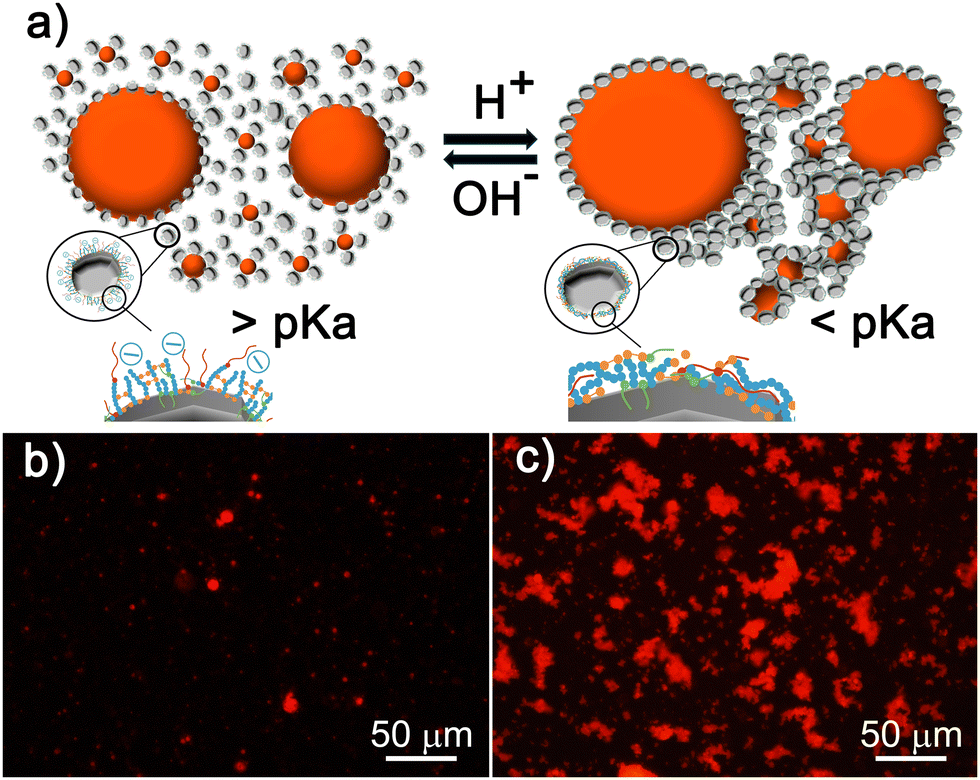
BCSs enable the controlled aggregation of decane:water emulsions (Fig. 5a).14–16 Using Nile red (NR) as a probe and fluorescence microscopy, it is possible to track the droplets and visualise changes in the microstructure due to the pH-triggered assembly (Fig. 5c and d). At pH values above the pKa, small fluorescent droplets are well dispersed in the diluted continuous phase (Fig. 5c), when dropping the pH below the pKa, the droplets assemble into clusters (Fig. 5d). This controlled aggregation is exploited to shape AC and STO in macroscopic structures through direct coagulation casting (Section 3.3.1) and DIW (Section 3.3.2). | ||
| Fig. 5 (a) Scheme illustrating the pH-responsive assembly behaviour of a decane:water emulsion, with insets showing de-protonated MAA groups at pH values above pKa, and hydrogen bond formation above the pKa. (b) Scheme of the interactions taking place between BCS-M3 and activated charcoal surfaces. (c) and (d) Fluorescence microscopy images of BCS-L5 stabilised decane droplets probed with Nile red (NR) in basic (c) and acidic (d) conditions, evidencing that the droplets assemble into clusters in an acidic environment. (e) Images of 3D parts fabricated through direct coagulation casting of an activated charcoal suspension (12-AC M3) after triggering particle assembly using GδL to lower the pH. | ||
 values. At pH values above the pKa, the PEGMA and MAA side chains provide a electro-steric barrier, while the DDT chain ends interact with hydrophobic AC surfaces (Fig. 5b), reducing the contact angle (Fig. S5, ESI†). The addition of GδL immediately prior pouring the formulation into a mould, enables to form a gel to create macroscopic structures (12-AC M3 sample). The dry gel easily detaches from the walls (Fig. 5e).
 | ||
| Fig. 6 (a) Schematic illustration of the pH-responsive behaviour of an STO emulsified suspension showing the interactions taking place between BCSs and the surfaces of STO particles and decane droplets. (b) and (c) Fluorescence microscopy images of diluted (1:100) STO emulsified suspensions at pH = 10.9 (b) and pH = 3 (c). The images evidence the responsive behaviour: above the pKa, NR-tagged oil droplets and STO particles are dispersed in the diluted continuous phase (b). At pH < pKa, the activation of hydrogen bonds leads to aggregation and cluster formation (c). | ||
 | ||
| Fig. 7 In situ-monitoring images during the DIW process and SEM images showing qualitative differences on print quality for STO formulations before (pH ≈ 11 (a)–(c)) and after (pH ≈ 3 (d)–(f)) assembly. Both formulations can be used to create 3D lattices and other shapes, however they lead to different printing resolution. The STO formulation at pH ≈ 11 (a)–(c) is printable and produces shapes that retain the pre-designed features, such as macropores in the lattice (b) and filament shape (c). However, triggering the assembly driven by hydrogen bond formation between BCS molecules (at pH ≈ 3, (d)–(f)) compromises print quality. | ||
Increasing the BCS-L5 concentration up to 2 wt% (while maintaining the other formulation parameters) leads to the formation of a gel-like soft material during the emulsification process, which can form free standing shapes. The 47-STO L5(2) formulation emulsified with a 60:40 (suspension:decane) ratio forms a physical gel owing to the interplay between surfactant and particle stabilisation.16,48,49 Although the pH-switching behaviour is not activated, BCSs molecules play a critical role facilitating the processability of STO particles through electro-steric repulsions. The combination of both (increased BCSs and high particle concentration) provide favourable conditions to achieve a very stable emulsion gel with material strength that enables 3D shaping. This gel can be directly used in DIW to produce parts with good printing resolution (Fig. 7a–c). In situ monitoring demonstrates that this formulation flows without signs of microstructure disruption at the tip and that it can be deposited to create self-supporting complex shapes (Fig. 7a and b). SEM images show that the filaments retain their shape and dimensions with good print quality (Fig. 7c).
Reducing the pH of this formulation to ≈3, either using GδL (Fig. S10, ESI†) or HCl, leads to an heterogeneous material with granular texture. In situ monitoring during the DIW process shows that this formulation does not flow steadily, showing signs of phase separation (large oil droplets), clogging, and over-extrusion that take place randomly. The unsteady flow results in poor shape fidelity (Fig. 7d and e). SEM images confirm the loss of printing resolution, with distorted filaments and pores between them (Fig. 7f). The results suggest that the pH-triggered assembly, and activation of inter-molecular hydrogen bonds, lead to the disruption of the physical gel achieved through electro-steric stabilisation at high pH. The controlled aggregation results in microstructural changes that compromise the flow behaviour. Image analysis of pore sizes in SEM images evidence that the decane droplets coalesce due to the de-stabilisation of the physical gel. By measuring the pore sizes from SEM images taken on dry samples after printing, it is possible to estimate that the average droplet size at pH ≈ 11 is ≈3 ± 1 μm, which increases up to ≈8 ± 4 μm at pH ≈ 3 due to de-stabilisation and coalescence.
Although the pH-responsive behaviour cannot be exploited exactly as expected, branched co-polymer surfactants with long PEGMA side chains can aid the formation of a physical gel for DIW. A detailed rheological analysis to compare the yielding behaviour of the 47-STO L5(2) formulation before and after controlled assembly is presented and discussed in Section 3.4.
3.4 Linking LAOS fingerprints and printing behaviour
DIW feedstocks are yield stress fluids which undergo transient yielding and re-structuring during the printing process (Fig. 8a). The material's response during the DIW process can be generally described using dimensionless groups to facilitate comparisons.50 The Deborah number (De) distinguishes the extent of a material's rheological response between viscous and elastic at a given time frame, thus De → ∞ for purely elastic solids, and → 0 for purely viscous fluids.51 The Weissenberg number (Wi) is often defined as the product of the relaxation time and the characteristic rate of deformation and can be interpreted as a measure of the strength of the flow.50 The DIW process can be described as a transition between solid-like (De↑ and Wi↓) and flowing liquid (De↓ and Wi↑) responses when the material is subjected to different strains and deformation rates (Fig. 8a). Assuming that the response of the flowing material follows a simple power-law model,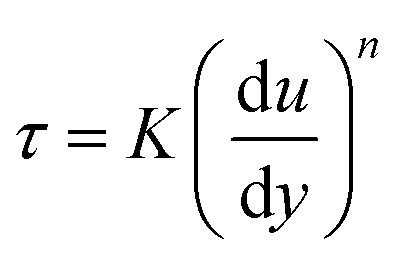 | (1) |
 , fully developed,
  , and laminar flow with very small Reynolds numbers,
  ), a simple dimensionless velocity profile can be obtained by applying a force balance or deriving a reduced form of the Hagen–Pousiuelle equation,52
 | (2) |
![[small gamma, Greek, dot above]](https://www.rsc.org/images/entities/i_char_e0a2.gif) increases considerably (Fig. 8b). In practice, extrusion flows are complex and likely heterogeneous, while the behaviour of the material should be represented using models able to capture the complex features above and below the yield stress.53,54 However, elucidating realistic processing conditions or modeling the behaviour of STO emulsion gels is beyond the scope of this manuscript. Although it is often argued that flow conditions under oscillatory tests are not representative of the DIW process, LAOS can capture distinctive behaviours, and provide results with smaller uncertainties45 to determine characteristic metrics that correlate with printing resolution.22,23
increases considerably (Fig. 8b). In practice, extrusion flows are complex and likely heterogeneous, while the behaviour of the material should be represented using models able to capture the complex features above and below the yield stress.53,54 However, elucidating realistic processing conditions or modeling the behaviour of STO emulsion gels is beyond the scope of this manuscript. Although it is often argued that flow conditions under oscillatory tests are not representative of the DIW process, LAOS can capture distinctive behaviours, and provide results with smaller uncertainties45 to determine characteristic metrics that correlate with printing resolution.22,23
 | ||
| Fig. 8 (a) Schematic of the DIW process showing the different states of the material: (1) solid state before extrusion, or above the yield stress, (2) liquid-like state during flow, or below the yield stress, and (3) solid-like state once deposited, which should be above the yield stress. The material undergoes transient and non-linear behaviours between 1 → 2, and 2 → 3. The material's properties and responses can be described using the Deborah (De) and Weissenberg (Wi) numbers.50 (b) Velocity (u, mm s−1) and shear rate (, s−1) profiles calculated for different n values assuming idealised flow conditions and a simple power law behaviour (eqn (1) and (2)). | ||
Steady shear experiments have been used to study the flow behaviour of similar DIW feedstocks.55 Other studies on ceramic emulsions for DIW focused on oscillatory tests.56 Although not commonly reported and discussed in the field, the experimental data collected in continuous shear can be unreliable for printable materials.45 Attempts to perform a continuous shear test on our STO gels (even at shear rates between 0.0001 and 1 s−1), have led to measurement issues and flow instabilities (Fig. S11, ESI†). The emulsions are expelled from the gap before a steady state can be reached, while microscopy images show shear banding and fracture (Fig. S11, ESI†). From steady shear results for the STO physical gel, it could be assumed that τdyny ≈ 350 ± 50 Pa, and the flow index n → 0. However, steady shear does not differentiate the subtleties between the two samples, with the added limitation that these results are knowingly affected by flow instabilities.
The analysis of both transient and correlation data from LAOS experiments (Section 2.7), using complementary mathematical frameworks,23,25,27,30 enables the quantification of characteristic properties ( , γnl, σnl and σcrossover), and their evolution in the flow transition region (G′, G′′, σ0,
  , ϕ). These quantitative metrics and their trends, combined with visual analysis of Lissajous–Bowditch (Fig. 11) and Cole–Cole plots (Fig. 12), are able to capture distinctive features of the underlying yielding process for each STO formulation (before and after aggregation).
 | ||
| Fig. 9 LAOS results. G′, G′′ and σ0 evolution with increasing strain amplitude γ0 for the 47-STO L5(2) emulsified suspensions before (a) and after (b) pH-triggered aggregation (with pH values of ≈11 and 3 respectively). The graphs include results from correlation (calculated by the TRIOS software, filled symbols) and transient measurements (from our analysis of raw data signals, empty symbols). | ||
 .
The analysis of nonlinearities captures characteristic fingerprints that correlate with printing behaviour. The higher harmonics maps obtained through FT analysis show clear differences in the non-linear behaviours before and after aggregation (Fig. 10). For the physical get at pH ≈ 11, the onset of non-linearities (n = 3,
.
The analysis of nonlinearities captures characteristic fingerprints that correlate with printing behaviour. The higher harmonics maps obtained through FT analysis show clear differences in the non-linear behaviours before and after aggregation (Fig. 10). For the physical get at pH ≈ 11, the onset of non-linearities (n = 3,  ) takes place at γnl ≈ 0.13% (from the FT analysis, Fig. 10). Only odd harmonics gradually rise with increasing strain amplitude (Fig. 10a). At large amplitudes approaching 100%, there are some subtle signals of the second harmonic. However, the aggregated STO formulation, at pH ≈ 3, shows intense odd and even harmonics (Fig. 10b) with an onset of
  at γnl ≈ 0.16% (from the FT analysis). Intense even harmonics have been associated with wall slip,57 and with stress heterogeneities in a material system.49,58 The non-linear parameter
  has been found to increase when defects appear in a polymeric material subjected to a fatigue test in non-linear conditions;58 the even harmonics become not negligible when cracks form and propagate. It has also been associated to phase-separation of oil:water emulsions stabilised by clay particles.49 Considering that the
  non-linear parameter can be used as an indicator of phase separation in relation to emulsion stability,49 the higher harmonics fingerprints (Fig. 10) provide strong evidence to support our microstructure disruption hypothesis. The STO formulation at pH ≈ 3 shows intense I2/1 and I3/1 and higher harmonics (Fig. 10b), they reach a maximum and suddenly drop to a minimum at γ0 ≈ 10%. From this point, the second harmonic remains low while the third raises again. This shift in trends for both is similar to those observed in fatigue tests performed on polymeric materials,58 and for oil:water emulsions stabilised with hydrophobic clays.49 Other emulsion gel systems do also show a maximum value of I3/1 at increasing strain amplitude.59,60
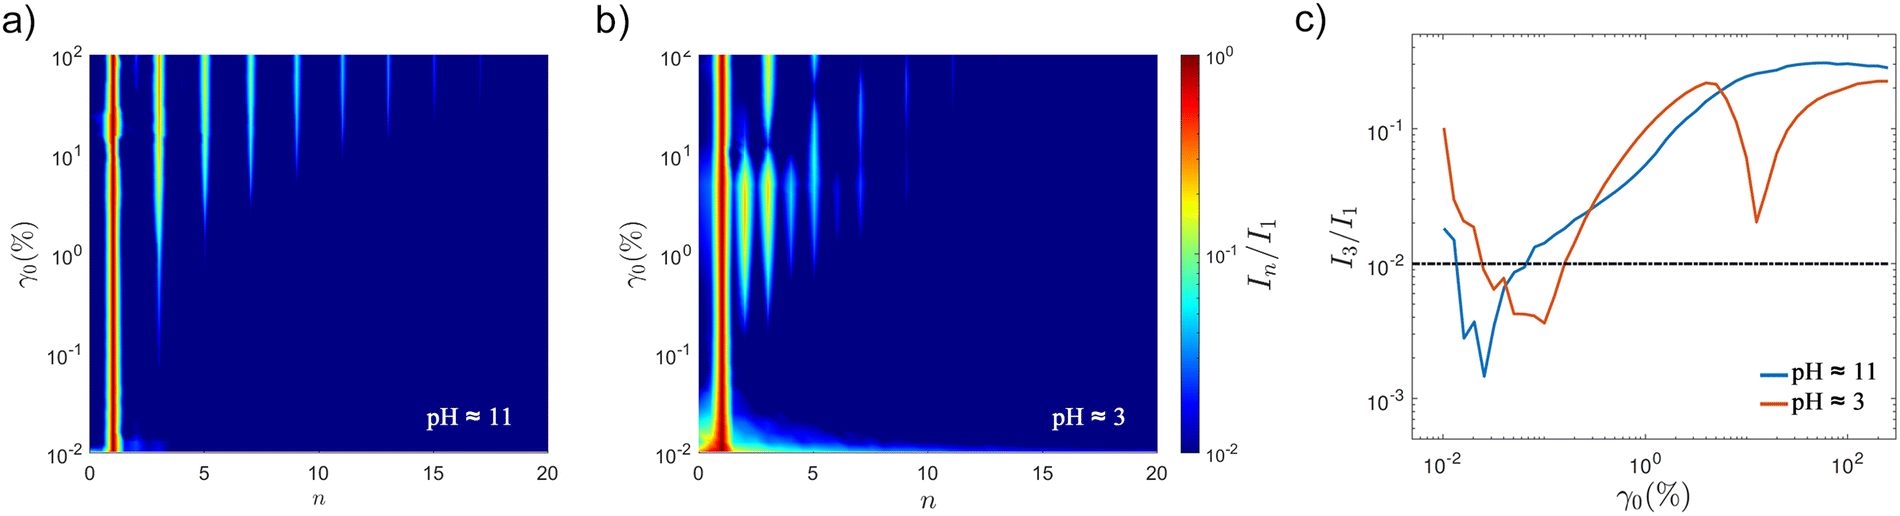 | ||
Fig. 10 (a) and (b) FT maps of higher harmonics (n) for STO formulations before and after triggering the assembly using HCl, at pH values ≈11 and 3 respectively. The aggregated STO formulation has intense even harmonics and non-linearities at small strain amplitudes. (c) The evolution of the relative intensity of the third w.r.t. the first harmonic  shows distinctive trends for the two samples. shows distinctive trends for the two samples. | ||
The harmonic maps and trends on non-linear parameters I2/1 and I3/1 are consistent with stable and unstable systems in literature.49,59 The FT analysis provide fingerprints and quantitative evidence of distinctive behaviours before and after the pH-triggered assembly.
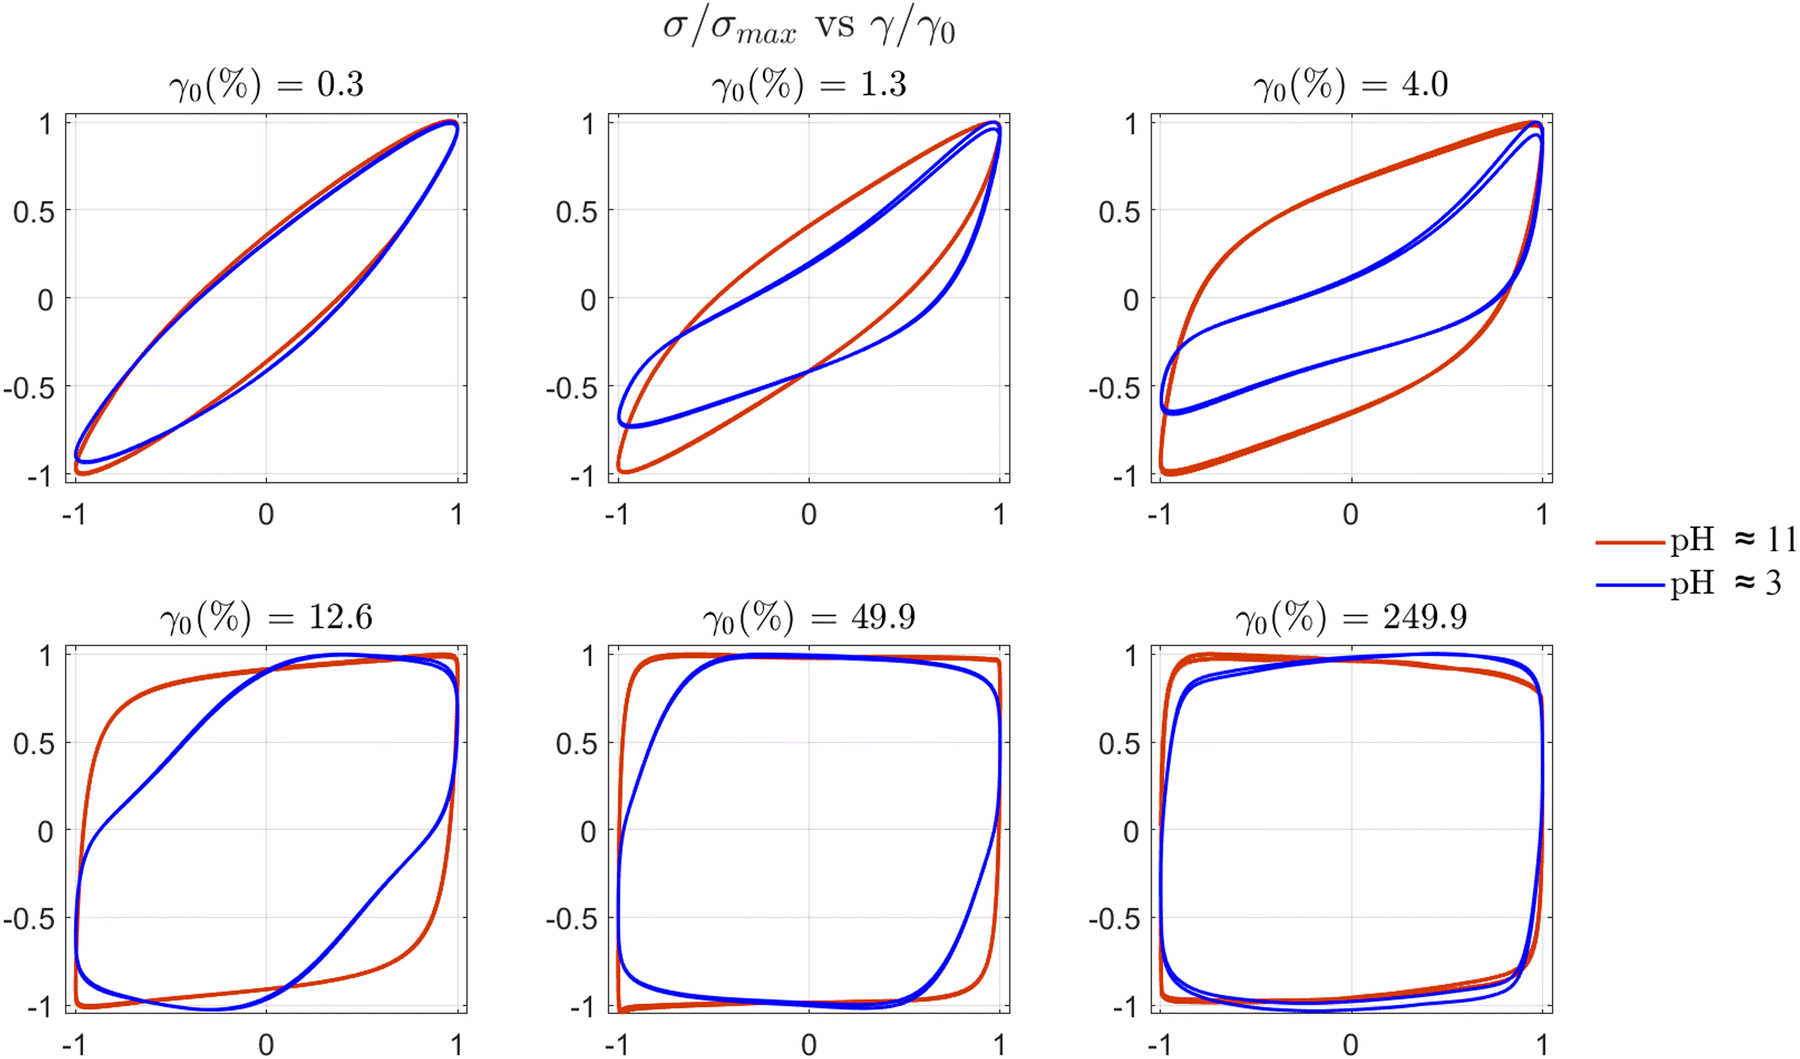 | ||
| Fig. 11 Normalised elastic Lissajous–Bowditch (LB) plots (σ/σ0vs. γ/γ0) for STO formulations: STO47 L5(2) at pH ≈ 11 and ≈3 before and after aggregation respectively. LB curves for the aggregated sample at pH ≈ 3 are asymmetric at intermediate values of strain amplitude that correspond to the increase of even harmonics, I2/1 in Fig. 10(b), between γ0 ≈ 0.015 and 10%. | ||
 | ||
| Fig. 12 (a) Dissipation ratio (ϕ) evolution with γ0 for both STO samples before and after aggregation, at pH ≈ 11 and 3 respectively. (b) SPP Cole–Cole plots showing the inter-cycle trajectories for STO formulations before and after triggering the assembly of BCS-L5 using HCl. The acidification changes the yielding behaviour and the extent of microstructural arrangements. | ||
The inter-cycle trajectories in the Cole–Cole plots (Fig. 12b) for both samples exhibit the characteristic deltoid shapes, reflecting the dominance of the third harmonic.29,46 However, the progressive changes in shape, orientation and enclosed area of these deltoids with increasing strain amplitude take place differently for each sample. These features offer additional insights into the sequence of microstructural rearrangements each material undergoes. A large area is indicative of a broad extent of micro-rearrangements, while the position and tilt can provide information about the energy transitions (e.g. predominantly elastic or viscous) and intra-cycle processes associated with changes in  and
and  (e.g. thickening ↑, thinning ↓, stiffening → and softening ←).27,29
The inter-cycle trajectories for the gel at pH ≈ 11 show a very gradual transition in location, size of enclosed areas and tilt. The deltoids gradually move left and downwards in the Cole–Cole plot (↙ in Fig. 12b), remaining in the predominantly elastic region up to amplitude strains of ≈2%. The area of these deltoids increases very slightly with the onset of non-linearities, and it then remains fairly constant until the trajectories move into the “backflow” region27 on the left of the Cole–Cole plot (Fig. 12b, pH ≈ 11). At strains above γcrossover ≈ 4%, the enclosed areas decrease with increasing strain amplitude, entering the predominantly viscous region within each cycle, and until the deltoids collapse with  and
and  values → 0 Pa, reflecting the break down of the microstructure at very large amplitudes.61
The aggregated sample at pH ≈ 3 undergoes different physical processes throughout the amplitude sweep and within each cycle. The enclosed area in the deltoids at any given strain amplitude is larger, thus evidencing a greater extent of microstructural rearrangements. The shape of the deltoids is also different, with very sharp and narrow trajectories that enter the predominantly viscous and recoil regions at smaller strains γ0 → 1%, thus reflecting that the physical processes that the sample undergoes in each cycle are also different. The enclosed areas reach a maximum at γ0 ≈ 1%, and from this point, the trajectories enter the “backflow” region with negative  values. At the moduli crossover, γ0 ≈ 8%, the deltoid has considerably shrunk and approaches the visco-plastic deformation limit.62 Additional comparison of intra-cycle trajectories for both formulations is included in the ESI† (Fig. S12).
Overall the inter-cycle trajectory evolution provides further evidence of the distinctive physical processes that the formulations undergo before and after aggregation, which correlate with printing behaviour. The SPP trajectories and the FT fingerprints (including even harmonics) provide complementary quantification of the microstructure disruption caused by the activation of the pH-triggered assembly. The LAOS analyses can capture the changes in the gel microstructure associated with printing performance showing that yielding plays an important role in DIW. Additional aspects must be considered to assess the printability of DIW feedstocks, including: the quantification of thixotropy or re-structuring timescales,23 extensional properties,63 and the impact of process parameters.32 These aspects are the subject of ongoing studies in our group and will be reported in the future.
4 Conclusions
Bringing together polymer chemistry, formulation and rheology, we have demonstrated that pH responsive branched co-polymer surfactants (BCSs) can aid the design of yield stress fluids for advanced materials manufacturing.The synthesis of pH responsive branched co-polymer surfactants has been optimised to enhance the control over co-monomer distribution and topology. By increasing the solids in the co-polymerisation reaction from 10 to 50 wt%, it is possible to enhance branching. While the use of PEGMA macro-monomers with different chain lengths provides control over molecular weight and the spatial distribution of hydrogen bonding motifs in BCSs macromolecules. Through modifications in the conditions of co-polymerisation reactions via the Strathclyde methodology, this work provided a library of BCS derivatives, from linear analogues to branched architectures that can be exploited to create a wide range of yield stress fluids with different rheological characteristics and yielding behaviours.
Some of these soft materials have been successfully shaped through casting and DIW to create macroscopic structures made of activated charcoal and strontium titanate. We have found that when using a branched and high molecular weight BCS (L5) under certain conditions, it is possible to achieve a stable emulsion gel through electro-steric and particle stabilisation in the absence of inter- and intra-macromolecular hydrogen bonds. The resultant soft material can be used in DIW to create complex shapes with good printing resolution. However, when trying to enhance the strength of this stable emulsion gel through pH-triggered assembly below the pKa, this instead led to the damage of the microstructure and as a consequence to poor printing resolution.
Advanced LAOS analyses could capture distinctive fingerprints for the stable and disrupted emulsion gels, thus finding a correlation between their yielding processes and printing behaviour. FT fingerprints and the trends of the second and third harmonics evidenced that the disrupted gel undergoes phase separation during its flow transition. The dissipation ratio trends and the SPP framework provided complementary quantification of the underlying yielding phenomena.
The optimised gel can be successfully used in DIW to create complex structures with controlled features. The formulation determines the final microstructure and micron size pores of the printed filaments, while the 3D computer aided design can control the macro-porosity. These STO complex structures with potential for electrochemical applications, exemplify what can be achieved by bringing together polymer chemistry, formulation design and rheology of complex fluids. Overall, this work shows how to exploit branched co-polymer surfactants in emulsion engineering and advanced materials processing.
Author contributions
Conceptualization (EGT). Experimental work (EJ, ZL, SF, MC). Data curation (EJ, ZL, RA, SF, WS, EGT). Formal analysis (RA, SF, WS, EGT). Funding acquisition (EGT). Investigation (All). Methodology (EJ, SF, RA, EGT). Project administration (EGT). Resources (EGT). Software (EGT, RA, Freeware package by Prof Simon Rogers). Supervision (EGT). Writing original draft manuscript (EGT). Editing (EGT, WS).Data availability
Some of the data and analyses supporting this article have been included as part of the ESI.† The raw and curated data for the co-polymers characterisation, rheological measurements and their analyses can be made available upon acceptance and request. The FT analysis has been made using our own MATLAB script, that can also be made available upon acceptance and request. The SPP analysis has been made using MATLAB functions provided by Simon Rogers (SPP Freeware package) as stated in the manuscript.Conflicts of interest
There are no conflicts to declare.Acknowledgements
This work was supported by a UKRI Future Leaders Fellowship MR/V021117/1. EJ was supported by a PhD studentship from The Leverhulme Research Centre for Functional Materials Design. We thank Prof. Simon Rogers for providing us with the SPP Freeware package to carry out the SPP analysis. We would like to acknowledge the use of characterisation facilities (GPC, 1H NMR, SEM, Mastersizer, Contact Angle and ARES G2 TA Rheometer) within the Open Access Area of the Materials Innovation Factory at the University of Liverpool; created as part of the UK Research Partnership Innovation Fund (Research England) and co-funded by the Sir Henry Royce Institute. EGT and ZL acknowledge Mr Jack Li for their assistance in lab work during the review process. EGT acknowledges Dr Patrick Spicer and Prof. Simon Rogers for useful discussions and perspectives on the structural and rheological characterisation of YSF for DIW.Notes and references
- R. Moreno, J. Eur. Ceram. Soc., 2020, 40, 559–587 CrossRef CAS.
- Y. Lakhdar, C. Tuck, J. Binner, A. Terry and R. Goodridge, Prog. Mater. Sci., 2021, 116, 100736 CrossRef CAS.
- W. Luo, Y. Wang, E. Hitz, Y. Lin, B. Yang and L. Hu, Adv. Funct. Mater., 2017, 27, 1701450 CrossRef.
- S. Abdolhosseinzadeh, X. Jiang, H. Zhang, J. Qiu and C. J. Zhang, Mater. Today, 2021, 48, 214–240 CrossRef CAS.
- A. Younis, C.-H. Lin, X. Guan, S. Shahrokhi, C.-Y. Huang, Y. Wang, T. He, S. Singh, L. Hu and J. R. D. Retamal, et al. , Adv. Mater., 2021, 33, 2005000 CrossRef CAS PubMed.
- B. Ling, R. Agrawal, D. He, R. J. Poole, A. I. Cooper, M. Liu and E. García-Tuñón, Adv. Funct. Mater., 2024, 2405320 CrossRef CAS.
- G. V. Franks, C. Tallon, A. R. Studart, M. L. Sesso and S. Leo, J. Am. Ceram. Soc., 2017, 100, 458–490 CrossRef CAS.
- J. A. Lewis, J. Am. Ceram. Soc., 2000, 83, 2341–2359 CrossRef CAS.
- S. M. Shaban, J. Kang and D.-H. Kim, Compos. Commun., 2020, 22, 100537 CrossRef.
- E. García-Tuñón, S. Barg, R. Bell, J. Weaver, C. Walter, L. Goyos and E. Saiz, Angew. Chem., 2013, 52, 7805 CrossRef PubMed.
- A. Rajbanshi, E. Hilton, C. A. Dreiss, D. Murnane and M. T. Cook, Macromol. Rapid Commun., 2024, 45, 2300723 CrossRef CAS PubMed.
- M. Motornov, Y. Roiter, I. Tokarev and S. Minko, Prog. Polym. Sci., 2010, 35, 174–211 CrossRef CAS.
- P. Brown, C. P. Butts and J. Eastoe, Soft Matter, 2013, 9, 2365–2374 RSC.
- R. T. Woodward, L. Chen, D. J. Adams and J. V. Weaver, J. Mater. Chem., 2010, 20, 5228–5234 RSC.
- R. T. Woodward and J. V. Weaver, Polym. Chem., 2011, 2, 403–410 RSC.
- E. García-Tuñón, G. C. Machado, M. Schneider, S. Barg, R. V. Bell and E. Saiz, J. Eur. Ceram. Soc., 2017, 37, 199–211 CrossRef.
- E. García-Tuñón, S. Barg, J. Franco, R. Bell, S. Eslava, E. D’Elia, R. C. Maher, F. Guitian and E. Saiz, Adv. Mater., 2015, 27, 1688–1693 CrossRef PubMed.
- B. Bhat, S. Pahari, J. S.-I. Kwon and M. E. Akbulut, Adv. Colloid Interface Sci., 2023, 103025 CrossRef CAS PubMed.
- R. H. Ewoldt and C. Saengow, Annu. Rev. Fluid Mech., 2022, 54, 413–441 CrossRef.
- R. T. Woodward, R. A. Slater, S. Higgins, S. P. Rannard, A. I. Cooper, B. J. Royles, P. H. Findlay and J. V. Weaver, Chem. Commun., 2009, 3554–3556 RSC.
- M. Encheva, E. Muratspahic, C.-M. Saak, M. Zelenka, R. T. Woodward and E. H. Backus, J. Colloid Interface Sci., 2025, 680, 88–97 CrossRef CAS PubMed.
- E. García-Tuñón, R. Agrawal, B. Ling and D. J. Dennis, Phys. Fluids, 2023, 35, 017113 CrossRef.
- R. Agrawal and E. García-Tuñón, Soft Matter, 2024, 20, 7429–7447 RSC.
- K. Hyun, M. Wilhelm, C. O. Klein, K. S. Cho, J. G. Nam, K. H. Ahn, S. J. Lee, R. H. Ewoldt and G. H. McKinley, Prog. Polym. Sci., 2011, 36, 1697–1753 CrossRef CAS.
- R. H. Ewoldt, A. Hosoi and G. H. McKinley, J. Rheol., 2008, 52, 1427–1458 CrossRef CAS.
- M. Wilhelm, Macromol. Mater. Eng., 2002, 287, 83–105 CrossRef CAS.
- S. A. Rogers, B. M. Erwin, D. Vlassopoulos and M. Cloitre, J. Rheol., 2011, 55, 435–458 CrossRef CAS.
- C.-W. Lee and S. A. Rogers, Korea-Aust. Rheol. J., 2017, 29, 269–279 CrossRef.
- S. A. Rogers and M. P. Lettinga, J. Rheol., 2012, 56, 1–25 CrossRef CAS.
- R. H. Ewoldt, P. Winter, J. Maxey and G. H. McKinley, Rheol. Acta, 2010, 49, 191–212 CrossRef CAS.
- D. M. Hoyle, D. Auhl, O. Harlen, V. Barroso, M. Wilhelm and T. McLeish, J. Rheol., 2014, 58, 969–997 CrossRef CAS.
- A. Geffrault, H. Bessaies-Bey, N. Roussel and P. Coussot, Addit. Manuf., 2023, 75, 103752 Search PubMed.
- S. R. Cassin, S. Wright, S. Mckeating, O. B. Penrhyn-Lowe, S. Flynn, S. Lomas, P. Chambon and S. P. Rannard, Polym. Chem., 2023, 14, 1905–1914 RSC.
- S. Flynn, S. D. Dale, A. B. Dwyer, P. Chambon and S. P. Rannard, J. Polym. Sci., Part A: Polym. Chem., 2017, 55, 3963–3967 CrossRef CAS.
- S. Flynn, A. B. Dwyer, P. Chambon and S. Rannard, Polym. Chem., 2019, 10, 5103–5115 RSC.
- J. Rosselgong, S. P. Armes, W. R. Barton and D. Price, Macromolecules, 2010, 43, 2145–2156 CrossRef CAS.
- W. Li, J. A. Yoon, M. Zhong and K. Matyjaszewski, Macromolecules, 2011, 44, 3270–3275 CrossRef CAS.
- J. Rosselgong, S. P. Armes, W. Barton and D. Price, Macromolecules, 2009, 42, 5919–5924 CrossRef CAS.
- P. J. Flory, J. Am. Chem. Soc., 1941, 63, 3083–3090 CrossRef CAS.
- P. J. Flory, J. Am. Chem. Soc., 1941, 63, 3091–3096 CrossRef CAS.
- S. R. Cassin, S. Flynn, P. Chambon and S. P. Rannard, Polym. Chem., 2022, 13, 2295–2306 RSC.
- H. Cauldbeck, M. Le Hellaye, M. Long, S. M. Kennedy, R. L. Williams, V. R. Kearns and S. P. Rannard, J. Controlled Release, 2016, 244, 41–51 CrossRef CAS PubMed.
- F. Isaure, P. A. Cormack and D. C. Sherrington, J. Mater. Chem., 2003, 13, 2701–2710 RSC.
- C. Ferraro, E. García-Tuñón, S. Barg, M. Miranda, N. Ni, R. Bell and E. Saiz, J. Eur. Ceram. Soc., 2018, 38, 823–835 CrossRef CAS.
- A. Corker, H. C.-H. Ng, R. J. Poole and E. García-Tuñón, Soft Matter, 2019, 15, 1444–1456 RSC.
- Y. H. Shim and S. A. Rogers, Phys. Fluids, 2023, 35, 063117 CrossRef CAS.
- J. Binner, A. McDermott, Y. Yin, R. M. Sambrook and B. Vaidhyanathan, Ceram. Int., 2006, 32, 29–35 CrossRef CAS.
- D. J. McClements and C. E. Gumus, Adv. Colloid Interface Sci., 2016, 234, 3–26 CrossRef CAS PubMed.
- J. S. Hong, H. J. Kong, K. Hyun, J. Bergfreund, P. Fischer and K. H. Ahn, Rheol. Acta, 2019, 58, 453–466 CrossRef CAS.
- P. Wei, C. Cipriani, C.-M. Hsieh, K. Kamani, S. Rogers and E. Pentzer, J. Appl. Phys., 2023, 134, 100701 CrossRef CAS.
- R. J. Poole, Rheol. Bull., 2012, 53, 32–39 Search PubMed.
- R. Lenk and R. Lenk, Polym. Rheol., 1978, 75–85 Search PubMed.
- K. M. Kamani and S. A. Rogers, Proc. Natl. Acad. Sci. U. S. A., 2024, 121, e2401409121 CrossRef CAS PubMed.
- R. Agrawal, E. García-Tuñón, R. J. Poole and C. P. Fonte, J. Non-Newtonian Fluid Mech., 2025, 105407 CrossRef CAS.
- Q. Liu and W. Zhai, ACS Appl. Mater. Interfaces, 2022, 14, 32196–32205 CrossRef CAS PubMed.
- S. S. Chan, M. L. Sesso and G. V. Franks, J. Am. Ceram. Soc., 2020, 103, 5554–5566 CrossRef CAS.
- C. O. Klein, H. W. Spiess, A. Calin, C. Balan and M. Wilhelm, Macromolecules, 2007, 40, 4250–4259 CrossRef CAS.
- V. Hirschberg, M. Wilhelm and D. Rodrigue, Polym. Test., 2017, 60, 343–350 CrossRef CAS.
- X. Zhao, D. Li, L.-J. Wang and Y. Wang, Carbohydr. Polym., 2022, 281, 119061 CrossRef CAS PubMed.
- X. Zhao, D. Li, L.-J. Wang and Y. Wang, Food Hydrocolloids, 2023, 135, 108208 CrossRef CAS.
- S. Migliozzi, Y. He, M. Parhizkar, Y. Lan and P. Angeli, Soft Matter, 2024, 20, 8621–8637 RSC.
- A. J. Sandoval, M. Fernández, O. Sanz, A. Santamara, E. Penott-Chang and A. J. Müller, J. Rheol., 2022, 66, 859–879 CrossRef CAS.
- C. Saengow, S. Sen, J. Yus, E. E. Lovrich, A. G. Hoika, K. M. Chang, A. A. Pfeil, N. Haug, A. J. W. Johnson and R. H. Ewoldt, arXiv, 2025, preprint, arXiv:2501.12630 DOI:10.48550/arXiv.2501.12630.
Footnote |
| † Electronic supplementary information (ESI) available: Additional figures and methodologies included in a pdf file. See DOI: https://doi.org/10.1039/d4sm01473a |
| This journal is © The Royal Society of Chemistry 2025 |