DOI:
10.1039/C4RA00765D
(Paper)
RSC Adv., 2014,
4, 15511-15517
Preparation and performance of Co3O4–NiO composite electrode material for supercapacitors
Received
26th January 2014
, Accepted 14th March 2014
First published on 14th March 2014
1. Introduction
Recently, nanometer-scale materials have attracted considerable interest, due to their unique properties arising from quantum size effects. It is realized that the properties of nanomaterials can be significantly different from the bulk materials and can profound influence the synthesis, characterization, chemical and physical characteristics of a material such as electrical, optical, magnetic and catalytic.1–7 The nanomaterials can be engineered by controlling the sizes of these building blocks in the range from 1 to 100 nm and their assembly using a variety of synthesis methods which can provide opportunities to exploit the distinctive physico-chemical properties.8,9 Metal oxides are one of the most versatile functional materials due to their applications in a variety of fields such as heterogeneous catalysts, gas sensors, lithium ion electrode materials, supercapcitors.10–13 In particular, supercapacitors, as an intermediate system between dielectric capacitors and batteries, have drawn significant attention since their superb characteristics of high power density and long cycle life.14–16 Extensive studies have shown that nanostructured metal oxides and hydroxides are promising materials for electrochemical supercapacitors and exhibiting high pseudocapacitance. Of all the metal oxides investigated as electrode materials for pseudocapacitor, the RuO2 offering high specific capacitance with better cyclability is reported to be the most advantageous one,17 however, the high cost and its unstability have impeded their usage in practical applications. On the other hand, a number of transition metal oxides which are relatively cheap and easily available, such as NiO,18–20 Co3O4,21 MnO2 (ref. 22–24) have been studied as alternative electrodes for electrochemical supercapacitors. On account of non-expensive nature and easy synthesis, Co3O4 is an attractive candidate for the application in electrochemical supercapacitors. Many methods, including the hydrothermal synthesis, template method, thermolysis, electrochemical route and chemical vapour deposition, and so on, have been developed to synthesize various morphologies and architectures, such as nanocrystals, nanorods, nanowires, nanobelts, complex and hierarchical assemblages.25 Ye et al.26 reported that Co3O4 with different morphologies and the single electrode specific capacitance reached 340 F g−1. Zhu et al.27 demonstrated that the Co3O4 with porous structures significantly increased initial specific capacity (111 F g−1). Wang28 adopted template hydrothermal preparation of layered Co3O4, which showed the single electrode capacitance of 505 F g−1. Yet the rate capability and capacitance retention are still unsatisfactory. Recent works have reported the use of metal oxides coupled with different materials in super capacitor so that they effectively enhance the specific capacitance and charge–discharge kinetics. Liang et al.29 and Li et al.30 prepared NiO/CNTs (carbon nanotubes) composites electrode material which increased the specific capacitance of the modified ones. The prepared composites of PANI–Co3O4 have shown specific capacitances of up to 287 F g−1 at a current density of 5 mA cm−2 and kept the capacitance retention ratio at 94.4% after 500 charge–discharge cycles.31 Very recently, Gupta et al.32 found that the composite metal oxides with more excellent electrochemical performance than a single metal oxide, but the compounds directly prepared with different metal salts according to the different proportion as super capacitor electrode material is rarely reported. While a wide variety of the cobalt oxide compounds have been created and tested, it still represents a grand challenge to design a new kind of electrode material through appropriate proportions with different electrochemical reactivity of oxides that dramatically enhances the capacity while maintaining the excellent rate capability and charge–discharge cycling life.
Herein, we prepare a certain proportion composites of Co3O4–NiO oxide electrode material with higher specific capacity characteristics were prepared via a facile liquid phase precipitation method according to Co and Ni in different molar ratio. This experiment is based on the reasonable combination of the electro-active materials and making their Faraday reaction uniformly distributed in the potential window, thus improves the overall specific capacitance. In the solution-based synthesis of nanostructure materials, various liquids, including water, alcohol, ethylene glycol, and glycerol have usually been used as the solvent.33 In this paper, however, water alcohol mixed solvents have been investigated as the reagent to synthesize Co3O4–NiO nanostructures. It also examines the relationship between the proportion of alcohol mixed solvent of water and specific capacitance of the electrode material in the process of the experiment. It is found that the molar ratio of distilled water to alcohol in the solvent system may play an important role in the formation of desired products and the capacitance.
2. Experimental
2.1 Materials
All of the reagents were analytically pure, and purchased from Tianjin Chemical Industrial Co. Ltd. (Tianjin, China), and used without further purification.
2.2 Preparation of Co3O4–NiO
In a typical liquid precipitation synthesis, cobalt chloride (CoCl2·6H2O) and nickel chloride (NiCl2·6H2O) mixtures according to the mole ratio of (1![[thin space (1/6-em)]](https://www.rsc.org/images/entities/char_2009.gif) :0, 1:1, 1:2, 1:3, 2:3) are dissolved in 60 mL distilled water containing a vary amount of cetyltrimethylammonium bromide (0.1 g–0.3 g) respectively, after then form a homogeneous solution in the open beaker under continuous magnetic stirring. Then the above five groups solution are poured into three flasks, added the ammonium hydroxide and heated up to 60 °C by condensing water bath and the mixed solutions are kept at 60 °C for 2 h. After the solutions are cooled down to room temperature naturally, the five groups of precipitates are collected by vacuum filtration and rinsed with distilled water and ethanol for several times, and dried in an oven at 80 °C for 12 h to get the precursor. Next, the five samples are calcined in a muffle furnace at a temperature of 350 °C for 4 h separately and cooled to room temperature.
:0, 1:1, 1:2, 1:3, 2:3) are dissolved in 60 mL distilled water containing a vary amount of cetyltrimethylammonium bromide (0.1 g–0.3 g) respectively, after then form a homogeneous solution in the open beaker under continuous magnetic stirring. Then the above five groups solution are poured into three flasks, added the ammonium hydroxide and heated up to 60 °C by condensing water bath and the mixed solutions are kept at 60 °C for 2 h. After the solutions are cooled down to room temperature naturally, the five groups of precipitates are collected by vacuum filtration and rinsed with distilled water and ethanol for several times, and dried in an oven at 80 °C for 12 h to get the precursor. Next, the five samples are calcined in a muffle furnace at a temperature of 350 °C for 4 h separately and cooled to room temperature.
Keep Co:Ni ratio of 1:1 in molar and change the solvent volume ratios of distilled water and alcohol as following (1:0; 1:0.5; 1:1; 1:2) in the case of other conditions remain constant. Then collect the products aforementioned for characterization and applications.
2.3 Characterization of Co3O4–NiO
The morphologies and structures of the sample was examined by scanning electron microscopy (SEM, S-4800, Germany), the crystallo graphic phases of as-prepared samples are investigated by D/MAX-2400X X-ray diffractometer with CuKα radiation (λ = 0.154056 nm), employing a scanning rate of 10° min−1 in the 2θ range of 10–90°.
2.4 Electrochemical measurement
Electrochemical studies were carried out in a three-electrode system. A piece of nickel foam mesh coated with freshly prepared Co3O4–NiO nanocomposites, a platinum electrode, and a saturated calomel electrode (SCE) were used as working electrode, counter electrode, and reference electrode, respectively. The working electrode was composed of active material (Co3O4–NiO, 75 wt%, 1 mg cm−2), graphite (10 wt%), conductive material (acetylene carbon black, ATB, 10 wt%) and binder (polytetrafluoroethylene, PTFE, 5 wt%). The mixture of electrode materials was ground for 10 min and coated onto the surface of nickel foam meshes (1 × 1 cm2). Then the meshes were dried at 80 °C for 12 h and then pressed under 10 MPa to obtain a working electrode. The electrochemical measurements were evaluated by the means of cyclic voltammetry (CV), chronopotentiometry (CP), and electrochemical impedance spectroscopy (EIS) in a beaker cell with 2 mol L−1 KOH aqueous solution as the electrolyte. The specific capacitance (SC) values determined from the CP curves are calculated according to the following equation:
where Cs, I, t, m, and V are SC (F g−1), the discharge current (mA), the discharging time (s), the mass of the electroactive material (mg), and the potential interval of the discharge (V), respectively. All of the above electrochemical measurements were evaluated on a CHI660B electrochemical workstation (Chenhua, Shanghai, China).
3. Results and discussion
3.1 XRD
Fig. 1 shows the XRD patterns of Co3O4–NiO prepared by the cobalt nickel mole ratio of (1:1) and (1:0). The patterns of Fig. 1a and b are corresponding to the samples Co3O4 and Co3O4–NiO, respectively. From the Fig. 1a, the presence of diffraction peaks at 2θ = 19.12°, 31.14°, 36.40°, 55.32°, 58.96° and 64.48°are indicative of crystalline product. According to standard Co3O4 XRD pattern (JCPDS card no. 42-1467, a = 0.8037), these peaks are assigned to (111), (220), (331), (422), (422), (511) and (440) diffraction lines of cubic spinel Co3O4 phase.26 From the Fig. 1b, it presents the diffraction peaks of Co3O4–NiO, and there into several peaks appeared at the 2θ = 36.74°, 43.58°, 63.74°, 75.80° and 76.70° are well corresponding to (111), (200), (220), (311) and (222) planes of NiO according to its XRD pattern (JCPDS card no. 04-0835). Compared with the two figures, there is no other secondary or amorphous phase observed. All above results confirm that the samples Co3O4 and Co3O4–NiO achieved keep their cubic phase structure completely.
 |
| | Fig. 1 XRD patterns of Co3O4–NiO. | |
3.2 SEM
Fig. 2 displays the scanning electron microscope images of the Co3O4–NiO prepared in different solvent volume ratios of distilled water and alcohol. It can be seen from the Fig. 2a that the Co3O4–NiO compounds are in nanoparticles morphology with a particle size of about 50 nm. With the solvent volume ratios of distilled water and alcohol increasing, the samples are still in granule whereas the nanoparticles gather together and gradually accumulate nearly a certain gap of uniform size grapes. Compared with the three figures, the cause of change is the introduction of ethanol in the solvent. The different proportions of water and ethanol change the polarity,35 which slowing the ion migration rate and crystal growth rate. As the addition of precipitant ammonia, respectively, cobalt ion and nickel ions form a large number of complexes. It is the complex reaction generating hydroxyl with water that so-called the precursor when the temperature rises. Having the viscosity of alcohol which may promote the closely growth of the particles during the nucleation. Along with the reaction, a large number of particles accumulated to form gradually increased pore structure, which is conducive to the diffusion of electrolyte penetration and generating the active sites, thus effectively improve the specific capacity of the electrode. After high temperature of calcination and decomposition, a series size of stable oxide nanoparticles grape-like are formed.| | |
Co2+ + 6NH3 → Co(NH3)62+
| (1) |
| | |
Co(NH3)62+ + 3OH− → Co(OH)2 + 6NH3
| (2) |
| | |
Co(OH)2 + H2O + 1/2O2 → 2Co(OH)3
| (3) |
| | |
Ni2+ + 6NH3 → Ni(NH3)62+
| (4) |
| | |
Ni(NH3)62+ + 3OH− → Ni(OH)2 + 6NH3
| (5) |
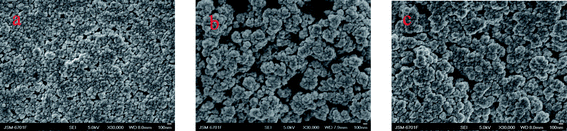 |
| | Fig. 2 SEM images of Co3O4–NiO electrode prepared in the mole ratio of (nCo:nNi = 1:1) and in different solvent volume ratios of distilled water and alcohol (a) Vwater:Valcohol = 1:0; (b) Vwater:Valcohol = 1:1; (c) Vwater:Valcohol = 1:2. | |
3.3 Electrochemical properties of Co3O4–NiO
Fig. 3 shows the CV curves of Co3O4–NiO nanocomposites prepared in different mole ratios of Co and Ni. The electrochemical behavior of Co3O4–NiO compound oxides were tested at a scan rate of 2 mV s−1 within a potential 0–0.4 V in 2 mol L−1 KOH aqueous electrolyte. It is showed the shapes of the five curves are close to rectangular shape. There are two pairs of redox couples obviously in the curve a, whose mechanism of charge–discharge process is similar with the following reference.34 The CV curves of b–e are similar to that of a, which reveal a little deviation from a rectangular form, whereas some considerable differences are observed. With the mole ratio of nickel element gradually increasing, the anodic peaks shift toward high potential and the cathodic peaks move toward negative potential simultaneously. Also it can be seen the area of the closed rapidly enlarge and the sample of Co3O4–NiO (nCo:nNi = 1:1) has the largest area, indicating a good super capacitive characteristic of the Co3O4–NiO compound oxides.| | |
Co3O4 + H2O + OH− ↔ 3CoOOH + e−
| (6) |
| | |
CoOOH + OH− ↔ CoO2 + H2O + e−
| (7) |
 |
| | Fig. 3 CV curves of the Co3O4–NiO electrode at a scan rate of 2 mV s−1 in 2 mol L−1 KOH prepared in different mole ratios of Co and Ni. | |
Fig. 4 reveals the galvanostatic CP curves of the Co3O4–NiO compound oxides prepared in different mole ratios of Co and Ni at a constant current of 2 mA cm−2 within the potential window of 0–0.4 V. In Fig. 4, the behavior of the voltage–time curve is asymmetric and the curves are composed of two parts. It can be seen the voltage exhibit a good linear relationship with time in the range of 0–0.25 V, which is close to the ideal behavior of the electrical double-layer capacitor. Besides, the capacitance of the electrode consisted of the electrolyte ionic charge and the generation of aggregates in the liquid interface. The potential is nonlinear with time in the range of 0.25–0.4 V. It is suspected that the exhibited pseudocapacitance is from the interface between the electrode and the electrolyte or electrochemical oxidation–reduction reaction of desorption. By comparing, the specific capacitance values can be calculated as high as 942 F g−1 under the Co and Ni mole ratio of (1:1), which show excellent capacitor performance.
 |
| | Fig. 4 CP curves of the Co3O4–NiO electrode at a current density of 2 mA cm−2 in 2 mol L−1 KOH prepared in different mole ratios of Co and Ni. | |
Fig. 5 shows the electrochemical impedance spectroscopy (EIS) measurements, which are good to further understand the capacitive behavior of the Co3O4–NiO compound oxide electrode prepared in different mole ratios of Co and Ni. The electrochemical impedance test is carried out at a capacitor operating potential of 0.1 V in a frequency range from 105 to 10−2 Hz. It can be seen the impedance spectra are composed of one semicircle in the high-frequency range corresponding to the double-layer capacitance and a straight sloping line in the low-frequency range corresponding to the diffusive resistance resulted by Warburg behavior. At very high frequencies, the impedance is considered as a pseudocharge-transfer resistance and a straight sloping line in the low-frequency range corresponding to the diffusive resistance. It also can be concluded the smallest of circular diameter and the largest straight slope when the Co and Ni mole ratio of (1:1), which demonstrates that the electrochemical capacitance of this capacitor is best and well confirms the influence of the nanoparticles on the electrochemical performance.
 |
| | Fig. 5 EIS curves of the Co3O4–NiO electrode at the open-circuit voltage of 0.1 V in 2 mol L−1 KOH prepared in different mole ratios of Co and Ni. | |
Fig. 6 reveals the galvanostatic CP curves of the Co3O4–NiO composite electrode prepared within the nCo:nNi = (1:1) at various current densities of 2, 5, 10 and 30 mA cm−2 in the potential window of 0–0.4 V. It can be seen that the specific capacitance decrease corresponding to the increase of a current density from 2 to 30 mA cm−2. It is because the electrode adsorbed a mass of electrolyte ions within a short time when the heavy current charge and discharge, which sharply fall the electrolyte ion concentration between electrode and electrolyte at the interface, and it could not satisfy the number of ions to charge–discharge electrodes so that it increases the polarization caused by the liquid phase diffusion. Hence, the capacity of the electrode material loses heavily at large current density. Thus, the specific capacitance values can be calculated separately for 942, 915.83, 892.33, 776 F g−1 at a current density from 2 to 30 mA cm−2.
 |
| | Fig. 6 CP curve of Co3O4–NiO electrode prepared in the mole ratio of (nCo:nNi = 1:1) in 2 mol L−1 KOH at various current densities. | |
Fig. 7(a) shows the CP curves of Co3O4–NiO composite electrode prepared within the (nCo:nNi = 1:1) and different solvent volume ratios of distilled water and alcohol at a current density of 2 mA cm−2 in the potential window of 0–0.4 V. It can be concluded that the curves are still composed of two parts in comparison with Fig. 4 and 6. The bigger solvent volume ratios of distilled water and alcohol, the longer charge and discharge time in a certain range investigated. Due to the nanoparticle structures, both electrons and ions enable an efficient percolation. Evidently, adopting the solvent volume ratios of (Vwater:Valcohol = 1:2), the charge–discharge time is significantly the longest corresponding to the maximum capacitance as high as 1832 F g−1. The Fig. 7(b) well characterize the capacitive behavior of the Co3O4–NiO compound oxide electrode prepared in the mole ratio of (nCo:nNi = 1:1) and solvent volume ratios of (Vwater:Valcohol = 1:2) at various current densities of 2, 5, 10 and 30 mA cm−2 in 2 mol L−1 KOH. It is clearly seen that the specific capacitance increase corresponding to the time of charge–discharge longer with the decreasing of a current density from 2 to 30 mA cm−2. Because of the rise of solvent ratio and the space of the interparticles are widened, leading to the increase of active material densities and rapid migration hydroxyl ions. For these reasons above, the active material of electrode is fully redox reacted thus reveal the excellent capacitance.
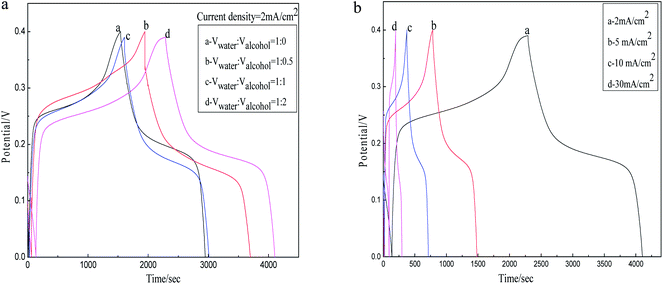 |
| | Fig. 7 (a) CP curves of the Co3O4–NiO electrode prepared in the mole ratio of (nCo:nNi = 1:1) and in different solvent volume ratios of distilled water and ethanol at a current density of 2 mA cm−2 in 2 mol L−1 KOH. (b) CP curves of Co3O4–NiO electrode prepared in the mole ratio of (nCo:nNi = 1:1) and solvent volume ratios of (Vwater:Valcohol = 1:2) at various current densities in 2 mol L−1 KOH. | |
To further confirm the influence of alcohol on Co3O4–NiO electrode prepared in the mole ratio of (nCo:nNi = 1:1) in the aspect of the electrochemical performance, the electrochemical impedance spectroscopy and corresponding equivalent circuit is shown in Fig. 8. The two impedance spectra are almost the same in shape, composed of one semicircle in the high-frequency range and a straight sloping line in the low-frequency range. In the end of high frequency, the intersection point between impedance curves and real axis are on behalf of electrolyte ohm resistance (Rs), and Rs-a, Rs-b are 0.2 Ω, 1.5 Ω, respectively. Nevertheless, the semicircle part of high frequency band embodies the charge transfer resistance (Rct), which represents the migration resistance of the electronic in the compounds internal structure. It can be seen clearly that Rct-a is greater than Rct-b, which prove the alcohol existed in the solvent in the process of preparation of electrode materials which have a certain impact on electronic transfer ability in the internal structure among the electrolyte, therefore promote the rapid migration of electronics. Besides, the two constant-phase elements CPE1 and CPE2 are denoted as the double layer capacitance and ionic diffusion process resulting in Warburg behaviour in the electrode, respectively.
 |
| | Fig. 8 Equivalent circuit for the simulation of EIS of Co3O4–NiO electrode prepared in the mole ratio of (nCo:nNi = 1:1) and solvent volume ratios of (Vwater:Valcohol = 1:2). | |
In order to evaluate the stability of the Co3O4–NiO compound oxide electrode, the charge–discharge cycling tests are conducted for 1000 cycles. Fig. 9 shows the cyclic performance of Co3O4–NiO compound oxide electrode in 2 mol L−1 of KOH electrolytes at 2 mA cm−2. As is shown in Fig. 9, the stability of the material is excellent except for an initial increase of capacitance in the first 300 times. With the cycle number increasing, the specific capacitance of the electrode is gradually larger attributing to the constantly activated electricity substances. However, the specific capacitance seems to slightly decrease after 1500 times, it may be the long time of charge–discharge cycles, and the active materials expand and shrink into some extent so that induce a significant decrease. By comparison, the initial capacitance of the Co3O4–NiO electrode with water:alcohol ratio of 1:2 in volume just decrease to 1.863%, which brings out its superior cycle stability.
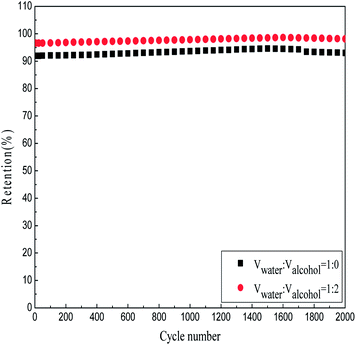 |
| | Fig. 9 Cycle life curves of Co3O4–NiO electrode at the different solvent ratios. | |
4. Conclusions
In summary, the Co3O4–NiO composite electrode with Co:Ni ratio of 1:1 in molar was successfully synthesized in large scale and the specific capacitance with alcohol–water solvent was studied. The results of XRD and SEM indicate that the prepared material exhibit a cubic phase structure and nanoparticles with a diameter about 50 nm. The cyclic voltammetry, chronopotentiometry, and electrochemical impedance measurements are applied in 2 mol L−1 KOH to investigate the electrochemical performance of the Co3O4–NiO composite electrode, which shows a maximum specific capacitance of 1832 F g−1 at 2 mA cm−2 under the condition of nCo:nNi = 1:1, Vwater:Valcohol = 1:2. Also, a certain amount of Ni added in composites could effectively improve the specific capacitance and the mixed solvents have an impact on the morphology and properties. The electrochemical stability is measured after 1000 continuous charge–discharge cycles at 2 mA cm−2 and only 1.863% is degradated, which show the excellent electrochemical performance. As a result, the cobalt compound oxides that partly of nickel replaced have great value of promising development and application on account of the advantages of easy preparation and best electrochemical performance.
Acknowledgements
This work was supported by the National Natural Science Foundation of China (no. 51062011).
Notes and references
- H. X. Li, Z. F. Bian, J. Zhu, D. Q. Zhang, G. S. Li, Y. N. Huo, H. Li and Y. F. Lu, J. Am. Chem. Soc., 2007, 129, 8406 CrossRef CAS PubMed.
- Q. Kuang, C. S. Lao, Z. L. Wang, Z. X. Xie and L. S. Zheng, J. Am. Chem. Soc., 2007, 129, 6070 CrossRef CAS PubMed.
- C. H. Lee, M. Kim, T. Kim, A. Kim, J. Paek, J. W. Lee, S. Y. Choi, K. Kim, J. B. Park and K. Lee, J. Am. Chem. Soc., 2006, 128, 9326 CrossRef CAS PubMed.
- R. Oxtermann, D. Li, Y. D. Yin, J. T. McCann and Y. N. Xia, Nano Lett., 2006, 6, 1297 CrossRef PubMed.
- X. G. Han, Q. Kuang, M. S. Jin, Z. X. Xie and L. S. Zheng, J. Am. Chem. Soc., 2009, 131, 3152 CrossRef CAS PubMed.
- J. F. Ma, Z. Liang, X. Q. Qiao, Q. L. Deng, D. Y. Tao, L. H. Zhang and Y. K. Zhang, Anal. Chem., 2008, 80, 2949 CrossRef CAS PubMed.
- B. H. Wu, C. Y. Guo, N. F. Zheng, Z. X. Xie and G. D. Stucky, J. Am. Chem. Soc., 2008, 130, 17563 CrossRef CAS PubMed.
- L. Manna, E. C. Scher and A. P. Alivisatos, J. Am. Chem. Soc., 2000, 122, 12700 CrossRef CAS.
- F. Wang, R. Liu, A. Pan, S. Xie and B. Zou, Mater. Lett., 2007, 61, 4459 CrossRef CAS.
- J. A. Switzer, H. M. Kothari, P. Poizot, S. Nakanishi and E. W. Bohannan, Nature, 2003, 425, 490 CrossRef CAS PubMed.
- B. E. Conway, Electrochemical Supercapcitors, Kluwer Academic/Plenum Publishers, New York, 1999 Search PubMed.
- B. E. Conway, J. Electrochem. Soc., 1991, 138, 1539 CrossRef CAS.
- Materials for Energy Storage and Conversion: Batteries, Capacitors and Fuel Cells, ed. A. F. Burke, T. C. Murphy, D. H. Goughtly, B. Vyas, T. Takamura, J. R. Huff, Materials Research Society, Pittsburgh, 1995, p. 375 Search PubMed.
- R. Kotz and M. Carlen, Electrochim. Acta, 2000, 45, 2483 CrossRef CAS.
- M. D. Stoller, S. J. Park, Y. W. Zhu, J. H. An and R. S. Ruoff, Nano Lett., 2008, 8, 3498 CrossRef CAS PubMed.
- T. Y. Kim, H. W. Lee, M. Stoller, D. R. Dreyer, C. W. Bielawski, R. S. Ruoff and K. S. Suh, ACS Nano, 2010, 4, 436 Search PubMed.
- C. C. Hu, K. H. Chang, M. C. Lin and Y. T. Wu, Nano Lett., 2006, 6, 2690 CrossRef CAS PubMed.
- V. Srinivasan and J. W. Weidner, J. Electrochem. Soc., 1997, 144, L210 CrossRef CAS.
- K. C. Liu and M. A. Anderson, J. Electrochem. Soc., 1996, 143, 124 CrossRef CAS.
- K. W. Nam and K. B. Kim, J. Electrochem. Soc., 2002, 149, A346 CrossRef CAS.
- V. Srinivasan and J. W. Weidner, J. Power Sources, 2002, 108, 15 CrossRef CAS.
- S. F. Chin, S. C. Pang and M. A. Anderson, J. Electrochem. Soc., 2002, 149, A379 CrossRef CAS.
- M. Toupin, T. Brousse and D. Belanger, Chem. Mater., 2002, 14, 3946 CrossRef CAS.
- B. Djurfors, J. N. Broughton, M. J. Brett and D. G. Ivey, Acta Mater., 2005, 53, 957 CrossRef CAS.
- G. L. Zhang, D. Zhao and P. Z. Guo, et al., Acta Physico-Chimica Sinica, 2012, 28, 387 CAS.
- X. G. Ye, X. G. Zhang and H. Y. Mi, et al., Acta Phys.-Chim. Sin., 2008, 24, 1105 CAS.
- T. Zhu, J. S. Chen and X. W. Lou, J. Mater. Chem., 2010, 20, 7015 RSC.
- X. L. Wang, K. X. He and X. G. Zhang, J. Chin. Chem. Soc., 2006, 22, 1019 CAS.
- K. Liang, A. Chen and R. Li, J. Chin. Ceram. Soc., 2002, 30, 528 CAS.
- R. Li, A. Chen and K. Liang, et al., Electronic Components and Materials, 2003, 22, 3 Search PubMed.
- F. P. Wang, Q. Y. Li and Q. D. Qin, et al., Battery Bimonthly, 2012, 42, 126 CAS.
- V. Gupta and N. Miura, J. Electrochem, 2007, 75, 582 CAS.
- G. L. Zhang, D. Zhao and P. Z. Guo, et al., Acta Phys.-Chim. Sin., 2012, 28, 387 CAS.
- Y. H. Li, K. L. Huang, S. Q. Liu, Z. F. Yao and S. X. Zhuang, J. Solid State Electrochem., 2011, 15, 587 CrossRef CAS.
- L. F. Xu, Electrochemical Synthesis, Morphological Control and Performance of Semiconductor Materials, Ph. D. dissertation, Peking University, Beijing, 2007.
|
| This journal is © The Royal Society of Chemistry 2014 |
Click here to see how this site uses Cookies. View our privacy policy here. 


