 Open Access Article
Creative Commons Attribution 3.0 Unported Licence
Spent coffee ground–calcium alginate biosorbent for adsorptive removal of methylene blue from aqueous solutions†
Catalina V.
Flores‡
 ab,
Juan L.
Obeso‡
 ab,
Herlys
Viltres
 c,
Enelio
Torres-García
e,
Amin Reza
Rajabzadeh
 c,
Seshasai
Srinivasan
 c,
Ricardo A.
Peralta
 *d,
Ilich A.
Ibarra
 *b and
Carolina
Leyva
 *a
*a
aInstituto Politécnico Nacional, CICATA U. Legaria, Laboratorio Nacional de Ciencia, Tecnología y Gestión Integrada del Agua (LNAgua), Legaria 694, Col. Irrigación, Miguel Hidalgo, 11500, CDMX, Mexico. E-mail: zleyva@ipn.mx
bLaboratorio de Fisicoquímica y Reactividad de Superficies (LaFReS), Instituto de Investigaciones en Materiales, Universidad Nacional Autónoma de México, Circuito Exterior s/n, CU, Coyoacán, 04510, Ciudad de México, Mexico. E-mail: argel@unam.mx
cSchool of Engineering Practice and Technology, McMaster University, 1280 Main Street West, Hamilton, ON L8S 4L8, Canada
dDepartamento de Química, División de Ciencias Básicas e Ingeniería, Universidad Autónoma Metropolitana (UAM-I), 09340, Mexico. E-mail: rperalta@izt.uam.mx
eInstituto Mexicano del Petróleo, Eje Central Lázaro Cárdenas Norte, # 152, 07730 Mexico City, Mexico
First published on 11th December 2023
Abstract
Organic dyes dissolved in water are of major concern, due to their characteristic persistence and accumulation in the environment and living organisms, leading to harmful effects such as mutagenicity, and carcinogenicity. To address this concern, this study aimed to explore the effectiveness of a bio-adsorbent prepared from spent coffee grounds and calcium alginate, referred to as SCG_ALG, in the removal of methylene blue (MB) from water. SCG_ALG exhibited an impressive Langmuir maximum adsorption capacity of 1601.85 mg g−1, besides a strong stability within a pH range of 2–10 and outstanding cyclability. The adsorption process was examined through kinetics and adsorption data, which were best fitted to PFO and Temkin's models, indicating weak physicochemical interactions. The thermodynamic study confirmed that the adsorption was a physisorption process. The possible interaction mechanism between MB and SCG_ALG was proposed through XPS spectroscopy and pH analysis. Electrostatic and π–π interactions were suggested to be involved in the adsorption mechanism. As a result, SCG_ALG emerges as a promising, cost-effective, environmentally friendly, and non-toxic adsorbent for removing MB from water-sourced and natural sources, highlighting the easy separation of the material from the solution, owing to its high adsorption capacity, reusability, and broad applicability.
Sustainability spotlightWe present here a new sustainable technology of a low-cost polymer in water remediation. More specifically, a spent coffee grounds and calcium alginate polymer was synthetised for a high methylene blue adsorption with outstanding stability under different pH range. |
Introduction
The realm of environmental pollution can be classified into three main types: air, soil, and water pollution. Of these, water pollution is particularly problematic due to the multitude of detrimental pollutants, posing threats to both human well-being and the balance of ecosystems.1In the last decades, there has been a remarkable expansion of the industrial sector. Specifically, the textile industry has generated an indiscriminate release of pollutants into water, generating the contamination of multiple water bodies.2 These water pollutants include heavy metals, pharmaceuticals, pesticides, and organic dyes.3 Unquestionably, the pollutants are discharged into rivers, lakes, and oceans, impacting entire aquatic ecosystems. Moreover, the presence of organic dyes exhibits a clear risk. The most common are Rhodamine B, Victoria blue, Rose Bengal, Indigo Red, Carmine, Red 120, Eriochrome, Methylene Blue (MB), Black-T (EBT), and Thymol blue.4 Most of them show stable and complex structures, which make their environmental degradation by natural processes difficult. Organic dyes display several adverse effects that can be lethal, such as mutagenic potential at the chromosome level, generating DNA and RNA damage, and eventually becoming carcinogenic.5
To tackle this problem, numerous technologies have been employed for the removal of dyes from water, such as photocatalysis,4 oxidation,6 biological,7 filtration,8 and adsorption.9 Adsorption is a method that has been widely employed for purification and separation throughout history. Adsorption is a surface process, employ a porous solid material as adsorbent placed in a fluid that interacts with its components, adsorbates, through chemical or physical processes.10 Traditional adsorbents such as zeolites,11 activated carbons,12 and biomass13 have been employed for dyes removal from water. The use of residual biomass as adsorbent, presents a low-cost and ecological approach derived from renewable sources, offering a non-toxic and environmentally benign solution. Despite the advantages of employing biomass as adsorbent, frequently pretreatments are necessary, such as pyrolysis or carbonization in order to improve their characteristics for adsorption applications. However, this treatments leads to increment costs and the generation of toxic by-products.14 However, in most cases, low adsorption capacities are obtained. Activated carbons from almond shells, walnut shells, apricot stones, and hazelnut shells exhibit adsorption capacities of 1.33, 3.53, 4.11, and 8.82 mg g−1, respectively.15
The use of residual biomass avoiding complex pretreatments, such as the use of spent coffee grounds encapsulated in non-toxic biopolymer, as alginate, offer advantages over other bioadsorbents. Moreover, pyrolyzed spent coffee grounds has been used for MB and methylene orange adsorption; however, the pyrolysis process increase the cost of the water treatment.16 Torres-Caban and coworkers reported previously spent coffee grounds encapsulated in alginate for heavy metal removal from water.17,18 It is worth mentioning encapsulation of spent coffee grounds on alginate beads (SCG_ALG) by ionic gelation has never been used for the removal of dyes from the water which offers an excellent alternative compared to other bioadsorbents. Thus, herein, SCG_ALG was successfully applied for MB adsorption as a strategy that yields a renewable and environmentally friendly adsorbent, maintaining non-toxicity and affordability with excellent performance.
Experimental
Chemicals
Methylene blue (MB) dye and sodium nitrate (NaNO3, purity ≥ 99.0%) was supplied by MERCK, USA. Ethanol (C2H5OH, purity 96%) was purchased from Mayer. Nitric acid (HNO3, 69.1%) was obtained from Fermont. Sodium hydroxide (NaOH, purity > 99.5%) was supplied by MACRON, Sweden. Food-grade sodium alginate (C6H7O6Na)n and calcium chloride (CaCl2) were obtained from Deiman, Sweden. Sodium chloride (NaCl, purity ≥ 99.0%) and monopotassium phosphate (KH2PO4, purity ≥ 99.0%) was supplied by Tecsiquim, Mex. Magnesium chloride hexahydrate (MgCl2·6H2O, purity ≥ 99.0%). Sodium sulphate (Na2SO4, purity ≥ 99.0%). All reagents and solvents were used as received from commercial suppliers without further purification. The tap water, lake water, and well water employed were obtained from the Laboratorio Nacional de Ciencia, Tecnología y Gestión Integrada del Agua (LNAgua), Chapultepec Lake, and a well located in Sinaloa, Mexico, respectively.Preparation of spent coffee grounds–alginate biocomposite beads
To prepare SCG_ALG biocomposite beads, 4 grams of spent coffee grounds were added to a sodium alginate solution (1% w v−1), prepared with water preheated to 60 °C, under stirring until a homogeneous mixture was obtained. Afterward, the mix of spent coffee grounds/alginate solution was added by dropping via syringe to a CaCl2 solution (1% w v−1). The SCG_ALG beads were stirred for 120 min to reach the complete cross-linking. Finally, the SCG_ALG beads were rinsed with deionized water.Instruments
Detailed information on the instrumental techniques is available in Section S1.†Adsorption experiments
Experiments were carried out by triplicate. MB dye adsorption experiments were performed by adding a known mass (5–50 mg) of the adsorbent SCG_ALG in a fixed volume (20–80 mL) with an initial concentration of MB (10–1200 mg L−1) under stirring at a specific time (180–1440 min), at a fixed temperature (25–60 °C), under a controlled pH (2–10), at the end of the experiments by UV-vis was analized the residual amount of MB at the wavelength of 664 nm. More detailed information is available in the S3 Section.†The equilibrium adsorption capacity (mg g−1), Qe, of MB was calculated according to eqn (1):
 | (1) |
The removal efficiency (%) of MB adsorption by SCG_ALG was calculated according to eqn (2):
 | (2) |
Results and discussion
Characterization of SCG_ALG
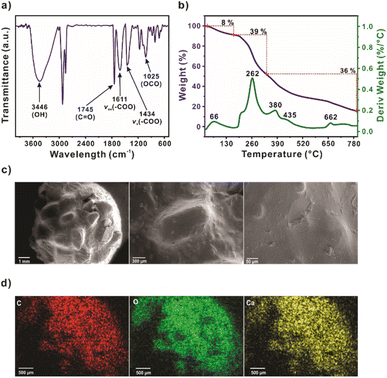
Fourier-transform infrared (FT-IR) was carried out to determine the presence of the principal functional groups from the spent coffee grounds and alginate contained in SCG_ALG (Fig. 1a). The band for the characteristic stretching vibration of hydroxyl groups (O–H) was observed at 3446 cm−1. The 2921 and 2856 cm−1 bands were attributed to asymmetric and symmetric C–H stretching, respectively. The distinctive signal at 1745 cm−1 correspond to the carbonyl group (C![[double bond, length as m-dash]](https://www.rsc.org/images/entities/char_e001.gif) O) derived from the carboxylic acids groups.19 Moreover, the bands at 1611 and 1434 cm−1 are characteristic of asymmetric and symmetric carboxylate stretching vibrations from alginate. The presence of the C–O–C band at 1025 cm−1 is attributed to the polysaccharides present in the spent coffee grounds, as well as the interlinking of units within the alginate structure.20 Thermogravimetric analyses were performed to determine the content and thermal stability of SCG_ALG (Fig. 1b). The TGA-DTG consists of three stages. The first stage was attributed to dehydration (25–170 °C, 8 wt%) with a DTG peak at 66 °C. The second stage (170–335 °C, 39 wt%) was associated with the biopolymers, such as the hemicellulose decomposition from the spent coffee grounds, the formation of calcium carbonate as an intermediate, and the preliminary alginate degradation. The third stage (335–800 °C) was related to cellulose and lignin pyroysis, and alginate degradation.21,22 The zeta potential analysis was performed to determine the charge of the double layer formed in SCG_ALG surface. Both spent coffee grounds (SCG) and alginate beads (ALG) exhibited negative zeta potential values across the examined pH range analyzed, except for SCG at pH 2, where a positive value was observed. After modifying the spent coffee grounds with calcium alginate, the surface polarity of the biomass adsorbent was altered, and as a result, the composite exhibited negative zeta potential values across the entire pH range investigated, Table S1.† (ref. 23)
O) derived from the carboxylic acids groups.19 Moreover, the bands at 1611 and 1434 cm−1 are characteristic of asymmetric and symmetric carboxylate stretching vibrations from alginate. The presence of the C–O–C band at 1025 cm−1 is attributed to the polysaccharides present in the spent coffee grounds, as well as the interlinking of units within the alginate structure.20 Thermogravimetric analyses were performed to determine the content and thermal stability of SCG_ALG (Fig. 1b). The TGA-DTG consists of three stages. The first stage was attributed to dehydration (25–170 °C, 8 wt%) with a DTG peak at 66 °C. The second stage (170–335 °C, 39 wt%) was associated with the biopolymers, such as the hemicellulose decomposition from the spent coffee grounds, the formation of calcium carbonate as an intermediate, and the preliminary alginate degradation. The third stage (335–800 °C) was related to cellulose and lignin pyroysis, and alginate degradation.21,22 The zeta potential analysis was performed to determine the charge of the double layer formed in SCG_ALG surface. Both spent coffee grounds (SCG) and alginate beads (ALG) exhibited negative zeta potential values across the examined pH range analyzed, except for SCG at pH 2, where a positive value was observed. After modifying the spent coffee grounds with calcium alginate, the surface polarity of the biomass adsorbent was altered, and as a result, the composite exhibited negative zeta potential values across the entire pH range investigated, Table S1.† (ref. 23)
A scanning electron microscope (SEM) was employed to analyze the morphology of the SCG_ALG surface (Fig. 1c). It is possible to appreciate the distribution of the coffee beans over the surface, covered by a thin alginate layer. Small alginate clusters are observed, probably due to disordered cross-linking during calcium chloride solution contact. Also, minor fibers from the alginate on the surface of the material are observed. Due to the bead dehydration, it is possible to note rips in the alginate layer, revealing the coffee beans in a more detailed view (Fig. S4†). Furthermore, the mapping micrographs show a homogenous carbon, oxygen, and calcium distribution in SCG_ALG (Fig. 1d). Additionally, the surface area and pore volume of SCG_ALG were determined by N2 adsorption–desorption isotherm. Results measured at 77 K (Fig. S5b†) indicate that SCG_ALG has a BET surface area and pore volume of 115 m2 g−1 and 0.13 cm3 g−1, respectively, in agreement with previously reported, suggesting a microporous pore distribution.24 The crystal structure of SCG_ALG was evaluated by powder X-ray diffraction (PXRD). The obtained diffraction pattern of SCG_ALG (Fig. S5a†) is similar to that reported previously.25
The survey XPS spectrum of SCG_ALG shows the characteristic peaks of C 1s, O 1s, and Ca 2p, which are the main components of SCG_ALG (Fig. 2a). The high-resolution XPS spectrum of C 1s displays peaks at 284.4, 285.0, 286.4, and 288.5 eV, which are related to C![[double bond, length as m-dash]](https://www.rsc.org/images/entities/char_e001.gif) C in the aromatic rings, C–C/C–CH, C–N/C–O from the skeleton in the spent coffee grounds and alginate, and C
C in the aromatic rings, C–C/C–CH, C–N/C–O from the skeleton in the spent coffee grounds and alginate, and C![[double bond, length as m-dash]](https://www.rsc.org/images/entities/char_e001.gif) O from carboxylic moieties, respectively (Fig. 2b). The high-resolution XPS spectrum of O 1s shows peaks at 531.2, 532.2, and 533.5 eV, associated with C
O from carboxylic moieties, respectively (Fig. 2b). The high-resolution XPS spectrum of O 1s shows peaks at 531.2, 532.2, and 533.5 eV, associated with C![[double bond, length as m-dash]](https://www.rsc.org/images/entities/char_e001.gif) O, C–O, and C–O–C
O, C–O, and C–O–C![[double bond, length as m-dash]](https://www.rsc.org/images/entities/char_e001.gif) O bonds (Fig. 2c). This result confirms the presence of carboxylate groups and surface OH clusters in SCG_ALG.26 The high-resolution XPS spectra of Ca 2p peak at 347.5 eV corroborate the cross-linking to form SCG_ALG by the exchange of sodium, contained in sodium alginate, with calcium, from CaCl2, during the ionic gelation (Fig. 2d).27
O bonds (Fig. 2c). This result confirms the presence of carboxylate groups and surface OH clusters in SCG_ALG.26 The high-resolution XPS spectra of Ca 2p peak at 347.5 eV corroborate the cross-linking to form SCG_ALG by the exchange of sodium, contained in sodium alginate, with calcium, from CaCl2, during the ionic gelation (Fig. 2d).27
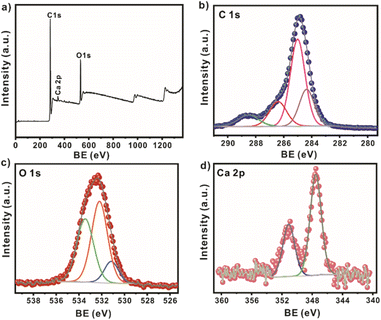 | ||
| Fig. 2 (a) XPS survey spectrum of SCG_ALG; high-resolution spectra of (b) C 1s; (c) O 1s; and (d) Ca 2p for SCG_ALG. | ||
Adsorbent mass, contact time, pH, and pollutant initial concentration effect on MB adsorption
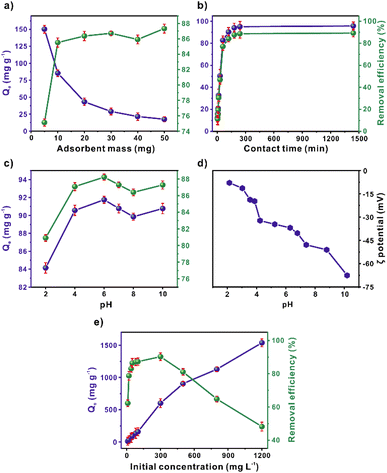
The mass effect was evaluated from 5 to 50 mg of SCG_ALG (Fig. 3a). The removal increased as a function of the mass. A decrement in the adsorption capacity can be observed, evidencing the relation between adsorption and available sites. Considering the results, the optimum mass was determined at 10 mg of SCG_ALG. Control experiments were performed in which SCG and ALG were evaluated in comparison with SCG_ALG. The results showed (Fig. S7†) that in the case of ALG the MB removal efficiency was lower than SCG_ALG and SCG. The use of SCG on the other hand was difficult, due to the complexity of separating it from the solution, contrary to its encapsulated form, SCG_ALG. Fig. 3b shows the contact time influence over MB adsorption using SCG_ALG. In the first 60 min, a fast adsorption stage occurs (77% removal, 82 mg g−1), reaching an equilibrium at 180 min of interaction time between the adsorbate and adsorbent.Moreover, a relevant factor in adsorption is the pH solution, since the pH value changes the surface charge of the bio-adsorbent. Thus, a 2–10 pH range was evaluated (Fig. 3c). At high pH values, the MB adsorption was favourable; considering the SCG_ALG zeta potential (Fig. 3d), electrostatic interactions might contribute to the adsorption since, at higher pH, the surface of the adsorbent was charged negatively. Whereas at pH 2, the adsorption was reduced, which was associated with the repulsion that occurs among the protonated surface groups, such as carboxyl and hydroxyl functional groups, and the MB molecules, which exhibit a cationic character.28 Furthermore, the pollutant initial concentration evaluation exhibited an increase in the adsorption capacity, achieving an maximum experimental value of 1537 mg g−1 (Fig. 3e). This result indicates that SCG_ALG shows a high adsorption capacity.
In addition, Table S3† summarizes the MB Langmuir adsorption capacities reported from other bioadsorbents and for SCG_ALG. The SCG_ALG adsorption performance was higher than the traditional bioadsorbents like activated carbon, zeolite, banana peel, peanut hull, and rice husk. Although conventional adsorbents have low cost because of their natural source, their adsorption capacity is usually low and slow. Also, SCG_ALG has shown to be a cost-effective, environmentally friendly, non-toxic, and effective adsorbent for removing methylene blue from wastewater.
Adsorption kinetics, isotherms, and thermodynamics
The kinetic models pseudo-first-order (PFO), pseudo-second-order (PSO), Elovich, and Intra-particle diffusion (IPD) were evaluated using the non-linear equations in the experimental adsorption capacity data. These models are typically employed in the adsorption of contaminants from water. The pseudo-first-order model assumes that the adsorption rate over time is proportional to the adsorbed saturation over time. The pseudo-second-order model assumes that the limiting stage is a chemisorption.29 Elovich, often utilized in adsorption, assumes that the surface of the solid adsorbent possesses energetically heterogeneous interaction sites.30 The intra-particle diffusion model is widely applied in the adsorption of contaminants by bioadsorbents such as corn-husk,31 and wood.32 This model involves three stages, the diffusion through the liquid phase that surrounds the solid adsorbent, the diffusion inside the pore, and the adsorption of the contaminant at the interaction sites.33The equations employed are summarized in Table S4 of the ESI.†R2 and constants values for the differents adsorption kinetics models are displayed in Table 1. The results of the kinetic fits provide information about the rate at which MB adsorption occurs on the SCG_ALG surface.34 Fig. S2a† shows the non-linear kinetic fits for MB adsorption using SCG_ALG. The experimental data concerning the removal of MB fit well with the pseudo-first-order kinetic model. This suitability is supported by the high correlation coefficient (R2) of 0.995, which surpasses those of the other models: 0.976, 0.864, and 0.571. The adsorption capacity (Qe) determined through the PFO model is similar to that experimentally obtained, being 95.41 and 95.78 mg g−1 for calculated and experimental Qe, respectively. This correspondence suggests the possibility that the MB removal by SCG_ALG is primarily due to physisorption interactions.35
| Model | Constants model | |
|---|---|---|
| Pseudo-first order | k 1 (mg g−1 min−1) | 0.028 |
| Q e (mg g−1) | 95.416 | |
| R 2 | 0.995 | |
| Pseudo-second order | k 2 (mg g−1 min−1) | 0.0003 |
| Q e (mg g−1) | 3.578 | |
| R 2 | 0.976 | |
| Elovich | β (mg g−1) | 0.053 |
| α (mg g−1 min−1) | 8.270 | |
| R 2 | 0.864 | |
| Intra-particle diffusion | k i (mg g−1 min−1) | 2.500 |
| C i (mg g−1) | 30.724 | |
| R 2 | 0.571 | |
Therefore, adsorption isotherms were analyzed to elucidate the possible MB molecules interaction with the surface of SCG_ALG within the liquid phase. The non-linear fitting of the Langmuir, Freundlich, Temkin, Dubinin–Radushkevich, and SIPS models was performed for this purpose. (Fig. S2b†). The non-linear equations and the parameters obtained are summarized in Tables S4 and S5.† The R2 obtained were 0.986, 0.977, 0.977, 0.925, and 0.919 for Temkin, Langmuir, SIPS, Freundlich, and Dubinin–Radushkevich respectively. It can be evidenced from the R2, that the best-fitting models are Temkin and Langmuir. Langmuir implies monolayer adsorption, and Temkin considers a heterogeneous distribution of the interaction sites.36 The maximum adsorption capacity calculated from Langmuir was 1601.85 mg g−1. However, the model with the best fit, 0.986 R2, was the Temkin model. SCG_ALG displays a superior maximum adsorption capacity compared to similar bio-adsorbents such as activated carbon, fruit peels, and even spent coffee grounds (Table S3†).
Furthermore, the temperature dependence over MB removal was evaluated. This analysis provides information related to the enthalpy ΔH, entropy ΔS, and the free energy of Gibss ΔG (Tables S7 and S8†). The temperatures studied were 298, 313, 323, and 333 K. Fig. 4a shows a decrease in adsorption capacity, from 76 to 60 mg g−1 as the temperature increases. The negative values of ΔH and ΔG obtained, −16.44 kJ mol−1 and −4.65 to −3.26 kJ mol−1, respectively, indicated an exothermic and spontaneous adsorption process. In addition, the negative value of ΔS (−0.0396 kJ mol−1) evidenced a decrease in the degree of randomness of the MB molecules. Hence, the MB adsorption becomes more orderly with the temperature increases due to the decreased molecular motion.37,38 Also, a ΔH value suggests a physisorption process,39 which is in agreement with the PFO kinetic model results.
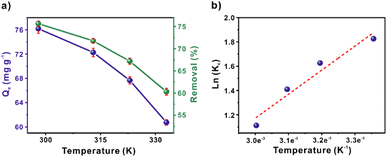 | ||
| Fig. 4 (a) Effect of temperature and (b) thermodynamic fitting model for MB adsorption ([MB] = 50 mg L−1; SCG_ALG = 10 mg, volume = 20 ml, time = 60 min, pH = 6, temperature = 25, 40, 50, 60 °C). | ||
Adsorption interactions
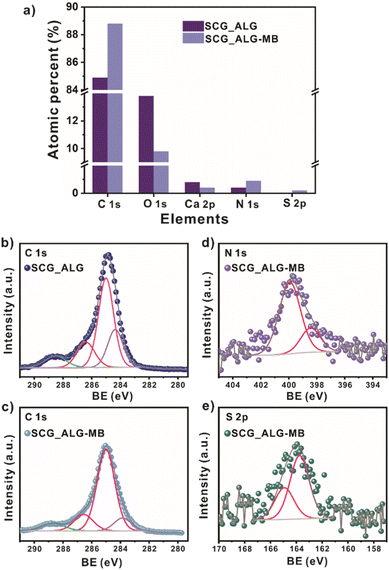
The possible adsorption mechanism was studied using XPS spectroscopy (Fig. 5). The atomic percent of the elements from the XPS survey spectrum in the sample after MB adsorption demonstrated the presence of S, only found in the MB molecule (Fig. 5a, Table S9†). The content of C and N atoms was enhanced after adsorption, corroborating the adsorption of MB on the SCG_ALG adsorbent. In addition, a slight shift of 0.2 eV is observed in the O 1s high-resolution signals for C–O and C–O–C![[double bond, length as m-dash]](https://www.rsc.org/images/entities/char_e001.gif) O contributions, which is associated with possible interactions between the carboxylic acid, carboxylate, carbonyl groups on the adsorbent material with the pollutant molecule40 (Table S10†). Also, a considerable change is observed in the C 1s signals (Fig. 5b and c, Table S11†). The peak at 284.4 eV related to C
O contributions, which is associated with possible interactions between the carboxylic acid, carboxylate, carbonyl groups on the adsorbent material with the pollutant molecule40 (Table S10†). Also, a considerable change is observed in the C 1s signals (Fig. 5b and c, Table S11†). The peak at 284.4 eV related to C![[double bond, length as m-dash]](https://www.rsc.org/images/entities/char_e001.gif) C from the aromatic rings was shifted to a lower value of 283.9 eV, and the atomic percent for this signal decreased almost 50%. The high-resolution signal of N 1s (Fig. 5d, Table S13†) shows two contributions at 398.4 and 399.9 eV related to –N(CH3)2 and –N
C from the aromatic rings was shifted to a lower value of 283.9 eV, and the atomic percent for this signal decreased almost 50%. The high-resolution signal of N 1s (Fig. 5d, Table S13†) shows two contributions at 398.4 and 399.9 eV related to –N(CH3)2 and –N![[double bond, length as m-dash]](https://www.rsc.org/images/entities/char_e001.gif) C, respectively, due to the presence of the amine group in the MB molecule. For the S 2p region (Fig. 5e, Table S14†), the peak at 163.7 eV corresponds to –S
C, respectively, due to the presence of the amine group in the MB molecule. For the S 2p region (Fig. 5e, Table S14†), the peak at 163.7 eV corresponds to –S![[double bond, length as m-dash]](https://www.rsc.org/images/entities/char_e001.gif) C in the MB structure.9 Moreover, the presence of a high density of aromatic rings with an electron-rich π system in the adsorbent material can generate a π–π interaction with the aromatic ring of the MB structure.9
C in the MB structure.9 Moreover, the presence of a high density of aromatic rings with an electron-rich π system in the adsorbent material can generate a π–π interaction with the aromatic ring of the MB structure.9
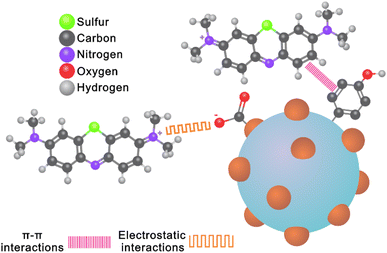
Fig. 6 shows a schematic representation of the possible interactions involved in the adsorption mechanism during the removal of MB using SCG_ALG as bio-adsorbent. Electrostatic interactions are enhanced between MB molecules and the surface of SCG_ALG with increasing pH due to deprotonation of the hydroxyl groups on SCG_ALG.41 Through XPS, it was possible to propose the π–π interactions of MB molecule with the aromatic rings contained in the spent coffee present in SCG_ALG.42 In addition, FT-IR corroborated the π–π interactions due to a shift in the bands corresponding to the aromatic content of SCG_ALG.9 From the adsorption studies and spectroscopies characterization, it was concluded that electrostatic, π–π interactions play the main role in the adsorption of MB from aqueous solution using SCG_ALG as bio-adsorbent.
Ion influence
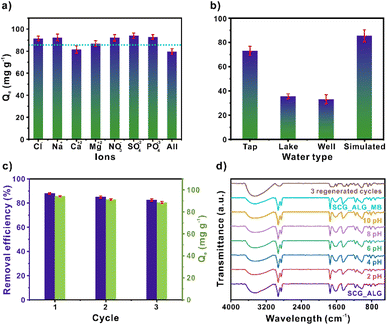
In Fig. 7a, it can be observed that in the presence of cations, the adsorption capacity of MB is reduced, which can be attributed to a competition between the cations, M+, and the MB for the negatively charged sites on the SCG_ALG surface since both are positively charged.43 The removal performance of SCG_ALG for practical applications for the adsorption of MB was evaluated employing tap, lake, and well water (Fig. 7b). With lake and well water, the adsorption capacity decrease to approximately half of the obtained with deionized water. This result can be related to the presence of other pollutants in these systems, which generates competition for the available adsorption sites. However, it can be noted that the composite shows significant performance in real applications. In contrast, the adsorption capacity of tap water was quite similar. However, despite the reduction in the removal performance, SCG_ALG possesses a broad application range. The experiments with water collected from natural sources evidenced a lowest removal of MB from complex matrices since these samples contain other pollutants and compounds that are naturally found in water. Notably, the use of SCG_ALG highlights the low-cost and non-toxic properties of bio-adsorbent and its easy separation from the solution.Reusability
The reusability study of SCG_ALG was performed with three cycles. Fig. 7c shows the variation in the adsorption process. A minimal variation over the three cycles is observed, decreasing from 94 to 88 mg g−1 in the adsorption capacity. Also, similar to the adsorption capacity, the percentage of removal efficiency decreased negligible over these three cycles, from 87.93% to 82.53% of removal. Thus, SCG_ALG possesses high cyclability over MB.Furthermore, stability tests were performed for SCG_ALG in the 2–10 pH interval. Fig. 7d shows the FT-IR spectra of the SCG_ALG after soaking it in water at different pH values for 24 h. It is evident that there are negligible variations in the characteristic bands of SCG_ALG; therefore, SCG_ALG is stable in this pH range. Additionally, the spectrum from the first adsorption shows slight shifts in the band of the carbonyl group, attributed to the carboxylic acid groups. This shift may be due to the interaction of the MB molecules through electrostatic interactions with the SCG_ALG surface.44 A displacement in the band related to the aromatic rings of the adsorbent is evidenced, which could be attributed to possible interactions with the MB.45 However, after three adsorption cycles, the spectrum reveals a general deformation of the original spectrum, suggesting that SCG_ALG is modified after the three adsorption cycles.
Conclusions
To summarize, a spent coffee grounds–calcium alginate biosorbent (SCG_ALG) was prepared through ionic gelation, which enhanced the utilization of a green adsorbent for water remediation. SCG_ALG possess functional groups that facilitate the adsorption of MB. Therefore, SCG_ALG showed a high Langmuir maximum adsorption capacity of 1601.85 mg g−1. This adsorbent also had high stability in the 2–10 pH range and good cyclability. Kinetic and adsorption data were fitted to the PFO and Temkin's models, which were associated with physicochemical interactions; this result was in good correlation with the low ΔH related to the physisorption process. The possible adsorption mechanism was studied using XPS spectroscopy and pH analysis experiments. It was evidenced that electrostatic and π–π interactions are involved in adsorption. Moreover, this study has displayed the practical use of spent coffee grounds and the high opportunity to use this waste into a composite that shows easy regeneration and outstanding separability, avoiding centrifugation. Also, the materials exhibit high performance for MB adsorption even in natural water systems. In this case, SCG_ALG is postulated as an attractive alternative for real applications in water treatment.Conflicts of interest
There are no conflicts to declare.Acknowledgements
C. V. F. and J. L. O. thank CONAHCYT for the PhD fellowships (1003953 and 1040318). C. L. thanks to IPN SIP and Innovation projects (20231282 and 20232785). We thank U. Winnberg (Euro Health) for scientific discussions and G. Ibarra-Winnberg for scientific encouragement.References
- P. Chowdhary, R. N. Bharagava, S. Mishra and N. Khan, in Environmental Concerns and Sustainable Development, Springer Singapore, Singapore, 2020, pp. 235–256 Search PubMed.
- Md. K. Hasan, A. Shahriar and K. U. Jim, Heliyon, 2019, 5, e02145 CrossRef PubMed.
- S. Madhav, A. Ahamad, A. K. Singh, J. Kushawaha, J. S. Chauhan, S. Sharma and P. Singh, Advanced Functional Materials and Sensors, 2020, pp. 43–62 Search PubMed.
- A. Rafiq, M. Ikram, S. Ali, F. Niaz, M. Khan, Q. Khan and M. Maqbool, J. Ind. Eng. Chem., 2021, 97, 111–128 CrossRef CAS.
- B. Lellis, C. Z. Fávaro-Polonio, J. A. Pamphile and J. C. Polonio, Biotechnol. Res. Innov., 2019, 3, 275–290 CrossRef.
- J.-B. Tarkwa, N. Oturan, E. Acayanka, S. Laminsi and M. A. Oturan, Environ. Chem. Lett., 2019, 17, 473–479 CrossRef CAS.
- X. Wang, X. Gu, D. Lin, F. Dong and X. Wan, Dyes Pigm., 2007, 74, 736–740 CrossRef CAS.
- X.-Y. Ma, T.-T. Fan, G. Wang, Z.-H. Li, J.-H. Lin and Y.-Z. Long, Compos. Commun., 2022, 29, 101017 CrossRef.
- J. L. Obeso, A. López-Olvera, C. V. Flores, E. Martínez-Ahumada, R. Paz, H. Viltres, A. Islas-Jácome, E. González-Zamora, J. Balmaseda, S. López-Morales, M. A. Vera, E. Lima, I. A. Ibarra and C. Leyva, J. Mol. Liq., 2022, 368, 120758 CrossRef CAS.
- M. A. Al-Ghouti and D. A. Da'ana, J. Hazard. Mater., 2020, 393, 122383 CrossRef CAS.
- F. Piri, A. Mollahosseini, A. Khadir and M. Milani Hosseini, J. Environ. Chem. Eng., 2019, 7, 103338 CrossRef CAS.
- A. H. Jawad, A. Saud Abdulhameed, L. D. Wilson, S. S. A. Syed-Hassan, Z. A. ALOthman and M. Rizwan Khan, Chin. J. Chem. Eng., 2021, 32, 281–290 CrossRef CAS.
- Z. Jiang and D. Hu, J. Mol. Liq., 2019, 276, 105–114 CrossRef CAS.
- Z. Heidarinejad, M. H. Dehghani, M. Heidari, G. Javedan, I. Ali and M. Sillanpää, Environ. Chem. Lett., 2020, 18, 393–415 CrossRef CAS.
- A. Aygün, S. Yenisoy-Karakaş and I. Duman, Microporous Mesoporous Mater., 2003, 66, 189–195 CrossRef.
- I. Block, C. Günter, A. Duarte Rodrigues, S. Paasch, P. Hesemann and A. Taubert, Materials, 2021, 14, 3996 CrossRef CAS PubMed.
- R. Torres-Caban, C. A. Vega-Olivencia and N. Mina-Camilde, Appl. Sci., 2019, 9, 4531 CrossRef CAS.
- R. Torres-Caban, C. Vega-Olivencia, L. Alamo-Nole, D. Morales-Irizarry, F. Roman-Velazquez and N. Mina-Camilde, Materials, 2019, 12, 395 CrossRef CAS.
- N. Wang and L.-T. Lim, J. Agric. Food Chem., 2012, 60, 5446–5453 CrossRef CAS.
- G. Lawrie, I. Keen, B. Drew, A. Chandler-Temple, L. Rintoul, P. Fredericks and L. Grøndahl, Biomacromolecules, 2007, 8, 2533–2541 CrossRef CAS.
- I. Ayouch, I. Barrak, Z. Kassab, M. El Achaby, A. Barhoun and K. Draoui, Environ. Technol. Innovation, 2020, 20, 101157 CrossRef CAS.
- F. Taleb, M. Ammar, M. Ben Mosbah, R. Ben Salem and Y. Moussaoui, Sci. Rep., 2020, 10, 11048 CrossRef CAS PubMed.
- C.-H. Wu, C.-Y. Kuo and S.-S. Guan, Desalin. Water Treat., 2016, 57, 5056–5064 CrossRef CAS.
- G. A. Figueroa Campos, J. P. H. Perez, I. Block, S. T. Sagu, P. Saravia Celis, A. Taubert and H. M. Rawel, Processes, 2021, 9, 1396 CrossRef CAS.
- H. Farhid and A. Shaabani, J. Iran. Chem. Soc., 2021, 18, 1199–1209 CrossRef CAS.
- J. Qiu, P. Fan, Y. Feng, F. Liu, C. Ling and A. Li, Environ. Pollut., 2019, 254, 113117 CrossRef CAS.
- R. A. Yeung and R. A. Kennedy, J. Mech. Behav. Biomed. Mater., 2019, 90, 155–164 CrossRef CAS.
- K. Dai, G. Zhao, J. Kou, Z. Wang, J. Zhang, J. Wu, P. Yang, M. Li, C. Tang, W. Zhuang and H. Ying, J. Environ. Chem. Eng., 2021, 9, 105180 CrossRef CAS.
- Y. S. Ho and G. McKay, Process Saf. Environ. Prot., 1998, 76, 332–340 CrossRef CAS.
- T. R. Sahoo and B. Prelot, in Nanomaterials for the Detection and Removal of Wastewater Pollutants, Elsevier, 2020, pp. 161–222 Search PubMed.
- O. M. Paşka, C. Păcurariu and S. G. Muntean, RSC Adv., 2014, 4, 62621–62630 RSC.
- S. G. Muntean, A. Todea, S. Bakardjieva and C. Bologa, Desalin. Water Treat., 2017, 66, 235–250 CrossRef CAS.
- N. Hasani, T. Selimi, A. Mele, V. Thaçi, J. Halili, A. Berisha and M. Sadiku, Molecules, 2022, 27, 1856 CrossRef CAS.
- T. A. Saleh, Interface Sci. Technol., 2022, 65–97 CrossRef.
- A. H. Jawad and A. S. Abdulhameed, Surf. Interfaces, 2020, 18, 100422 CrossRef CAS.
- H. Deng, L. Yang, G. Tao and J. Dai, J. Hazard. Mater., 2009, 166, 1514–1521 CrossRef CAS.
- P. Senthil Kumar, P. S. A. Fernando, R. T. Ahmed, R. Srinath, M. Priyadharshini, A. M. Vignesh and A. Thanjiappan, Chem. Eng. Commun., 2014, 201, 1526–1547 CrossRef CAS.
- Mu. Naushad, A. A. Alqadami, Z. A. AlOthman, I. H. Alsohaimi, M. S. Algamdi and A. M. Aldawsari, J. Mol. Liq., 2019, 293, 111442 CrossRef CAS.
- M. A. Khan, S. Kim, R. A. K. Rao, R. A. I. Abou-Shanab, A. Bhatnagar, H. Song and B.-H. Jeon, J. Hazard. Mater., 2010, 178, 963–972 CrossRef CAS PubMed.
- L. Shi, G. Zhang, D. Wei, T. Yan, X. Xue, S. Shi and Q. Wei, J. Mol. Liq., 2014, 198, 334–340 CrossRef CAS.
- S. Manna, D. Roy, P. Saha, D. Gopakumar and S. Thomas, Process Saf. Environ. Prot., 2017, 107, 346–356 CrossRef CAS.
- S. Fan, Y. Wang, Z. Wang, J. Tang, J. Tang and X. Li, J. Environ. Chem. Eng., 2017, 5, 601–611 CrossRef CAS.
- F. Batzias and D. Sidiras, J. Hazard. Mater., 2007, 141, 668–679 CrossRef CAS.
- A. Nasrullah, A. H. Bhat, A. Naeem, M. H. Isa and M. Danish, Int. J. Biol. Macromol., 2018, 107, 1792–1799 CrossRef CAS PubMed.
- K.-W. Jung, B. H. Choi, M.-J. Hwang, T.-U. Jeong and K.-H. Ahn, Bioresour. Technol., 2016, 219, 185–195 CrossRef CAS.
Footnotes |
| † Electronic supplementary information (ESI) available: Instrumental techniques, characterization, and experimental data. See DOI: https://doi.org/10.1039/d3su00365e |
| ‡ These authors contributed equally to this manuscript. |
| This journal is © The Royal Society of Chemistry 2024 |

