Time's dance with gold: tracking the isomeric fluctuations of Au clusters†
Jingshan S.
Du

Physical Sciences Division, Pacific Northwest National Laboratory, Richland, WA, USA. E-mail: jingshan.du@pnnl.gov
Abstract
This article highlights the recent work of Slater, Palmer, et al. (Nanoscale Horiz., 2024, 9, 143–147, https://doi.org/10.1039/D3NH00291H) on using electron microscopy to observe the structural fluctuations of individual Au nanoclusters directly.
Face-centered cubic (fcc) metals, such as Au and Ag, usually adopt a packed crystal structure in the bulk. However, the equilibrium structure could differ when only a handful of atoms compose a nanocluster. Theories have predicted that particles of less than a few nanometers would favor a decahedral packing with a five-fold symmetry; when even fewer atoms are present, say less than two hundred, a 20-fold icosahedral packing would become the lowest-energy configuration.1 Such fluctuations of the nuclei/seeds may have played a critical role in defining the shape of colloidal nanoparticles in many wet chemical syntheses.2
In a recent article, a cross-institutional team led by Richard E. Palmer and Thomas J. A. Slater reported the direct observation of such fluctuations on a nearly second-by-second basis (https://doi.org/10.1039/D3NH00291H). The team synthesized Au nanoclusters containing 309 ± 15 atoms on an amorphous carbon film through mass-selected magnetron sputtering. Subsequently, aberration-corrected scanning transmission electron microscopy (STEM) was employed to track the atomic structures of Au nanoclusters with a frame rate of 0.4–0.7 per second (Fig. 1). To identify the cluster type in each frame, the team compared them to a collection of simulated images with different cluster structures and tilt angles. The clusters exhibited highly dynamic switching between decahedral, icosahedral, and single-crystalline structures under the electron beam, which is sufficiently strong to overcome the energy barriers between such transitions in the clusters.
 | ||
| Fig. 1 Au309±15 clusters fluctuating under the electron beam. High-angle annular dark field (HAADF) imaging on an aberration-corrected scanning transmission electron microscope (STEM) resolved the atomic structure of these Au nanoclusters frame by frame. Adapted from the supporting data at DOI: https://doi.org/10.5281/zenodo.10522408, CC-BY 4.0. | ||
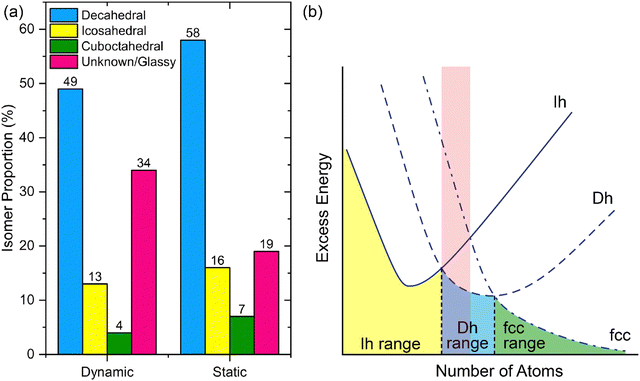
Notably, the authors showed that the Au309±15 clusters favor the decahedral structure the most, followed by icosahedral and then single-crystalline structures (Fig. 2a). This result is consistent with the probabilities obtained from a snapshot of an ensemble. In theory, the lower-energy structures would have a higher probability of appearance. The ranking of isomeric preferences observed in this study indicates that the cluster size is within a range where the energy ranks in the order fcc > icosahedral > decahedral (Fig. 2b).2,3 Taken together, this work illustrates the possibility of using atomic-resolution electron microscopy, when combined with image simulations, to track the isomeric evolution of metal nanoclusters and may shed light on how we understand and regulate nanostructures with atomic precision.
 | ||
| Fig. 2 (a) Histogram of isomer abundances from dynamic movies compared with a static image of a cluster ensemble. Reproduced from https://doi.org/10.1039/D3NH00291H with permission from the Royal Society of Chemistry. (b) Schematic energy landscape of cluster structures for fcc metals. Red shading indicates the cluster size range in the current study. Ih: icosahedral. Dh: decahedral. Adapted from ref. 2 with permission from Wiley-VCH. | ||
Acknowledgements
J. S. D. acknowledges a Washington Research Foundation Postdoctoral Fellowship.References
- J. P. K. Doye and F. Calvo, Phys. Rev. Lett., 2001, 86, 3570–3573 CrossRef CAS PubMed.
- J. S. Du, W. Zhou, S. M. Rupich and C. A. Mirkin, Angew. Chem., Int. Ed., 2021, 60, 6858–6863 CrossRef CAS PubMed.
- F. Baletto and R. Ferrando, Rev. Mod. Phys., 2005, 77, 371–423 CrossRef CAS.
Footnote |
| † This content was originally published on our blogs platform at https://blogs.rsc.org/nh/2024/02/07/times-dance-with-gold-tracking-the-isomeric-fluctuations-of-au-clusters/. The views expressed in this article do not necessarily reflect those of the author's employer or the US government. |
| This journal is © The Royal Society of Chemistry 2024 |

