 Open Access Article
All-atom molecular dynamics simulations of polymer and polyelectrolyte brushes
Raashiq
Ishraaq
and
Siddhartha
Das
 *
*
Department of Mechanical Engineering, University of Maryland, College Park, MD 20742, USA. E-mail: sidd@umd.edu
First published on 23rd May 2024
Abstract
Densely grafted polymer and polyelectrolyte (PE) brushes, owing to their significant abilities to functionalize surfaces for a plethora of applications in sensing, diagnostics, current rectification, surface wettability modification, drug delivery, and oil recovery, have attracted significant attention over the past several decades. Unfortunately, most of the attention has primarily focused on understanding the properties of the grafted polymer and the PE chains with little attention devoted to studying the behavior of the brush-supported ions (counterions needed to screen the PE chains) and water molecules. Over the past few years, our group has been at the forefront of addressing this gap: we have employed all-atom molecular dynamics (MD) simulations for studying a wide variety of polymer and PE brush systems with specific attention to unraveling the properties and behavior of the brush-supported water molecules and ions. Our findings have revealed some of the most fascinating properties of such brush-supported ions and water molecules, including the most remarkable control of nanofluidic transport afforded by the specific ion and water responses induced by the PE brushes grafted on the inner walls of the nanochannel. This feature article aims to summarize some of our key contributions associated with such atomistic simulations of polymer and PE brushes and brush-supported water molecules and counterions.
1. Introduction and background
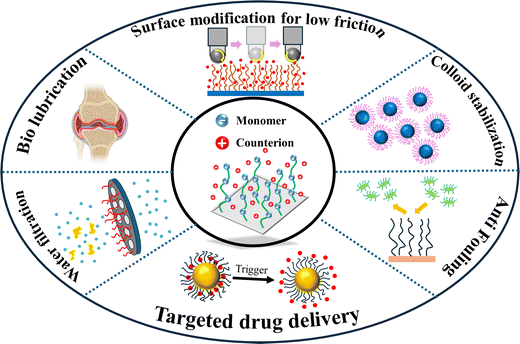
Polymer brushes (PBs) are structures of polymer chains attached or grafted to a surface (a solid substrate or another polymer chain) using one of their ends.1–3 The density of this grafting, which dictates the space between the two adjacent polymer chains, is typically high which compels the polymer chains, in order to avoid overlap with the adjacent chains, to extend away from the grafting surface.4 Therefore, in the presence of a “good” solvent, instead of a typical random coil arrangement, the polymer chains attain the configuration of the bristles of a toothbrush: hence they are denoted as “polymer brushes”. From a thermodynamic standpoint, the formation of the brush-like structure involves a complex interplay of various factors: these include (1) a reduction in the potential energy of the chains achieved by stretching of the chain to prevent steric collisions; (2) the propensity of the polymer chains to either enhance or reduce interaction with the solvent (a characteristic that depends on the specific type of solvent involved in the process); (3) the natural inclination of the polymer chains to coil in a “good solvent” (or a solvent where polymer–solvent interactions are favored), driven by the desire to increase the entropy.5 This intricate balance between entropy, potential energy, and polymer–solvent interactions determines the final structure of the brushes5 (of course, there are examples where polymer brushes have formed in the air, i.e., in the absence of any solvent).3 Polyelectrolyte or PE brushes refer to densely grafted PE chains (PE chains are the polymer chains having monomers containing charges) that form brush-like structures in a favorable solvent.6,7 The existence of the charged monomers for the case of the solvated PE brushes necessitates the presence of the counterions to neutralize the charges. Therefore, for a PE brush system, in addition to the factors identified above, several other complex interactions, such as the columbic repulsion between the chains, counterion-distribution-dictated osmotic pressure, the behavior of the counterions in the electrostatic field developed in the vicinity of the PE brushes, etc., become important.8 There are tens of publications that have carefully addressed these interactions while modeling the configuration (height, monomer distribution, etc.) of the polymer9–19 and the PE brushes.20–27A key feature of the polymer and PE brushes is their excellent ability to respond to the properties of their surroundings. For example, a slight change in the conditions of the surrounding solvent leads to a significant change in the height of the polymer and PE brushes. Such a change has been routinely employed for a variety of applications. Specifically, for the PE brushes, given the importance of parameters such as the charges of the brush monomers, the presence of counterions, etc., it becomes possible that several types of environmental stimuli (e.g., pH of the surrounding liquid medium, nature and concentration of the screening counterions, etc.) can be manipulated to regulate the properties and behaviors of the PE brushes. Such responsiveness to environmental stimuli has been routinely employed for a variety of applications involving the polymer and the PE brushes. Some of such notable applications of the polymer and PE brushes include their use in modifying the wetting28 and adhesive29 properties of surfaces, preparing antifouling30 and antimicrobial surfaces,31 functionalizing nanochannels and nanopores for sensing32 and current rectifications,33 membrane engineering for water filtration,34 making artificial joints or biolubrication,35 functionalizing nanoparticles for applications such as drug36 and gene delivery,37 water harvesting,38 emulsion stabilization,39 and oil recovery.40Fig. 1 schematically summarizes some key applications of the PE brushes.
While there is a lot of flexibility in synthesizing PE brushes for a specific application, it remains a challenge to predict its exact behavior in each setting due to a large number of microscopic and environmental variables that regulate such behavior. These variables include the molecular weight of the polymer chains, polydispersity,41 chemical composition of the chains, solvent type,42 solvent–monomer interactions,43 screening counterion valence,44 counterion structure, the position of the functional group in the chain (side chain or main chain45,46), pH of the solution,47 temperature of the system, concentration and type of the added salt (in addition to the screening counterions), etc. Moreover, additional complexities arise due to the highly non-linear inter-dependence of these different variables. For example, how the salt concentration affects the height of the PE brushes depends on the grafting density, i.e., whether the PE brushes are in the osmotic or semi-osmotic regime, and if the added salt reduces the osmotic pressure.48 This same osmotic pressure governs the nanoconfinement-induced reversal of the charges of the PE brush layer, i.e., for cases where the PE brushes are grafted on the inner walls of a nanochannel.49,50 Considering all these aspects, it is clear that the behavior of the PE brushes and the mechanisms dictating their functions depend on the complicated interplay of various factors and there have been extensive efforts to understand such brush behavior by employing theoretical modeling, experiments, and molecular dynamics (MD) simulations (primarily coarse-grained MD simulations). The challenge is that a fully rigorous understanding of the PE brush behavior is intricately connected to our thorough understanding of the behavior and the properties of the brush-supported counterions and solvent (primarily water) molecules. Such an understanding necessitates conducting all-atom MD simulations of the PE brushes; however, there has been very little effort in conducting such all-atom MD simulations. Acknowledging this significant gap, the present research group has pioneered the use of all-atom MD simulations for capturing the behavior of PE brushes and brush-supported counterions and water molecules. This feature article will provide a focused review of the findings from such studies on all-atom MD simulations of polymer and PE brushes (by both the present research group and other research groups).
The PE brush systems have been explored through theoretical modeling, experiments, and computational approaches. In theoretical modeling, the goal is to get an idea of the structure of the PE brushes by obtaining some macroscopic quantity such as the brush height and monomer distribution. There are notably two approaches for such theoretical modeling: scaling calculations23,51–59 and field theory-based calculations [i.e., the calculations based on the strong stretching theory (SST) or the self consistent field theory (SCFT)].60–66 In both the approaches, the free energy of the overall brush system is first expressed in terms of the various parameters such as the Kuhn length, the number of monomers per chain, grafting density, and most importantly the quantity that will carry structural information of the PE brush system (namely, the brush height for the scaling calculations and the monomer density distribution for the SCFT approach). Subsequently, the free energy is minimized to find the value (or expression) of that quantity.23 Though such approaches have gained some success in reproducing some of the experimentally observed brush properties, there are several drawbacks (associated with the assumptions made) while expressing the functional form of the free energy. Under such circumstances, a lot of information, such as counterion-mediated bridging,67 mechanism dictating counterion-polymer binding,68 solvent behavior inside the brush (e.g., water–water hydrogen bonding inside the brush layer,69–71 or alterations of water structure inside the brush layer72,73), etc. cannot be extracted.
There have been extensive experimental studies on polymer and PE brushes, and they have often been used as benchmarks for testing various theories. Different experimental techniques have been employed for probing the configuration (e.g., height) of the PE brushes. For example, Helm et al. employed X-ray reflectometry to establish that the brush height scales as c−1/3 (where ‘c’ denotes the concentration of the added salt) in the salted brush regimes.74 Neutron reflectometry (NR) is another valuable tool for probing the PE brush structures since NR is capable of determining structures at length scales of 0.1–200 nm at solid–liquid interfaces.75 Using NR, Yu et al. have demonstrated that there can be a significant change in the height of the polystyrene sulfonate (PSS) brushes in the presence of multivalent counterions (Mg2+, Ca2+, Ba2+).76 The review article by Kilbey and Ankner has discussed a host of other important measurements on PE brushes that have been conducted with the NR.77 Ellipsometry has been also used to investigate the equilibrium structure of the PE brushes.78 For example, Hinrichs et al. employed ellipsometry for quantifying the pH-dependent changes in the configuration of the mixed PE brushes consisting of polyacrylic acid and poly-2-vinyl pyridine chains.79 Quartz crystal microbalance with dissipation (QCM-D) monitoring has been used to probe the dynamic processes (e.g., the response of the PE brushes to different adsorbing proteins80) associated with the PE brushes. The QCM-D also allows for precise quantification of the water loss during the collapse of the brush layer and in the process facilitates the monitoring of the brush behavior in response to different ionic environments.80 Recently, Ji et al. employed the QCM-D technique to investigate the swelling of anionic (PSS) and cationic [poly(2-(methacryloyloxy)ethyl) trimethylammonium chloride] (PMETAC) brushes.81 Surface force apparatus (SFA) and atomic force microscopy (AFM) techniques have also been used to investigate the interaction of the PE brushes with different types of surfaces. A detailed discussion of using these surface force measurement techniques for quantifying the brush properties can be found in the review article by Xu et al.82 Unfortunately, just like theoretical investigations, these experimental methodologies also often fail to capture different processes (resolvable at the atomistic scale) dictating the behavior of the brushes and the associated brush–solvent and brush–ion interactions.
In contrast to the theoretical and experimental studies, simulations (which are primarily particle-based simulations) have been able to provide much more details about the PE brushes and the interactions of such brushes with their surroundings (the solvent and the ions). The most widely explored simulation approaches are the coarse-grained (CG) simulations, where a monomer or group of monomers is considered as a single particle which is called the “coarse-grained” bead. The bead–solvent and bead–bead interaction potentials are parameterized to reproduce the structural properties of the polymer brushes. The advantage of using the CG simulations is that such coarse graining of multiple particles into a single bead smoothens the potential energy landscape, and therefore, longer timescales can be reached, and bigger systems can be simulated. Using such coarse graining approaches, several studies have probed into the structure of the polymer and PE brushes,83 and have also investigated the role of charge fraction,84 ion types,85 the presence of electric fields,86etc. into the behavior of the brushes. While extremely powerful, a significant limitation of this approach is that it cannot capture the atomistic details and, therefore cannot elucidate the mechanisms for the unique observed properties that each type of brush displays. To capture such details, researchers must use all-atom MD simulations where each particle represents an individual atom of such a system. Additionally, in such an all-atom MD simulation framework, individual atoms of all the water molecules as well as all the counterions are explicitly modeled, thereby enabling a much more detailed picture of the PE brush-supported counterions and water molecules.
As discussed above, the properties of the PE brushes are governed by factors that have complex inter-relationships between them. One such complex relationship is the interplay between the properties of the brush-supported water molecules, PE functional groups (or the chemical composition of the PE chains), and the counterions screening the PE charges: such complex relationships can neither be explored through coarse-grained MD methods (that “coarsens” out the considerations of individual atoms of the PE chain and often models the water molecules implicitly), nor through experiments (due to the small system size and the difficulty of controlling the experimental parameters). Moreover, it is not straightforward to identify the correct parameters (associated with the properties of the brush-supported water molecules and counterions) that should be probed to get the desired information about the solvated PE brush system. However, these atomistic details about the PE brush system (e.g., the behavior and the properties of the water molecules interacting with the PE brushes) are critical for our better understanding of the brush behavior and functioning. For example, one possible mechanism of anti-fouling activity of some specific brushes is that these brushes often induce a structured water layer, which prevents non-specific protein adsorption on these brushes.87 Similarly, polyzwitterionic brushes are used to fabricate superoleophobic surfaces by utilizing the ability of these brushes to interact highly favorably with the water molecules, thereby enabling the oil molecules to slip along the brush-grafted surfaces.88 Moreover, the ultra-low friction observed in skeletal joints may be attributed to the existence of a water film on cartilage surfaces, which is stabilized by zwitterionic phospholipids.89 All-atom MD simulations become essential to probe the behavior of such brush-supported water molecules with specific accounting of the effect of the individual atoms of the PE chain. This feature article focuses on our group's contributions as well as contributions from other groups to such all-atom MD simulations for unraveling the properties of polymer and PE brushes and brush-supported water molecules and counterions.
The rest of this feature article is organized as follows. In Section 2, we describe the typical workflow of all-atom MD simulation modeling of polymeric systems, simulation procedures, and typical softwares used for carrying out the simulations. In Section 3, we explore the all-atom MD simulation-driven findings of uncharged polymer brushes grafted on diverse types of surfaces. In Section 4, we delve into the all-atom-MD simulations revealing the behavior of anionic PE brushes grafted to a single surface or the walls of a nanochannel (in the presence of an eternal electric field or an externally imposed pressure gradient). Section 5 is dedicated to summarizing the all-atom MD simulation investigations of cationic brushes. In Section 6, we discuss some of our recent efforts in combining machine learning approaches with all-atom MD simulations for better understanding the properties of brush-supported water molecules. Finally, in Section 7, we conclude and identify the future scope of this research topic.
2. Steps in all-atom md simulations of polymer and polyelectrolyte brushes
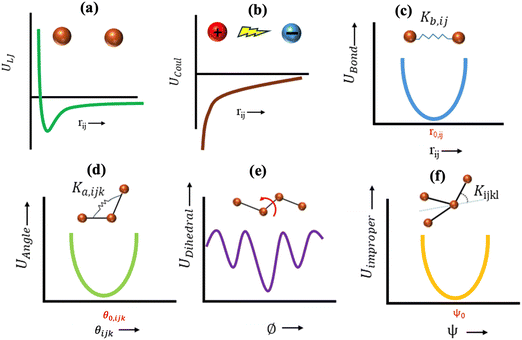
This feature article focuses on our studies as well as studies of other research groups on the all-atom MD simulations of polymer and PE brushes. In atomistic simulations, the first and often the easiest step is creating the topology of a monomer which defines the relative positions of the monomers and their bond connectivities.90 Subsequently, the entire polymeric system is built by replicating the monomers accordingly. The most crucial stage involves selecting the appropriate force fields from a myriad of options.91 Each force field is characterized by a distinct set of parameters and, at times, by diverse functional forms for the different terms. These force fields provide the total potential energy of the system as a function of the atomic coordinates. The force fields are parameterized to reproduce some target variables such as hydration-free energy, coordination number, enthalpy of vaporization, etc. of the standard polymeric systems.92 Some common forcefields for simulating polymeric systems are OPLS-AA,93 AMBER,94 CHARMM,95 GROMOS,96etc. The functional form of a typical forcefield (used for simulating polymeric systems), represented through the overall energy of the system (Utotal), has been described in eqn (1)–(7) below.| Utotal = ULJ + UCoul + UBond + UAngle + UDihedral + UImproper, | (1) |
 | (2) |
 | (3) |
| UBond = Kb,ij(rij − r0,ij)2, | (4) |
| UAngle = Ka,ijk(θijk − θ0,ijk)2, | (5) |
 | (6) |
| Uimproper = Kijkl(ψ−ψ0)2. | (7) |
In the above equations, Utotal, ULJ, UCoul, UBond, UAngle, UDihedral, and UImproper respectively denote the total energy of the system, total energy due to the non-bonded Lennard-Jones (LJ) interactions, total energy due to the non-bonded Coulombic interactions, total energy due to the bonded interaction, total energy due to angular interactions between three successively bonded atoms, total energy due to torsional (or dihedral interaction) interaction between four successively bonded atoms, and total energy due to torsional interaction between four atoms that are not successively bonded (or improper interaction). Also, rij,  ,
,  ,
,  , σij, qi/j, Kb,ij, r0,ij, Ka,ijk, θijk, θ0,ijk, K1/2/3/4, ϕ, Kijkl, ψ0, and ψ respectively denote the distance between atoms i and j, the relative dielectric constant of the medium, the absolute dielectric constant of the medium, the energy depth of the LJ interactions between atoms i and j, the distance between atoms i and j where the LJ interaction energy is zero, charge of atom i/j, stiffness of the bond between atoms i and j, equilibrium length of the bond between atoms i and j, stiffness of the angular bond between atoms i, j, and k, the angular distance between atom i, j and k, the equilibrium value of the angle between atoms i, j, and k, the Fourier coefficients for modeling the dihedral potential, dihedral angle, the torsional stiffness of the improper interaction associated with the atoms i, j, k, and l, equilibrium value of the improper angle between atom i, j, k and l, the improper angle between atom i, j, k and l. In Fig. 2, we show the profiles of these different potentials as functions of the input parameters.
Many research groups including ours use the OPLS-AA forcefield to model polymeric systems.97–100 To explicitly model the solvent water there are many kinds of models: SPC, SPC/E, TIP4P, TIP3P, etc. The water models are generally parameterized to reproduce the following experimental quantities: static dielectric constant, self-diffusion coefficient, thermal expansion coefficient, and isobaric heat capacity.101 The original 3-point water models (TIP3P, SPC models) were parameterized to perfectly reproduce the geometry of a water molecule. However, they were not designed to handle long-range interaction forces, and therefore, while simulating water in bulk, they lead to water with much greater densities. Both TIP3P and SPC models also predict the bulk water to be less structured than that suggested by experiments.102 In 4-point water models (e.g., TIP4P model), on the contrary, there is an extra site where the charge of the oxygen atom is placed for better modeling of electrostatic potential without compromising the geometry. However, simulating such four-point water models requires much more computational time. Among the three-point water models, Mark and Nilson demonstrated that the SPC/E water model predicts the most accurate dynamics and structure of the water molecules.102 In our simulations, we use the SPC/E water model, which is also known for its excellent compatibility with the OPLS-AA forcefield. For modeling the interactions between the counterions and other elements of the system one can use a host of force-fields: e.g., force fields devised by Jensen and Jorgensen,103 Aqvist,104 Roux,105 Smith and Dang,106 and Joung and Chetham.107 These force fields are parameterized by reproducing the results for the hydration-free energy of the ions, ion–water radial distribution functions (RDFs), ion–water energetics, etc. For our studies, we use the Joung and Chetham ion model, which is parameterized with the hydration-free energy and ion–water interaction energy as well as with the lattice energy and lattice constants of the salt.107 This forcefield (for the ions) is also parameterized with the SPC/E water model and is used for a vast variety of polymeric systems that are modeled using the OPLS-AA forcefield.108–110
After selecting the appropriate forcefields (for the polymeric systems, water molecules, and the counterions), energy minimization is performed to obtain a reasonable starting geometry where there is no overlap of particles. Subsequently, the all-atom MD simulations are carried out. At the beginning of the simulations, often the pressure and temperature are equilibrated to the chosen pressure and temperature by using a desired barostat and a desired thermostat, respectively. While several types of different thermostats and barostats can be used, Nosé–Hoover barostat and thermostat are often preferred due to their abilities to better describe the diffusive properties as well as to keep the correlated motions unhindered.111 For faster equilibration, sometimes a Langevin thermostat is also used.67 During the simulations, the system density and temperature are checked regularly in order to ascertain that the system has reached the desired state. Moreover, the property associated with the slowest dynamics (in our case, the PE brush height83) is periodically checked to ensure that it has converged and does not vary significantly over time. After equilibration has been completed, the production run is started. In order to ensure that enough sampling has been conducted during the production cycle, the production time length is compared with the correlation time of the slowest property (PE brush height for our simulations). If the size of the production run is much greater than the correlation time of the slowest property, it is assumed that the system traversed is in its allowable domain in the phase space and therefore the sampling is sufficient. For example, in our all-atom MD simulation-based investigation of the properties of the cationic PMETAC brushes and the brush-supported water molecules and counterions, the correlation time for the brush height is 1 ns, while we conduct the production run for 12 ns.
In Fig. 3, we provide a flow chart summarizing the key steps (and their purposes) employed for all-atom MD simulations of polymer and PE brush systems.
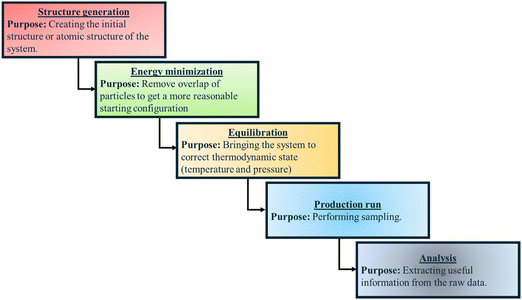 | ||
| Fig. 3 Flow chart summarizing the key steps (and their purposes) employed for all-atom MD simulations of polymer and PE brush systems. | ||
3. Findings from all-atom MD simulations of uncharged polymer brushes
Depending on the chemical composition of the monomers, uncharged polymer brushes can show a wide range of different properties such as thermos-responsiveness,112 hydrophobicity,113 antifouling behavior,114 biocompatibility,115etc. Since there is no net charge on the polymer chains, the chemical functional groups of the polymer chains play a vital role in determining the properties exhibited by such brushes. Some widely used uncharged polymer brushes are poly(N-isopropyl acrylamide) or PNIPAM, which is known for their thermos-responsive properties;116 polyethylene oxide or PEO, known for their biocompatibility properties117 as well as their ion-conducting properties (leveraged in fabricating solid polymer electrolytes118); polypropylene oxide (PPO);119 polydimethylsiloxane (PDMS);120etc. The chemical structures for the monomers of some of these different uncharged polymer chains have been provided in Fig. 4. Although there are several coarse-grained MD simulations and all-atom MD simulation studies investigating the equilibrium121–123 and non-equilibrium properties of various types of polymer brushes,124,125 in this section, we shall mainly discuss the studies of some selected research groups. These studies will include one of our studies and some other studies of a few different groups: these studies have been carefully selected so that they can serve as representatives of all the sub-categories of studies related to this line of investigation.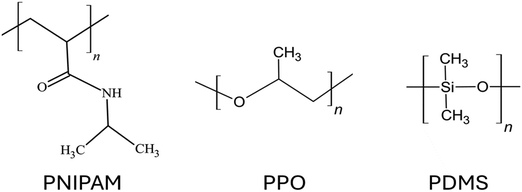 | ||
| Fig. 4 Chemical structures of the monomers of the polymers of some of the commonly used uncharged polymer brushes. | ||
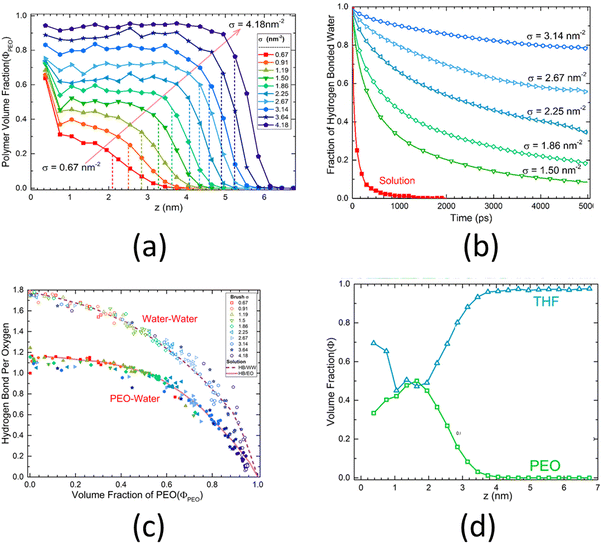
An all-atom MD simulation study on surface-grafted PEO brushes by Dahl et al.126 is a representative example of all the relevant studies of all-atom MD simulations of polyethylene-based polymer brushes. Dahl et al.126 investigated how various static, dynamic, and hydration characteristics of the PEO brushes grafted on a gold surface varied with the grafting density. Their findings showed that at low grafting densities, the PEO brushes were fully hydrated, except for near the grafted end, where the PEO brushes absorbed to the gold surface due to a more favorable PEO–gold interactions than the PEO–water interactions. This result could be confirmed by noting a very high value of the polymer volume fraction near the surface for low grafting densities [see Fig. 5(a)]. However, at higher grafting densities, due to the excluded volume effect of the PEO brushes, this phenomenon was no longer observed. At such high grafting densities, the hydrogen bond lifetime inside the PEO brush layer, on account of the corresponding low volume fraction of water and limited water diffusion (inside the brush layer), increased drastically as compared to that in the bulk PEO solution: this was confirmed by a lower decay rate of the hydrogen-bonded water fraction autocorrelation function [see Fig. 5(b)]. Moreover, Dahl et al. also observed that the number of the PEO–water and water–water hydrogen bonds decreased with an increase in the grafting densities [see Fig. 5(c)]. They also investigated the response of the PEO brushes (grafted on a gold surface) to mixed tetrahydrofuran (THF)–water solvent. They observed that due to the favorable THF–gold interactions, the THF molecules formed a thin layer near the gold substrate. However, due to the strong PEO–water interactions and weak PEO–THF interactions, the THF molecules remained mostly excluded from the interior of the PEO brush layer. This result could be confirmed by noting the volume fraction distribution of the PEO and the THF [see Fig. 5(d)].
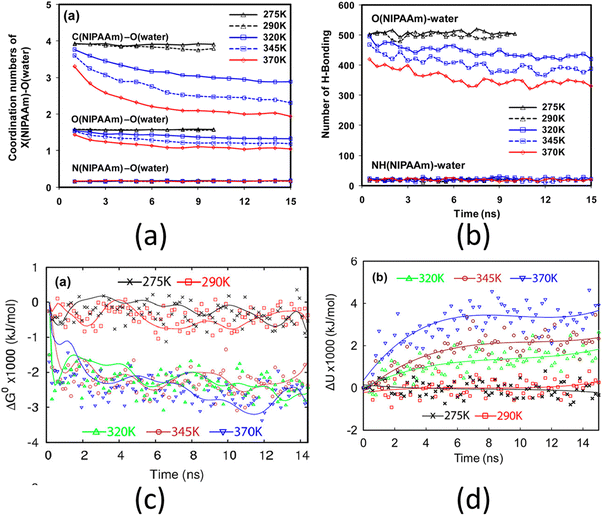
One of the most widely studied thermo-responsive polymers is PNIPAM (poly-(N-isopropylacrylamide)). Solutions of PNIPAM exhibit a lower critical solution temperature (LCST) of approximately 305 K (32 °C) with respect to water. This implies that the aqueous solution of PNIPAM undergoes a phase separation above 305 K (i.e., above the LCST point). The polymer is soluble in water below LCST and becomes less soluble above LCST. An example of a fundamental study on PNIPAM brushes is by Lee et al., where they investigated the de-swelling mechanism of the PNIPAM brushes using all-atom MD simulations.127 Their analysis revealed that above the LCST point, the co-ordination number of the carbon atom of the isopropyl group of the PNIPAM decreased, followed by a decrease in the coordination (or hydration) number of the oxygen and the nitrogen atoms of the PNIPAM monomer [see Fig. 6(a)]. The polar groups and atoms (namely the oxygen and the nitrogen atoms) of the PNIPAM monomer can form hydrogen bonds with the surrounding water molecule. Their analysis revealed that only the oxygen atom lost its ability to form the hydrogen bonds with the surrounding water molecules with temperature [see Fig. 6(b)]. Moreover, they found that above the LCST point, the free energy of the system decreased significantly [see Fig. 6(c)], which indicated a phase separation (from hydrophillic to hydrophobic transition). Lee et al. further argued that since the potential energy of the system continued to increase with temperature [see Fig. 6(d)], the decrease in the free energy was due to an increase in the entropy, and therefore, the phase separation process of PNIPAM was entropically driven.
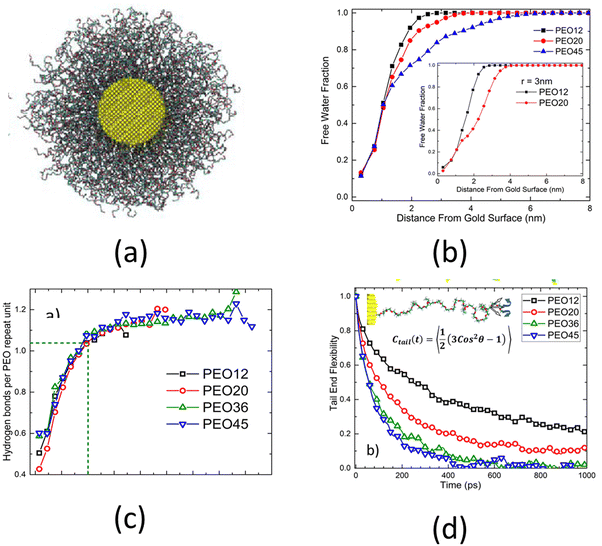
The above-discussed studies considered planar polymer brushes, i.e., polymer chains grafted to planar surfaces. Depending on the curvature and the chemical nature of such substrates, the brush-like architecture can exhibit different properties. An important case where the substrate curvature plays a critical role is the case of spherical polymer brushes, i.e., when polymer brushes are grafted on the outer surface of a solid sphere. A related study is by Dahl et al.,128 where the authors explored the effect of surface curvature and polymer chain length on the chain conformation and hydration properties of spherical PEO brushes, i.e., PEO brushes grafted on the outer surface of spherical gold nanoparticles [see Fig. 7(a)]. At first, by observing the structural features of the spherical PEO brush system, Dahl et al.128 argued that the mushroom-to-brush transition criterion for planar brushes failed to identify the conditions under which the grafted polymer chains form spherical brushes. They also observed that as the length of the PEO chains increased (from 12 monomers to 45 monomers), less free water molecules were available inside the brush layer, as confirmed by the faster decay of the free water fraction for longer chains [see Fig. 7(b)]. However, even though the amount of free water molecules decreased, the long PEO chains remained perfectly solvated since the solvation water molecules were not affected. This indifference in the number of solvation water molecules with the length of PEO chains was inferred by observing that the PEO–water hydrogen bonds per unit monomer remained constant with the chain length [see Fig. 7(c)]. Moreover, Dahl et al.128 found that the end mobility of the polymer chains strongly depended on the chain length. Longer polymer chains had greater mobilities than the shorter chains. The chain mobility was measured using the time dependent orientational order parameter [represented as Ctail in Fig. 7(d)]. A faster decay of Ctail indicated a greater mobility. Dahl et al. also proposed that their findings will have a significant impact for designing medicines for targeted drug delivery as high end-chain mobility prevented protein adsorption.
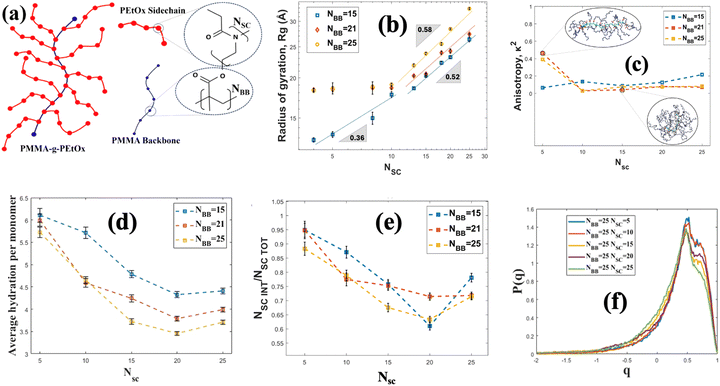
Another important class of brush-like polymeric structure is polymeric bottlebrushes, where the polymer chains are grafted on a backbone polymer chain. Therefore, the bottlebrush polymeric structure consists of a polymeric backbone and polymeric (typically of a different polymer than the backbone polymer) side chains. There are many coarse-grained MD simulation studies investigating the role of sidechains,129 grafting densities (of the side chains on the polymeric backbone),130 solvent type131 and other design parameters on the structure of the bottlebrush polymers (BBPs). Dormidontova and co-workers conducted one of the first extensive all-atom MD simulation study of a bottle-brush polymeric system with PEO side chains.132 However, that particular study did not extensively quantify the properties of the BBP-supported water molecules. To address that gap, we employed all-atom MD simulations and investigated the structural and hydration properties of poly(methyl methacrylate)-g-poly(2-ethyl-2-oxazoline) (PMMA-g-PEtOx) BBPs [the schematic has been shown in Fig. 8(a)] for varying side and main chain lengths.133 Our results revealed that the radius of gyration (Rg) of the BBPs scale with the length (or the number of monomers) of the side chains (NSC) as Rg ∼ NαSC for longer side chains (with α = 0.52–0.58 for all values of the size of the backbone or NBB), whereas Rg ∼ NβSC for shorter side chains (β = 0.36 for smaller NBB and β = 0.0 for larger NBB) [see Fig. 8(b)]. In terms of unraveling the behavior of the BBP-supported water molecules, specifically our study identified a wide variety of properties of the BBP-supported water molecules with explicit accounting of the role of the individual atoms of the BBP system in regulating these water properties. From Fig. 8(c), we observed that as the side chain length is increased, the BBP transitioned from a rod-like shape to a sphere-like shape, confirmed by the corresponding decrease in the anisotropy factor (κ2). This factor κ2 is a parameter that varies from 0 to 1 where κ2 = 1 represents a perfect rod-like state, whereas κ2 = 0 represents a sphere-like architecture. As the sidechain length increased, the number of water molecules per unit monomer (or average hydration per monomer) decreased [see Fig. 8(d)]. To explain this trend, we calculated the solvent accessible surface area and obtained the number of monomers in the interfacial region (NSCINT). We observed that the ratio between the monomers at interfacial region and the total number of monomers (NSCINT/NSCTOT) decreased with an increase in the side chain length [see Fig. 8(e)]. The interfacial monomers had more access to water molecules. Therefore, as the side chain length increased, the relative amount of the interfacial monomers became less and more monomers moved towards the interior of the chains, where water was scarce. This also explained why the average hydration number per unit monomer decreased with an increase in the side chain length. We also examined the tetrahedral structure of the BBP-supported water molecules by calculating the tetrahedral order parameter (q) of these water molecules. The parameter q quantifies the extent to which the water molecules organize themselves in a tetrahedral manner owing to the hydrogen bonding. A value of q approaching 1 indicates a higher degree of structural order among the water molecules, suggesting that they are closer to conforming to the ideal tetrahedral arrangement. In other words, the closer q is to 1, the more pronounced is the tetrahedral structure of the water molecules. Our investigations revealed that the tetrahedral structure of the BBP-supported water molecules decreased with an increase in the side chain length [see Fig. 8(f)]. The water molecules that are supported by the interfacial monomers were more structured, since these water molecules were exposed less to the confinement-induced disruption that occurred in the interior of the BBP system. Therefore, given the fact that the fraction of the interfacial monomers decreased with an increase in the side chain length, the fraction of more structured water molecules decreased with an increase in the side chain length, eventually ensuring a decrease in q parameter with an increase in the side chain length.
4. Findings from all-atom MD simulations of charged anionic polyelectrolyte brushes
Anionic PEs are the PEs that have negatively charged functional groups. Therefore, the counterions required to neutralize PE brushes are cations. The negatively charged functional groups can be present along the main backbone of the polymer chain or on the side groups of the polymer chain. Moreover, these functional groups typically tend to ionize in basic environments (i.e., in solutions with high pH values). Some common anionic polyelectrolyte chains that have been studied as PE brushes include PMAA (poly methacrylic acid),134 PAA (poly acrylic acid),135 PSS (poly styrene sulfonate),136 PSPMA (poly(3-sulfo propyl methacrylate)),137etc. (please see Fig. 9 for the chemical structure of the monomers of each of such negatively charged PE chains). In the first part of this section, we shall discuss our papers on the configuration of the anionic (mostly PAA) brushes and the brush-supported counterions and water molecules. In the second part, we shall discuss our papers on the transport in nanochannels grafted with such PAA brushes.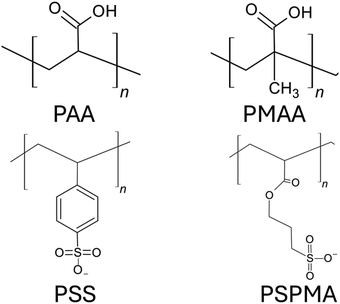 | ||
| Fig. 9 Chemical structures of the monomers of the negatively charged PEs commonly used as anionic PE brushes. | ||
4.1 Configuration of the anionic (mostly PAA) brushes and the brush-supported counterions and water molecules
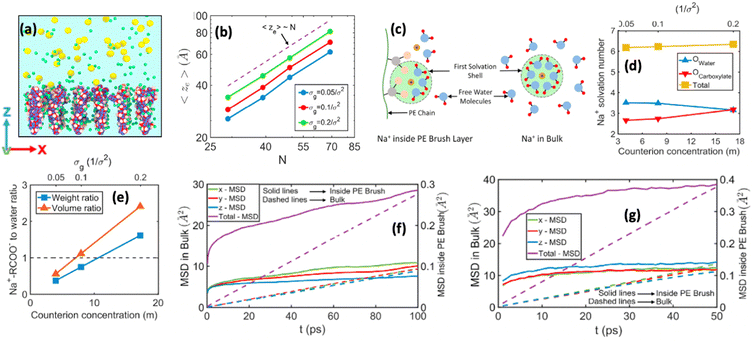
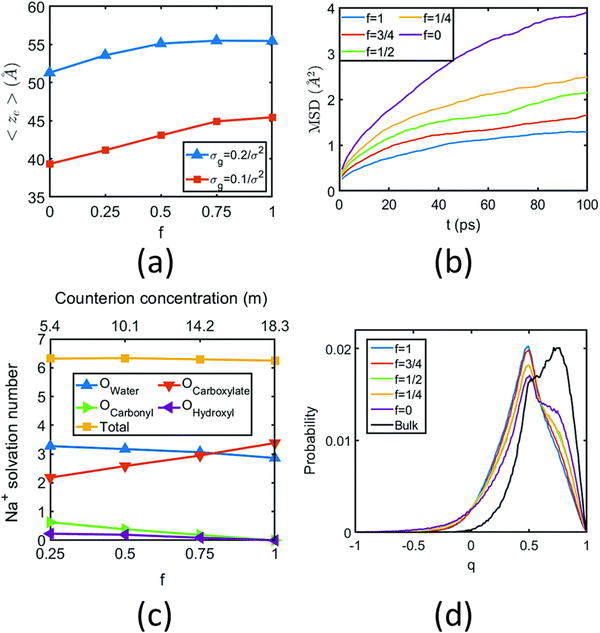
We were among the first groups to develop an all-atom MD simulation model for capturing the behavior of anionic PE brushes and the microstructure of the PE brushes (i.e., the behavior and the properties of the brush-supported counterions and water molecules) [see Fig. 10(a)].138 We studied the poly-acrylic acid (PAA) PE brushes screened by the Na+ counterions with the solvating water molecules being modeled explicitly (using the SPC/E water model). The PE brush height obtained from the simulations was found to follow the scaling predictions for the brush height for the PE brushes in the non-linear osmotic regime [see Fig. 10(b)]. More importantly, we discovered a WISE (water-in-salt-electrolyte)-like behavior of the counterions condensed on the PE brushes. WISE systems, typically used as battery electrolytes, are characterized by very large salt concentration (in the range of tens of molals).139 The typical salt used in WISE systems consists of a small cation and a large anion (e.g., LiTFSI salt). The concentration of salt in WISE systems is so large that the weight and the volume of the salt outweighs that of water and some of the water molecules in the solvation shell of the cation get replaced by the large anion. Such a situation is desirable as it ensures a favorable migration of the anions towards the electrode in presence of an applied electric field, which in turn contributes to the improved performance of the batteries in which such WISEs are used as electrolytes. Like in the WISE systems, for this case too (studied in ref. 138), we found that the water in the solvation shell of the brush-supported counterions (Na+) got replaced by the functional groups (COO−) of the PE brushes [see Fig. 10(c) and (d)]. The resulting weight and volume of this Na+–COO− “salt” could outweigh the weight and volume of water [see Fig. 10(e)], triggering a WISE-like behavior. Also, the large confinement effect and the electrostatic and dipole interactions ensured a significant reduction in the mobility (quantified by very small MSD or mean square displacement values) of the brush-supported Na+ ions and the brush-supported water molecules inside the brush layer [see Fig. 10(f) and (g)].In another all-atom MD simulation study,140 we explored the effect of the charge fraction or the finite degree of ionization (f) of the Na+-counterion-screened PAA PE brushes (f = 0 and f = 1 respectively represented the cases of uncharged and fully ionized or fully charged PAA brushes) on the brush height, the WISE-like behavior of the PE-bound counterions, and the mobility of the brush-supported Na+ ions and water molecules. As the degree of ionization rose, the electrostatic repulsion between the polyethylene (PE) chains intensified, leading to an increased stiffness. Consequently, the brush height within the system experienced an increase [see Fig. 11(a)], accompanied by a reduction in the mobility of the PE chains (i.e., the mobility of the backbone carbon atoms) [see Fig. 11(b)]. Moreover, the increase in the degree of ionization enhanced the Na+–COO− attraction, which increased the replacement of water molecules (in the hydration shell of the Na+ screening counterions) by the COO− functional group [see Fig. 11(c)]. Moreover, with an increase in f, the water–COO− interactions increased (owing to the polar nature of the water molecules); as a consequence, the tetrahedral water structure was more disrupted, and we found a value of the tetrahedral order parameter (q) that was further deviated from unity [see Fig. 11(d)]. Please note that q = 1 corresponds to the perfect tetrahedral water structure, while q becomes progressively smaller than unity as the water structure becomes more and more deviated from the perfect tetrahedral structure.
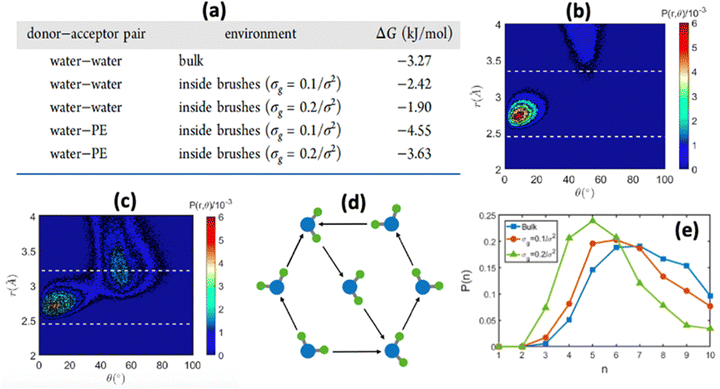
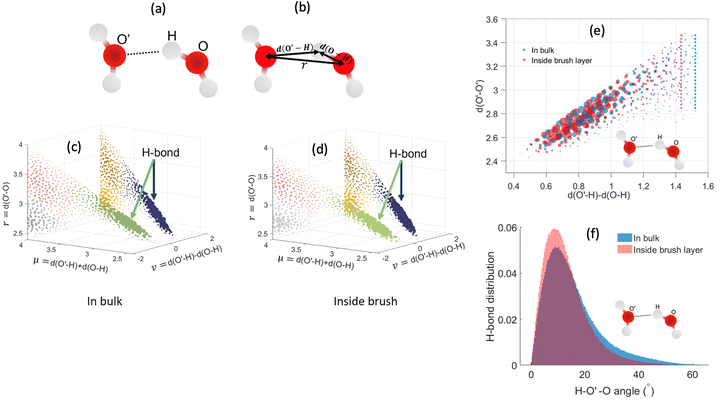
In another study, we again employed all-atom MD simulations and explored the role of the large confinement effect triggered by the densely grafted PE brush layer in altering the water–water and water–PE hydrogen bond (HB) strengths.141 Specifically, we considered the case of the Na+-counterion-screened PAA brushes. The results confirmed a significant reduction in the strength of the water–water and water–PE HB strength with an increase in PE brush grafting density (i.e., an increase in the brush-imposed confinement effect) [see Fig. 12(a)]. We explained such an occurrence from the fact that the joint probability distribution of the water–water donor–acceptor pairs for the water molecules inside the PE brush layer [see Fig. 12(c)] was much closer (as compared to the joint probability distribution of the water–water donor–acceptor pairs for the water molecules in the bulk [see Fig. 12(b)]) to the random joint probability distribution. This ensured that water molecules inside the brush layer needed a much-reduced amount of work to reorient themselves from a state of random distribution to their equilibrium probability distribution: this reduced the water–water HB energy. Physically, this could be explained by a breakdown of the water ring structure [see Fig. 12(d)] inside the brush-imposed confinement, confirmed by the presence of a larger number of smaller rings (or rings with lesser number of water molecules) within the brush layer [see Fig. 12(e)].
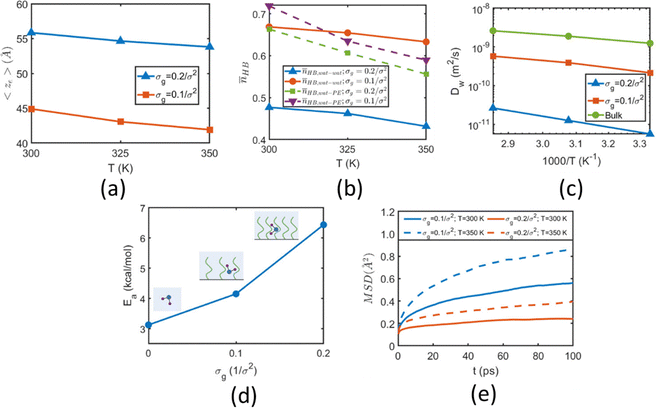
In a different study from our group,142 we employed all-atom MD simulations to investigate the effect of temperature on the PE chain, water molecules, and counterions for the Na+-counterion-screened PAA brush system. Our findings revealed that the brush height decreased with temperature [see Fig. 13(a)], stemming from the fact that at elevated temperatures both water–water and water–PE hydrogen bonds get disrupted due to a greater thermal energy [see Fig. 13(b)]. A disruption in the PE–water hydrogen bonding made the PE–solvent interactions unfavorable, and as a result, the PE chains of the brush system collapsed leading to a reduced brush height [see Fig. 13(a)]. We also found that the self-diffusion coefficient of water molecules (Dw) is lower inside the brush layer (a larger grafting density leads to a greater reduction) for all temperature values [see Fig. 13(c)]. We applied the Arrhenius equation to model the change in the diffusion coefficient with temperature, and from that, we calculated the activation energy, Ea, using the relationship  (where Dw0 is the prefactor whose value depends on the frequency of diffusion attempts and kBT is the thermal energy). The activation energy gives a measure of the average energy barrier a water molecule needs to overcome to perform diffusion. We found that the activation energy increased with an increase in the grafting density [see Fig. 13(d)], indicating an increase in the hindrance to the diffusion of the water molecules inside the brush layer. As the grafting density increased, there was a greater number of PE chains and counterions for a given volume inside the brush layer. These charged species created hinderance for water molecules to move freely which caused an increase in the water activation energy with the grafting density. Finally, in Fig. 13(e), we showed that the counterion mobility (quantified by the corresponding MSD-vs.-time plot) increased with an increase in temperature (due to the enhanced thermal motion) and a decrease in the grafting density (due to a reduced brush-driven confinement effect at a lower grafting density).
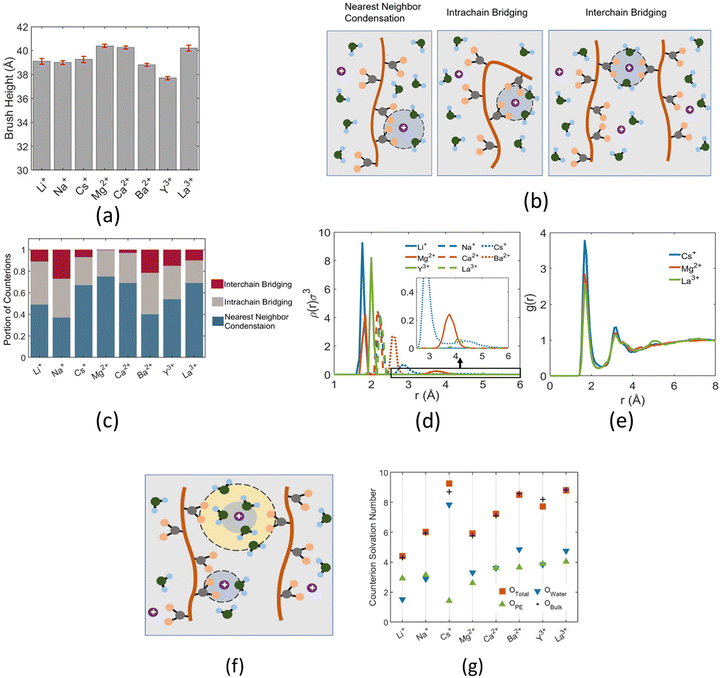
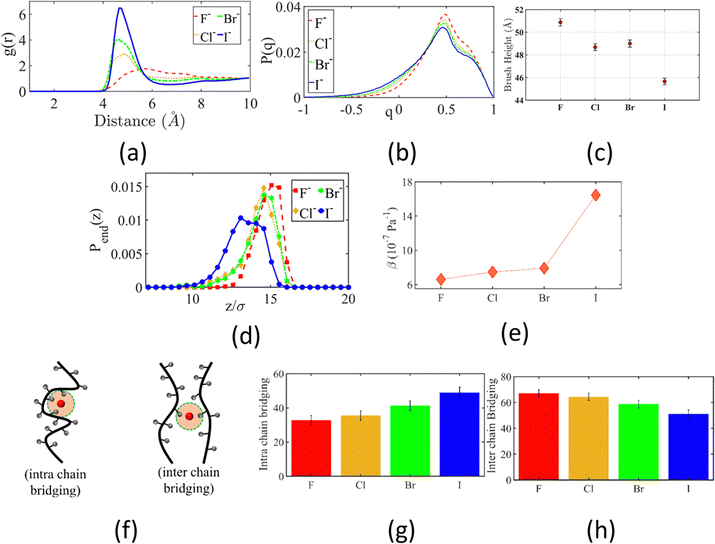
Other than investigating the effect of the PE degree of ionization, PE grafting density, and system temperature, we employed all-atom MD simulations to study the role of the valence of the screening counterions in determining the PAA brush structure.67 The existing understanding of the effect of the counterion valence is that the brush height decreases linearly with the counterion valence due to a corresponding increase in the PE chain bridging effects. However, our simulation results did not confirm these findings. Rather, our findings revealed a non-monotonic behavior of the brush height with the counterion valence [see Fig. 14(a)]. Moreover, some PAA brushes that are screened by multivalent counterions (Mg2+, Ca2+, La3+) were found to have a greater height than the PAA brushes that were screened by the monovalent (Li+, Na+, Cs+) counterions [Fig. 14(a)]. This phenomenon could be explained by the fact that a fewer number of multivalent counterions were required to charge neutralize the PE brush layer as compared to the number of monovalent counterions needed to neutralize the PE brush layer charges. Therefore, inside the brush, not all segments of a PE chain got equally neutralized. As a result, local monomer–monomer repulsion arose, which caused some multivalent-counterion-screened brushes to exhibit higher brush height than monovalent-counterion-screened brushes. In experiments, on the other hand, these locally non neutralized segments were screened by forming various structures (pinned micelles, cylindrical bundles etc.). The discrepancy with experiments can be resolved by noting the fact that in our simulations we considered only short stiff brushes, which cannot form these structures since we were exploring a different regime in our study. We also explored how each counterion contributed to various forms of bridging. There are three kinds of bridging inside the PAA brush structure: (a) nearest neighbor condensation (b) intra-chain bridging (c) inter-chain bridging. If the OCOO− atoms (oxygen atoms of the carboxylate group of the PAA chain) residing inside the solvation shell of a counterion were from a single monomer or from two neighboring monomers of a particular PE molecule, we identified it as the occurrence of “nearest-neighbor condensation”. If OCOO− were from two different non-neighboring monomers, the corresponding counterion is identified to trigger intrachain bridging (if the monomers belonged to the same PE chain) and interchain bridging (if the monomers belonged to the different PE chains), [see Fig. 14(b) for schematic]. Fig. 14(c) shows the relative occurrences of different types of bridging for different kinds of counterions: this result confirmed that that intra/inter chain bridging was not a strict function of counterion valence. For monovalent counterions (Li+, Na+, Cs+), there were equal number of COO− functional groups as the counterions. Therefore, the extent of local monomer–monomer repulsion due to improper screening was less. As a result, the brush height varied less with the type of bridging interaction for the case of monovalent counterions (Li+, Na+, Cs+). However, for divalent (compare Mg2+, Ca2+ and Ba2+) and trivalent counterions (compare Y3+ with La3+) the brush height strictly followed the extent of bridging. In other words, for brushes screened by such counterions (divalent or trivalent), the brush height showed the largest reduction for the case where the counterion-induced intra/inter chain bridging effect was the largest [see Fig. 14(a) and (c)].
The reason for which the different counterions exhibited different extents of bridging can be explained by observing how they condensed on the brush. For this purpose, we calculated the probability density distribution (ρ(r)) for finding an OCOO− atom around the counterion at a distance r from the counterion [see Fig. 14(d)]. From that figure, it can be observed that Li+, Na+, Ca2+, Ba2+, Y3+ has a single peak, which suggested that these ions fully condensed on the PE brush. However, Cs+, Mg2+ and La+ have two peaks which suggested that not all counterions were condensed on the PE chains. Moreover, the position of the second peak of the probability density distribution function for these ions matched with the second peak of OCOO−–Hw radial distribution function (Hw denotes one of the hydrogen atoms of a water molecule) [compare Fig. 13(e) and 14(d)]. This finding suggested that some of these counterions (Cs+, Mg2+ and La+) neutralized the PE chains by replacing the water molecules from the second solvation shell of the COO− functional group instead of condensing directly on the PE chains [see Fig. 14(f) for schematics]. As result, these uncondensed Cs+, Mg2+ and La+ counterions failed to trigger any significant bridging interactions, which caused only a weak reduction in the height of the brushes that are screened by these ions.
We also found that the extent of bridging depended on the size of the counterion solvation shell. Counterions with large solvation shells were able to accommodate a greater number of water oxygen atoms. Inside the brush layer, the oxygen atoms of water were replaced by OCOO− and so a bigger solvation shell enabled the accommodation of more OCOO−: this increased the propensity to induce bridging [see Fig. 14(g)]. This explains why the Na+ ion exhibited a higher degree of bridging as compared to the Li+ ion. A similar conclusion could be drawn when comparing Ca2+ and Ba2+ ions. Additionally, the large amount of bridging interactions triggered by Cs+ and La+ counterions (despite being weakly condensed) could be attributed to their large solvation shells.
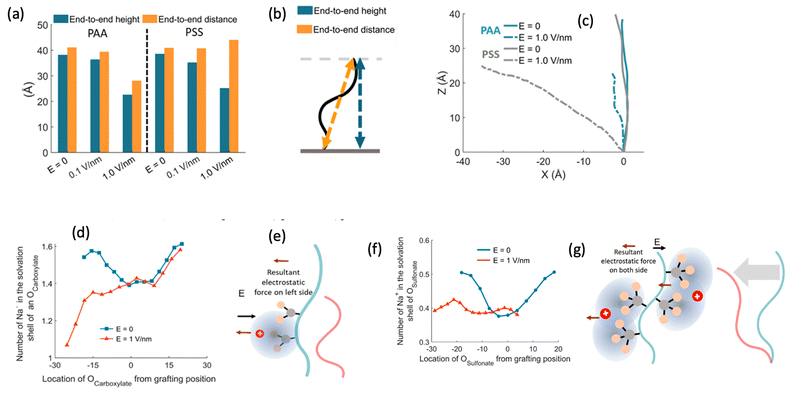
After investigating the structural features of the anionic PE brush systems (namely the Na+-counterion-screened PAA brushes) for different design parameters (grafting density, valences of the screening counterion, PE charge fraction), and environmental conditions (temperature), we employed all-atom MD simulations for studying the response of the anionic PE brush layer in presence of different perturbations. In one of our studies,143 we investigated the difference in the response of the PAA and PSS brushes to an applied axial electric field. Our results indicated that the PAA brushes undergo a bending-driven response to the electric field [see Fig. 15(c)], which leads to the simultaneous reduction of the end-to-end brush height and the end-to-end distance [see Fig. 15(a)]. Fig. 15(b) shows a schematic of the end-to-end height and the end-to-end distance of a grafted PE chain. On the other hand, the PSS brushes, in response to this axially applied electric field, undergoes tilting [see Fig. 13(c)], which leads to a significant decrease in the end-to-end brush height, but a slight increase in the end-to-end distance [see Fig. 15(a)]. The reason for this variation in response (between the PAA and PSS brushes) to the applied electric field can be understood by noting how the counterions are distributed around the specific PE chains (the PAA chains versus the PSS chains) when the electric field is applied. Such specific behavior of the counterion distribution is determined by the charge density of the PE brushes. PAA chains have large charge densities; accordingly, in presence of the applied electric field there is a left–right asymmetric distribution of the counterions around the PAA PE backbone [see Fig. 15(d)]. Such a scenario promotes an unequal screening and an unequal force on the PAA functional groups, enforcing a bending response (to the applied axial electric field) of the PAA brushes [see Fig. 15(e)]. On the other hand, the PSS brushes are weakly charged. As a consequence, the applied electric field causes a uniform distribution of the counterions across the brush [see Fig. 15(f)]. This ensures a uniform (with no left–right asymmetry) and partially unscreened PSS PE brush layer and enforces all the brush segments (without any left–right preference) to experience very much the same electric-field-driven force causing a tilting response (to the electric field) of the PSS brushes [see Fig. 15(g)].
4.2 Liquid transport in nanochannels grafted with anionic brushes
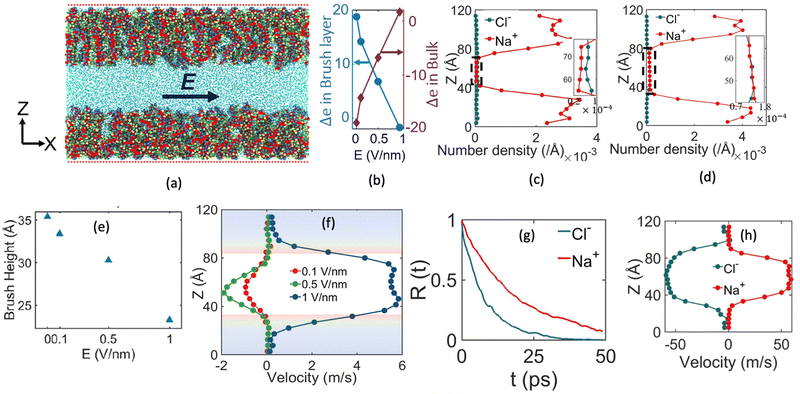
One of the most extensive uses of the PE brushes has been their deployment in functionalizing nanochannels and nanopores (by grafting these brushes on the inner walls of these nanochannels and nanopores), and subsequently using these nanochannels and nanopores for applications ranging from biosensing144 and current rectification145 to detecting cellular content146 and fabricating nanofluidic diodes.147 Most of these applications rely on the changes in the ionic current (typically in presence of an applied electric field) that occur with these brushes undergoing environmental-stimuli-driven alterations in their configurations. However, much less research has focused on studying the fluid flow in such brush-grafted nanochannels and nanopores, given the common notion that the fluid flow in brush-grafted nanochannels is severely retarded on account of the significant brush-induced drag force.148 However, in a series of recent continuum-calculation-based studies, we showed that the presence of such brushes might lead to localization of the electric double layer away from the nanochannel wall, thereby enhancing the liquid transport in presence of applied or induced electric fields.149–156 Motivated by these continuum studies, we employed all-atom MD simulations to explore the electric-field driven liquid transport (or electroosmotic flow or EOF) inside the PE-brush-grafted nanochannels.157,158Initially, our investigation focused on the characteristics of electroosmotic flow (EOF) inside nanochannels grafted with poly (acrylic acid) (PAA) brushes, which are screened by Na+ counterions.157 Additionally, we considered the presence of an excess NaCl salt of different concentrations [refer to Fig. 16(a) for a schematic of the system]. The first important finding from this study was the onset of the “overscreening (OS) effect”, which referred to the presence of a greater number of counterions inside the brush layer than needed to neutralize the charges of the brush layer. These extra counterions (cations) came from the excess salt that was present in the bulk solution. This phenomenon was captured by calculating excess of the positive charges Δe = (e+ − e−) inside the brush and in the brush-free bulk [see Fig. 16(b)]. In Fig. 16(b), e+ and e− indicate the total number of positive charges (Na+) and negative charges (Cl− and PE charges), respectively. The positive value of Δe inside the brush layer (for smaller electric fields) indicated that there were a greater number of Na+ counterions inside the brush layer, whereas the negative value of Δe in the bulk indicated that the Cl− ions were in excess in the bulk [see Fig. 16(b)]. We argue that Na+ from the brush free bulk entered inside the brush due to the high osmotic pressure inside the nanochannel. Because of the overscreening, therefore, there were greater number of Cl− ions (or coions) in the bulk region [see Fig. 16(c)]. As a result, when low-strength electric field (E = 0.1 V nm−1, 0.5 V nm−1) was applied, the EOF occurred in the direction of the motion of the Cl− ions (co-ions), that is in the negative x direction [see Fig. 16(f)]. This led to a most remarkable situation where the EOF was occurring under the dominating influence of the coions.
We next considered the situation for the case of an enhanced electric field (E = 1 V nm−1). For this enhanced electric field, there was a reduction in the height of the PAA brushes on account of the bending of the PE chains [see Fig. 16(e)]. The reduction of the brush height squeezed the extra Na+ ions (i.e., the excess Na+ ions that were triggering the OS effect inside the brush layer) out from the interior of the brush layer into the brush-free bulk. As a consequence, there was no longer any OS of the brush layer and there were an equal number of coions and counterions in the brush-free bulk [see Fig. 16(b) and (d)]. Under such circumstances, the EOF did not occur on account of any number difference between the counterions and coions. Rather, the EOF occurred by virtue of the fact that in the presence of this enhanced electric field, the residence time of the water molecules inside the solvation shell of the Na+ ions was greater than the residence time of the water molecules inside the solvation shell of the Cl− ions [see Fig. 16(g)]. As a result, in presence of nearly identical velocities of the Na+ and Cl− ions at this enhanced electric field strength [see Fig. 16(h)], water got transported more in the direction of the motion of the Na+ ions. In other words, we recovered the classical case of the EOF occurring in the direction of the motion of the counterions. Of course, such a situation also implied that there occurred a reversal in the direction of the EOF by mere alteration of the strength of the electric field (at weaker electric fields, the EOF was driven in the direction of the coion motion, while at larger electric fields, the EOF occurred in the direction of the counterion motion). Interestingly, however, the EOF at higher electric fields was not due to the difference in the number of counterions and coions; rather it was caused by the difference in the water residence time between the solvation shells of the Na+ and Cl− ions.
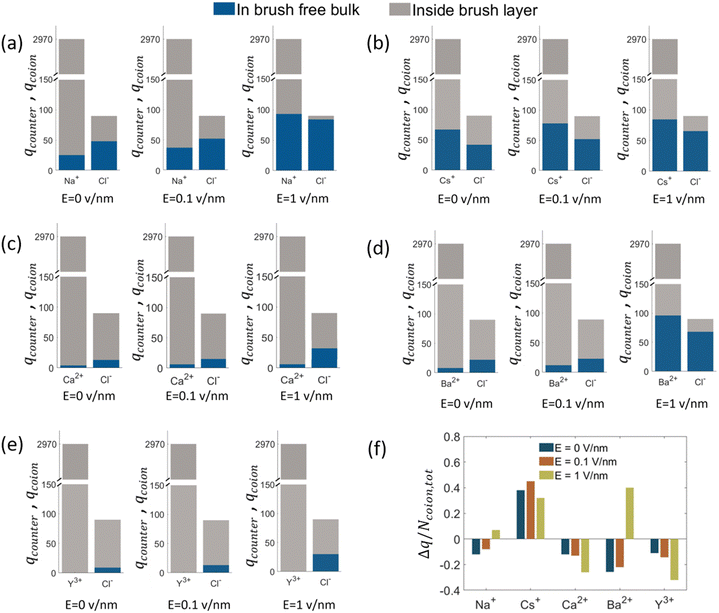
The findings of our previous study prompted us to investigate the EOF behavior inside the PAA-brush-grafted nanochannel for separate cases where the PAA brushes were screened with counterions of different valences (Na+, Cs+, Ca2+, Ba2+, and Y3+).159 Additionally, for each of these individual cases, we considered an added salt which is the chloride salt of the corresponding screening counterions. For example, for the cases where the screening counterions were Na+, Ba2, and Y3+, we considered the added salt as NaCl, BaCl2, and YCl3. Our simulation-driven findings revealed that the overscreening (OS) effect depended on the valence and the size of the screening counterions. Fig. 17(a)–(e) shows the charge contributions of different counterions (qcounterions) and their coions (qcoions) inside the brush and the brush-free bulk region of the nanochannel for three different values of the applied electric field (E = 0, 0.1 V nm−1, and 1 V nm−1). The expressions for qcoions and qcounterions have been provided in eqn (8) and (9), respectively. The net charge per coion is  , where the expression for Δq has been provided in eqn (10). In eqn (8)–(10)Ncounterion, zcounterion, Ncoion and zcoion respectively denote the number of counterions, the valence of the counterions, the number of co-ions, and the valence of the coions.
| qcoions = |Ncoionzcoion|, | (8) |
| qcounterions = |Ncounterionzcounterion|, | (9) |
| Δq = |Ncounterionzcounterion| − |Ncoionzcoion|. | (10) |
Fig. 17(f) plots the value of  . A negative value of
  implied that there is a greater number of coions in the bulk than counterions, which suggested that a greater number of counterions (than needed to screen the brush charge) were present inside the brush layer, i.e., there was OS inside the PAA brush layer. For the same reason, a positive value of
  implied that there was no OS inside the PE brush layer. Fig. 17(f) shows that for all the electric field strengths, there wss no OS for the case of the PAA brushes screened with the Cs+ counterions [see Fig. 17(f)]. On the other hand, for all values of the electric fields, there was OS for the case of the PAA brushes screened with the Ca2+ and Y3+ ions. Finally, for the case of the PAA brushes screened with the Na+ and Ba2+ counterions, there was OS of the brush layer for E = 0, 0.1 V nm−1, while there was no OS of the brush layer for E = 1 V nm−1. Upon comparing Na+ with Cs+ [refer to Fig. 17(a) and (b)] and Ca2+ with Ba2+ [refer to Fig. 17(c) and (d)], it was apparent that larger counterions tended to reside more outside the brush region, as compared to smaller counterions. This led to a larger charge contribution of the counterions, qcounterions, within the brush region for smaller counterions. This result justified why larger counterions of a given valence demonstrated a lesser tendency to show OS. Also, for E = 0 V nm−1, the value of qcounterions in the brush-free bulk region was much higher for monovalent counterions than multivalent counterions [see Fig. 17(a)–(e)], which implied that counterions with higher valence preferred to stay inside the brush more and demonstrated an enhanced OS effect. Multivalent or smaller ions possessed higher charge densities, leading to greater enthalpic gains when they condensed within the brush layer. Furthermore, larger counterions tended to have larger solvation shells, resulting in more solvation shell water molecules becoming entrapped within the brush layer as counterion condensation increased. Consequently, larger counterions faced an additional entropic penalty to remain within the brush layer. This explains why Cs+ had a higher tendency to remain outside the brush as compared to the Na+ ions (for PAA brushes screened with Cs+ there was never any OS, but for PAA brushes screened with Na+ ions there was OS except for E = 1 V nm−1), while Ba2+ ions showed a greater tendency to stay outside the brush than the Ca2+ ions (hence there was no OS for the PAA brushes screened with Ba2+ counterions for larger E values, while there was OS for the PAA brushes screened with Ca2+ counterions for all E values).
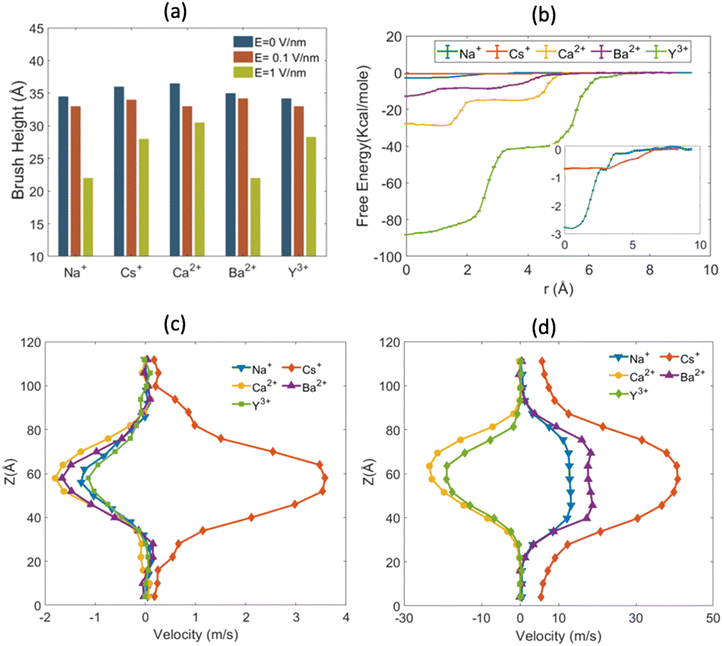
When the electric field is applied, we observed the above-discussed anomalous trends on the degree of OS for the cases where the PAA brushes were screened with different types of ions. For the case of the PAA brushes screened with the Na+ and Ba2+ ions, the OS effect decreased with an increase in electric field strength: this was manifested by a gradual increase in the value of  [see Fig. 17(f)]. This observation was in line with our previous findings that counterions leave the brush at high electric fields because of the reduction of space available inside the brush layer caused by a bending of the grafted PAA chains [manifested as a progressive reduction in the height of the PAA brush layer with an increase in the strength of the applied electric field; see Fig. 18(a)]. Very interestingly, for the case of the PAA brushes screened with the Ca2+ and Y3+ counterions, the reverse happened: with an increase in the strength of the electric field, the OS effect strengthened as more counterions got inside the brush from the bulk region [see Fig. 17(f)]. To explain this behavior, we calculated the binding free energy of the counterions with the PE chains [see Fig. 18(b)]. The binding free energy of Na+ and Ba2+ was very low, explaining why they could easily leave the PE brush layer when high electric field was applied. Cs+ ion had the lowest binding free energy and as a result did not demonstrate OS at any value of the applied electric field. Moreover, the binding free energy of Y3+ and Ca2+ was comparatively much higher than the other two ions. Therefore, these two ions did not easily leave the PE brush at high electric field. When electric field is applied, therefore only the co-ions leave the brush layer (due to the PE bending driven decrease in the brush height) for the case of the PAA brushes screened with the Y3+ and Ca2+ ions. As a result, with increasing electric field, the net positive charge inside the brush layer increased, which caused the OS effect for the PAA brush layer screened by these two ions (Y3+ and Ca2+) to increase with the increased electric field.
Such different responses of the counterions to the applied electric field of different strengths resulted in the nanochannel EOF of different magnitudes and directions [see the velocity profiles in Fig. 18(c) and (d)]. Since Cs+ ions remained mostly in the brush-free-bulk region, the EOF velocity was the highest inside the Cs+-ion-screened PAA brush grafted nanochannel and was in the direction of the motion of the counterions (i.e., from left to right) for all values of the electric field strength [see Fig. 18(c) and (d)]. At high electric field strength (E = 1 V nm−1), there was no OS for the PAA brushes screened with the Na+ and Ba2+ counterions; accordingly, for these cases the EOF occurred in the same direction in which the motion of the counterions occurred [see Fig. 18(d)]. However, there was OS for the cases of (1) PAA brushes screened with Ca2+ and Y3+ counterions for all values of the applied electric field strengths and (2) PAA brushes screened with Na+ and Ba2+ counterions for small value of electric field strengths. Hence for these cases, there was an excess of coions in the brush-free bulk; this coupled with very weak flow inside the brush layer, led to an EOF in the direction of motion of the coions [see Fig. 18(c) and (d)].
Equally interesting as the nanofluidic EOF is the pressure-driven transport in a charged nanochannel. The charged nanochannel triggers an electric double layer (EDL), where there are more counterions than coions. Accordingly, when a pressure-driven flow is employed in such a nanochannel, this charge imbalance of the EDL is migrated downstream and the resulting current is known as the streaming current. Such downstream migration ensures that there are more counterions than coions at downstream location. This will lead to the generation of an electric field, known as the streaming electric field. The product of this streaming current and the streaming electric field is the electrokinetic power generated in the process. More interestingly, this induced streaming electric field will always drive an induced EOF from right to left, i.e., against the direction of the background pressure-driven transport. For example, for a positively (negatively) charged nanochannel, the counterions are anions (cations); accordingly, the streaming electric field will be from right to left (left to right), and hence the induced EOF that will be triggered by the interaction of this electric field with the excess of charges within the EDL [these excess charges are positive (negative) for a negatively (positively) charged nanochannel] will always be from right to left. This induced EOF opposing the pressure-driven flow eventually leads to a decrease in the net volume flow rate. This reduction is quantified by expressing the net flow as a pure pressure-driven flow with an increased viscosity: this effect is classically identified as the electroviscous effect. There have been a significant number of studies (including several by us) that have studied such nanofluidic electrokinetic energy generation and electroviscous effect.160–164 In fact, through a series of recent continuum-calculation-based papers, we have explored the effect of functionalizing nanochannels with PE brushes in the electrokinetic energy generation in the presence of a background pressure-driven liquid flows.35,154,165
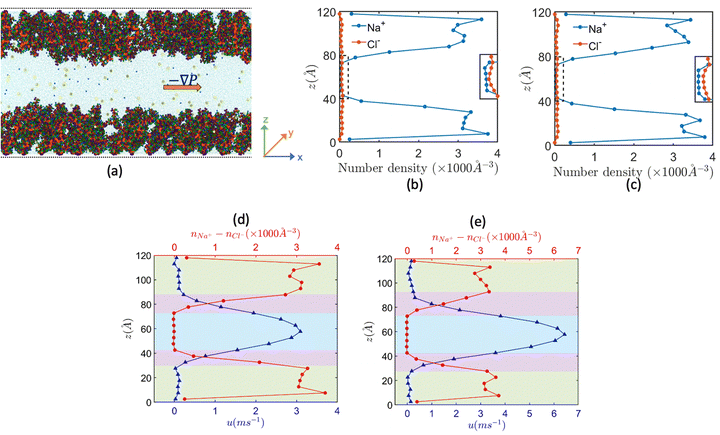
Motivated to explore in atomistic details this intriguing problem of nanofluidic electrokinetic energy generation in the presence of a pressure-driven liquid transport, we conducted all-atom MD simulations of pressure-driven transport in nanochannels grafted with Na+-screened PAA brushes in the presence of added NaCl salt.158Fig. 19(a) provides an MD simulation snapshot of the problem, while Fig. 17(b) and (c) provide the coion and counterion distribution across the nanochannel for two values of the applied pressure gradients. Fig. 19(b) and (c) confirm that even under the presence of the applied pressure gradients there is an excess of coions in the bulk, which is tantamount (as has been explained previously) to the occurrence of the OS inside the PE brush layer. Fig. 19(d) and (e) provides the overall flow profile and the distribution of the number density difference between the counterions and coions for these pressure gradient values. In Table 1, we summarize the magnitudes of the overall volume flow rate, streaming current, streaming electric field (the electric field is negative confirming that the electric field has been induced in the direction opposite to the pressure-driven flow) and the overall power output for these different pressure gradient values. A progressive increase in the magnitude of all these quantities with an increase in the magnitude of the pressure gradient can also be noted.
| Physical quantity | σ g = 0.05/σ2 | σ g = 0.05/σ2 |
|---|---|---|
| ∇P = −1 MPa nm−1 | ∇P = −2 MPa nm−1 | |
| Volume flow rate (Q) (μm3 s−1) | 99.86 | 205.84 |
| Streaming current (is) (nA) | 3.77 | 5.82 |
| Streaming electric field (Es) (mV nm−1) | −2.38 | −3.68 |
| Power output (Pout) (pW) | 52.67 | 125.61 |
Given that the all-atom MD simulations will always produce a single velocity profile, it is not possible to directly discern the increase (or decrease) in the strength of the pressure-driven transport on account of the induced electric field driven EOF. However, using the MD simulation derived data for the streaming electric field (see Table 1), the distribution of the difference between counterion and cion number densities [see Fig. 19(d) and (e)], and slip velocity at the interface between the brush layer and the bulk, we can obtain the continuum prediction of the induced EOF or uE [using eqn (11)]:
 | (11) |
In eqn (11), η is the dynamic viscosity, e is the electronic charge, Es is the induced streaming electric field (obtained from the MD simulations; see Table 1) and nNa+ − nCl− is the number density difference distribution [obtained from the MD simulations; see Fig. 19(d) and (e)].
Similarly, using this slip velocity at the interface between the brush layer and the bulk, we can obtain the continuum prediction of the pressure-driven flow or up [using eqn (12)]:
 | (12) |
In eqn (12), ∇P is the applied pressure gradient. Please note that both eqn (11) and (12) are solved in presence of the slip boundary conditions [obtained from MD simulation predicted velocity distribution; see Fig. 19(d) and (e)].
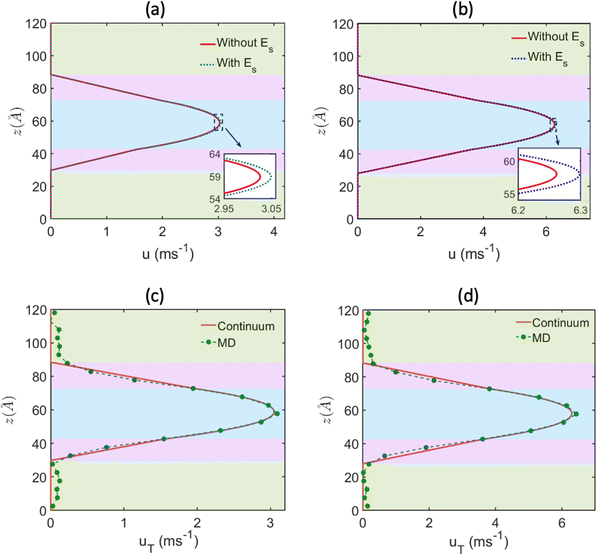
Subsequently, the overall flow strength can be expressed as u = up + uE, which is compared to the pure pressure-driven flow strength up. Both these flow profiles (u is the flow profile with Es, while up is the flow profile without Es) are plotted in Fig. 20(a) and (b). For all cases, we find that the overall flows strength (u = up + uE) is always greater than the strength of the pure pressure driven flow (up). In Fig. 20(c) and (d), we compare this continuum predicted overall flow profile (u = up + uE) with the MD simulation prediction flow profile, and we get an excellent match. These results provide the most remarkable examples, where in a pressure-driven electrokinetic transport, there is simultaneous energy generation and flow augmentation. We denote this situation, in contrast to the electroviscous effect, as electroslippage effect.
5. Findings from all-atom MD simulations of charged cationic polyelectrolyte brushes
Cationic PEs are charged polymers containing positively charged functional groups on their main backbone or on their side chains: PE brushes consisting of such cationic PE chains are known as cationic PE brushes. Some notable cationic PEs include PMETAC (poly(2-methacryloyloxy)-ethyl-trimethyl ammonium), MePVP (poly(4-vinyl-N-methylpyridinium)), PVBTMAC (poly(vinylbenzyl)-trimethyl ammonium), PAH (poly(allylamine hydrochloride)), PEI (polyethylenimine), etc.166 (see Fig. 21). The counterion behavior and the pH responsiveness of such brushes are opposite to that of the anionic brushes. However, unlike the majority of the widely used anionic PE brush systems, the chemical structures of the commonly used cationic PE brushes are much more complicated and contain multiple functional groups (compare Fig. 21 with Fig. 9). Therefore, the mechanisms by which these PE brushes interact with the surrounding (or brush-supported) water molecules and ions are often different from those with which the anionic PE chains interact with the corresponding brush-supported water molecules and ions. Consequently, a comprehensive atomistic-level investigation is necessary to understand the prevailing physics within these cationic PE brush systems and connect them with their overall macroscopic properties. We are among the first groups to start such investigations using all atom MD simulations. In our study, we used the PMETAC chains (given their widespread usage167) as our canonical cationic brush system.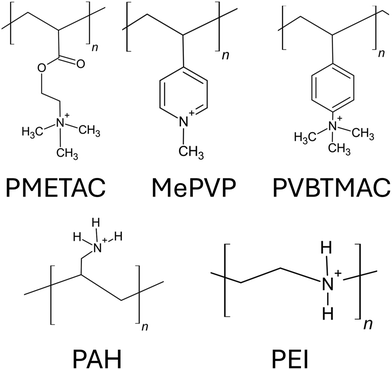 | ||
| Fig. 21 The chemical structure of monomers used to synthesize different cationic polyelectrolyte brushes. Protonated structures of PAH and PEI (linear architecture) monomers have been shown. | ||
At first, we employed all-atom MD simulations to probe into how the functional groups and the ions present inside the PMETAC brush system (PMETA brushes screened with the Cl− ions) interact with the brush-supported water molecules.72Fig. 22(a) provides the variation of the PMETAC brush height with grafting density. Increase in the grafting density, as expected, increases the brush height. Fig. 22(b) provides the monomer inside the brush layer: similar to the all-atom-MD simulation derived monomer distribution of the anionic brushes (PAA brushes),138 for cationic brushes, too, the monomer distribution is plug-like (or nearly uniform) inside the brush layer.
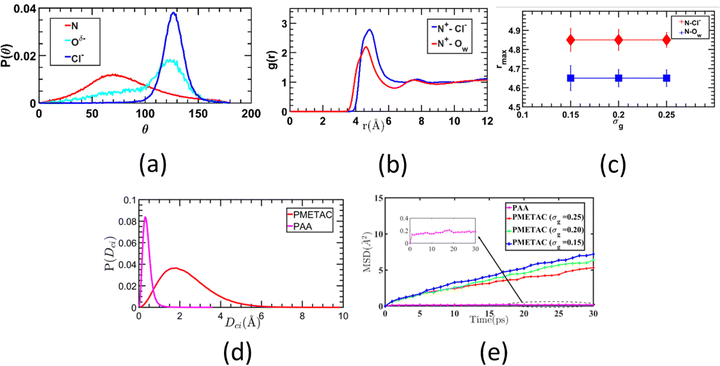
In order to understand the influence of the brushes in affecting the surrounding water molecules, we investigated the behavior of the brush-supported water molecules around three distinct entities: the {N(CH3)3}+ functional group of the PMETA chain, C![[double bond, length as m-dash]](https://www.rsc.org/images/entities/char_e001.gif) O (ester group) of the PMETA chain, and the Cl− counterions that screen the PMETA brush charges. We found that though the {N(CH3)3}+ group of the PMETAC chain has an overall positive charge, unlike a cation with high charge density, it failed to orient the water molecules. This became evident from the dipole moment distribution of the water molecules around the N atom of the {N(CH3)3}+ group of the PMETAC chain: we found that the peak of this dipole distribution occurred at θ = 75°, which was analogous to the behavior of water molecules around apolar hydrophobic entities [see Fig. 23(a)].168,169 The weak influence of the {N(CH3)3}+ group on the surrounding water molecules could be attributed to its low charge density due to its large size. On the other hand, the water dipole around the ester group (C
O (ester group) of the PMETA chain, and the Cl− counterions that screen the PMETA brush charges. We found that though the {N(CH3)3}+ group of the PMETAC chain has an overall positive charge, unlike a cation with high charge density, it failed to orient the water molecules. This became evident from the dipole moment distribution of the water molecules around the N atom of the {N(CH3)3}+ group of the PMETAC chain: we found that the peak of this dipole distribution occurred at θ = 75°, which was analogous to the behavior of water molecules around apolar hydrophobic entities [see Fig. 23(a)].168,169 The weak influence of the {N(CH3)3}+ group on the surrounding water molecules could be attributed to its low charge density due to its large size. On the other hand, the water dipole around the ester group (C![[double bond, length as m-dash]](https://www.rsc.org/images/entities/char_e001.gif) O) of the PMETAC chains was oriented like that around highly charged anions; in other words, the peak of the corresponding water dipole distribution occurred at θ = 130° [see Fig. 23(a)], which closely resembled the scenario of the water dipole distribution around the screening Cl− ions [the corresponding water dipole distribution peak around the Cl− ion was found at θ = 125°; see Fig. 23(a)]. By comparing the dipole orientation of the solvating water molecules around the Cl− ion and the {N(CH3)3}+ group, it could be inferred that the Cl− ion underwent a strong hydrophillic hydration, while the {N(CH3)3}+ group experienced a weak apolar-like hydration. Consequently, the water molecules were attracted more strongly to the Cl− ion as compared to the {N(CH3)3}+ group; this result was also supported by the observation that the peak of Cl−–Ow rdf was much higher than the peak of the N+–Ow rdf [see Fig. 23(b)]. In Fig. 23(b), Ow is the oxygen atom of the water molecule atom N+ is the nitrogen atom of {N(CH3)3}+. Furthermore, our investigations also revealed that there was an intervening water layer between the {N(CH3)3}+ moiety and the Cl− counterion: this was identified by observing that the N+–Ow rdf rose at a smaller distance as compared to the N+–Cl− peak [see Fig. 22(c)]. This particular trend in the rdf further suggested that the water molecules were closer to the {N(CH3)3}+ group than the Cl− counterion. Additionally, the presence of the intervening water layer was also supported by the fact that the peak of the N+–Ow rdf also occurred at a smaller distance than that of the N+–Cl− rdf. This intervening water layer also demonstrated high stability since the locations of the peaks of the N+–Ow and N+–Cl− rdfs did not change with the grafting density [see Fig. 23(c)]. Such stability of the intervening water layer could be attributed to the strongly attached hydration shell of the Cl− counterion, that always acted as a barrier between the Cl− counterion and the {N(CH3)3}+ group. Unlike the ‘water-in-salt’ like scenario [as observed for the case of the Na+-counterion-screened PAA brushes; see Fig. 10(c)–(e)], the functional group of the brush ({N(CH3)3}+) failed to expunge the water from the hydration shell of the counterions (Cl−) ions due to the strong attachment of the water molecules (or the corresponding hydration shell) with the Cl− ion. As a result, Cl− and {N(CH3)3}+ were present as a weakly attached solvent-separated ion pair. The weak ion pairing resulting from the mismatch of the hydration strength of {N(CH3)3}+ and Cl− further resulted in high mobility of the counterions inside the PMETAC brush, which was confirmed by comparing its mobility with that of the Na+ counterion inside PAA brush layer. The mobility was probed with two metrics: the mean square displacement (MSD) and the probability distribution function (PDF) of the distance travelled by a counterion (Dci) in 40 ps timeframe. Both of these metrics predict a significantly high mobility of counterion (Cl− ion) inside PMETAC brush system as compared to the counterion (Na+ ion) within the PAA brush system, despite the fact that Na+ ion has a much lower mass than the Cl− ion [see Fig. 23(d) and (e)].
O) of the PMETAC chains was oriented like that around highly charged anions; in other words, the peak of the corresponding water dipole distribution occurred at θ = 130° [see Fig. 23(a)], which closely resembled the scenario of the water dipole distribution around the screening Cl− ions [the corresponding water dipole distribution peak around the Cl− ion was found at θ = 125°; see Fig. 23(a)]. By comparing the dipole orientation of the solvating water molecules around the Cl− ion and the {N(CH3)3}+ group, it could be inferred that the Cl− ion underwent a strong hydrophillic hydration, while the {N(CH3)3}+ group experienced a weak apolar-like hydration. Consequently, the water molecules were attracted more strongly to the Cl− ion as compared to the {N(CH3)3}+ group; this result was also supported by the observation that the peak of Cl−–Ow rdf was much higher than the peak of the N+–Ow rdf [see Fig. 23(b)]. In Fig. 23(b), Ow is the oxygen atom of the water molecule atom N+ is the nitrogen atom of {N(CH3)3}+. Furthermore, our investigations also revealed that there was an intervening water layer between the {N(CH3)3}+ moiety and the Cl− counterion: this was identified by observing that the N+–Ow rdf rose at a smaller distance as compared to the N+–Cl− peak [see Fig. 22(c)]. This particular trend in the rdf further suggested that the water molecules were closer to the {N(CH3)3}+ group than the Cl− counterion. Additionally, the presence of the intervening water layer was also supported by the fact that the peak of the N+–Ow rdf also occurred at a smaller distance than that of the N+–Cl− rdf. This intervening water layer also demonstrated high stability since the locations of the peaks of the N+–Ow and N+–Cl− rdfs did not change with the grafting density [see Fig. 23(c)]. Such stability of the intervening water layer could be attributed to the strongly attached hydration shell of the Cl− counterion, that always acted as a barrier between the Cl− counterion and the {N(CH3)3}+ group. Unlike the ‘water-in-salt’ like scenario [as observed for the case of the Na+-counterion-screened PAA brushes; see Fig. 10(c)–(e)], the functional group of the brush ({N(CH3)3}+) failed to expunge the water from the hydration shell of the counterions (Cl−) ions due to the strong attachment of the water molecules (or the corresponding hydration shell) with the Cl− ion. As a result, Cl− and {N(CH3)3}+ were present as a weakly attached solvent-separated ion pair. The weak ion pairing resulting from the mismatch of the hydration strength of {N(CH3)3}+ and Cl− further resulted in high mobility of the counterions inside the PMETAC brush, which was confirmed by comparing its mobility with that of the Na+ counterion inside PAA brush layer. The mobility was probed with two metrics: the mean square displacement (MSD) and the probability distribution function (PDF) of the distance travelled by a counterion (Dci) in 40 ps timeframe. Both of these metrics predict a significantly high mobility of counterion (Cl− ion) inside PMETAC brush system as compared to the counterion (Na+ ion) within the PAA brush system, despite the fact that Na+ ion has a much lower mass than the Cl− ion [see Fig. 23(d) and (e)].
In our following investigation, we employed all-atom MD simulations for exploring the effect of the counterion size and charge density on the PMETA+ brush system by changing the screening counterions from Cl− to I−, Br− and F−.68 We specifically selected the halide ion series as our chosen set of screening counterions, given the fact that their sizes and charge densities are the only variables, which eliminate the potential effects induced by the variation in the counterion structures.
Our results indicated an intriguing finding: the degree of binding of the halide counterions on the {N(CH3)3}+ group of the PMETA chains followed the sequence F− < Cl− < Br− < I−. Such a behavior can be confirmed by noting that the height of the {N(CH3)3}+-counterion rdf peak varies in the order of I− > Br− > Cl− > F− [see Fig. 24(a)]. Such a trend is highly non-intuitive since it is expected that the counterions with a greater charge density will bind more strongly with the {N(CH3)3}+ functional group. Interestingly, this specific trend of halide ion binding to the PMETA+ chains has been noted in experiments.81 We explained such a trend by noting the chaotropic nature of the iodide and the bromide ions and kosmotromic nature of the chloride and fluoride ions. Chaotropic ions (such as the iodide and the bromide ions) cause a strong disruption of the surrounding water structure,170 thereby promoting a preference of these ions to leave a setting where these ions are surrounded by water and in the process they favorably bind to the {N(CH3)3}+ functional group. Since the {N(CH3)3}+ group itself exhibits chaotropic behaviour,72 the counterion with more chaotropic nature binds to it more favorably. Fig. 24(b) shows the probability distribution of the tetrahedral order parameter (q) of the water molecules around the halide counterions: this result demonstrates how these ions disrupted the tetrahedral arrangement of its solvating water molecules. A higher value of q indicates that the structure of the surrounding solvating water is less disrupted by the ion. We see that the trend of the water ‘q’ parameter varies as F− > Cl− > Br− > I−, i.e., water molecules are less structured around the iodide and bromide ions, as compared to chloride and fluoride ions. This suggested that even inside the brush environment the chaotropic nature of the iodide and the bromide ions and kosmotromic nature of the chloride and fluoride ions prevail, which explains why the degree of binding to PE chain follows I− > Br− > Cl− > F−.
As the degree of counterion binding increased, there was a corresponding reduction in the columbic repulsion between the brushes. This led to a significant decrease in the overall brush height when the screening counterions were changed from the F− to I− counterions [see Fig. 24(c)]. A decrease in the PE chain–PE chain repulsion also increased the flexibility of the chains, which could be observed by noting an increase in the width of the end monomer distribution [see Fig. 24(d)] as well as the increase of the compressibility factor [see Fig. 24(e)].
The binding of the counterion with the PMETA chain occurs with the counterion interacting with several PE segments by forming interchain and intrachain bridging, as shown schematically in Fig. 24(f). A weaker repulsion between the PE chains, which occurred for the case where the ions were most strongly bound to the chains enforcing a more pronounced screening of the PE charges, enabled the chains to depreciate laterally; as a result, the extent of intra-chain bridging increased as the counterions were changed from F− to I− [see Fig. 24(g)]. On the other hand, a low degree of counterion binding could only partially screen the PE brush charges and accordingly, the PE chain–PE chain repulsion remained high. Under such circumstances, the brushes became stiffer and rod-like, and therefore, the percentage of interchain bridging increased in the order of F− > Cl− > Br− > I− [see Fig. 24(h)].
Besides our papers, Santos et al. also performed an all-atom MD simulation study for probing the response of cationic poly(dimethyl aminoethyl methacrylate) (PDMAEMA) and poly(2-(methacryloyloxy) ethyl trimethylammonium chloride) (PMETAC) brushes to changes in pH, solvent, and salt types.171 They also synthesized these brushes to compare their MD simulation results with experiment. At first, they used atom transfer radical polymerization (ATRP) to synthesize PDMAEMA brushes; subsequently, they quaternized the PDMAEMA brush to obtain the PMETAC brushes. The structures of these synthesized brushes were determined using elipsometry. An important parameter that was used in this study was the swelling coefficient, which is the ratio between the maximum heights of the brushes in wet and dry conditions.
At first, Santos et al. investigated the swelling behaviour of PDMAEMA for different pH conditions or protonation states. At a high pH, the cationic PDMAEMA was deprotonated, and therefore interacted weakly with the solvating polar water molecules. Therefore, the brush remained in a collapsed state (i.e., similar to the dry state) and the swelling coefficient was close to 1 [see Fig. 25(a)]. As the pH was reduced, the degree of protonation increased, and the monomers started to interact favorably with the water molecules due to electrostatic interactions. As a result, its swelling ratio increased with the degree of protonation [see Fig. 25(a)].
Santos et al. also investigated the response of the PDMAEMA (fully deprotonated) and PMETAC brushes in two different solvents: water and cyclohexane (CHX). Due to unfavorable interactions, PDMAEMA remained in a collapsed condition in water; this could be inferred by noting that the corresponding swelling coefficient was close to 1 [see Fig. 25(b)]. On the other hand, when the solvent was changed to apolar cyclohexane, despite remaining in a collapsed form, the swelling coefficient of the PDMAEMA was higher compared as compared to the case when the solvent was water. Such a scenario stemmed from the fact that the cyclohexane interacted with the PDMAEMA brushes more favorably, resulting in an increase in the brush height. The PMETAC brushes also showed a collapsed conformation in apolar cyclohexane. However, the PMETAC brushes interacted much more favorably with water; as a result, in water, the PMETAC brushes were no longer in a collapsed configuration and the corresponding swelling coefficient of the PMETAC brushes became very high [see Fig. 25(b)]. Finally, Santos et al. also probed the swelling response of PMETAC brushes on being exposed to different types of salts, namely: NaCl, Na2SO4, NaClO4. Their study revealed that due to the difference of structure of these salts, there was a significant difference in response of the brushes, as was evident from the corresponding significant variation of the swelling coefficients [see Fig. 25(c)].
6. Machine learning methods in exploring the properties of PE brush supported water molecules
One of the biggest advantages of probing the PE brushes using all-atom MD simulations has been the ability to identify the contributions of every atom of the PE chains in regulating the behavior of the water molecules and counterions in the vicinity of the brushes. This includes, for example, identifying the ability of the COO− group of the PAA brushes to replace the water molecules from the solvation shell of the screening Na+ ions (thereby triggering a “water-in-salt”-like response)139 as well as pinpointing the ability of {N(CH3)3}+ functional groups of the PMETAC brushes to trigger apolar hydration and solvent separated ion pair [{N(CH3)3}+ cation and Cl− anion pair].72 Interestingly, most of the analyses for estimating the properties of ions and water supported by the atomistically resolved PE brushes use the tools and conditions that have been employed to analyze the water and ion properties in the absence of the brushes. For example, we identify a significant decrease in the number of water–water hydrogen bonds (HBs) inside the PAA brush layer, as compared to the water–water HBs outside the brush.73 For this purpose, we use the same condition (in terms of the critical distance between the receptor and acceptor water molecules) as that employed for determining the water–water hydrogen bonding in the brush-free bulk. Such an approach overlooks the possible changes in the conditions that the large confinement effect imposed by the densely grafted PE brushes might impose. We have recently found, as will be discussed in this section, that employing unsupervised machine learning (ML) algorithms on all-atom MD simulation generated data on PE brushes enable a more rigorous prediction of such brush-supported water properties (e.g., water–water hydrogen bonding) that account for the specifics of the brush-imposed large confinement effect.In MD simulations, the generated output is the position and the velocity of each atom along each axis for every timestep. The description (thermodynamics, nonequilibrium properties, etc.) of the total system is encoded in these 6N variables, which is a high-dimensional dataset. Here, N denotes the total count of atoms within the system, where each atom contributes 3 variables indicating its position along each spatial axis and an additional 3 variables representing its velocity along these same axes. Generally, analyzing all these variables to generate meaningful information about the system is a tedious task. Previously, analysis was done using collective variables (a combination of some of these 6N variables), which were mostly based on the intuition of the researcher.172 Different types of machine learning (ML) techniques are very suitable for analyzing such high dimensional data sets. Unfortunately, though many sophisticated ML algorithms exist, there is a significant gap between the algorithms and the field-specific applications. For researchers unfamiliar with ML, comprehending the operations performed by these algorithms can be challenging. Moreover, deciding what should be the inputs and extracting meaningful insights (that are application-specific) from the outputs can prove to be equally daunting. Recently, we have undertaken various efforts to minimize this gap; in other words, we are trying to close the gap between the algorithms and applications by finding ways such algorithms can be used for soft matter systems. Our endeavor has not only helped us to find novel ways to apply these algorithms, but also by applying these techniques we have been able to better quantify the properties of the brush-supported water molecules that appropriately incorporated the effects of the brush-imposed nanoconfinement effects.
As a first effort, we utilized the unsupervised ML technique developed by Ceriotti et al.173 to investigate the hydrogen bonding characteristics of brush-supported water molecules inside the cationic PMETA brush layer screened by the chloride ions. The developed algorithm was primarily aimed at providing a data-driven definition of the hydrogen bond (although it can be adapted for identifying other local chemical environments) that appropriately accounted for the confinement effect imposed by the densely grafted PMETA brush layer. The main features of the algorithm as well as the key findings have been discussed below.
The initial phase of this analysis involved defining the dataset. To construct the dataset, it was important to carefully choose the features in line with the specific objectives of the research. Given that the objective of this algorithm was to recognize a particular arrangement of a group of atoms, the selected features should capture this information. For instance, in the scenario where identification of a bond between two atomic species was desired, configurations from an atomistic simulation could be processed to generate a list of distances between pairs of atoms belonging to the two species, which would eventually act as the “features” for the analysis approach. In our case, it was the water–water hydrogen bonds, and accordingly, the descriptors were as follow:
 | (13) |
 | (14) |
 | (15) |
Here, a hydrogen atom is Hi, the donor oxygen atom is Oi, and the acceptor oxygen is  . “d” denotes the distance between the atoms. Consequently, in the above equations, d(Oi–Hi),
  , and
, and  respectively denote the distance between the donor oxygen and hydrogen, the distance between the acceptor oxygen and hydrogen, and the distance between the acceptor oxygen and the donor oxygen.
For analyzing hydrogen bonds, the data set was three-dimensional and the values of each of these features were generated from the output of our all-atom MD simulations of the PMETAC brushes. Of course, it was a tedious task to handle such big dataset or instances. Therefore, a specific number of data points were selected for the analysis using the “min–max” criterion.173 The objective of using the min–max criterion was to select the data points in such a way that they were spread across the feature space in a manner such that the maximum information about the underlying probability distribution function can be obtained with the selected number of data points. After that, kernel density estimation (KDE) was used to connect the data points and to generate a smooth representation of the underlying probability density function. For this analysis, the Gaussian kernel was used, which is represented by eqn (16), where K, x, σ, and D respectively denote the kernel function, the variable, the standard deviation of the Gaussian, and the dimensionality (or the number of features) of the dataset.
 | (16) |
As the next step, a mode-seeking algorithm was used to find the peaks of the probability density function or to find in which areas there was a maximum density of data points. For this purpose, the quick shift algorithm was used, as had been suggested by Ceriotti et al.173 The number of peaks that would be obtained in the process would be used as the number of Gaussians, when the Gaussian mixture model was applied on the data set. Subsequently, a Gaussian mixture model-based clustering technique was used to cluster the data points.174,175 The Gaussian mixture model attempts to model the underlying probability distribution by fitting a function that is a combination of ‘n’ number of Gaussians. In our analysis procedure, the number of Gaussians (n) was determined by finding the number of peaks, as described in the previous step. The function that represented the mixture of Gaussian is given by eqn (17). The functional form of each Gaussian is given by eqn (18).
 | (17) |
 | (18) |
In eqn (17) and (18), G, Pk, μk, Σk, and D respectively represent the Gaussian function, the weight of each Gaussian, mean of the Kth Gaussian, the covariance matrix of the Kth matrix, and the dimensionality of the feature space.
After clustering the data points, various types of analysis could be performed on the cluster to extract meaningful information about the system. One of the clusters encapsulated all the points that determine a water–water hydrogen bond (HB); accordingly, the definition of the water–water HB was determined by the boundaries of the cluster or the range of values of the features.
For our first study, we used this analysis procedure to investigate the hydrogen bonding characteristics of brush-supported water molecules inside densely grafted PMETAC brushes. A schematic of the water–water HB and the features of the algorithm (v, μ, r) are shown in Fig. 26(a) and (b), respectively. We applied machine learning based analysis procedure for both: bulk water and water present inside the PMETAC brush layer. The clustered data points are shown in Fig. 26(c) (for bulk water) and Fig. 26(d) (water present inside the PMETAC brush layer). We used a cutoff of μ, r ≤ 4 Å to exclude the water–water non-hydrogen bonded interactions. There is a symmetry along v = 0 since a given oxygen atom played a dual role, that is it acted as a “donor” in one hydrogen bond and an “acceptor” in another hydrogen bond. The first two clusters (or the clusters represented by the smallest values of μ) represented the hydrogen bonds, while the other clusters represented long-ranged water–water interactions. A comparison of the geometric features of the clusters (representing the water–water hydrogen bonding) in Fig. 26(c) and (d) provided information about the structural difference of the water–water HBs between these two different cases (bulk water and water inside the PMETAC brush layer). We investigated this difference in the water–water HBs between these two cases (bulk water and water inside the PMETAC brush layer) by plotting the data representing the hydrogen bonds in v–r space and by comparing the position of the boundary or margin of the two different cases [see Fig. 26(e)]. It is observed that for the water–water hydrogen bonding for the water molecules inside the brush layer, this boundary can be found at a much lower value of μ = d(Oi − Hi) + d(Oi − Hi) [shown by the red line in Fig. 26(e)] as compared to that for the bulk water [shown by the blue line in Fig. 26(e)]. This suggested that the d(O′–H) value was getting smaller, or the hydrogen (H) was getting closer to the acceptor oxygen (O′). Such disruption or change in the structural properties of the water–water HBs inside the PMETAC brush layer can also be captured by plotting the distribution of H–O′–O angle [see Fig. 26(f)], which shows that the H–O′–O angle (defining the water–water HBs) has a lower spread corresponding to the water–water HBs formed by the water molecules inside the brush than that in the bulk.
Furthermore, using the agnostic definition of water–water HBs derived from our presented ML approach (see above), we calculated the number of water–water HBs inside the PMETAC brush layer across various distances from the grafting substrate. This number was then compared with the number of the water–water HBs obtained by using the established geometric definition of the HBs found in the existing literature (see Table 2). This comparison revealed that the use of the widely accepted definition of the water–water HBs tended to overestimate the count of water–water HBs inside the PMETAC brush layer.
| Distance from grafted carbon | 5.4 Å | 15.7 Å | 26.0 Å | 36.3 Å |
|---|---|---|---|---|
| Using generally accepted definition | 2.5 | 2.51 | 2.53 | 2.57 |
| Using modified definition using ML based approach | 2.29 | 2.37 | 2.39 | 2.42 |
For our next investigation, we employed the same clustering-based ML technique on all-atom MD simulation generated data to explore the effect of the charge density of the PE chains and the different types of counterions on the water–water hydrogen bonding of brush-supported water molecules inside densely grafted PAA brushes. To investigate the effect of charge density of PE chains, we modeled and performed all-atom MD simulations on the PAA brushes with three different charge fractions (f = 0, 0.25, and 1); here f is the ratio of the number of deprotonated (COO−) to total (COOH and –COO−) functional groups. Like our previous study,70 we sampled the (v, μ, r) dataset from the all-atom MD simulation generated data set and used the analysis technique of Ceriotti et al.173 [see Fig. 27(a)–(d)]. As in our previous study, we see two specific clusters (red and cyan), which corresponded to smallest values of  and represented the water–water hydrogen bonding of the brush-supported water molecules. To investigate the structural features of the clusters and compare it for the different cases, we again plotted the data of the clusters representing the water–water HBs in the v, r space [see Fig. 27(e)]. We see that the margins of the clusters progressively deviated from the bulk value with an increase in the charge fraction, f: this suggested that increasing f enhanced the disruption of the water–water HBs inside the PAA brush layer. The brushes that have PE chains with high f tended to interact with the surrounding water molecules more strongly, which disrupted the corresponding water–water hydrogen bonding inside the brush layer. This conclusion was also supported by the observation that the H–O′–O angles (characterizing the water–water hydrogen bonding) show a progressive increase with the charge fraction of the brushes [see Fig. 27(f)].
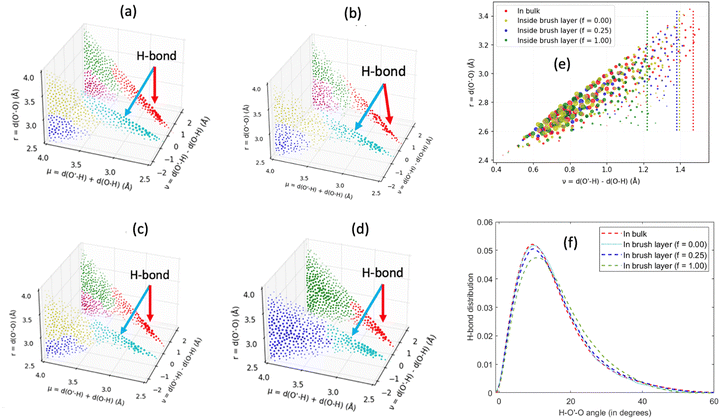 | ||
| Fig. 27 (a)–(d) Distribution of (v, μ, r) [see eqn (6)–(8) for the definition] characterizing the water–water hydrogen bonding for water molecules in (a) bulk, (b) inside the layer of the PAA brushes (with f = 0), (c) inside the layer of the PAA brushes (with f = 0.25), and (d) inside the layer of the PAA brushes (with f = 1). (e) Distribution of (v, r) characterizing the water–water hydrogen bonding for water molecules in bulk and inside the PAA brush layer with different values of f. For each of these cases, the edge of hydrogen bond cluster has been identified. (f) Normalized distribution of the water–water HBs (for water molecules in bulk and inside the PAA brush layer with different f) as functions of the H–O′–O angles. All the parts of the figure have been reprinted with permission from Bera, A. K.; Akash, T. S.; Ishraaq, R.; Pial, T. H.; Das, S., Hydrogen bonding inside anionic polymeric brush layer: Machine Learning-Driven exploration of the relative roles of the polymer steric effect, charging, and type of screening counterions, Macromolecules, 2024, 57, 1581–1592. Copyright (2024) American Chemical Society. | ||
For quantifying the effect of the charge density of the screening counterions (screening the PAA brush charges) on the water–water hydrogen bonding for the brush-supported water molecules, we employed our ML framework on the all-atom MD simulation generated data for the three separate cases where the PAA brushes were screened by three different types counterions, namely Li+, Ca2+ and Y3+ counterions. Same as the previous case, we sampled the (v, μ, r) data set from the all-atom MD simulation data and used the machine learning-based clustering approach. Subsequently, we plotted the cluster representing the water–water hydrogen bonds for each case in the v, r space [see Fig. 28(a)]. We observe a progressive increase (in the v value) in the position of the cluster margin with counterion valence (Y3+ > Ca2+ > Li+), which signified an increase in the disruption of the water–water HBs with counterion valence. Counterions with greater valence (or charges) tend to interact more strongly with their surrounding water which decreased the strength of water–water HBs inside the brushes. This conclusion is also supported by observing that the H–O′–O angle (defining the water–water hydrogen bonding for water molecules inside the brush layer) for the case of the PAA brushes screened with Li+ ion has smaller values as compared to the H–O′–O angle for the case of the PAA brushes screened with the Ca2+ and Y3+ ions [see Fig. 28(b)].
7. Conclusions, future scope, and challenges
This feature article discusses some key contributions of our research group towards better understanding the behavior of polymer and PE brushes and brush supported ions and water molecules using all-atom MD simulations. The unique ability of such atomistic simulations to unravel the behavior and contribution of each individual atom enables us to discover a wide variety of different phenomena taking place at the brush grafted interface. Such phenomena include, but are not limited to (1) the triggering of “water-in-salt” effect by the interaction between the counterion and the brush functional group, (2) massive alterations in the water and ion properties (including their mobilities, conditions determining water–water hydrogen bonding, etc.) inside the brush layer, (3) triggering apolar hydration effect and solvent-separated ion pairs by specific cationic brushes, and (4) inducing coion-driven electroosmotic flow and electroslippage effect in pressure-driven flow in nanochannels grafted with anionic brushes.These findings are key discoveries in our understanding of the behavior of the PE brushes. Additionally, these findings motivate us to look even deeper into the behavior of the brushes in future. For example, ML is a very powerful tool, which when employed to the vast amount of all-atom MD simulation generated data will be able to reveal remarkable insights on the properties of brush-supported water molecules and ions: for example, can ML approach identify novel conditions for hydration of the PE functional groups inside the brush layer or identify conditions that ensure a gradient in ion mobility depending on their relative locations from the brush layer? Another important open research area is to account for the pH-responsiveness of these brushes in a form that accounts for the species generation and disappearance on account of pH-induced ionization of the brush functional groups. A ReaxFF (or reactive force field) based approach, or even better a DFT (density functional theory) based approach might be needed for the purpose, provided we still can simulate enough number of monomers of the PE system to make the results credible. Finally, the all-atom framework considered in this study will have significant implications for studying other systems involving PE brushes (e.g., PE brushes used for regulating protein adsorption,175–178 bottlebrush systems179,180 used for the fabrication of solid polymer electrolytes, etc.). Such an endeavor is definitely a near-future prospect of the all-atom MD simulation-based investigations of the polymer and the PE brushes.
It is important to end this paper by pointing out some limitations of these all-atom MD simulation studies on polymer and PE brushes. The limitations of these studies are similar to those encountered in any classical molecular dynamics (MD) study. The first limitation pertains to the length scale: due to computational costs, brushes with longer chain lengths are not explored using all-atom MD simulations. These longer chains might exhibit new regimes or reveal novel physics. Another related issue is the grafting density. Due to computational constraints, brush systems with low grafting densities are seldom explored. Long chain lengths and low grafting densities can enable the polymer chains to adopt various novel conformations, such as secondary structures (pinned micelles or entanglements),181,182 which might impact local water structure and ion mobility. Furthermore, the formation of structures such as entanglements can only be captured over long-time limits. Therefore, even if simulations were conducted with longer chain lengths and smaller grafting densities, the existing all-atom MD simulation framework, which typically considers a time range of a few nanoseconds, would have failed to capture the formation of structures like entanglements. Under such circumstances, it might be necessary to employ enhanced sampling techniques (such as metadynamics183) in order to capture events (such as the formation of structures like entanglements) whose occurrences are associated with longer time scales. Finally, the choices of the force fields employed in all-atom MD simulations of polymer and PE brushes, is a crucial factor in determining the accuracy of information generated. Various force field models, including polarizable ones like the Drude oscillator184 and fluctuating charge models,185 can influence the conclusions of the simulations. The use of such polarizable force fields can become important given the significant influence of the charges (overall charges of the PE brushes, partial charges of several functional groups of the PE brushes, charges of the counterions, etc.) in the simulated system.
Conflicts of interest
There are no conflicts to declare.Acknowledgements
This work was supported by the Department of Energy Office of Science (Grant DE-SC0017741).References
- A. M. Bhayo, Y. Yang and X. He, Polymer brushes: Synthesis, Characterization, Properties and Applications, Prog. Mater. Sci., 2022, 130, 101000 CrossRef.
- C. Feng and X. Huang, Polymer brushes: Efficient Synthesis and Applications, Acc. Chem. Res., 2018, 51(9), 2314–2323 CrossRef CAS PubMed.
- G. C. R. van Eck, L. Chiappisi and S. de Beer, Fundamentals and Applications of Polymer Brushes in Air, ACS Appl. Polym. Mater., 2022, 4(5), 3062–3087 CrossRef PubMed.
- R. R. Netz and M. Schick, Classical Theory of Polymer Brushes, Europhys. Lett., 1997, 38(1), 37–42 CrossRef CAS.
- A. Naji; C. Seidel and R. R. Netz, Theoretical approaches to Neutral and Charged Polymer Brushes, Springer eBooks, 2006, pp. 149–183 Search PubMed.
- S. Das, M. Banik, G. Chen, S. Sinha and R. Mukherjee, Polyelectrolyte brushes: Theory, Modelling, Synthesis and Applications, Soft Matter, 2015, 11(44), 8550–8583 RSC.
- E. B. Zhulina and M. Rubinstein, Lubrication by Polyelectrolyte Brushes, Macromolecules, 2014, 47(16), 5825–5838 CrossRef CAS PubMed.
- C. Balzer and Z.-G. Wang, Electroresponse of Weak Polyelectrolyte Brushes, Eur. Phys. J. E, 2023, 46, 82 CrossRef CAS PubMed.
- S. Alexander, Polymer Adsorption on Small Spheres. A Scaling Approach, J. Phys., 1977, 38(8), 977–981 CrossRef CAS.
- P. G. de Gennes, Scaling theory of Polymer Adsorption, J. Phys., 1976, 37(12), 1445–1452 CrossRef CAS.
- P. G. de Gennes, Conformations of Polymers Attached to an Interface, Macromolecules, 1980, 13(5), 1069–1075 CrossRef CAS.
- S. T. Milner, Compressing Polymer “Brushes”: a Quantitative Comparison of Theory and Experiment, Europhys. Lett., 1988, 7(8), 695–699 CrossRef CAS.
- S. T. Milner, Strong-stretching and Scheutjens–Fleer descriptions of Grafted Polymer Brushes, J. Chem. Soc., Faraday Trans., 1990, 86(9), 1349–1353 RSC.
- S. T. Milner, Polymer brushes, Science, 1991, 251, 905–914 CrossRef CAS PubMed.
- S. T. Milner, T. A. Witten and M. E. Cates, A Parabolic Density Profile for grafted Polymers, Europhys. Lett., 1988, 5(5), 413–418 CrossRef CAS.
- S. T. Milner, T. A. Witten and M. E. Cates, Theory of the grafted Polymer Brush, Macromolecules, 1988, 21(8), 2610–2619 CrossRef CAS.
- A. M. Skvortsov, I. V. Pavlushkov, A. A. Gorbunov, Y. B. Zhulina, O. V. Borisov and V. Pryamitsyn, Structure of Densely Grafted Polymeric Monolayers, Polym. Sci. USSR, 1988, 30(8), 1706–1715 CrossRef.
- Ye. B. Zhulina, V. Pryamitsyn and O. V. Borisov, Structure and Conformational Transitions in Grafted Polymer Chain Layers. A new theory, Polym. Sci. USSR, 1989, 31(1), 205–216 CrossRef.
- N. Dan and M. Tirrell, Polymers tethered to Curves Interfaces: A Self-Consistent-Field Analysis, Macromolecules, 1992, 25(11), 2890–2895 CrossRef CAS.
- E. B. Zhulina and O. V. Borisov, Structure and Interaction of Weakly Charged Polyelectrolyte Brushes: Self-consistent Field Theory, J. Chem. Phys., 1997, 107(15), 5952–5967 CrossRef CAS.
- R. S. Ross and P. Pincus, The polyelectrolyte brush: poor solvent, Macromolecules, 1992, 25(8), 2177–2183 CrossRef CAS.
- S. Misra, S. Varanasi and P. P. Varanasi, A polyelectrolyte brush theory, Macromolecules, 1989, 22(11), 4173–4179 CrossRef CAS.
- G. Chen and S. Das, Scaling laws and ionic current inversion in Polyelectrolyte-Grafted nanochannels, J. Phys. Chem. B, 2015, 119(39), 12714–12726 CrossRef CAS PubMed.
- E. B. Zhulina and O. V. Borisov, Poisson–Boltzmann Theory of pH-Sensitive (Annealing) Polyelectrolyte Brush, Langmuir, 2011, 27(17), 10615–10633 CrossRef CAS PubMed.
- G. Chen and S. Das, Electrostatics of Soft Charged interfaces with pH-dependent Charge Density: Effect of Consideration of Appropriate Hydrogen ion Concentration Distribution, RSC Adv., 2015, 5(6), 4493–4501 RSC.
- H. S. Sachar, V. S. Sivasankar and S. Das, Revisiting the Strong Stretching Theory for pH-Responsive Polyelectrolyte Brushes: Effects of Consideration of Excluded Volume Interactions and an Expanded Form of the Mass Action Law, Soft Matter, 2019, 15(4), 559–574 RSC.
- S. A. Etha, V. S. Sivasankar, H. S. Sachar and S. Das, Strong Stretching Theory for pH-Responsive Polyelectrolyte Brushes in Large Salt Concentrations, Phys. Chem. Chem. Phys., 2020, 22(24), 13536–13553 RSC.
- M. Shen, Z. Zhang, J. Yang and G. Xiong, Wetting Behavior and Tribological Properties of Polymer Brushes on Laser-Textured surface, Polymers, 2019, 11(6), 981 CrossRef PubMed.
- R. Farina, N. Laugel, J. Yu and M. Tirrell, Reversible Adhesion with Polyelectrolyte Brushes Tailored via the Uptake and Release of Trivalent Lanthanum Ions, J. Phys. Chem. C, 2015, 119(26), 14805–14814 CrossRef CAS.
- M. Kobayashi, Y. Terayama, H. Yamaguchi, M. Terada, D. Murakami, K. Ishihara and A. Takahara, Wettability and Antifouling Behavior on the Surfaces of Superhydrophilic Polymer Brushes, Langmuir, 2012, 28(18), 7212–7222 CrossRef CAS PubMed.
- X. Luo, C. Yin, L. Ji, J. Feng, P. Zhang, X. Wang, Y. Ma and X. Liu, An Antimicrobial Polymer Brush Coating to Fabricate High-Performance, Durable, Self-Sterilization, and Recyclable face masks, Chem. Mater., 2023, 35(21), 9245–9256 CrossRef CAS.
- M. Ali, B. Yameen, R. Neumann, W. Ensinger, W. Knoll and O. Azzaroni, Biosensing and Supramolecular Bioconjugation in Single Conical Polymer Nanochannels. Facile Incorporation of Biorecognition Elements into Nanoconfined Geometries, J. Am. Chem. Soc., 2008, 130(48), 16351–16357 CrossRef CAS PubMed.
- B. Yameen, M. Ali, R. Neumann, W. Ensinger, W. Knoll and O. Azzaroni, Single Conical Nanopores Displaying PH-Tunable Rectifying Characteristics. Manipulating Ionic Transport with Zwitterionic Polymer Brushes, J. Am. Chem. Soc., 2009, 131(6), 2070–2071 CrossRef CAS PubMed.
- E. N. Durmaz, S. Sahin, E. Virga, S. de Beer, L. C. P. M. de Smet and W. M. de Vos, Polyelectrolytes as Building Blocks for Next-Generation Membranes with Advanced Functionalities, ACS Appl. Polym. Mater., 2021, 3(9), 4347–4374 CrossRef CAS PubMed.
- K. Ishihara, Highly lubricated polymer interfaces for Advanced Artificial hip joints through Biomimetic design, Polym. J., 2015, 47(9), 585–597 CrossRef CAS.
- C. H. J. Choi, J. E. Zuckerman, P. Webster and M. E. Davis, Targeting kidney Mesangium by Nanoparticles of Defined size, Proc. Natl. Acad. Sci. U. S. A., 2011, 108(16), 6656–6661 CrossRef CAS PubMed.
- G. Zhang, J. Liu, Q. Yang, R. Zhuo and X. Jiang, Disulfide-Containing brushed Polyethylenimine derivative Synthesized by Click chemistry for nonviral gene delivery, Bioconjugate Chem., 2012, 23(6), 1290–1299 CrossRef CAS PubMed.
- G. Liu, M. Cai, X. Wang, F. Zhou and W. Liu, Core–Shell–Corona-Structured Polyelectrolyte Brushes-Grafting magnetic nanoparticles for water harvesting, ACS Appl. Mater. Interfaces, 2014, 6(14), 11625–11632 CrossRef CAS PubMed.
- N. B. Saleh, T. Sârbu, K. Sirk, G. V. Lowry, K. Matyjaszewski and R. D. Tilton, Oil-in-Water emulsions stabilized by highly charged Polyelectrolyte-Grafted silica nanoparticles, Langmuir, 2005, 21(22), 9873–9878 CrossRef CAS PubMed.
- R. B. Ghahfarokhi, S. J. Johnson, S. McCool, D. W. Green, G. P. Willhite and J. Liang, Polyelectrolyte Complex Nanoparticles for Protection and Delayed release of Enzymes in Alkaline pH and at Elevated Temperature during Hydraulic Fracturing of Oil Wells, J. Appl. Polym. Sci., 2012, 126(2), 587–592 CrossRef.
- W. M. De Vos and F. A. M. Leermakers, Modeling the Structure of a Polydisperse Polymer Brush, Polymer, 2009, 50(1), 305–316 CrossRef CAS.
- R. Catarino-Centeno, M. A. B. Altamirano, E. Pérez and A. G. Goicochea, The Role of Solvent Quality, Inhomogeneous Polymer Brush Composition, Grafting Density and Number of Free Chains on the Viscosity, Friction between Surfaces, and their Scaling Laws, Chem. Phys. Lett., 2019, 722, 124–131 CrossRef CAS.
- S. Misra, M. Tirrell and W. L. Mattice, Interaction between Polyelectrolyte Brushes in Poor Solvents, Macromolecules, 1996, 29(18), 6056–6060 CrossRef CAS.
- M. Li, B. Zhuang and J. Yu, Effects of Ion Valency on Polyelectrolyte Brushes: a Unified Theory, Macromolecules, 2022, 55(23), 10450–10456 CrossRef CAS.
- T. Krivorotova, R. Makuška, A. Naderi, P. M. Claesson and A. Dédinaité, Synthesis and Interfacial Properties of Novel Cationic Polyelectrolytes with Brush-on-Brush Structure of Poly(ethylene oxide) Side Chains, Eur. Polym. J., 2010, 46(2), 171–180 CrossRef CAS.
- M. Liu, J. Ni, C. Zhang, L. Wang, Y. Guo and Z. Liu, Regulation Mechanism of Special Functional Groups Contained in Polymer Molecular Chains on the Tribological Properties of Modified TI6AL4V, Polymers, 2023, 15(20), 4060 CrossRef CAS PubMed.
- J.-S. Sin, Structural and Electrostatic Properties Between pH-responsive Polyelectrolyte Brushes Studied by Augmented Strong Stretching Theory, J. Chem. Phys., 2022, 157(8), 084902 CrossRef CAS PubMed.
- J. Y. Carrillo and A. V. Dobrynin, Salt Effect on Osmotic Pressure of Polyelectrolyte Solutions: Simulation study, Polymers, 2014, 6(7), 1897–1913 CrossRef.
- K. Krishnamoorthy, K. Q. Hoffmann, S. Kewalramani, J. D. Brodin, L. M. Moreau, C. A. Mirkin, M. O. De La Cruz and M. J. Bedzyk, Defining the Structure of a Protein–Spherical Nucleic Acid Conjugate and its Counterionic Cloud, ACS Cent. Sci., 2018, 4(3), 378–386 CrossRef CAS PubMed.
- F. H. J. van der Heyden, D. Stein, K. Besteman, S. G. Lemay and C. Dekker, Charge inversion at high ionic strength studied by streaming currents, Phys. Rev. Lett., 2006, 96(22), 224502 CrossRef PubMed.
- N. Kumar and C. Seidel, Polyelectrolyte Brushes with Added Salt, Macromolecules, 2005, 38(22), 9341–9350 CrossRef CAS.
- G. Chen, H. Li and S. Das, Scaling Relationships for Spherical Polymer Brushes Revisited, J. Phys. Chem. B, 2016, 120(23), 5272–5277 CrossRef CAS PubMed.
- E. B. Zhulina and T. A. Vilgis, Scaling Theory of Planar Brushes Formed by Branched Polymers, Macromolecules, 1995, 28(4), 1008–1015 CrossRef CAS.
- E. B. Zhulina and O. V. Borisov, Cylindrical brushes with ionized side chains: Scaling theory revisited, Soft Matter, 2023, 19(43), 8440–8452 RSC.
- L.-J. Qu, Scaling Theory of Strongly Charged Cylindrical Polyelectrolyte Brushes, Commun. Theor. Phys., 2012, 57(6), 1091–1094 CrossRef.
- F. S. Csajka, R. R. Netz, C. F. Seidel and J. Joanny, Collapse of Polyelectrolyte Brushes: Scaling Theory and Simulations, Eur. Phys. J. E, 2001, 4(4), 505–513 CrossRef CAS.
- P. R. Desai, S. Sinha and S. Das, Polyelectrolyte Brush Bilayers in Weak Interpenetration Regime: Scaling Theory and Molecular Dynamics Simulations, Phys. Rev. E, 2018, 97(3), 032503 CrossRef CAS PubMed.
- P. M. Biesheuvel, Ionizable Polyelectrolyte Brushes: Brush Height and Electrosteric Interaction, J. Colloid Interface Sci., 2004, 275(1), 97–106 CrossRef CAS PubMed.
- D. V. Kuznetsov and Z. Y. Chen, Semiflexible Polymer Brushes: A Scaling Theory, J. Chem. Phys., 1998, 109(16), 7017–7027 CrossRef CAS.
- G. Quan, M. Wang and C. Tong, A Numerical Study of Spherical Polyelectrolyte Brushes by the Self-Consistent Field Theory, Polymer, 2014, 55(25), 6604–6613 CrossRef CAS.
- D. Prusty, A. Gallegos and J. Wu, Unveiling the Role of Electrostatic Forces on Attraction between Opposing Polyelectrolyte Brushes, Langmuir, 2024, 40(4), 2064–2078 CrossRef CAS PubMed.
- E. B. Zhulina, F. A. M. Leermakers and O. V. Borisov, Structure and Lubrication of Solvent-Free Dendron Brushes, Polymer, 2017, 120, 223–235 CrossRef CAS.
- J. T. Mims, L. Tsuna, E. J. Spangler and M. Laradji, Nanoparticles Insertion and Dimerization in Polymer Brushes, J. Chem. Phys., 2024, 160(8), 084906 CrossRef CAS PubMed.
- S. A. Etha, V. S. Sivasankar, H. S. Sachar and S. Das, Strong Stretching Theory for pH-Responsive Polyelectrolyte Brushes in Large Salt Concentrations, Phys. Chem. Chem. Phys., 2020, 22(24), 13536–13553 RSC.
- I. O. Lebedeva, E. B. Zhulina and O. V. Borisov, Self-Consistent Field Theory of Polyelectrolyte Brushes with Finite Chain Extensibility, J. Chem. Phys., 2017, 146(21), 214901 CrossRef PubMed.
- M. Y. Laktionov, E. B. Zhulina, R. P. Richter and O. V. Borisov, Polymer Brush in a Nanopore: Effects of Solvent Strength and Macromolecular Architecture Studied by Self-Consistent Field and Scaling Theory, Polymers, 2021, 13(22), 3929 CrossRef CAS PubMed.
- T. H. Pial, H. S. Sachar and S. Das, Quantification of Mono- and Multivalent Counterion-Mediated Bridging in Polyelectrolyte Brushes, Macromolecules, 2021, 54(9), 4154–4163 CrossRef CAS.
- R. Ishraaq and S. Das, All-Atom Molecular Dynamics Simulations of Cationic Polyelectrolyte Brushes in the Presence of Halide Counterions, Macromolecules, 2024, 57(7), 3037–3046 CrossRef CAS.
- A. K. Bera, T. S. Akash, R. Ishraaq, T. H. Pial and S. Das, Hydrogen Bonding inside Anionic Polymeric Brush Layer: Machine Learning-Driven Exploration of the Relative roles of the Polymer steric effect, Charging, and type of Screening Counterions, Macromolecules, 2024, 57(4), 1581–1592 CrossRef CAS.
- T. H. Pial and S. Das, Machine learning enabled Quantification of the Hydrogen Bonds inside the Polyelectrolyte Brush Layer probed using All-atom Molecular Dynamics Simulations, Soft Matter, 2022, 18(47), 8945–8951 RSC.
- K. Yamazoe, Y. Higaki, Y. Inutsuka, J. Miyawaki, A. Takahara and Y. Harada, Critical In-Plane Density of Polyelectrolyte Brush for the Ordered Hydrogen-Bonded Structure of Incorporated Water, Langmuir, 2022, 38(10), 3076–3081 CrossRef CAS PubMed.
- R. Ishraaq, T. S. Akash, A. K. Bera and S. Das, Hydrophilic and Apolar Hydration in Densely Grafted Cationic Brushes and Counterions with Large Mobilities, J. Phys. Chem. B, 2023, 128(1), 381–392 CrossRef PubMed.
- D. Murakami, M. Kobayashi, T. Moriwaki, Y. Ikemoto, H. Jinnai and A. Takahara, Spreading and Structuring of Water on Superhydrophilic Polyelectrolyte Brush Surfaces, Langmuir, 2013, 29(4), 1148–1151 CrossRef CAS PubMed.
- M. Ballauff and O. V. Borisov, Polyelectrolyte brushes, Curr. Opin. Colloid Interface Sci., 2006, 11(6), 316–323 CrossRef CAS.
- J. D. Willott, T. J. Murdoch and G. B. Webber, Physicochemical Behaviour of Cationic Polyelectrolyte Brushes, Prog. Polym. Sci., 2017, 64, 52–75 CrossRef CAS.
- J. Yu, J. Mao, G. Yuan, S. K. Satija, Z. Jiang, W. Chen and M. Tirrell, Structure of Polyelectrolyte Brushes in the Presence of Multivalent Counterions, Macromolecules, 2016, 49(15), 5609–5617 CrossRef CAS.
- S. M. Kilbey and J. F. Ankner, Neutron Reflectivity as a Tool to Understand Polyelectrolyte Brushes, Curr. Opin. Colloid Interface Sci., 2012, 17(2), 83–89 CrossRef CAS.
- E. Bittrich, K. B. Rodenhausen, K. Eichhorn, T. Hofmann, M. Schubert, M. Stamm and P. Uhlmann, Protein Adsorption on and Swelling of Polyelectrolyte Brushes: A Simultaneous Ellipsometry-Quartz Crystal Microbalance Study, Biointerphases, 2010, 5(4), 159–167 CrossRef PubMed.
- K. Hinrichs, D. Aulich, L. Ionov, N. Esser, K. Eichhorn, M. Motornov, M. Stamm and S. Minko, Chemical and Structural Changes in a PH-Responsive Mixed Polyelectrolyte Brush Studied by Infrared Ellipsometry, Langmuir, 2009, 25(18), 10987–10991 CrossRef CAS PubMed.
- S. Moya and J. Irigoyen, Recent Advances in the use of the Quartz Crystal Microbalance with Dissipation for the Study of the Collapse of Polyelectrolyte Brushes, J. Polym. Sci., Part B: Polym. Phys., 2013, 51(14), 1068–1072 CrossRef CAS.
- C. Ji, C. Zhou, B. Zhao, J. Yang and J. Zhao, Effect of Counterion Binding to Swelling of Polyelectrolyte Brushes, Langmuir, 2021, 37(18), 5554–5562 CrossRef CAS PubMed.
- X. Xu, M. Billing, M. Ruths, H. Klok and J. Yu, Structure and Functionality of Polyelectrolyte Brushes: A Surface force perspective, Chem. – Asian J., 2018, 13(22), 3411–3436 CrossRef CAS PubMed.
- F. S. Csajka and C. Seidel, Strongly Charged Polyelectrolyte Brushes: A Molecular Dynamics study, Macromolecules, 2000, 33(7), 2728–2739 CrossRef CAS.
- Q.-H. Hao, L. Liu, G. Xu, L. Liu and B. Miao, The Effects of Grafting Density and Charge Fraction on the Properties of Ring Polyelectrolyte Brushes: a Molecular Dynamics Simulation Study, Colloid Polym. Sci., 2019, 298(1), 21–33 CrossRef.
- J. Yu, N. E. Jackson, X. Xu, B. Brettmann, M. Ruths, J. J. De Pablo and M. Tirrell, Multivalent Ions induce Lateral Structural Inhomogeneities in Polyelectrolyte Brushes, Sci. Adv., 2017, 3(12), eaao1497 CrossRef PubMed.
- L. A. Smook and S. de Beer, Electrical Chain Rearrangement: What happens when Polymers in Brushes have a Charge Gradient?, Langmuir, 2024, 40(8), 4142–4151 CrossRef CAS PubMed.
- E. Van Andel, S. Lange, S. P. Pujari, E. Tijhaar, M. M. J. Smulders, H. F. J. Savelkoul and H. Zuilhof, Systematic Comparison of Zwitterionic and Non-Zwitterionic Antifouling Polymer Brushes on a Bead-Based Platform, Langmuir, 2018, 35(5), 1181–1191 CrossRef PubMed.
- D. Daniel, A. Y. T. Chia, L. C. H. Moh, R. Liu, X. Q. Koh, X. Zhang and N. Tomczak, Hydration Lubrication of Polyzwitterionic Brushes Leads to Nearly Friction- and Adhesion-free Droplet Motion, Commun. Phys., 2019, 2(1), 105 CrossRef.
- H. An, Y. Liu, J. Yi, H. Xie, C. Li, X. Wang and W. Chai, Research progress of Cartilage Lubrication and Biomimetic Cartilage Lubrication Materials, Front. Bioeng. Biotechnol., 2022, 10 DOI:10.3389/fbioe.2022.1012653.
- T. E. Gartner and A. Jayaraman, Modeling and Simulations of Polymers: A Roadmap, Macromolecules, 2019, 52(3), 755–786 CrossRef CAS.
- M. A. González, Institut Laue Langevin, Force Fields and Molecular Dynamics Simulations, EDP Sciences, 2011, vol. 12, pp. 169–200 Search PubMed.
- K. H. DuBay, M. L. Hall, T. F. Hughes, C. Wu, D. R. Reichman and R. A. Friesner, Accurate Force Field Development for Modeling Conjugated Polymers, J. Chem. Theory Comput., 2012, 8(11), 4556–4569 CrossRef CAS PubMed.
- W. L. Jorgensen, D. S. Maxwell and J. Tirado-Rives, Development and Testing of the OPLS All-Atom Force Field on Conformational Energetics and Properties of Organic Liquids, J. Am. Chem. Soc., 1996, 118(45), 11225–11236 CrossRef CAS.
- Y. Duan, C. Wu, S. Chowdhury, M. C. Lee, X. Guan, W. Zhang, R. Yang, P. Cieplak, R. Luo, L. T, J. W. Caldwell, J. Wang and P. A. Kollman, A point-charge Force Field for Molecular Mechanics Simulations of Proteins based on Condensed-phase Quantum Mechanical Calculations, J. Comput. Chem., 2003, 24(16), 1999–2012 CrossRef CAS PubMed.
- K. Vanommeslaeghe, E. Hatcher, C. Acharya, S. C. Kundu, S. Zhong, J. Shim, E. Darian, O. Guvench, P. E. M. Lopes, I. Vorobyov and A. D. MacKerell, CHARMM General Force Field: A Force Field for Drug-like Molecules Compatible with the CHARMM All-atom additive Biological Force Fields, J. Comput. Chem., 2009, 31(4), 671–690 CrossRef PubMed.
- L. P. Fachin, V. H. Rusu, H. Verli and R. D. Lins, GROMOS 53A6GLYC, an improved GROMOS Force Field for Hexopyranose-Based Carbohydrates, J. Chem. Theory Comput., 2012, 8(11), 4681–4690 CrossRef PubMed.
- E. Venezia, F. Auriemma, O. R. De Ballestreros, G. Guerra, G. Milano and A. Correa, All-Atom Molecular Dynamics Simulations of poly(2,6-dimethyl-1,4-phenylene) oxide: Validation of OPLS-AA Force Field for Conformational Behaviour in Vacuum and in Carbon Tetrachloride, Macromol. Chem. Phys., 2023, 224(21), 2300120 CrossRef CAS.
- A. Noorjahan and P. Choi, Thermodynamic Properties of poly(vinyl alcohol) with Different Tacticities Estimated From Molecular Dynamics Simulation, Polymer, 2013, 54(16), 4212–4219 CrossRef CAS.
- C. E. Fang, Y. C. Tsai, C. Scheurer and C. C. Chiu, Revised atomic Charges for OPLS Force Field Model of Poly (Ethylene Oxide): Benchmarks and Applications in Polymer Electrolyte, Polymers, 2021, 13(7), 1131 CrossRef CAS PubMed.
- Y. Lv and C. Ruan, Molecular Dynamics Simulation of Nonisothermal Crystallization of a Single Polyethylene Chain and Short Polyethylene Chains Based on OPLS Force Field, e-Polymers, 2022, 22(1), 136–146 CrossRef CAS.
- S. Izadi, R. Anandakrishnan and A. V. Onufriev, Building Water Models: A Different Approach, J. Phys. Chem. Lett., 2014, 5(21), 3863–3871 CrossRef CAS PubMed.
- P. M. And and L. Nilsson, Structure and Dynamics of the TIP3P, SPC, and SPC/E Water Models at 298 K, J. Phys. Chem. A, 2001, 105(43), 9954–9960 CrossRef.
- K. P. Jensen and W. L. Jorgensen, Halide, Ammonium, and Alkali Metal Ion Parameters for Modeling Aqueous Solutions, J. Chem. Theory Comput., 2006, 2(6), 1499–1509 CrossRef CAS PubMed.
- J. Åqvist, Ion-Water Interaction Potentials Derived from Free Energy Perturbation Simulations, J. Phys. Chem., 1990, 94(21), 8021–8024 CrossRef.
- B. Roux, Valence Selectivity of the Gramicidin Channel: A Molecular Dynamics Free Energy Perturbation Study, Biophys. J., 1996, 71(6), 3177–3185 CrossRef CAS PubMed.
- D. E. Smith and L. X. Dang, Computer Simulations of NaCl Association in Polarizable Water, J. Chem. Phys., 1994, 100(5), 3757–3766 CrossRef CAS.
- I. Joung and T. E. Cheatham, Determination of Alkali and Halide Monovalent Ion Parameters for use in Explicitly Solvated Biomolecular Simulations, J. Phys. Chem. B, 2008, 112(30), 9020–9041 CrossRef CAS PubMed.
- J. A. Clark, V. M. Prabhu and J. F. Douglas, Molecular Dynamics Simulation of the Influence of Temperature and Salt on the Dynamic Hydration Layer in a Model Polyzwitterionic Polymer PAEDAPS, J. Phys. Chem. B, 2023, 127(38), 8185–8198 CrossRef CAS PubMed.
- Y. Xiang, R.-G. Xu and Y. Leng, Molecular Understanding of Ion Effect on Polyzwitterion Conformation in an Aqueous Environment, Langmuir, 2020, 36(26), 7648–7657 CrossRef CAS PubMed.
- W. Chu, M. Webb, C. Deng, Y. J. Colón, Y. Kambe, S. Krishnan, P. F. Nealey and J. J. De Pablo, Understanding Ion Mobility in P2VP/NMP+I− Polymer Electrolytes: A Combined Simulation and Experimental study, Macromolecules, 2020, 53(8), 2783–2792 CrossRef CAS.
- E. J. Maginn, R. A. Messerly, D. J. Carlson, D. R. Roe and J. R. Elliott, Best Practices for Computing Transport Properties 1. Self-Diffusivity and Viscosity from Equilibrium Molecular Dynamics [Article v1.0], Liv. J. Comput. Mol. Sci., 2018, 1, 6324 Search PubMed.
- M. Ward and T. K. Georgiou, Thermoresponsive Polymers for Biomedical Applications, Polymers, 2011, 3(3), 1215–1242 CrossRef CAS.
- T. Sato, G. J. Dunderdale and A. Hozumi, Simple and Scalable Protocol for Producing Hydrophobic Polymer Brushes Beyond Wafer-Scale Dimensions toward Real-Life Applications, ACS Appl. Polym. Mater., 2021, 3(3), 1395–1405 CrossRef CAS.
- Y. Higaki, M. Kobayashi, D. Murakami and A. Takahara, Anti-fouling Behavior of Polymer Brush Immobilized Surfaces, Polym. J., 2016, 48(4), 325–331 CrossRef CAS.
- E. Yılmazoğlu and S. Karakuş, Synthesis and Specific Biomedical Applications of Polymer Brushes, Appl. Surface Sci. Adv., 2023, 18, 100544 CrossRef.
- H. Du and X. Qian, Molecular Dynamics Simulations of PNIPAM-co-PEGMA Copolymer Hydrophilic to Hydrophobic Transition in NaCl solution, J. Polym. Sci., Part B: Polym. Phys., 2011, 49(15), 1112–1122 CrossRef CAS.
- V. Aubakirova, R. G. Farrakhov, A. Sharipov, V. Polyakova, L. V. Parfenova and E. V. Parfenov, Investigation of Biocompatible PEO Coating Growth on cp-Ti with In Situ Spectroscopic Methods, Materials, 2021, 15(1), 9 CrossRef PubMed.
- G. Homann, L. Stolz, J. R. Nair, I. C. Laskovic, M. Winter and J. Kasnatscheew, Poly(Ethylene Oxide)-based Electrolyte for Solid-State-Lithium-Batteries with High Voltage Positive Electrodes: Evaluating the Role of Electrolyte Oxidation in Rapid Cell Failure, Sci. Rep., 2020, 10(1), 4390 CrossRef CAS PubMed.
- B. M. Lipinski, L. S. Morris, M. N. Silberstein and G. W. Coates, Isotactic Poly(propylene oxide): A Photodegradable Polymer with Strain Hardening Properties, J. Am. Chem. Soc., 2020, 142(14), 6800–6806 CrossRef CAS PubMed.
- B. Khatir, Z. A. Dijvejin, P. Serles, T. Filleter and K. Golovin, Molecularly Capped Omniphobic Polydimethylsiloxane Brushes with Ultra-Fast Contact Line Dynamics, Small, 2023, 19(38), 2301142 CrossRef CAS PubMed.
- Z. Liu, Y. Ootani, S. Uehara, J. Zhang, Q. Chen, Y. Wang, N. Ozawa and M. Kubo, Coarse-Grained Molecular Dynamics Simulation of the Effect of Cross-Linking on the Wear Mechanism of Polymer Brush, Chem. Lett., 2024, 53(3), upae035 CrossRef.
- K. Hagita, H. Morita, M. Doi and H. Takano, Coarse-Grained Molecular Dynamics Simulation of Filled Polymer Nanocomposites under Uniaxial Elongation, Macromolecules, 2016, 49(5), 1972–1983 CrossRef CAS.
- M. K. Singh, P. Ilg, R. M. Espinosa-Marzal, M. Kröger and N. D. Spencer, Polymer Brushes under Shear: Molecular Dynamics Simulations Compared to Experiments, Langmuir, 2015, 31(16), 4798–4805 CrossRef CAS PubMed.
- H. Merlitz, C. Li, C. Wu and J. Sommer, Polyelectrolyte Brushes in External fields: Molecular Dynamics Simulations and Mean-Field Theory, Soft Matter, 2015, 11(28), 5688–5696 RSC.
- Q. Cao, C. Zuo, L. Li and G. Ye, Effects of Chain Stiffness and Salt Concentration on Responses of Polyelectrolyte Brushes under External Electric Field, Biomicrofluidics, 2011, 5(4), 044119 CrossRef PubMed.
- U. Dahal, Z. Wang and E. E. Dormidontova, Hydration and Mobility of Poly(ethylene oxide) Brushes, Macromolecules, 2017, 50(17), 6722–6732 CrossRef CAS.
- S. G. Lee, T. A. Pascal, W. Koh, G. F. Brunello, W. A. Goddard and S. S. Jang, Deswelling Mechanisms of Surface-Grafted Poly(NIPAAM) Brush: Molecular Dynamics Simulation Approach, J. Phys. Chem. C, 2012, 116(30), 15974–15985 CrossRef CAS.
- U. Dahal and E. E. Dormidontova, Chain Conformation and Hydration of Polyethylene Oxide Grafted to Gold Nanoparticles: Curvature and Chain Length Effect, Macromolecules, 2020, 53(19), 8160–8170 CrossRef CAS.
- T. Pan, S. Dutta and C. E. Sing, Interaction Potential for Coarse-Grained Models of Bottlebrush Polymers, J. Chem. Phys., 2022, 156(1), 014903 CrossRef CAS PubMed.
- Q. Cao, C. Zuo, M. Yan, L. Li, S. Chen and H. Zhang-You, Molecular Dynamics Simulations of End-Grafted Polymers with Charged Side Chains, J. Polym. Sci., Part B: Polym. Phys., 2011, 49(12), 882–889 CrossRef CAS.
- H. Maleki and P. E. Theodorakis, Structure of Bottle-Brush Brushes Under Good Solvent Conditions: a Molecular Dynamics Study, J. Phys.: Condens. Matter, 2011, 23(50), 505104 CrossRef PubMed.
- G. Chen and E. E. Dormidontova, Cyclic vs Linear Bottlebrush Polymers in Solution: Side-Chain Length Effect, Macromolecules, 2023, 56(9), 3286–3295 CrossRef CAS.
- T. S. Akash, R. Ishraaq and S. Das, All-Atom Molecular Dynamics Simulations of Uncharged Linear Polymer Bottlebrushes: Effect of the Brush Sizes and the number of Side-Chain Monomers, Langmuir, 2024, 40(6), 2946–2956 CrossRef CAS PubMed.
- G. F.-D. Del Castillo, M. Kyriakidou, Z. Adali, K. Xiong, R. L. N. Hailes and A. Dahlin, Electrically Switchable Polymer Brushes for Protein Capture and Release in Biological Environments, Angew. Chem., Int. Ed., 2022, 61(22), e202115745 CrossRef CAS PubMed.
- T. Wu, P. Gong, I. Szleifer, P. Vlček, V. Šubr and J. Genzer, Behavior of Surface-Anchored Poly(acrylic acid) Brushes with Grafting Density Gradients on Solid Substrates: 1. Experiment, Macromolecules, 2007, 40(24), 8756–8764 CrossRef CAS.
- Y. Tran and P. Auroy, Synthesis of Poly(styrene sulfonate) Brushes, J. Am. Chem. Soc., 2001, 123(16), 3644–3654 CrossRef CAS PubMed.
- Y. Yu, M. Cirelli, P. Li, Z. Ding, Y. Yin, Y. Yuan, S. De Beer, G. J. Vancso and S. Zhang, Enhanced Stability of Poly(3-sulfopropyl methacrylate potassium) Brushes Coated on Artificial Implants in Combatting Bacterial Infections, Ind. Eng. Chem. Res., 2019, 58(47), 21459–21465 CrossRef CAS.
- H. S. Sachar, T. H. Pial, P. R. Desai, S. A. Etha, Y. Wang, P. Chung and S. Das, Densely Grafted Polyelectrolyte Brushes Trigger “Water-in-Salt”-like Scenarios and Ultraconfinement Effect, Matter, 2020, 2(6), 1509–1521 CrossRef.
- L. Suo, O. Borodin, T. Gao, M. Olguin, J. Ho, X. Fan, C. Luo, C. Wang and K. Xu, “Water-in-salt” Electrolyte enables High-voltage Aqueous Lithium-ion Chemistries, Science, 2015, 350, 938–943 CrossRef CAS PubMed.
- H. S. Sachar, T. H. Pial, B. S. Chava and S. Das, All-atom Molecular Dynamics Simulations of Weak Polyionic Brushes: Influence of Charge Density on the Properties of Polyelectrolyte Chains, Brush-supported Counterions, and Water Molecules, Soft Matter, 2020, 16(33), 7808–7822 RSC.
- H. S. Sachar, B. S. Chava, T. H. Pial and S. Das, Hydrogen Bonding and Its Effect on the Orientational Dynamics of Water Molecules inside Polyelectrolyte Brush-Induced Soft and Active Nanoconfinement, Macromolecules, 2021, 54(4), 2011–2021 CrossRef CAS.
- H. S. Sachar, B. S. Chava, T. H. Pial and S. Das, All-Atom Molecular Dynamics Simulations of the Temperature response of Densely Grafted Polyelectrolyte Brushes, Macromolecules, 2021, 54(13), 6342–6354 CrossRef CAS.
- T. H. Pial, M. Prajapati, B. S. Chava, H. S. Sachar and S. Das, Charge-Density-Specific response of grafted polyelectrolytes to Electric Fields: Bending or Tilting?, Macromolecules, 2022, 55(7), 2413–2423 CrossRef CAS.
- M. Ali, B. Yameen, R. Neumann, W. Ensinger, W. Knoll and O. Azzaroni, Biosensing and Supramolecular Bioconjugation in Single Conical Polymer Nanochannels. Facile Incorporation of Biorecognition Elements into Nanoconfined Geometries, J. Am. Chem. Soc., 2008, 130(48), 16351–16357 CrossRef CAS PubMed.
- M. Ali, B. Yameen, J. Cervera, P. RamíRez, R. Neumann, W. Ensinger, W. Knoll and O. Azzaroni, Layer-by-Layer Assembly of Polyelectrolytes into Ionic Current Rectifying Solid-State Nanopores: Insights from Theory and Experiment., J. Am. Chem. Soc., 2010, 132(24), 8338–8348 CrossRef CAS PubMed.
- P. Hu, Y. Zhang, D. Wang, G. Qi and Y. Jin, Glutathione Content Detection of Single Cells under Ingested Doxorubicin by Functionalized Glass Nanopores, Anal. Chem., 2021, 93(9), 4240–4245 CrossRef CAS PubMed.
- B. Vilozny, A. L. Wollenberg, P. Actis, D. Hwang, B. Singaram and N. Pourmand, Carbohydrate-actuated nanofluidic diode: switchable current rectification in a nanopipette, Nanoscale, 2013, 5(19), 9214 RSC.
- G. Chen and S. Das, Electroosmotic transport in polyelectrolyte-grafted nanochannels with pH-dependent charge density, J. Appl. Phys., 2015, 117(18), 185304 CrossRef.
- V. S. Sivasankar, S. A. Etha, H. S. Sachar and S. Das, Thermo-osmotic transport in nanochannels grafted with pH-responsive polyelectrolyte brushes modelled using augmented strong stretching theory, J. Fluid Mech., 2021, 917, A31 CrossRef CAS.
- V. S. Sivasankar, S. A. Etha, H. S. Sachar and S. Das, Ionic diffusioosmotic transport in nanochannels grafted with pH-responsive polyelectrolyte brushes modeled using augmented strong stretching theory, Phys. Fluids, 2020, 32(4), 042003 CrossRef CAS.
- H. S. Sachar, V. S. Sivasankar and S. Das, Electrokinetic energy conversion in nanochannels grafted with pH-responsive polyelectrolyte brushes modelled using augmented strong stretching theory, Soft Matter, 2019, 15(29), 5973–5986 RSC.
- R. S. Maheedhara, H. Jing, H. S. Sachar and S. Das, Highly enhanced liquid flows via thermoosmotic effects in soft and charged nanochannels, Phys. Chem. Chem. Phys., 2018, 20(37), 24300–24316 RSC.
- R. S. Maheedhara, H. S. Sachar, H. Jing and S. Das, Ionic Diffusoosmosis in Nanochannels Grafted with End-Charged Polyelectrolyte Brushes, J. Phys. Chem. B, 2018, 122(29), 7450–7461 CrossRef CAS PubMed.
- G. Chen, H. S. Sachar and S. Das, Efficient electrochemomechanical energy conversion in nanochannels grafted with end-charged polyelectrolyte brushes at medium and high salt concentration, Soft Matter, 2018, 14(25), 5246–5255 RSC.
- G. Chen and S. Das, Massively Enhanced Electroosmotic Transport in Nanochannels Grafted with End-Charged Polyelectrolyte Brushes, J. Phys. Chem. B, 2017, 121(14), 3130–3141 CrossRef CAS PubMed.
- V. S. Sivasankar, S. A. Etha, H. S. Sachar and S. Das, Theoretical study on the massively augmented electro-osmotic water transport in polyelectrolyte brush functionalized nanoslits, Phys. Rev. E, 2020, 102(1), 013103 CrossRef CAS PubMed.
- T. H. Pial, H. S. Sachar, P. R. Desai and S. Das, Overscreening, Co-Ion-Dominated electroosmosis, and electric field strength mediated flow reversal in polyelectrolyte brush functionalized nanochannels, ACS Nano, 2021, 15(4), 6507–6516 CrossRef CAS PubMed.
- H. S. Sachar, T. H. Pial, V. S. Sivasankar and S. Das, Simultaneous energy generation and flow enhancement (Electroslippage effect) in polyelectrolyte brush functionalized nanochannels, ACS Nano, 2021, 15(11), 17337–17347 CrossRef CAS PubMed.
- T. H. Pial and S. Das, Specific ion and electric field controlled diverse ion distribution and electroosmotic transport in a polyelectrolyte brush grafted nanochannel, J. Phys. Chem. B, 2022, 126(49), 10543–10553 CrossRef CAS PubMed.
- S. Chakraborty and S. Das, Streaming-field-induced convective transport and its influence on the electroviscous effects in narrow fluidic confinement beyond the Debye-Hückel limit, Phys. Rev. E, 2008, 77(3), 037303 CrossRef PubMed.
- M. Wang, C. C. Chang and R.-J. Yang, Electroviscous effects in nanofluidic channels, J. Chem. Phys., 2010, 132(2), 024701 CrossRef PubMed.
- Z. Ding, Y. Jian and W. Tan, Electrokinetic energy conversion of two-layer fluids through nanofluidic channels, J. Fluid Mech., 2019, 863, 1062–1090 CrossRef CAS.
- Y. Liu, J. Xing and J. Pi, Surface-charge-mobility-modulated electrokinetic energy conversion in graphene nanochannels, Phys. Fluids, 2022, 34(11), 112018 CrossRef CAS.
- D. Xu, Y. Meng and Y. Xie, Energy harvesting from water streaming at charged surface, Electrophoresis, 2024, 45, 244–265 CrossRef PubMed.
- S. Chanda, S. Sinha and S. Das, Streaming potential and electroviscous effects in soft nanochannels: towards designing more efficient nanofluidic electrochemomechanical energy converters, Soft Matter, 2014, 10(38), 7558–7568 RSC.
- J. D. Willott, T. J. Murdoch and G. B. Webber, Physicochemical behaviour of cationic polyelectrolyte brushes, Prog. Polym. Sci., 2017, 64, 52–75 CrossRef CAS.
- N. Politakos, S. Azinas and S. Moya, Responsive Copolymer Brushes of Poly[(2-(Methacryloyloxy) Ethyl) Trimethylammonium Chloride] (PMETAC) and Poly (1H,1H,2H,2H-Perfluorodecyl acrylate) (PPFDA) to Modulate Surface Wetting Properties, Macromol. Rapid Commun., 2016, 37(7), 662–667 CrossRef CAS PubMed.
- L. García-Tarrés and E. Guàrdia, Hydration and dynamics of a tetramethylammonium ion in water: a computer simulation study, J. Phys. Chem. B, 1998, 102(38), 7448–7454 CrossRef.
- I. I. Vaisman, F. K. Brown and A. Tropsha, Distance Dependence of Water Structure around Model Solutes, J. Phys. Chem., 1994, 98(21), 5559–5564 CrossRef CAS.
- R. Kou, J. Zhang, T. Wang and G. Liu, Interactions between Polyelectrolyte Brushes and Hofmeister Ions: Chaotropes versus Kosmotropes, Langmuir, 2015, 31(38), 10461–10468 CrossRef CAS PubMed.
- D. E. S. Santos, D. Li, M. Ramstedt, J. E. Gautrot and T. A. Soares, Conformational Dynamics and Responsiveness of Weak and Strong Polyelectrolyte Brushes: Atomistic Simulations of Poly(dimethyl aminoethyl methacrylate) and Poly(2-(methacryloyloxy)ethyl trimethylammonium chloride), Langmuir, 2019, 35(14), 5037–5049 CrossRef CAS PubMed.
- S. Bhakat, Collective variable discovery in the age of machine learning: reality, hype and everything in between, RSC Adv., 2022, 12(38), 25010–25024 RSC.
- P. Gasparotto and M. Ceriotti, Recognizing molecular patterns by machine learning: An agnostic structural definition of the hydrogen bond, J. Chem. Phys., 2014, 141(17), 174110 CrossRef PubMed.
- X. Zhuang, Y. Huang, K. Palaniappan and Y. Zhao, Gaussian mixture density modeling, decomposition, and applications, IEEE Trans. Image Process., 1996, 5, 1293–1302 CrossRef CAS PubMed.
- L. Han, B. Yan, L. Zhang, M. Wu, J. Wang, J. Huang, Y. Deng and H. Zeng, Tuning protein adsorption on charged polyelectrolyte brushes via salinity adjustment, Colloids Surf., A, 2018, 539, 37–45 CrossRef CAS.
- J. Yang, Z. Hua, T. Wang, B. Wu, G. Liu and G. Zhang, Counterion-Specific protein adsorption on polyelectrolyte brushes, Langmuir, 2015, 31(22), 6078–6084 CrossRef CAS PubMed.
- C. Czeslik and A. Wittemann, Adsorption mechanism, secondary structure and local distribution of proteins at polyelectrolyte brushes, Colloid Polym. Sci., 2020, 298(7), 775–789 CrossRef CAS.
- M. Atif and A. Balasini, Mixed polymer brushes for controlled protein adsorption: State of the art and future prospective, Mater. Adv., 2024, 5, 1420–1439 RSC.
- C. Deng, M. Webb, P. Bennington, D. Sharon, P. F. Nealey, S. N. Patel and J. J. De Pablo, Role of Molecular architecture on ion transport in ethylene Oxide-Based polymer electrolytes, Macromolecules, 2021, 54(5), 2266–2276 CrossRef CAS.
- C. Deng, P. Bennington, R. J. Sánchez-Leija, S. N. Patel, P. F. Nealey and J. Pablo, Entropic penalty switches LI+ solvation site formation and transport mechanisms in mixed polarity copolymer electrolytes, Macromolecules, 2023, 56(19), 8069–8079 CrossRef CAS PubMed.
- J. Yu, N. E. Jackson, X. Xu, Y. Morgenstern, Y. Kaufman, M. Ruths, J. J. de Pablo and M. Tirrell, Multivalent counterions diminish the lubricity of polyelectrolyte brushes, Science, 2018, 360, 1434–1438 CrossRef CAS PubMed.
- F. Goujon, P. Malfreyt and D. J. Tildesley, Mesoscopic simulation of entangled polymer brushes under shear: Compression and rheological properties, Macromolecules, 2009, 42, 4310–4318 CrossRef CAS.
- C. Liu, J. G. Brandenburg, O. Valsson, K. Kremer and T. Bereau, Free-energy landscape of polymer-crystal polymorphism, Soft Matter, 2020, 16, 9683–9692 RSC.
- G. Lamoureux and B. Roux, Modeling induced polarization with classical Drude oscillators: Theory and molecular dynamics simulation algorithm, J. Chem. Phys., 2003, 119, 3025–3039 CrossRef CAS.
- F. Lippirani and V. Barone, Polarizable force fields and polarizable continuum model: A fluctuating charges/PCM approach. 1. Theory and Implementation, J. Chem. Theory Comput., 2011, 7, 3711–3724 CrossRef PubMed.
| This journal is © The Royal Society of Chemistry 2024 |


