 Open Access Article
Creative Commons Attribution 3.0 Unported Licence
Standardized microstructure characterization of SOC electrodes as a key element for Digital Materials Design†
Philip
Marmet
 *ad,
Lorenz
Holzer
 a,
Thomas
Hocker
a,
Gernot K.
Boiger
a,
Thomas
Hocker
a,
Gernot K.
Boiger
 a,
Holger
Bausinger‡
b,
Andreas
Mai§
 b,
Mathias
Fingerle
 c,
Sarah
Reeb
c,
Dominik
Michel
c,
Sarah
Reeb
c,
Dominik
Michel
 c and
Joseph M.
Brader
 d
d
aZurich University of Applied Sciences, Institute of Computational Physics, CH-8400 Winterthur, Switzerland. E-mail: mame@zhaw.ch
bHexis AG, CH-8404 Winterthur, Switzerland
cMath2Market GmbH, D-67657 Kaiserslautern, Germany
dDepartment of Physics, University of Fribourg, CH-1700 Fribourg, Switzerland
First published on 25th April 2023
Abstract
Performance and durability of solid oxide cell (SOC) electrodes are closely linked to their microstructure properties. Thus, the comprehensive characterization of 3D microstructures e.g., obtained by FIB-SEM tomography is essential for SOC electrode optimization. Recent advances and trends call for a standardized and automated microstructure characterization. Advances in FIB-SEM tomography enable the acquisition of more samples, which are also more frequently shared within the research community due to evolving open science concepts. In addition, the emerging methods for Digital Materials Design (DMD) enable to create numerous virtual but realistic microstructure variations using stochastic microstructure modeling. In this publication, a standardized microstructure characterization tool for SOC electrodes is presented, which is implemented as a Python app for the GeoDict software-package. A large number of microstructure characteristics can be determined with this app, which are relevant for the performance of conventional electrodes like Ni-YSZ and for more recent MIEC-based electrodes. The long list of 3D characteristics that can be determined selectively includes morphological characteristics, interface properties and effective transport properties deduced from morphological predictions and from numerical simulations. The extensive possibilities of the standardized microstructure characterization tool are illustrated for a dataset of three LSTN–CGO anode microstructures reconstructed with FIB-SEM tomography and for a dataset of three virtual sphere-packing structures. The automated microstructure characterization is a key element to exploit the full potential of open science, Digital Materials Design (DMD) and artificial intelligence (AI) for the data-driven optimization of SOC electrodes by providing standardized high quality microstructure property data.
1 Introduction
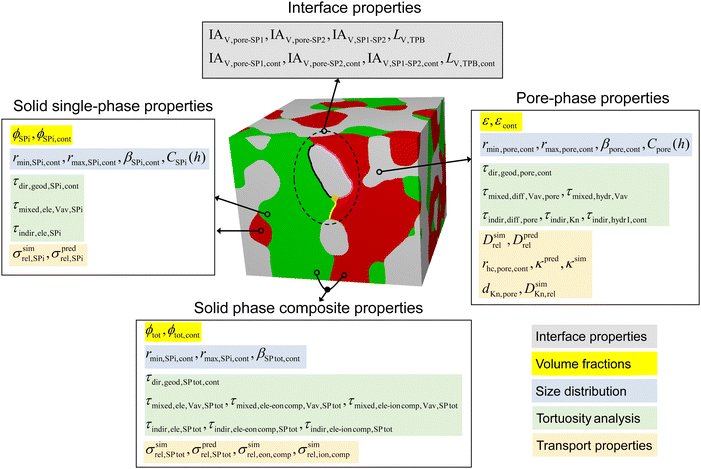
Solid oxide cell (SOC) technology is a promising solution for the efficient energy conversion. In the solid oxide fuel cell (SOFC) mode, renewable fuels or natural gas are used for decentral heat and power generation. Alternatively, in the solid oxide electrolysis cell (SOEC) mode, this technology provides an important option for conversion and storage of renewable energy (power-to-gas). The performance as well as the long-term stability of conventional and novel SOC electrodes are closely related to microstructure properties and associated effects. These effects are either influencing the transport efficiency or the electrochemical reaction kinetics. More specifically, the density of potential reaction sites (i.e., volume specific surface area and/or three-phase boundary (TPB) lengths) has a strong impact on the reaction kinetics, whereas the microstructure properties of the individual phases determine the effective transport properties for the corresponding species. Thereby, the pore structure is relevant for the transport of gas species, and the structure of the solid phases affects the transport of electrons and ions. In the electrode reaction mechanism, all processes including various transports and electrochemical reactions are coupled with each other. The impact of the microstructure on the electrode performance is thus a complex interplay of numerous characteristics and properties. Hence, a comprehensive microstructure analysis is a key element for the further development of the SOC technology. 3D microstructure analysis is able to provide a large number of quantitative measures that are used as a basis for microstructure optimization. For this purpose, three important relationships must be elaborated. In a first step, the results from 3D analysis are used to understand the impact of fabrication parameters (e.g., sintering temperature, powder fineness, viscosity of slurries) on the microstructure (e.g., porosity, solid volume fractions, composition, particle and pore sizes, tortuosity, constrictivity, TPB-length and surface areas). In a second step, 3D analysis also helps to make a link between these microstructure characteristics and the relevant electrode properties like the effective transport properties of gas/fuel in the pores and charge carriers in the solid phases. In a third step, it must be elaborated how the effective properties and density of reactive sites are affecting the performance of an electrode. This can be done either with experimental characterization (e.g., electrochemical impedance spectroscopy EIS). Alternatively, the electrode performance can be estimated based on a suitable multiphysics model for the coupled electrode reaction mechanism. For reliable performance predictions, the model requires as input all relevant microstructure information from 3D analysis, such as the effective transport properties and the density of reaction sites. Hence, the characteristics and properties from 3D microstructure analysis represent a central piece of information that enables to establish quantitative relationships with the initial fabrication parameters on one side and with the final electrode performance on the other side. For modern materials development in SOC technology, this microstructure information is crucial and inevitable.In this contribution, an image processing and simulation tool is presented, which provides a thorough, automated, and standardized characterization of SOC electrode microstructures in a very efficient way. This characterization tool is implemented as a Python app, which can be executed in the GeoDict1 software package. The current version of the app can be downloaded from Zenodo.2 In the near future, the characterization-app will also be integrated, as so-called GeoApp, in one of the next GeoDict releases. The characterization-app covers all relevant microstructure properties for the transport of gas species and charge carriers and interface properties for the reaction kinetics. The relative/effective properties for the gas and charge transport are determined in two ways: (a) using numerical transport simulations and (b) using predictions based on empirical equations that include morphological parameters (microstructure characteristics). The numerical simulations (a) provide a higher accuracy, while the morphological predictions (b) enable to determine the limiting effects of specific microstructure features (tortuosity, constrictivity etc.) on the transport properties. A graphical overview of the extensive microstructure properties that can be determined with the characterization-app is provided in Fig. 2. The characterization-app can be used for all kinds of SOC electrodes (SOFC and SOEC/anodes and cathodes), and it can also be adapted for microstructure characterization of other composite and porous media. Note that the terms anode and cathode are used in this paper referring to an SOFC. However, these terms can equally be associated with fuel electrodes and air electrodes including the applications for SOEC, even if it is not explicitly mentioned further on.
It must be emphasized that different microstructure properties are relevant for the electrode performance, depending on the underlying reaction mechanism, which in turn is controlled by electrode materials concept and the corresponding material properties. The two most frequent materials concepts for SOFC electrodes consist of (a) single-phase conductors like nickel–yttria-stabilized zirconia (Ni-YSZ) anodes and (b) mixed ionic electronic conductors, also known as MIECs as e.g., gadolinium doped ceria (CGO) based anodes or lanthanum strontium cobalt ferrite (LSCF) based cathodes. Because of the different reaction pathways, the impact of microstructure on the performance of these two electrodes is fundamentally different. The characterization-app allows to select specific settings in order to gain the relevant information according to the underlying materials concept.
Ni-YSZ represents the most common anode material system in SOFCs. The working principle of an SOFC with a Ni-YSZ anode operated with hydrogen is visualized in Fig. 1(a) and (b). Due to the single-phase conducting properties, electrons can only be transported in the Ni-phase and ions can only be transported in the YSZ-phase. If one of the solid phase networks suffers from loss of percolation and contiguity (e.g., due to Ni coarsening), charge transport will be hindered, which then leads to a significant drop in performance or even to failure. In addition, the electrochemical reaction (e.g., hydrogen oxidation reaction HOR) is bound to the three phase boundaries, which induces a specific microstructure limitation towards the electrochemical activity. Hence, to make reliable performance predictions for a Ni-YSZ anode (and for any other electrode with single-phase conductors) based on multiphysics simulation, the electrode model must capture the relevant microstructure limitations, which are affecting the single-phase transport properties (i.e., conduction of electrons in Ni and ions in YSZ, as well as gas diffusion in the pores) and the charge transfer at the TPB. As will be shown in this contribution, the options of the characterization tool can be chosen in such way that it captures automatically all relevant microstructure properties such as effective/relative properties of each phase and TPB-length. Furthermore, it also provides more detailed information (e.g., tortuosity, size distributions, constrictivity etc.) that is necessary for a targeted optimization of microstructures in SOC electrodes.
As an alternative anode concept, mixed ionic and electronic conductive (MIEC) materials are drawing much attention (Fig. 1(c)). In particular, perovskite-CGO composites represent an important material combination for SOFC anodes (e.g., ref. 3–6). In these MIEC-based anodes the Ni-phase is replaced by a perovskite with suitable electronic conductivity in order to get rid of the harmful degradation phenomena that are typically associated with Ni (e.g., ref. 6–12). In fact, a high robustness against carbon coking, sulphur poisoning and redox-cycling is reported for many perovskite- and CGO-based anodes.3 An obvious advantage of MIEC-based anodes is the fact that the fuel oxidation reaction can take place on the complete MIEC/pore interface (two phase boundaries), as illustrated in Fig. 1(c). Hence, the volume specific pore–CGO interface area is the relevant microstructure property for the reaction kinetics (in contrast to the TPB-lengths, which is relevant for Ni-YSZ anodes and similar material concepts). In composite MIEC electrodes, also the microstructure limitations for charge transport in the solid phases are fundamentally different, compared to electrodes that are consisting of single-phase conductors. For example, in our MIEC-electrode example in Fig. 1(c), CGO is combined with a perovskite material (e.g., lanthanum-doped strontium titanate (LST)) with superior electronic conductivity and lesser ionic conductivity (compared to CGO). Thereby, the transports of neither the electrons nor the oxygen ions are limited to a single phase due to the MIEC-property of both solid-phases. As a consequence, composite MIEC electrodes reveal a remarkable property that can be described as composite conductivity (for electrons as well as for ions). Each of the charge carriers (either electrons or ions) is transported in both solid phases. The composite conductivity is much higher than the (hypothetical) single-phase conductivities of the same microstructure because harmful microstructure limitations in one of the solid phases will be (at least partially) compensated by the complementary solid phase. For example, dead ends or islands in the perovskite phase are bridged and connected via the co-existing CGO-phase. Overall, the relevant microstructure properties that control the performance of MIEC based electrodes are the active surface area (e.g., pore–CGO interface) and the effective composite conductivities of the total solid phases (CGO and perovskite together). The characterization-app can be configured in such way, that the automated analysis provides all relevant properties of MIEC based electrodes. Furthermore, if CGO (MIEC) is combined with a single-phase electronic conductor, which is e.g., the case for Ni–CGO electrodes, the single-phase conductivity of CGO is relevant for the transport of ions and the composite conductivity of the combined solid-phase (Ni and CGO) is relevant for the transport of electrons. For such cases the app can also be configured so that the relevant properties of composite electrodes (consisting of a MIEC-phase and a single-phase conductor) are determined automatically.
It must be emphasized that there are also other software packages available, which are suitable for the characterization of SOC microstructures. An extensive list of suitable software packages is presented by Holzer et al.13 A prominent example is TauFactor from Imperial College London (Cooper et al.14), which is a Matlab code for voxel-based simulations of diffusive transport using the finite difference method. Furthermore, TauFactor is also capable to compute various other microstructure characteristics such as porosity, surface area and three-phase boundary (TPB) length. Another example is the Bruggemann estimator, which is a Mathematica code developed at ETH Zurich (Ebner and Wood15). It uses two orthogonal 2D images as an input to predict the Bruggeman exponent (α) in the Bruggemann relation (τ = εα) to estimate the indirect tortuosity. It is designed for the characterization of granular materials, especially battery electrodes. Several Fiji plugins are available for the determination of various microstructure characteristics such as geometric tortuosity, cPSD, MIP-PSD and constrictivity.13 Moreover, numerous additional software packages are available for qualitative image processing and visualization,13 where some of them are embedded within a larger commercial software package (e.g., Avizo). Thus, many different software packages for 3D microstructure characterization are nowadays available. The advantages of our characterization-app are the following:
(A) The app provides a thorough characterization that includes all microstructure characteristics and effective properties, which are relevant for the performance of SOC electrodes. None of the competing software packages provides similar extensive characterization options.
(B) The app has a modular architecture, so that the 3D analysis can be configured for specific materials concepts (e.g., single phase conductors or MIECs) and for specific purposes. None of the other software packages provides such SOC specific options.
(C) The app can be operated on a local PC or in the cloud. Based on Massive Simultaneous Cloud Computing (MSCC), the app enables highly efficient characterization of up to thousands of 3D structures in parallel. Executing the app in the cloud, e.g., in the GeoDict Cloud offered by Math2Market GmbH, is thus of particular interest in context with large datasets from stochastic geometry modeling, as is the case for Digital Materials Design (see also ESI,† Section A).
(D) All the characteristics and properties that can be determined with the app have been described thoroughly in a recent textbook by Holzer et al.13 Thereby, also the quantitative relationships between the microstructure characteristics and the effective transport properties are well established and documented in a series of papers.16–22 In this sense, our characterization-app provides reliable information that may serve as a standard, e.g., when comparing results from different studies that have been determined with different methodologies.
The motivation to present a tool for standardized, automated, versatile and efficient characterization of SOC electrodes is multifold. Most importantly, recent advances and trends in tomography and stochastic microstructure modeling lead to an ever-increasing amount of 3D microstructure data, which calls for a standardized and automated microstructure characterization. Advances in FIB-SEM tomography and micro-CT enable the acquisition of more samples in shorter time. Moreover, open science concepts, which are pushed by federal funding agencies, will result in a tremendous increase of publicly available 3D-microstructure data of energy materials. In order to make reasonable comparisons of these 3D-microstructures from different sources and to make reliable statistical analyses, these structures need to be analysed with standardized 3D image processing tools. Furthermore, the emerging methods for Digital Materials Design (DMD) enable to create numerous virtual but realistic microstructure scenarios of SOC electrodes using stochastic microstructure modeling and to test them with multiphysics electrode simulations. For such a DMD workflow, many virtual microstructures need to be characterized. Thus, the availability of a standardized, efficient and automated microstructure characterization tool is a crucial prerequisite for such data-driven optimizations of energy materials. The overall goal of this DMD workflow is to establish a quantitative relationship between fabrication parameters and cell performance, in order to accelerate the microstructure optimization in a systematic and knowledge-based way with digital feedback loops. The accuracy of the performance prediction with an electrode model and the quality of the final design guidelines from the DMD-loop heavily depend on the quality, reliability and precision of the automated 3D characterization. In this sense, the characterization-app represents a key element for such data driven materials design approaches. An overview of such a DMD workflow is presented in the ESI,† Section A.
This paper is structured as follows. In the methods and materials Section 2 a detailed description of the characterization-app is provided. For this purpose, all microstructure characteristics and all effective properties that can be determined with the app are briefly explained. Subsequently, the graphical user interface is illustrated and the settings for the characterization are discussed. In the results Section 3, the enormous potential of the characterization-app is illustrated, based on two datasets of SOFC electrodes. The first dataset contains three real microstructures of lanthanum and nickel co-doped strontium titanate (LSTN) – CGO anodes, illustrating the properties of a composite electrode with two MIEC-phases. The second dataset consists of three virtual structures generated with a sphere-packing algorithm, which allow for an extended discussion of microstructure effects as e.g., a percolation loss of one solid-phase. The different microstructure effects associated with the different anode types (see Fig. 1(b) and (c)) are discussed, based on the quantitative results from our characterization-app.
2 Methods and materials
2.1 Overview of microstructure characteristics and effective properties relevant for SOC electrode performance
The standardized characterization tool that is presented in this contribution enables a thorough description of SOC electrodes based on 3D-image data. In total, up to 90 different parameters can then be determined with our characterization-app in a fully automated and standardized procedure. It makes use of numerous algorithms and solvers that are implemented in various modules of GeoDict (a list of the GeoDict modules used for the different microstructure analyses is reported in Table 1 of the ESI,† Section B.2). The required input to run the characterization-app is a 3D voxel representation of the electrode microstructure, where the different phases are marked with a specific label (e.g., segmented image data from FIB-SEM tomography). In Fig. 2, an overview of the characterized microstructure properties is presented. The analyses will be done separately for the two solid-phases SP1 and SP2, for the total composite solid-phase (SP tot), for the pore-phase and for the interface properties between these solid and pore phases. The definitions of used variables and associated nomenclature of properties are explained in the following sections. The colour code in the text boxes of Fig. 2 indicates different property-classes, which are the interface properties (grey), volume fractions (ϕ, total and contiguous, yellow), size distributions (blue), where also the constrictivity (β) is deduced from, different types of tortuosity analyses (τ, direct geometric, mixed and indirect physics based, green) and relative properties associated with the transport of ions, electrons and gas species (i.e., conductivity (σ), diffusivity (D, bulk and Knudsen), permeability (κ), orange). The relative transport properties (also known as M-factors or microstructure-factors) describe the ratio of an effective property (e.g., effective electric conductivity of a porous material) over the intrinsic property (e.g., intrinsic conductivity of a pure, non-porous Ni sample). The M-factor is thus entirely related to microstructure, and it describes its limiting effects towards transport. The M-factors can be determined with two different approaches, which are indicated either with the superscript “pred”, for predictions based on morphological characteristics, or with the superscript “sim”, for numerical transport simulations.| Description | Variable | Parameter |
|---|---|---|
| Porosity | ε | Epsilon |
| Porosity, contiguous portion | ε cont | Epsilon_cont |
| Porosity, discontiguous portion (i.e., trapped pores) | ε discont | — |
| Solid volume fraction SP1 | ϕ SP1 | SVF_SP1 |
| Solid volume fraction SP1, contiguous portion | ϕ SP1,cont | SVF_SP1_cont |
| Solid volume fraction SP1, discontiguous portion | ϕ SP1,discount | — |
| Solid volume fraction SP2 | ϕ SP2 | SVF_SP2 |
| Solid volume fraction SP2, contiguous portion | ϕ SP2,cont | SVF_SP2_cont |
| Solid volume fraction SP2, discontiguous portion | ϕ SP2,discont | — |
| Total solid volume fraction SP tot (i.e., SP1 + SP2) | ϕ tot | SVF_tot |
| Total solid volume fraction SP tot, contiguous portion | ϕ tot,cont | SVF_tot_cont |
| Total solid volume fraction SP tot, discontiguous portion | ϕ tot,discont | — |
Commonly, three-phase material systems (two solid-phases and a pore-phase) are used for SOC electrodes and their microstructure characterization will be described in detail in the following Sections 2.2 and 2.3. However, MIEC electrodes can also consist of only one solid phase. Moreover, current collector layers often consist of only one porous material. Such two-phase structures (i.e., one pore- and one solid-phase) can also be analysed with our characterization-app by choosing the appropriate option. Section C in the ESI† provides a detailed description, how this characterization tool can be used for the characterization of such two-phase structures (including the corresponding nomenclature).
2.2 Microstructure characteristics based on 3D image analysis
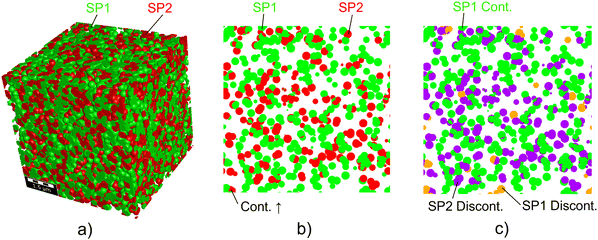
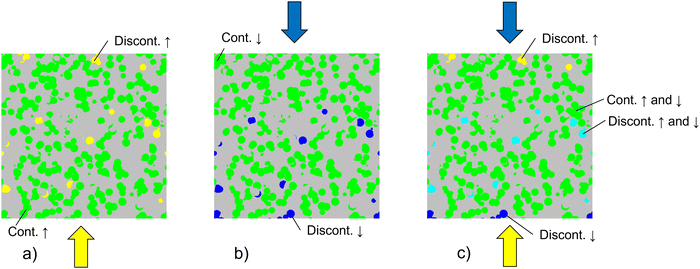
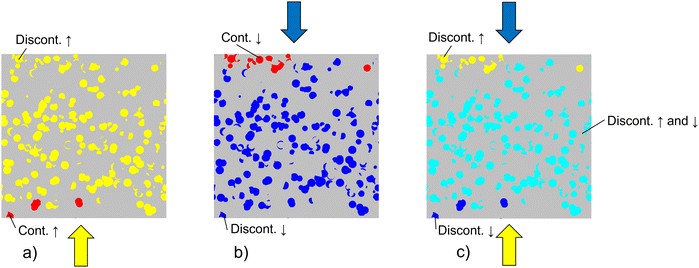
With this procedure, the boundary effect at the inlet plane is minimized. It must be realized that the obviously increased connectivity close to the inlet plane leads to an enhanced effective conductivity compared to the bulk materials, which is called short-range effect. With our contiguity analysis, the short-range effects are eliminated, which are the right conditions for the current study aiming to describe the properties of a representative elementary volume. However, it must be emphasized that the short-range effect is always present in real electrodes and is only negligible, if the width over which the short-range effect takes place (i.e., increased contiguity and conductivity close to the inlet plane) is considerably smaller than the electrode thickness or if it is smaller than the penetration depth of the reaction (i.e., width of active electrode), respectively.
| Description | Variable | Parameter | Unit |
|---|---|---|---|
| Volume specific interface area pore–SP1 | IA V,pore–SP1 | IA_V_pore–SP1 | μm−1 |
| Volume specific interface area pore–SP1, contiguous | IA V,pore–SP1,cont | IA_V_pore–SP1_cont | μm−1 |
| Volume specific interface area pore–SP1, discontiguous | IA V,pore–SP1,discont | — | μm−1 |
| Volume specific interface area pore–SP2 | IA V,pore–SP2 | IA_V_pore–SP2 | μm−1 |
| Volume specific interface area pore–SP2, contiguous | IA V,pore–SP2,cont | IA_V_pore–SP2_cont | μm−1 |
| Volume specific interface area pore–SP2, discontiguous | IA V,pore–SP2,discont | — | μm−1 |
| Volume specific surface area of pores | S V,pore | S_V_pore | μm−1 |
| Volume specific surface area of pores, contiguous | S V,pore,cont | S_V_pore_cont | μm−1 |
| Volume specific surface area of pores, discontiguous (trapped pores) | S V,pore,discount | — | μm−1 |
| Volume specific interface area SP1–SP2 | IA V,SP1–SP2 | IA_V_SP1–SP2 | μm−1 |
| Volume specific interface area SP1–SP2, contiguous | IA V,SP1–SP2,cont | IA_V_SP1–SP2_cont | μm−1 |
| Volume specific interface area SP1–SP2, discontiguous | IA V,SP1–SP2,discont | — | μm−1 |
| Volume specific three-phase boundary (TPB) length | L V,TPB | L_TPB_V | μm−2 |
| Volume specific three-phase boundary (TPB) length, contiguous (active TPB) | L V,TPB,cont | L_TPB_V_cont | μm−2 |
| Volume specific three-phase boundary (TPB) length, discontiguous | L V,TPB,discont | — | μm−2 |
| Description | Variable | Parameter |
|---|---|---|
| Mean radius of bulges of the contiguous SP1 | r max,SP1,cont | r_max_SP1_cont |
| Mean radius of bulges of the contiguous SP2 | r max,SP2,cont | r_max_SP2_cont |
| Mean radius of bulges of the contiguous SP tot | r max,SPtot,cont | r_max_SP_tot_cont |
| Mean radius of bulges of the contiguous pore-phase | r max,pore,cont | r_max_pore_cont |
| Description | Variable | Parameter |
|---|---|---|
| Mean radius of bottlenecks of the contiguous SP1 | r min,SP1,cont | r_min_SP1_cont |
| Mean radius of bottlenecks of the contiguous SP2 | r min,SP2,cont | r_min_SP2_cont |
| Mean radius of bottlenecks of the contiguous SP tot | r min,SPtot,cont | r_min_SP_tot_cont |
| Mean radius of bottlenecks of the contiguous pore-phase | r min,pore,cont | r_min_pore_cont |
 | (1) |
| CX(h) = P(z∈X,z + h∈X) for z ∈ Ω | (6) |
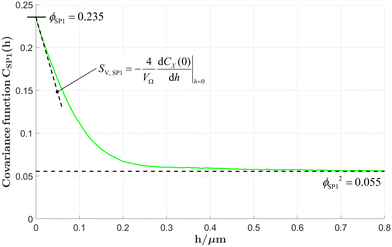
• The y-axis intercept corresponds to the phase volume fraction ϕX:
| ϕX = CX(0) | (7) |
• The slope of the covariance function at the y-axis intercept is directly related to the phase specific surface area SX (i.e., the sum of volume specific interface areas of the phase X with respect to all other phases).
 | (8) |
• The covariance function tends to an asymptotic value which is equal to the square of the phase volume fraction:
 | (9) |
• The correlation length lcorr of the covariance function provides a measure for the spatial distribution and thus the characteristic phase size. Moreover, the correlation length is also a fundamental parameter for the virtual reconstruction e.g., based on Gaussian random fields. In this contribution, two different approaches to estimate the correlation length are provided, as described in the ESI,† Section D.
 ). In this way, the indirect tortuosity can be considered as a fit factor that includes all microstructure effects, except for the volume fraction effect. The type of definition can be either geometric or physics based. Geometric means that the effective pathlengths are measured based on a morphological analysis using image processing. It provides a statistic of pathlengths from which the mean value can be determined. Physics based definition means that the corresponding tortuosity is considering the influence of the transport process. It provides results that are specific for either conduction (electric, ionic, thermal), diffusion or flow (hydraulic). Based on the combination of these two classification criteria (method of determination and type of definition), three main tortuosity classes can be distinguished: (A) direct geometric, (B) mixed, (C) indirect physics-based.
Tortuosity types belonging to class A (i.e., τdir,geometric) provide a purely geometric measure for the pathlengths and it is strictly depending only on the microstructure. Direct geometric tortuosities do not consider the influence of the involved transport process. A representative of this type is the geodesic tortuosity τdir,geod, which is determined with our GeoDict script by analysis of the contiguous portion of the transporting phase of interest. The geodesic tortuosity is a very important parameter, which gives reliable information on the pathlengths (see e.g., Lantuéjoul et al.,29 Gommes et al.30 and Stenzel et al.21). It was thus used as a basis for the elaboration of empirical micro–macro relationships and for prediction of the M-factor, as reported in Section 2.3.1. It must be noted that direct geometric tortuosities are only well-defined for a single-phase description (i.e., a pore-phase or a single solid-phase). The applicability and meaning of geometric tortuosities are limited in context with composite conductivity, where transport pathways cross the boundary of adjacent solid phases with different intrinsic conductivities. The corresponding variables are summarized in Table 6.
| Description | Variable | Parameter |
|---|---|---|
| Geodesic tortuosity of the contiguous SP1 | τ dir,geod,SP1,cont | Tau_dir_geodesic_SP1_cont |
| Geodesic tortuosity of the contiguous SP2 | τ dir,geod,SP2,cont | Tau_dir_geodesic_SP2_cont |
| Geodesic tortuosity of the contiguous SP tot | τ dir,geod,SPtot,cont | Tau_dir_geodesic_SP_tot_cont |
| Geodesic tortuosity of the contiguous pore-phase | τ dir,geod,pore,cont | Tau_dir_geodesic_pore_cont |
For tortuosity types belonging to class B, the method of determination is mixed (i.e., the simulations are performed directly on the 3D voxel data, but the actual pathlengths analysis is not done directly from the segmented 3D structure, but it is based on the analysis of volume fields from the transport simulation). Also the type of definition is mixed. It is based on a geometric analysis (e.g., of simulated flow fields) and at the same time, it is also physics-based, since it captures the specific influence of the simulated transport processes. An important representative of this class is the volume averaged tortuosity τmixed,phys,Vav, which basically integrates the local flow vectors over the entire flow field. The volume averaged tortuosity can be determined using the tortuosity-app of GeoDict. Thereby, mixed volume averaged tortuosities are distinguished according to the underlying transport process, which is either (electrical or ionic) charge transport by conduction τmixed,ele,Vav, diffusion τmixed,diff,Vav or gas-flow τmixed,hydr,Vav. Note that the mixed volume averaged tortuosity is also well-defined for the case of composite conductivity since the flux fields resulting from transport simulation in both solid phases (and across the phase boundary) can be used as a basis for its computation. The volume averaged tortuosity is thus a suitable descriptor for related effects in composite MIEC electrodes. The corresponding variables are summarized in Table 7. More detailed information on volume averaged tortuosity is given by Koponen31 as well as Matyka and Koza.32
| Description | Variable | Parameter |
|---|---|---|
| Volume averaged tortuosity from current density field, SP1 | τ mixed,ele,Vav,SP1 | Tau_mixed_ele_Vav_Case1 |
| Volume averaged tortuosity from current density field, SP2 | τ mixed,ele,Vav,SP2 | Tau_mixed_ele_Vav_Case2 |
| Volume averaged tortuosity from current density field, SP tot | τ mixed,ele,Vav,SPtot | Tau_mixed_ele_Vav_Case3 |
| Volume averaged tortuosity from electronic current density field, SP tot | τ mixed,eoncomp,Vav,SPtot | Tau_mixed_ele_Vav_Case4 |
| Volume averaged tortuosity from ionic current density field, SP tot | τ mixed,ioncomp,Vav,SPtot | Tau_mixed_ele_Vav_Case5 |
| Volume averaged tortuosity from diffusion-flux field, pore-phase | τ mixed,diff,Vav,pore | Tau_mixed_diff_Vav |
| Volume averaged tortuosity from flow-field, pore-phase | τ mixed,hydr,Vav | Tau_mixed_hydr_Vav |
For tortuosity types belonging to class C, the method of determination is indirect (i.e., no path-length measurement from the 3D structure, but instead indirect calculation from effective properties) and the type of definition is physics-based (i.e., characteristic for a specific transport process). The corresponding variables are reported in Table 8. Thereby, tortuosity types are distinguished according to the physics of the corresponding transport process, which is either charge transport by conduction τindir,ele, bulk diffusion τindir,diff, Knudsen diffusion τindir,Kn or gas-flow τindir,hydrI/τindir,hydrII. Note that the indirect physics-based tortuosity is also well-defined for the case of composite conductivity. However, the indirect electronic composite conduction tortuosity τindir,eoncomp,SPtot and the indirect ionic composite conduction tortuosity τindir,ioncomp,SPtot of the total solid phase SP tot are only well defined for a specific intrinsic conductivity ratio λ of the two solid phases. The indirect single-phase conduction tortuosity τindir,ele,SPtot of the total solid phase corresponds to the special case where the two intrinsic conductivities of SP1 and SP2 are equal. Thus, the two solid phases can be merged for the analysis and the result is independent of the value of the intrinsic conductivity.
| Description | Variable | Parameter |
|---|---|---|
| Indirect single-phase conduction tortuosity, SP1 | τ indir,ele,SP1 | Tau_indir_ele_Case1 |
| Indirect single-phase conduction tortuosity, SP2 | τ indir,ele,SP2 | Tau_indir_ele_Case2 |
| Indirect single-phase conduction tortuosity, SP tot | τ indir,ele,SPtot | Tau_indir_ele_Case3 |
| Indirect electronic composite conduction tortuosity, SP tot | τ indir,eoncomp,SPtot | Tau_indir_ele_Case4 |
| Indirect ionic composite conduction tortuosity, SP tot | τ indir,ioncomp,SPtot | Tau_indir_ele_Case5 |
| Indirect diffusive tortuosity, pore-phase | τ indir,diff,pore | Tau_indir_diff |
| Indirect hydraulic tortuosity I, pore-phase | τ indir,hydrI,cont | Tau_indir_hydr_I_cont |
| Indirect hydraulic tortuosity II, pore-phase | τ indir,hydrII,cont | Tau_indir_hydr_II_cont |
| Knudsen tortuosity X-direction, pore-phase | τ indir,Kn,X | Tau_indir_Kn_X |
| Knudsen tortuosity Y-direction, pore-phase | τ indir,Kn,Y | Tau_indir_Kn_Y |
| Knudsen tortuosity Z-direction, pore-phase | τ indir,Kn,Z | Tau_indir_Kn_Z |
2.3 Effective and relative transport properties
| Deff = Drel·Dbulk | (10) |
| σeff = σrel·σbulk | (11) |
| M = σrel = Drel | (12) |
The M-factor can be determined based on 3D voxel data in two ways: (a) either using direct numerical simulation on the voxel grid, or (b) via morphological analysis using methods of image processing. These two approaches are related to two main goals of the microstructure characterization: (a) the accurate determination of the effective transport properties e.g., as an input for continuum multiphysics models, where the pores and solid-phases are not spatially resolved and (b) to achieve a thorough understanding about the effect of microstructure features on the transport properties and the relation between the fabrication parameters, microstructure characteristics and effective transport properties.
In (a), the M-factor is interpreted as a relative property (e.g., Drel = Msim = Deff/Dbulk), which is indirectly derived from the knowledge of effective and intrinsic properties. It is important to note that the M-factor describes the characteristics of the transporting phase (e.g., gas diffusion in the pores or electrical conduction in the solid-phase). In this work, the effective properties are determined by means of numerical transport simulations on the 3D geometry of the microstructure represented by a voxel grid using GeoDict1 software. The Laplace equation is solved to determine the effective diffusivity (using the DiffuDict-module) or conductivity (using the ConduDict-module) and therewith the M-factors of the corresponding phases. In Table 9, the variables used in context with transport simulations and associated properties of the different phases are listed. Note that the parameters used in the characterization-app containing ‘eff’ are a result of the fact that the effective properties are calculated in GeoDict. However, the effective conductivity corresponds to the value of the relative conductivity for the case that the intrinsic conductivity σbulk is 1 S m−1. The same characterization approach based on numerical transport simulation can also be performed for the combined solid-phase SP tot = SP1 + SP2 to obtain the M-factor σsimrel,SPtot for the total solid phase. This scenario corresponds to the case of two solid-phases with the same intrinsic conductivity for a specific charge carrier (i.e., electrons or ions). The relative property of the total solid-phase is an important reference case in context with the composite conductivity of MIEC electrodes, as discussed below (in Section 2.3.2).
| Description | Variable | Parameter |
|---|---|---|
| Relative gas diffusivity simulated | D simrel | D_rel_sim |
| Relative single-phase conductivity SP1 simulated | σ simrel,SP1 | sigma_eff_Case1 |
| Relative single-phase conductivity SP2 simulated | σ simrel,SP2 | sigma_eff_Case2 |
| Relative single-phase conductivity SP tot simulated | σ simrel,SPtot | sigma_eff_Case3 |
In (b), the M-factor is interpreted as a correction factor, which describes the limiting effects of microstructure, and which is directly obtained from microstructure characteristics. These so-called predicted M-factors for gas diffusion, as well as for conduction and diffusion of the charge carriers are determined via morphological analysis of the 3D microstructure data. Therewith, additional insight about the contribution of different microstructure effects on the transport properties can be achieved. The methodologies for prediction of the M-factor have been developed and applied in previous publications by Holzer et al.,18,33,34 Gaiselmann et al.,17 Pecho et al.,35 Neumann et al.19,36 and Stenzel et al.22 Thereby, the M-factor includes the following microstructure effects: volume fraction of the transporting phase ϕph (i.e., the volume fraction effect), tortuosity τ (i.e., path length effect) and the constrictivity β (i.e., bottleneck effect). A virtual materials testing (VMT) approach was applied in order to determine the M-factor empirically.17,21,22 Thereby a large number (>8000) of virtual 3D microstructures were created with a stochastic model. These structures cover a large range of values for ϕph, β and τ. For each 3D structure, the effective diffusivity Deff was determined by numerical simulation with GeoDict1 software. The following two versions of expression were then found by statistical error minimization:
 | (21) |
 | (22) |
Eqn (21) provides the best prediction concerning the whole phase fraction range.13 However, eqn (22) is consistent with theoretical results in the dilute limit and thus provides better predictions for high phase volume fractions that are characterized by an M > 0.7. However, eqn (22) should not be used for low phase volume fractions with M < 0.05, where the predictions are considerably worse compared to eqn (21). These equations for MpredI and MpredII used in (b) were validated for different porous materials by comparison with either results from simulation (Msim used in (a)) or from experiments (Mexp). Gaiselmann17 and Stenzel22 showed that the eqn (21) provides good results for all three phases in SOFC cermet electrodes. Furthermore, validations for these equations were also performed successfully by Holzer et al. for very different types of porous microstructures, such as sintered ceramic membranes,18 fibrous GDL in PEM fuel cell37 and even open cellular materials (Holzer, unpublished data). These successful validations confirm that the equations for Mpred have a global meaning, in the sense that they are capable to predict effective transport properties for all kinds of microstructures based on only three characteristics (ϕph, β, τ). It must be emphasized that the M-factor is always determined for a specific transporting phase (e.g., MSP1) and associated microstructure characteristics (e.g., tortuosity of SP1). The M-factor is then an equivalent for the corresponding relative transport property of that phase (e.g., MSP1 = σrel,SP1). The M-factor expressions for the relative conductivity and diffusivity of the different phases in composite SOC electrodes are summarized in Table 10. The M-factors and underlying characteristics are always determined using the contiguous portion of the phases, which is introduced in Section 2.2.1. The geodesic tortuosity is used in these empirical expressions for prediction, which is presented in Section 2.2.7. The characterization is also performed for the combined solid-phase SP tot = SP1 + SP2 in eqn (15) as a reference case.
In order to be able to provide a measure similar to the M-factor (or relative conductivity) for single solid-phase systems, a relative ionic composite conductivity σrel,ion,comp and a relative electronic composite conductivity σrel,eon,comp is defined in eqn (25) and (26), respectively. These definitions are valid for a composite with two MIEC solid-phases, where the first phase SP1 owns a high ionic conductivity and the second phase SP2 a high electronic conductivity compared to the complementary phase.
| σeff,ion,comp = σrel,ion,compσ0,ion,SP1 | (25) |
| σeff,eon,comp = σrel,eon,compσ0,eon,SP2 | (26) |
2.3.3.1 Gas permeability. The gas transport within the pores of an SOC electrode is governed by diffusion. However, for fine porous microstructures with pores in the range of sub-microns, the transport can no longer solely be described by ordinary bulk diffusion, since it is additionally affected by Knudsen diffusion. The latter describes scattering events of gas molecules at the pore walls. Fine porous microstructures are relevant for electrode optimization because of their potentially high electrochemically activity associated with their high volume specific surface area or TPB-length. To capture the Knudsen effects in fine structured electrodes, the well-known dusty-gas model (DGM) is often used to describe the combined transport mechanism by bulk and Knudsen diffusion appropriately.39–42 An implementation and further description of the dusty-gas model can be found in a previous publication by Marmet et al.43 For the parametrization of the dusty-gas model, four microstructure properties are needed: the relative bulk diffusivity Drel introduced in Section 2.3.1, the relative Knudsen diffusivity Dsimrel,Kn, the characteristic Knudsen length dKn,pore and the gas permeability κ.
The gas flow permeability κ is again determined in two ways:
(a) κsim is determined by a flow simulation on the voxel grid using the Stokes (LIR) solver of the FlowDict module within the GeoDict software package.1 A sensitivity analysis showed that an in- and outflow region of about 20% of the structure size in simulation direction is a good trade-off between computation time and independence of the boundary conditions.
(b) κpred is determined based on empirical expressions that describe the relationship between permeability and the relevant microstructure characteristics. The latter are obtained with morphological analysis (image processing) of the contiguous portion from the pore-phase. Regarding the empirical expressions for κpred, two versions have been presented by Holzer et al.18 and Neumann et al.,19 which are reported as κpredI and κpredII in Table 12. For prediction of κpredI, the hydraulic radius (rhcI,pore) is defined using the ratio of porosity over pore surface area (eqn (27)) and a dimensionless expression similar to the M-factor, including ε, β and τ with fitted exponents for viscous flow (eqn (29)). For the prediction of κpredII, the hydraulic radius (rhcII,pore) is defined based on the mean radii of bottlenecks rmin and bulges rmax (eqn (28)). This definition of the hydraulic radius strongly emphasizes the importance of bottlenecks rmin. In the fitting procedure, the resulting exponent of β is always close to zero. Obviously, with this definition of hydraulic radius (eqn (28)) the constrictivity-effect is already captured in rhcII,pore and therewith the dimensionless expression for prediction of κpredII includes only ε and τ with fitted exponents (eqn (30)). The corresponding variables and expressions are summarized in Table 12.
2.3.3.2 Knudsen diffusion in the pore-phase. The Knudsen diffusion can be described with two microstructure properties: the relative Knudsen diffusivity Dsimrel,Kn, which is equivalent to the M-factor for bulk diffusion (in the pores), and the characteristic pore diameter dKn,pore, which is necessary to capture the size dependencey of more frequent scattering events with the pore-walls as the pore structure gets finer. Both parameters are determined with a random walk algorithm of the DiffuDict module of GeoDict.1 A detailed discussion of the Knudsen diffusion in SOFC electrodes can be found in a previous publication by Marmet et al.43 The variables and parameters for the Knudsen diffusion are summarized in Table 13. Note that the used random walk algorithm provides the Knudsen diffusivity in all directions automatically. For microstructures, which are known to be isotropic (e.g., virtual structures), the mean value DsimKn,rel,meanXYZ of the three reported Knudsen diffusivities can be used to obtain a better statistical basis.
| Description | Expression | Parameter | Unit |
|---|---|---|---|
| Knudsen characteristic length/pore-diameter | d Kn,pore | KnudsenCharacteristic-Length | μm |
| Knudsen relative diffusivity simulated in X-direction | D simKn,rel,X | D_Kn_rel_sim_X | — |
| Knudsen relative diffusivity simulated in Y-direction | D simKn,rel,Y | D_Kn_rel_sim_Y | — |
| Knudsen relative diffusivity simulated in Z-direction | D simKn,rel,Z | D_Kn_rel_sim_Z | — |
| Knudsen relative diffusivity simulated mean XYZ-direction | D simKn,rel,meanXYZ | — | — |
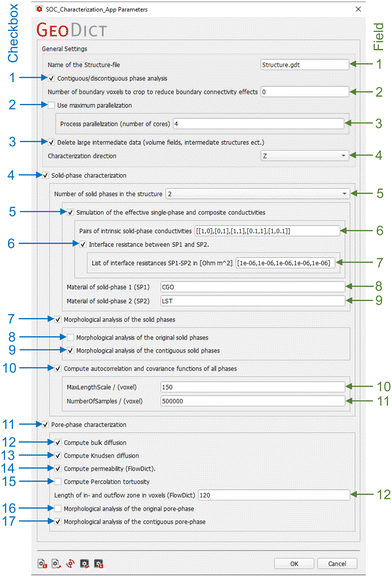
2.4 Characterization-app for SOC microstructure characterization in GeoDict: description of user interface and associated options
Standardized and automated characterization is achieved with a Python app, which can be executed in the GeoDict software package. A list of the GeoDict modules used for the different microstructure analyses is reported in Table 1 of the ESI,† Section B.2. The current version of the SOC characterization-app is published on Zenodo2 and can be used in the GeoDict release 2022. However, it is planned that an adapted version of this SOC characterization-app will soon be included in the GeoDict distribution. The graphical user interface (GUI) of this app is shown in Fig. 8. The app configures and runs numerous standard GeoDict algorithms that are necessary for a thorough characterization of SOC electrodes. Fig. 8 also shows typical settings and characteristic field values, which are suggested to be used as a standard for a full characterization of a composite SOC electrode. However, some parameters in the characterization-app settings depend on the structure type, structure size and the used material system, and therefore these settings must be adapted carefully by the user. Furthermore, custom studies focusing on specific microstructure aspects can easily be performed by activating only those characterization-app options that are needed for these specific characterizations. For example, the entire solid-phase characterizations can be disabled for those cases where only the gas transport properties are of interest. The settings and parameters for the configuration of the app are described in the following sections.Checkbox 5 enables the numerical computation of conductivities in the solid phases using the ConductoDict module. In field 6, a list of conductivity pairs of the two solid phases must be provided. The values of the intrinsic conductivities (σ0) need to be normalized so that the larger value is equal to one. For each pair, the first value represents the conductivity that is attributed to SP1 (i.e., the phase with higher intrinsic ionic conductivity), and the second value is attributed to SP2 (i.e., the phase with higher intrinsic electronic conductivity). For electrodes that are composed of materials with single-phase conductivities, the value pairs are always 0 and 1, or vice versa. If e.g., a Ni-YSZ structure is used, the needed conductivity pairs would be [[1,0],[0,1]], where the first pair initiates computation of the ionic conductivity, and the second pair the electronic conductivity (if YSZ is chosen as material for SP1 and Ni for SP2). More precisely, YSZ (SP1) conducts only oxygen ions and Ni (SP2) is an ionic insulator (i.e., ionic conductivity takes place only in SP1 [1,0]). In analogy, YSZ is an electrical insulator, and Ni is an electronic conductor (i.e., electronic conductivity takes place only in SP2 [0,1]). Since the intrinsic conductivity is set to one (σ0 = 1 S m−1), the estimated effective conductivity resulting from the transport simulation will be identical with the relative conductivity (i.e., σrel = σeff/σ0, where σ0 = 1 S m−1). For electrodes that are composed of MIEC materials, the value pairs are 1 and 1 > x > 0, or vice versa. For example, in an LST-CGO anode that consists of two MIEC phases, the normalized value pairs [[0.1,1],[1,0.1]] can be specified as a realistic estimation of the intrinsic conductivity ratios. The app will then compute the composite conductivities, by simulating simultaneous transport of a given species in both phases. In our example, [1,0.1] means that SP1 (CGO) has ten times higher intrinsic ionic conductivity than SP2 (LST) and [0.1,1] means that SP2 (LST) has ten times higher intrinsic electronic conductivity than SP1 (CGO). Since the simulations with ConductoDict are rather efficient, we suggest to determine the single-phase conductivities (i.e., [1,0],[0,1],[1,1]) also for composite MIEC electrodes. The comparison of these results provides a valuable indication of the potential contribution of each individual phase, and it leads to a better understanding of special microstructure effects in composite MIEC electrodes. Moreover, the single-phase conductivities are also the basis to determine composite conductivities with arbitrary conductivity ratios using a semi-analytical approach, as will be presented in a separate publication in this series. Thus, the entry for field 6 for the example of LST-CGO yields: [[1,0],[0,1],[1,1],[0.1,1],[1,0.1]], which is also the standard entry for this field. Note that the first three value pairs lead to calculation of single-phase conductivities, which are identical with cases 1 to 3 in Table 9, and the last two value pairs lead to calculation of composite conductivities that are identical with cases 4 and 5 in Table 11. Of course, the standard entries in field 6 can be adapted to fit the properties of specific materials.
With checkbox 6, an electrical interface resistance for charge transfer between the two solid phases can be enabled (otherwise the resistance is selected to be zero). In field 7, the area specific interface resistance needs to be specified for each conductivity pair defined in field 6. In fields 8 and 9, the names of the materials can be provided.
Checkbox 7 enables a thorough morphological analysis of all relevant microstructure characteristics, as described in Section 2.2. This option provides morphological properties for SP1, SP2 and total solid-phase (i.e., SP1 + SP2), separately. It results in an extensive list of characteristics, which includes phase volume fractions, mean sizes of bulges and bottlenecks (rmin, rmax), constrictivity (β) and various tortuosity types (τdir,geod, τindir,ele, τmixed,ele,Vav), as well as interface areas and TPB-lengths. With checkbox 8 activated, the morphological analysis is performed on the original segmented structure (including discontiguous structure features). With checkbox 9 activated, the morphological analysis is performed only for the contiguous phase fraction, which requires preceding contiguity analysis (that is done automatically if checkbox 1 is enabled). Based on these results, the relative single-phase conductivities are then predicted (e.g., σpredIrel,SP1), using empirical micro–macro relationships (see Table 10, eqn (13)–(18)). In general, the option with checkbox 9 is sufficient, because the resulting transport predictions are more accurate, if the contiguous metrics are used. However, if e.g., the size distribution of the bulges of the original phase are of interest, checkbox 8 might be selected, especially for poorly percolating phases, where the differences to the contiguous phase are expected to be large.
With checkbox 10, the computation of the covariance function described in Section 2.2.6 can be enabled. In field 10, the range to be analysed can be determined. The maximal allowed value is half the number of voxels of the smallest dimension (i.e., min(NX,NY,NZ)/2) of the structure. In field 11, the number of samplings can be specified. A larger number provides a better statistical bases at the cost of higher computation times.
It must be emphasized that the settings presented in Fig. 8 are specific for the analysis of composite electrodes consisting of two MIEC solid phases. In a similar way, the specific settings for the automated analysis of other electrodes with different materials architectures (e.g., Ni-YSZ, or Ni–CGO) are compiled and presented in the electronic appendix (see ESI,† Section B.1 and Fig. 2).
3 Results and discussion
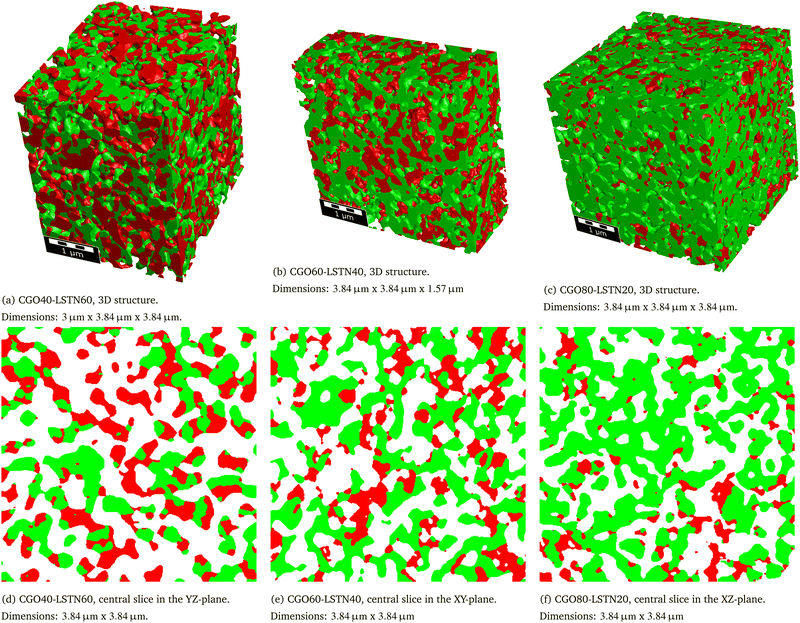
This contribution intends to illustrate the extensive amount of information that can be gained automatically with the 3D characterization tool, based on two examples. The first example includes ‘real’ experimental image data (acquired with FIB-SEM tomography) from LSTN–CGO anodes with three different compositions. The second example consists of three virtual microstructures that are created with a sphere-packing algorithm (using GeoDict's GrainGeo-module), and whose compositions and porosities are varied in a controlled manner. A very large number of microstructure characteristics and effective/relative transport properties are determined for each of the 3D structures in both example datasets. The aim of this extensive characterization is to provide a good understanding, how the characterization-app can potentially be used for microstructure investigations of SOC electrodes (and other porous media). For specific needs, the user may be interested only in a small fraction of all the extensive information that can be gained with the characterization-app. Hence for dedicated purposes, the options of the app can be set accordingly in order to reduce the volume of information and associated computing time, as presented in the ESI,† Section B.1. The computation time of the characterization strongly depends on the structure size and on the selected characterization options. The computation times for a full characterization of the two characterized datasets are reported in the ESI,† Section E. The computations times on a common workstation using 4 processors are around 1 h per structure for the LSTN–CGO dataset and around 10 h per structure for the sphere-packing dataset with considerably larger structure sizes (i.e., higher number of voxels).3.1 Examples of standardized microstructure characterization
The first set of microstructure characteristics that has a strong influence on all relevant anode properties consists of the various phase volume fractions. In Fig. 10, the discontiguous portions of phase volume fraction are marked by a hatched pattern. The total height of the bars corresponds to the total phase volume fractions (e.g., for the CGO-phase (SP1) we have ϕSP1 = ϕSP1,cont + ϕSP1,discont). When comparing the different bars, it becomes apparent that the higher the total phase volume the smaller are the discontiguous portions (hatched patterns). For volume fractions above approximately 30%, the volume fractions of islands and trapped pores are very small and the contiguous volume fractions are almost identical with the total volume fractions. For volume fractions below approximately 30%, the discontiguous portion of the volume fractions increase with decreasing volume fraction. This trend can be observed for ϕSP2,discont in the three samples, where the total phase volume fractions (LSTN, red bars) decrease from 24.8% over 19% to 13.3% and the discontiguous portions increase from <1% to >4%. Hence, for the anode with nominal composition CGO![[thin space (1/6-em)]](https://www.rsc.org/images/entities/char_2009.gif) :
:![[thin space (1/6-em)]](https://www.rsc.org/images/entities/char_2009.gif) LSTN = 80
LSTN = 80![[thin space (1/6-em)]](https://www.rsc.org/images/entities/char_2009.gif) :
:![[thin space (1/6-em)]](https://www.rsc.org/images/entities/char_2009.gif) 20, the corresponding single-phase connectivity for LSTN takes place in a small volume fraction of only 9%.
20, the corresponding single-phase connectivity for LSTN takes place in a small volume fraction of only 9%.
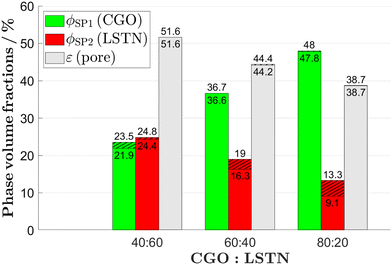 | ||
| Fig. 10 Phase volume fractions of the CGO-phase (SP1), the LSTN-phase (SP2) and the pore-phase for the LSTN–CGO dataset. The discontiguous parts (islands/trapped pores) are hatched. The lower number corresponds to the contiguous phase and the upper number corresponds to the original phase volume fractions. Detailed definitions and description of the variables can be found in Table 1. | ||
Electrochemical reactions of SOC anodes such as fuel oxidation and involved reaction steps such as catalytic hydrogen dissociation take place either on the pore-solid interfaces of certain phases or across the interface between the active phases at the TPBs. Hence, the electrochemical activity is directly related to abundancy of the active sites, which can be expressed as volume specific surface or interface areas and/or as TPB-lengths. As shown in Fig. 11(a), the volume specific interface areas of the different phases are related to the corresponding solid volume fractions. Note that for the LSTN–CGO materials system, especially the pore–CGO interface area IAV,pore–SP1 is important for the reaction kinetics as e.g., reported by Burnat et al.4 Interface areas related to discontiguous parts can become inactive for charge transfer reactions (in materials with single-phase conductivity). These disconnected interfaces are marked with a hatched pattern. It is important to note that the fraction of discontiguous interface areas in Fig. 11(a) is significantly higher than the corresponding discontiguous volume fractions in Fig. 10. The TPB-length can have a significant influence on the overall anode reaction kinetics.4 It must be emphasized that in anodes consisting of materials with single-phase conductivity (e.g., Ni-YSZ), only those TPBs are electrochemically active, where all three adjacent phases form a contiguous network (i.e., all three phases must be capable of transporting the corresponding species). With respect to Fig. 11(b), it is worth noting that for the CGO80–LSTN20 structure, the total TPB-length is almost the same as for the CGO60–LSTN40 structure, while the contiguous portion is considerably lower. However, due to the two MIEC-phases, the discontiguous TPBs are not simply dead as it would be the case for a Ni-YSZ cermet. In such MIEC anodes, the whole TPBs remain accessible, but the discontiguous part will probably cause a slightly higher overpotential due to increased transport resistance. For example, in a MIEC anode, the electrons generated by oxidation reaction at an apparently disconnected TPB can still be transported to the current collector, because disconnected islands of the LSTN-phase will be bridged by the complementary CGO-phase. A similar positive effect due to MIEC properties of involved phases can also be expected for apparently disconnected surfaces. For example, it is well known that the pore–CGO interface area IAV,pore–SP1 is highly active for fuel oxidation. Fig. 11(a) indicates that 10% of the pore–CGO interface area the CGO40–LSTN60 structure is discontiguous (and potentially inactive). However, due to MIEC properties of the involved phases, the entire pore–CGO interface remains active, because the transport pathways between discontiguous parts of the CGO network are automatically bridged by the complementary LSTN-phase. But since the LSTN-phase has lower ionic conductivity, this may lead to a higher overpotential.
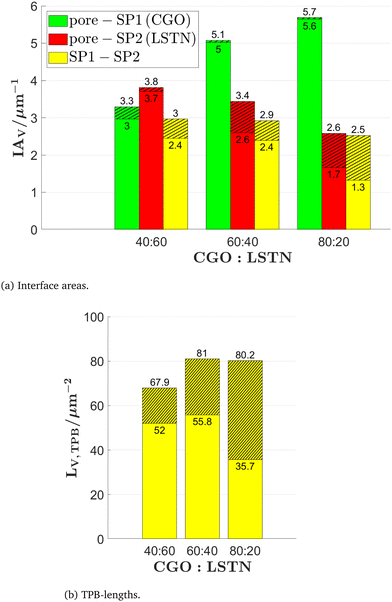 | ||
| Fig. 11 (a) Volume specific interface areas and (b) TPB-length for the LSTN–CGO dataset. The disconnected parts (islands/trapped pores) are hatched. The lower number corresponds to the contiguous and the upper number corresponds to the original interface property. Detailed definitions and description of the variables can be found in Table 2. | ||
In Fig. 12(a), the covariance functions are reported for the different phases and samples. As discussed in Section 2.2.6, the covariance function contains relevant morphological information of a given phase. The y-axis intercept corresponds to the phase volume fractions and the covariance function tends to the asymptotic value of the square of the phase volume fraction, which can be easily confirmed by comparing with Fig. 10. Moreover, the slope of the covariance function at the y-axis intercept is directly related to the phase specific surface area. For example, for the CGO80–LSTN20 structure, the corresponding slope for the covariance function of the pore-phase is much steeper than the one for SP2 (LSTN). This reflects the fact that the total volume specific interface area for SP2 (given by the sum IAV,pore–SP2+ IAV,SP1–SP2) is much smaller than the total interface area of the pore-phase (given by the sum IAV,pore–SP1+ IAV,pore–SP2), which can be confirmed by comparing with Fig. 11(a). The correlation lengths estimated for the different phases and samples are reported in the ESI,† Section D.
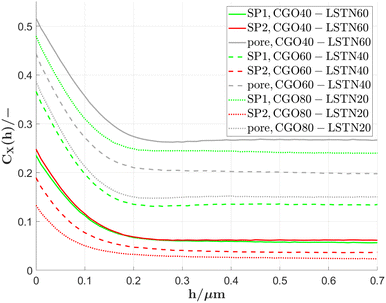 | ||
| Fig. 12 Covariance functions of the CGO-phase (SP1), the LSTN-phase (SP2) and the pore-phase for the LSTN–CGO dataset. | ||
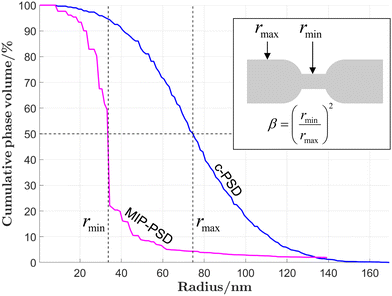
Constrictivity is a geometric parameter that is used to describe the limiting influence of narrow bottlenecks towards transport in a certain phase network. Constrictivity (β) is calculated from the ratio of the characteristic cross-section area at constricting bottlenecks (πrmin2) over the characteristic cross section area at non-constricted bulges (πrmax2), which leads to eqn (1) (β = (rmin/rmax)2). For disordered microstructures, the mean radii of bottlenecks and bulges are calculated from the corresponding phase size distributions (i.e., rmin = r50 of MIP-PSD, rmax = r50 of cPSD). In Fig. 13, the constrictivity is reported together with the radius of bulges rmax and bottlenecks rmin for the two solid-phases, the total solid-phase, and the pore-phase for the LSTN–CGO dataset. The bottleneck radii rmin,SP1,cont for the CGO-phase (SP1) considerably increase with increasing CGO-content, while the bulge radii (rmax,SP1,cont) remain in the same range (Fig. 13(a)). This results in much higher constrictivities for higher CGO-contents. In contrast, the bottleneck radii rmin,SP2,cont for the LSTN-phase (SP2) increases only slightly with increasing LSTN-contents, which results in an almost constant constrictivity for SP2 in the different samples (Fig. 13(b)). Nevertheless, the bottleneck effect is stronger in SP2, and therefore the constrictivities in LSTN (ca. 0.3) tend to be smaller than in CGO (up to 0.6). Also for the total solid phase and for the pores in all three samples, the corresponding radii of bulges and bottlenecks are changing hardly, and therefore also the constrictivity values remain stable in these phases (see Fig. 13(c) and (d)).
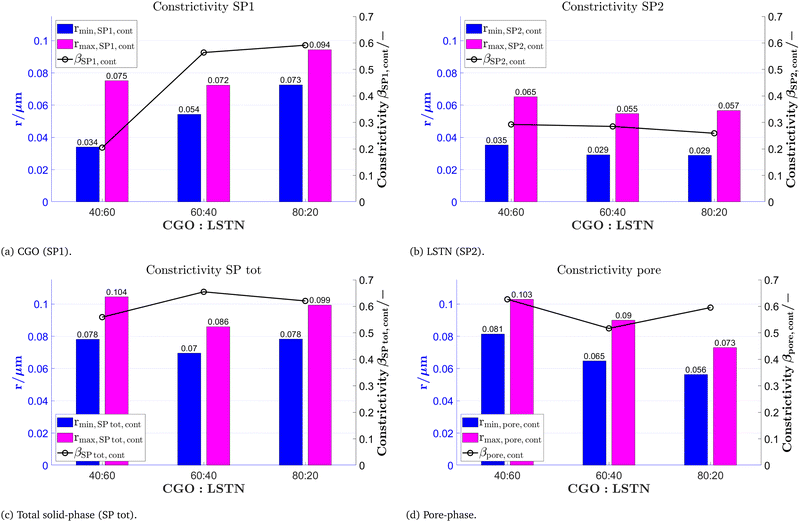 | ||
| Fig. 13 Mean radius of bottlenecks rmin, mean radius of bulges rmax and corresponding constrictivity β for (a) CGO (SP1), (b) LSTN (SP2), (c) total solid-phase (SP tot) and (d) the pore-phase for the LSTN–CGO dataset. The used variables and their definitions are summarized in Table 5. | ||
The characterization-app enables to determine numerous types of tortuosities, which can be grouped into the three classes: (a) direct geometric, (b) mixed, or (c) indirect physics-based tortuosities. In a comparative literature study that involved microstructure data from over 60 different investigations, it turned out that there exists a ‘global’ pattern among these different tortuosity classes, in the sense, that certain types of tortuosities consistently reveal higher values than others (see Holzer et al.,13 Section 3). In a simplified way, this hierarchical pattern can be described as follows: The values of direct geometric tortuosities (class a) as well as the values of mixed tortuosities (class b) are generally much lower than the values measured for indirect physics-based tortuosities (class c). Furthermore, within the specific tortuosity classes there exists a consistent hierarchy. For example, the hydraulic tortuosities are usually higher than the electric or diffusional tortuosities. This hierarchy is observed in both, the mixed and the indirect physics-based tortuosity classes. In a similar way, within the direct geometric tortuosity class, the values observed for geodesic tortuosity are consistently smaller than those for skeleton and medial axis tortuosity. An astonishing result of this comparative study is the fact that the systematic differences between the various tortuosity classes (and types) are more pronounced than the impact of the actual microstructure variations. The latter comes from different samples and materials, that are used in the involved studies. Obviously, the global pattern associated with the selection of different tortuosity types overrules the variation associated with different materials and microstructures. With other words, the value obtained from a tortuosity measurement is more strongly dependent on the chosen type of tortuosity (and associated method), than it is dependent on the microstructure itself. This finding emphasizes the need to understand the underlying definition and methodology of the different tortuosity types. It also emphasizes the importance of choosing a suitable tortuosity type carefully. As a rule of thumb, one can interpret the different tortuosity classes as follows:
(A) The direct geometric tortuosity gives an estimation of the mean pathlength, which is based on a true morphological analysis of the microstructure. Thereby the geometric definition of the pathways can vary (e.g., geodesic or median axis pathways), which leads to slightly different results. A major limitation is the fact, that geometric tortuosities are not capable to differentiate between the different transport processes (conduction, diffusion, or flow).
(B) The mixed tortuosities give an estimation of the mean pathlength, which is based on the analysis of a volume field from transport simulation (e.g., analysis of local flow vectors or simulated streamlines). In accordance with the type of the involved transport simulation, the resulting mixed tortuosity is specific for the underlying transport physics. The mixed tortuosities are interpreted as tortuosity types that reveal the most accurate, detailed and specific information on the lengths of transport pathways, since they combine geometric analyses with physics-based simulations.
(C) The indirect tortuosities are calculated from known effective transport properties and hence, they are also specific for the involved transport physics. The indirect tortuosity can be interpreted as a fitting factor for the bulk transport resistance. However, the limiting effects from reduced volume fraction are excluded. Compared to all other tortuosities, the indirect tortuosities reveal consistently higher values, which is attributed to the fact that they include other microstructure limitations (not only pathlength effects), such as the bottleneck effect. Consequently, the indirect tortuosity should not be mistaken as a true geometric measure for transport pathlengths.
In Fig. 14, different types of tortuosities are reported for the two solid-phases (Fig. 14(a) and (b)), the total solid-phase (Fig. 14(c)) and the pore-phase (Fig. 14(d)) for the LSTN–CGO dataset. It must be emphasized that the values of the different tortuosity-types are very different for the same geometric phase, (e.g., when comparing different tortuosities for SP1 in CGO40–LSTN60). These differences follow a consistent pattern, which is very much identical with the above-mentioned ‘global’ pattern. Thereby the indirect tortuosities (i.e., pink bars) are consistently higher than the geometric (geodesic) and mixed (volume averaged) tortuosities. In our example, the mixed tortuosities (cyan) are also slightly but systematically higher than the geodesic tortuosities (blue). This pattern is observed for all four phases (SP1, SP2, SP total, pores) in all three samples, which demonstrates the importance of a proper definition and differentiation of the different tortuosity types. Nevertheless, the difference between indirect tortuosities (which are interpreted as a measure for the bulk transport resistance) on one side, and direct and mixed tortuosities (which are interpreted as true measures of the pathlengths) on the other side, is not for all samples the same. The differences are much larger in those samples and phases, where the corresponding transport resistance is increased. For example, for SP1 (CGO) in CGO40–LSTN60, the indirect tortuosity is much higher than the geodesic and mixed tortuosities (Fig. 14(a)). This can be attributed to the fact that indirect tortuosity is not only capturing effects of pathlength variation, but also other transport limitations. In this case, it is the narrow bottlenecks and associated low constrictivity (see Fig. 13(a) left) that lead to an increase of transport resistance and consequently also to an increase of indirect tortuosity. A marked increase of indirect tortuosity is also observed for SP2 (LSTN) in CGO80–LSTN20 (Fig. 14(b)). In this case, the increase of transport resistance that leads to unusually high indirect tortuosity can be attributed to a low volume fraction and loss of contiguity in the phase network of LSTN (see Fig. 10).
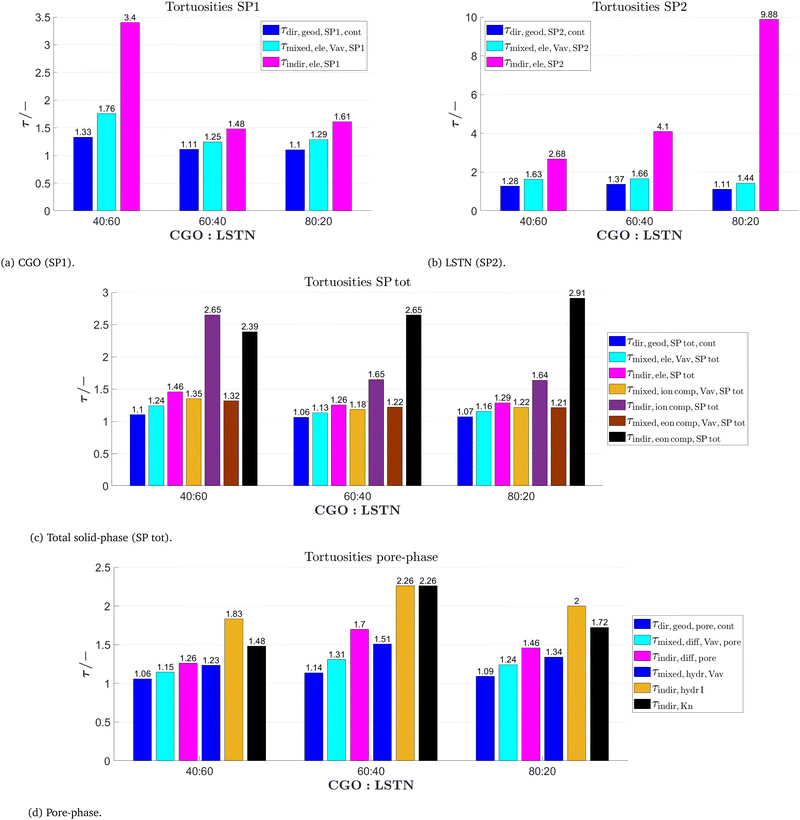 | ||
| Fig. 14 Different tortuosities for (a) CGO (SP1), (b) LSTN (SP2), (c) total solid-phase (SP tot) and (d) the pore-phase for the LSTN–CGO dataset. The used variables are summarized in the Tables 6–8. | ||
As shown in Fig. 14(c), there are some additional tortuosities that can be determined for the total solid-phase, which are related to composite conductivity associated with MIEC properties of the involved anode materials. The mixed composite tortuosities are computed from the current density field associated with the ionic composite conductivity τmixed,ioncomp,Vav,SPtot (orange bar) and electronic composite conductivity τmixed,eoncomp,Vav,SPtot (brown). In addition, the app also provides the indirect ionic τindir,ioncomp,SPtot (violet) and indirect electronic τindir,eoncomp,SPtot (black) composite tortuosities. They are computed indirectly from the effective composite conductivities. All these mixed and indirect tortuosities with the attribute ‘comp’ are thus based on the simulation of composite conductivities. Thereby, the intrinsic conductivities for transport of a given species are different in the two solid phases (i.e., intrinsic ionic conductivity in CGO is ten times higher than in LSTN, and electronic conductivity is ten times higher in LSTN). For mixed tortuosities, which represent a geometric measure of the pathways, there is hardly any difference between single-phase (cyan) and the composite tortuosities (ocker and brown) for the total solid-phase. This may indicate that in these anode samples, the length of streamlines in composite conduction mode (i.e., with MIEC properties) is not significantly changed by the fact that different intrinsic conductivities are attribute to SP1 and SP2. In contrast, for the indirect tortuosities of SP tot (also in Fig. 14(c)), the measured values for composite (MIEC) conduction (violet and black bars) are clearly higher than those for single-phase conduction (pink bar). This can be attributed to the fact that for the single-phase conduction mode, both solid phases are treated as one phase (SP total) with a relatively high intrinsic conductivity for the entire domain (e.g., with the ionic conductivity of CGO). In the composite conduction mode, different intrinsic conductivities are attributed to the subdomains of SP1 and SP2 (e.g., ionic conductivity of LSTN in SP2 is ten times lower than for CGO in SP1). This leads to higher transport resistances in composite conduction mode, which explains the elevated values for indirect composite conductivities. This difference is obviously not a geometric effect expressed by different pathlengths, but it is related to variations of the intrinsic materials properties. For the pore-phase (Fig. 14(d)) the geodesic tortuosity τdir,geod,pore,cont, the mixed tortuosity τmixed,diff,Vav,pore calculated from the flux field of bulk diffusion and the indirect τindir,diff,pore for bulk diffusion are reported. These types correspond to the three tortuosities reported for the solid-phases SP1 and SP2. Moreover, mixed and indirect hydraulic tortuosities related to the gas-flow are reported. The mixed hydraulic tortuosities τmixed,hydr,Vav from the gas-flow field are larger than the mixed tortuosities from the diffusion flux field τmixed,diff,Vav,pore for the same microstructure. In a similar way, the indirect tortuosities from the numerical permeability analysis τindir,hydrI,cont and the indirect tortuosity from simulation of Knudsen diffusion τindir,Kn are larger than the indirect tortuosities from bulk diffusion τindir,diff,pore (in each of the three microstructures).
In summary, the microstructure variation in our example, which is associated with a change of CGO![[thin space (1/6-em)]](https://www.rsc.org/images/entities/char_2009.gif) :
:![[thin space (1/6-em)]](https://www.rsc.org/images/entities/char_2009.gif) LSTN ratio (i.e. 40
LSTN ratio (i.e. 40![[thin space (1/6-em)]](https://www.rsc.org/images/entities/char_2009.gif) :
:![[thin space (1/6-em)]](https://www.rsc.org/images/entities/char_2009.gif) 60, 60
60, 60![[thin space (1/6-em)]](https://www.rsc.org/images/entities/char_2009.gif) :
:![[thin space (1/6-em)]](https://www.rsc.org/images/entities/char_2009.gif) 40, 80
40, 80![[thin space (1/6-em)]](https://www.rsc.org/images/entities/char_2009.gif) :
:![[thin space (1/6-em)]](https://www.rsc.org/images/entities/char_2009.gif) 20), has a very limited impact on the mean lengths of transport pathways. This is documented by the fact that for geometric and mixed tortuosities, the measured values do not change significantly for different CGO–LSTN ratio (see e.g., blue or cyan bars in Fig. 14(a)–(d)). Only for indirect tortuosities, which represent a measure for bulk resistance, the measured values change with sample composition. These results thus indicate that transport resistances in our example are controlled by other microstructure features, such as bottleneck effect and impact of contiguous phase volume.
20), has a very limited impact on the mean lengths of transport pathways. This is documented by the fact that for geometric and mixed tortuosities, the measured values do not change significantly for different CGO–LSTN ratio (see e.g., blue or cyan bars in Fig. 14(a)–(d)). Only for indirect tortuosities, which represent a measure for bulk resistance, the measured values change with sample composition. These results thus indicate that transport resistances in our example are controlled by other microstructure features, such as bottleneck effect and impact of contiguous phase volume.
The following section is dealing with the M-factor, which is an equivalent for the relative conductivity (or relative diffusivity, respectively). It is defined by the ratio of effective over intrinsic (bulk) conductivity (i.e., M = σrel = σeff/σ0). The M-factor thus represents a quantitative estimation for the sum of all transport limitations that are caused by microstructure effects. Those effects can be investigated based on the detailed morphological characterization with our characterization-app. The easiest and usually the most reliable way to determine the M-factors in a 3D microstructure is to perform a numerical transport simulation (e.g., simulation of electrical conduction in SP1 provides MsimSP1 and its equivalent σsimrel,SP1, respectively). For materials with single-phase conductivity (e.g., SP1 = Ni), it is also possible to predict the M-factor based on empirical equations that take into account all relevant microstructure characteristics from 3D image analysis (see Table 10, eqn (13)–(20)). According to eqn (21) (MpredI = σpredIrel = DpredIrel = ϕ1.15β0.37τdir,geod−4.39), three major components of the M-factor can be distinguished, which describe the transport limitations due to the volume fraction effect (ϕ1.15), to the constrictivity or bottleneck effect (β0.37) and to the tortuosity or path-length effect (τdir,geod−4.39). Hence, in this way the morphological limitations can be determined quantitatively. Alternatively, according to eqn (22) (MpredII = σpredIIrel = DpredIIrel = ϕ1.67–0.48β·τdir,geod−5.18), the limiting effects from microstructure are described as the product of only two components, which are related to the effective volume fraction (ϕ1.67–0.48β), and tortuosity (τdir,geod−5.18). In this description, the bottleneck effect is included in the effective volume fraction. Since the simulated M-factors are considered to give reliable and precise results, the comparison with Msim can be used to judge the prediction power of Mpred and the underlying empirical equations (eqn (13)–(20)).
In Fig. 15, the predictions of MpredI are reported together with the simulated M-factors for each of the phases (SP1, SP2, SP tot and pore-phase) in the LSTN–CGO dataset. The composition dependent variations of MpredI and Msim (black and red lines) are very similar in all four phases. The compatibility of these two curves confirms the high prediction power of eqn (21). Moreover, also the three components of MpredI are shown as blue (phase volume fraction), cyan (constrictivity) and pink bars (tortuosity). The most stringent limitations come from the smallest bars, which is always the blue bar representing the volume fraction effect. Consequently, for all four phases, the evolution of the M-factors (σrel, Drel, respectively) basically correlates with the changes of the corresponding phase volume fractions. Deviations from these correlations between M-factor and volume fractions can be attributed to the other effects (i.e., constrictivity and/or tortuosity). For the CGO-phase (SP1) in Fig. 15(a), the M-factor increases with the CGO-content. But also the components associated with constrictivity and tortuosity vary with the CGO-content (i.e., change in volume fractions). Therefore, the changes of the M-factors in SP1 are caused by variation of all three microstructure components. For the LSTN-phase (SP2) in Fig. 15(b), the M-factors are generally small due to the small phase volume fractions and they decrease further with decreasing LSTN-content. In SP2, the changes of the constrictivity and tortuosity components do not correlate with the volume fraction. Especially the tortuosity component in CGO80–LSTN20 is unusually high, which leads to a slight kink in the trend of for MpredI, which is not observed for Msim. The M-factors for the total solid-phase in Fig. 15(c) are considerably higher compared to the M-factors of the single phases in Fig. 15(a) and (b). The main contribution to this enhancement is from the larger volume fraction, but also the limitations imposed by tortuosities and constrictivities are less severe, compared to SP1 and SP2. (Remark: in most cases the M-factor for the total solid-phase is of limited significance because it suggests that the intrinsic transport properties of SP1 and SP2 are equal). For the pore-phase (Fig. 15(d)), the volume fraction effect (blue bars) steadily decreases, according to the compositional variation. The trend for the M-factors deviates from this linear trend and shows a kink (minimum) for the mid composition CGO60–LSTN40. The exceptionally low M-factor for the mid composition can be attributed to the relatively low values for the tortuosity component (pink bar) in CGO60–LSTN40. In addition, the relative Knudsen diffusivity DsimKn,rel,Z is also plotted in Fig. 15(d). Knudsen diffusivity is generally somewhat smaller compared to the relative diffusivity, but it follows the same ‘kinky’ trend line. This indicates that Knudsen diffusivity in these samples is affected by microstructure obstacles in a similar way.
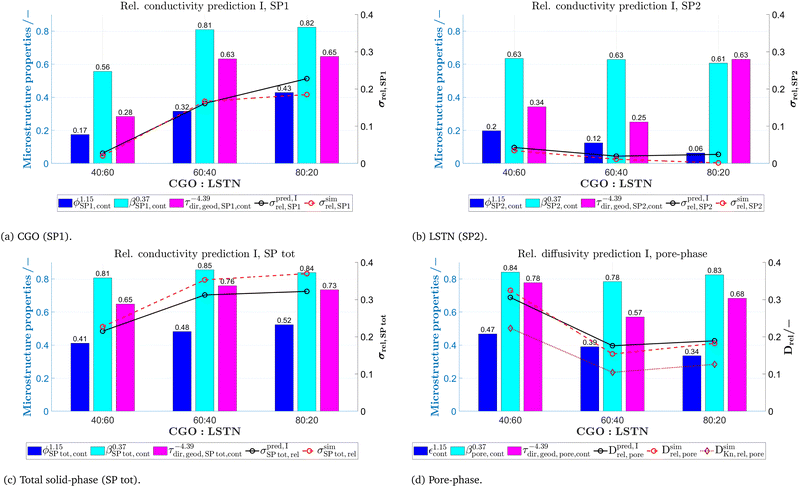 | ||
| Fig. 15 M-factor prediction I (black lines) and its three components (volume fraction effect ϕ1.15, constrictivity effect β0.37 and tortuosity effect τdir,geod−4.39) and simulated M-factors (red lines), for (a) CGO (SP1), (b) LSTN (SP2), (c) total solid-phase (SP tot) and (d) the pore-phase. The used variables are summarized in the Tables 9 and 10. | ||
In Fig. 16, the M-factors from prediction II MpredII and from simulation (Msim) are shown as black and red lines, respectively, for each of the phases (SP1, SP2, SP tot and pore-phase) in the LSTN–CGO dataset. Moreover, the two components of MpredII related to effective phase volume fraction (corrected with constrictivity) and tortuosity are also reported (as blue and cyan coloured bars). In general, the M-factors from prediction II again correspond well to the simulated M-factors, which documents their excellent prediction power. In a similar way as for prediction I, the main limitations in prediction II also come from the reduced volume fractions (blue bars). The effective volume fractions in prediction II are even more dominant than the volume fractions in prediction I, because in their calculation constrictivity (β) is considered as a correction for narrow bottlenecks.
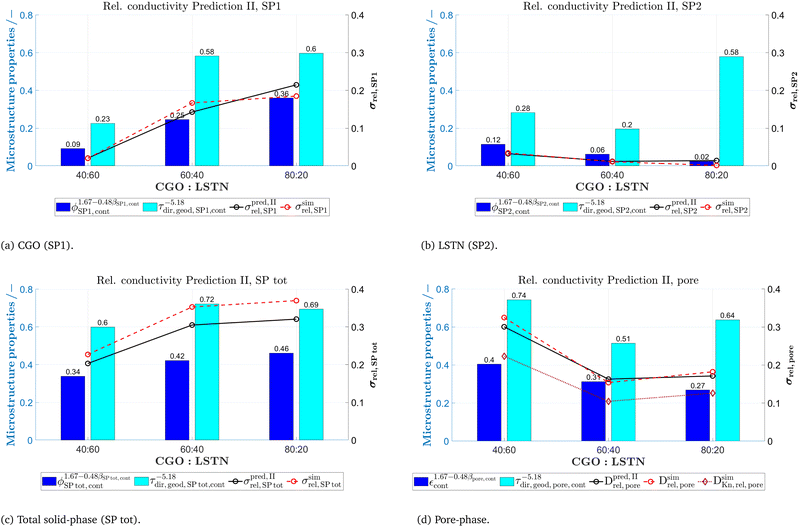 | ||
| Fig. 16 M-factor prediction II (black line) and its two components (volume fraction and constrictivity effect ϕ1.67–0.48β and tortuosity effect τdir,geod−5.18) and simulated M-factors (red lines), for (a) CGO (SP1), (b) LSTN (SP2), (c) total solid-phase (SP tot) and (d) the pore-phase. The used variables are summarized in the Tables 9 and 10. | ||
In Fig. 17, the relative ionic and electronic composite conductivities for the total solid-phase are plotted as green (ionic) and red bars (electronic), according to the definitions in Section 2.3.2. It must be remembered that composite conductivities are relevant for electrodes consisting of MIEC phases, whereby transport of a given species takes places in both solid phases, but with different intrinsic conductivities for these two phases. The ratio of the intrinsic electronic conductivities of CGO (SP1) and LSTN (SP2) are defined as λeon = σ0,eon,SP1/σ0,eon,SP2 = 0.1 and the ratio of the intrinsic ionic conductivities as λion = σ0,ion,SP2/σ0,ion,SP1 = 0.1 based on the estimations in Section 2. As a reference, the relative single-phase conductivities (M-factors) of the CGO-phase (SP1), the LSTN-phase (SP2) and the total solid-phase (SP tot) are reported from Fig. 15(a)–(c) as line-plots. As expected, the relative composite conductivities are larger than the corresponding single-phase conductivities (M-factors) but lower than the relative conductivity (M-factor) of the total solid-phase. The ions are predominantly transported in the CGO-phase (SP1) because of the higher intrinsic ionic conductivity of CGO compared to LSTN. Nevertheless, the relative ionic composite conductivity (green bars) is clearly higher for all three compositions than the single-phase conductivity of SP1 (CGO, green line). Hence, even though the intrinsic ionic conductivity of LSTN is ten times lower compared to CGO, there is a strong contribution of the LSTN-phase to the composite ionic conductivity. Obviously, LSTN is able to bridge discontiguous parts of the CGO-phase. Furthermore, LSTN also reduces the limiting effects from narrow bottlenecks and tortuous pathways within the CGO-phase network, because the LSTN can offer alternative pathways in places where ionic transport in pure CGO is hindered by constrictions and other obstacles. The positive contribution from LSTN is relatively strong for the composition with low CGO-contents (the relative ionic composite conductivity for CGO40–LSTN60 is by a factor of 3.4 higher than the single-phase conductivity of the CGO-phase). The positive effect from LSTN bridging becomes considerably smaller for compositions with higher CGO contents (CGO60–LSTN40 and CGO80–LSTN20), because the corresponding M-factors for the CGO-phase (SP1) are already quite high. For our composite MIEC electrodes, it can be assumed that the electrons are predominantly transported in the LSTN-phase (SP2) because the intrinsic electronic conductivity of LSTN is 10 times higher compared to CGO. However, the single-phase electronic conductivities of LSTN (red line) are relatively low, because of the small LSTN volume fractions and also because of further transport limitations associated with tortuous pathways and bottlenecks in the LSTN-phase network. Therefore, the contribution of the CGO-phase to the composite electronic conductivity is extraordinarily important. The positive contribution of the CGO phase is expressed by the large difference between the composite electronic conductivities (red bars) and the single-phase electronic conductivities in LSTN (red line).
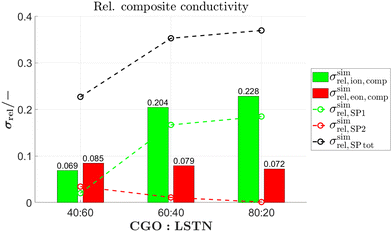 | ||
| Fig. 17 Green and red bars show the relative ionic and electronic composite conductivities for the total solid-phase with λeon = λion = 0.1. As a reference, the relative single-phase conductivities (M-factors) of the CGO-phase (SP1), the LSTN-phase (SP2) and the total solid-phase (SP tot) are reported as line-plots. Note: σsimrel,SPtot corresponds to the reference case where SP1 and SP2 have the same intrinsic conductivities (i.e., λeon = λion = 1). The used variables are summarized in Table 11. | ||
Due to the MIEC-property of both solid-phases, the transports of neither the electrons nor the oxygen ions are limited to a single phase. As a consequence, composite MIEC electrodes reveal a remarkable property that can be described as ‘composite conductivity’ (for electrons as well as for ions), which is much higher than the (hypothetical) single-phase conductivities of the same microstructure. In composite MIEC anodes, the charge carriers can reach the reaction sites even when the volume fraction of one MIEC-phase is below the percolation threshold, because the missing contiguity is automatically bridged by the second MIEC-phase. Furthermore, for composite conductivity in MIEC electrodes, we can state the following rule of thumb: The smaller the volume fraction of the MIEC-phase with higher conductivity is, the more important becomes the contribution from the complementary MIEC-phase with lower conductivity.
Similar as the M-factor for conduction and diffusion, permeability describes the limiting effects of microstructure towards viscous flow. In Table 12, empirical relationships between permeability and microstructure characteristics (hydraulic radius, phase volume fraction, tortuosity and constrictivity) are presented. In comparison to conduction and diffusion, an additional microstructure effect must be considered for viscous flow. The effects related to viscous drag at pore walls are quantitatively described with the hydraulic radius term (i.e., rhc2/8), which usually has a dominant impact on permeability. Hydraulic radius can be estimated in two ways (eqn (27) and (28)), either from the ratio of porosity over surface area, or from a weighted average of rmin and rmax. This leads to two different mathematical expressions for permeability prediction (eqn (29) and (30)). In Fig. 18(b), the simulated gas permeability of the pore-phase is plotted together with the two predictions for the permeability. The agreement between predictions and simulation is rather poor. Nevertheless, the predictions correctly catch the trends and are thus helpful to interpret the microstructure limitations affecting permeability. The results from simulations are considered as being reliable. When comparing results from structures CGO60–LSTN40 with CGO40–LSTN60, the simulations show a decrease of permeability by more than a factor of three, despite the fact that the porosity only decrease from εcont = 51.6% to εcont = 44.2% (see Fig. 10). However, the hydraulic radii of both definitions (eqn (27) and (28)) are considerably higher for the CGO40–LSTN60 structure, as reported in Fig. 18(a). Obviously in our example, the variation of permeability is heavily influenced by changes of the hydraulic radius. Note that the hydraulic radii enter quadratic in the permeability predictions I and II (eqn (29) and (30)). Moreover, the porosity enters with the exponent 3.56 for prediction I (eqn (29)) and 2.14 for predictions II (eqn (30)). Hence, phase volume fractions have a considerably larger impact on the permeability than on the M-factors for diffusivity, where the porosity enters with an exponent of 1.15 (eqn (19)).
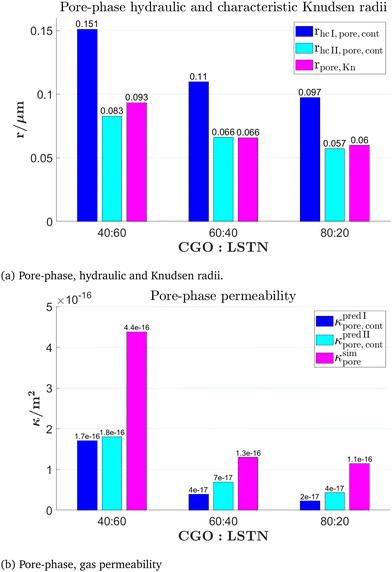 | ||
| Fig. 18 Additional characteristics of the pore-phase: (a) hydraulic and Knudsen radii and (b) gas permeability (predicted and simulated). The used variables are summarized in the Tables 12 and 13. | ||
The characteristic Knudsen radius, which is a result of the Knudsen transport simulation (see Section 2.3.3.2), is also reported in Fig. 18(a). It is quite similar to the hydraulic radius rhcII,pore,cont defined in eqn (28). The characteristic Knudsen radius (or diameter) is an important measure for estimating the Knudsen diffusion as discussed in Marmet et al.43
In summary, this example illustrates the numerous microstructure characteristics and effective properties that can be extracted automatically from 3D images of SOC electrodes. The extensive amount of information can be confusing and its interpretation can be demanding. Therefore, a selection of relevant information may be necessary. Table 15 shows such a reduced selection of microstructure information. The table contains all microstructure properties that are relevant for the parametrization of a multiphysics model to predict the electrode performance. An example for such a model has been presented by Marmet et al.43 for the case of a porous MIEC anode. In this model, the microstructure limitations towards species transport are captured on a continuum scale, which means that the microstructure effects are described by effective or relative properties, as summarized in Table 15.
| Description | Variable | Unit | CGO40–LSTN60 | CGO60–LSTN40 | CGO80–LSTN20 |
|---|---|---|---|---|---|
| Material for SP1 | Material SP1 | — | CGO | CGO | CGO |
| Material for SP2 | Material SP2 | — | LSTN | LSTN | LSTN |
| Voxel length | l vox | nm | 10 | 10 | 10 |
| Number of voxels in X-direction | NX | vox | 300 | 384 | 384 |
| Number of voxels in Y-direction | NY | vox | 384 | 384 | 384 |
| Number of voxels in Z-direction | NZ | vox | 384 | 157 | 384 |
| Total porosity | ε | — | 0.5163 | 0.4439 | 0.3871 |
| Total solid volume fraction | ϕ tot | — | 0.4837 | 0.5561 | 0.6129 |
| Solid volume fraction SP1 | ϕ SP1 | — | 0.2355 | 0.3665 | 0.4799 |
| Solid volume fraction SP2 | ϕ SP2 | — | 0.2482 | 0.1895 | 0.1330 |
| Volume specific interface area pore – SP1 | IA V,pore–SP1 | μm2 μm−3 | 3.295 | 5.075 | 5.688 |
| Volume specific interface area pore – SP2 | IA V,pore–SP2 | μm2 μm−3 | 3.813 | 3.438 | 2.583 |
| Volume specific surface area of pores | S V,pore | μm2 μm−3 | 7.108 | 8.513 | 8.271 |
| Volume specific interface area SP1–SP2 | IA V,SP1–SP2 | μm2 μm−3 | 2.966 | 2.922 | 2.524 |
| Volume specific three-phase boundary (TPB) length | L V,TPB | μm μm−3 | 67.894 | 81.002 | 80.185 |
| Relative single-phase conductivity SP1 | σ simrel,SP1 | — | 0.0204 | 0.1670 | 0.1850 |
| Relative single-phase conductivity SP2 | σ simrel,SP2 | — | 0.0345 | 0.0113 | 0.0014 |
| Relative electronic composite conductivity (λeon = 0.1) | σ rel,eon,comp | — | 0.0848 | 0.0793 | 0.0724 |
| Relative ionic composite conductivity (λion = 0.1) | σ rel,ion,comp | — | 0.0689 | 0.2044 | 0.2285 |
| Relative gas diffusivity | D simrel | — | 0.3249 | 0.1539 | 0.1822 |
| Gas permeability | κ sim | m2 | 4.382 × 10⁻¹⁶ | 1.303 × 10⁻¹⁶ | 1.148 × 10⁻¹⁶ |
| Knudsen characteristic length | d Kn,pore | μm | 0.1868 | 0.1318 | 0.1197 |
| Knudsen relative diffusivity | D simKn,rel,meanXYZ | — | 0.2232 | 0.1046 | 0.1261 |
In Fig. 20, the volume fractions of the different phases are reported. The discontiguous parts are marked with a hatched pattern. The normalized compositions of the solid phases do not change significantly (i.e., the ratio of solid volume fractions of SP1![[thin space (1/6-em)]](https://www.rsc.org/images/entities/char_2009.gif) :
:![[thin space (1/6-em)]](https://www.rsc.org/images/entities/char_2009.gif) SP2 are 60
SP2 are 60![[thin space (1/6-em)]](https://www.rsc.org/images/entities/char_2009.gif) :
:![[thin space (1/6-em)]](https://www.rsc.org/images/entities/char_2009.gif) 40, 57
40, 57![[thin space (1/6-em)]](https://www.rsc.org/images/entities/char_2009.gif) :
:![[thin space (1/6-em)]](https://www.rsc.org/images/entities/char_2009.gif) 43 and 50
43 and 50![[thin space (1/6-em)]](https://www.rsc.org/images/entities/char_2009.gif) :
:![[thin space (1/6-em)]](https://www.rsc.org/images/entities/char_2009.gif) 50). But in combination with the changes in porosity from 50% to 20%, this leads to significantly different anode properties. For the following discussion, we use the following nomenclature:
50). But in combination with the changes in porosity from 50% to 20%, this leads to significantly different anode properties. For the following discussion, we use the following nomenclature:
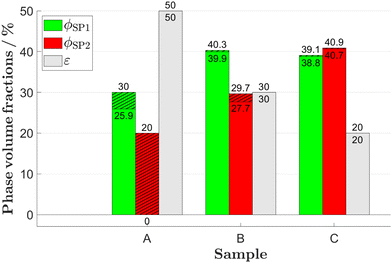 | ||
| Fig. 20 Phase volume fractions SP1, SP2 and the pore-phase for the virtual sphere-packing structures. The discontiguous parts (islands/trapped pores) are hatched. The lower number corresponds to the contiguous phase and the upper number corresponds to the original phase volume fractions. Detailed definitions and description of the variables can be found in Table 1. Note that in Sample A, SP2 is fully discontiguous. | ||
• Sample A: composition SP1![[thin space (1/6-em)]](https://www.rsc.org/images/entities/char_2009.gif) :
:![[thin space (1/6-em)]](https://www.rsc.org/images/entities/char_2009.gif) SP2
SP2![[thin space (1/6-em)]](https://www.rsc.org/images/entities/char_2009.gif) :
:![[thin space (1/6-em)]](https://www.rsc.org/images/entities/char_2009.gif) pore = 30
pore = 30![[thin space (1/6-em)]](https://www.rsc.org/images/entities/char_2009.gif) :
:![[thin space (1/6-em)]](https://www.rsc.org/images/entities/char_2009.gif) 20
20![[thin space (1/6-em)]](https://www.rsc.org/images/entities/char_2009.gif) :
:![[thin space (1/6-em)]](https://www.rsc.org/images/entities/char_2009.gif) 50, attribute: high porosity.
50, attribute: high porosity.
• Sample B: composition SP1![[thin space (1/6-em)]](https://www.rsc.org/images/entities/char_2009.gif) :
:![[thin space (1/6-em)]](https://www.rsc.org/images/entities/char_2009.gif) SP2
SP2![[thin space (1/6-em)]](https://www.rsc.org/images/entities/char_2009.gif) :
:![[thin space (1/6-em)]](https://www.rsc.org/images/entities/char_2009.gif) pore = 40
pore = 40![[thin space (1/6-em)]](https://www.rsc.org/images/entities/char_2009.gif) :
:![[thin space (1/6-em)]](https://www.rsc.org/images/entities/char_2009.gif) 40
40![[thin space (1/6-em)]](https://www.rsc.org/images/entities/char_2009.gif) :
:![[thin space (1/6-em)]](https://www.rsc.org/images/entities/char_2009.gif) 30, attribute: intermediate (porosity and composition).
30, attribute: intermediate (porosity and composition).
• Sample C: composition SP1![[thin space (1/6-em)]](https://www.rsc.org/images/entities/char_2009.gif) :
:![[thin space (1/6-em)]](https://www.rsc.org/images/entities/char_2009.gif) SP2
SP2![[thin space (1/6-em)]](https://www.rsc.org/images/entities/char_2009.gif) :
:![[thin space (1/6-em)]](https://www.rsc.org/images/entities/char_2009.gif) pore = 40
pore = 40![[thin space (1/6-em)]](https://www.rsc.org/images/entities/char_2009.gif) :
:![[thin space (1/6-em)]](https://www.rsc.org/images/entities/char_2009.gif) 40
40![[thin space (1/6-em)]](https://www.rsc.org/images/entities/char_2009.gif) :
:![[thin space (1/6-em)]](https://www.rsc.org/images/entities/char_2009.gif) 20, attribute: dense structure.
20, attribute: dense structure.
For sample A (high porosity), SP2 does not form a contiguous phase network, and therefore there exists no connected pathway in SP2 between inlet and outlet planes. For SP1, a volume fraction of 4.1 vol% is discontiguous. (Remark: this structure was also used in Section 2.2.1 to illustrate the contiguous phase analysis). For sample B (intermediate), the discontiguous fraction is 0.4 vol% for SP1 and 2 vol% for SP2. For sample C (dense structure), the discontiguous fraction is around 0.3 vol% for both solid phases. The pore-phase is fully contiguous for all three structures. It is worth noting that this is even true for the dense sample C, where the fully contiguous pore-phase has the same, low volume fraction (i.e., 20 vol%) as SP2 in sample A, which is fully discontiguous. A high contiguity of the pore-phase even for structures with a very low porosity is a distinct microstructure feature for structures that are realized with this sphere-packing algorithm.
In Fig. 21(a) the volume specific interface areas and in Fig. 21(b) the volume specific TPB-lengths are reported. For sample A (high porosity), the contiguous portions of the interface areas for pore–SP2, SP1–SP2 and for TPB-length are all zero. This can be attributed to the fact that SP2 in sample A is fully discontiguous, which then affects the contiguity of the corresponding interfaces with SP2. For all three structures, the contiguity of the interface properties is linked to the contiguity of the individual phases. However, the relative fractions of disconnected interface areas and TPB-lengths are significantly higher than the corresponding discontiguous volume fractions. Hence, the discontiguous part of the interfaces means that at least one of the phases joining at the interface is forming an island and is thus not active for transport. Consequently, at the disconnected interfaces, any electrochemical reaction that is coupled with transport gets blocked. For MIEC-phases, this blockage is not 100% since transport can be compensated by the complementary solid-phase. To study the impact of such microstructure effects on the anode performance, the microstructure data can be combined with a multiphysics electrode model.
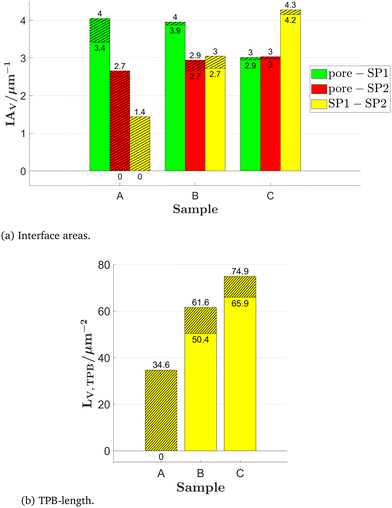 | ||
| Fig. 21 (a) Volume specific interface areas and (b) TPB-length for the virtual sphere-packing structures. The disconnected parts (islands/trapped pores) are hatched. The lower number corresponds to the contiguous and the upper number corresponds to the original interface property. Detailed definitions and description of the variables can be found in Table 2. | ||
In Fig. 22, the mean radii of bulges rmax and bottlenecks rmin are reported together with constrictivity β. Note that the constrictivity is defined as rmin2/rmax2, according to eqn (1). These three parameters are plotted for the two solid-phases, the total solid-phase and the pore-phase. In general, the mean radii of the bulges rmax (pink bar) show only a small variation for the solid-phases SP1, SP2 and SP tot in all three structures. The radii of bulges are slightly smaller than the fixed sphere radius of 0.15 m, which can be attributed to the spheres overlap. In contrast, the bottleneck radii rmin (blue bars) in the solid phases show a larger variation and a strong correlation with the phase volume fractions. For larger volume fractions, the spheres overlap is larger and therewith the bottleneck radii are also increasing. This positive correlation directly propagates into the composition dependent variation of constrictivity. Hence, when decreasing the phase volume fraction, transport in that phase is not only limited by the volume effect, but it also suffers from an increase of the bottleneck effect. For SP2 (Fig. 22(b)) in sample A (high porosity, composition 30![[thin space (1/6-em)]](https://www.rsc.org/images/entities/char_2009.gif) :
:![[thin space (1/6-em)]](https://www.rsc.org/images/entities/char_2009.gif) 20
20![[thin space (1/6-em)]](https://www.rsc.org/images/entities/char_2009.gif) :
:![[thin space (1/6-em)]](https://www.rsc.org/images/entities/char_2009.gif) 50), the mean radii of bulges and bottlenecks and the constrictivity are zero per definition due to loss of connectivity. A constrictivity of zero then also results in an M-factor of zero (according to eqn (14)), which is physically correct. For the pore-phase (Fig. 22(d)), the mean radii of the bulges and the bottlenecks both decrease with decreasing porosity. However, the decrease of the bottleneck radii is stronger, which results in lower constrictivity for lower porosities. It is worth noting that the constrictivity for the pore-phase is considerably larger than the constrictivity of the solid-phases for comparable volume fractions. For example in the dense sample C (composition 40
50), the mean radii of bulges and bottlenecks and the constrictivity are zero per definition due to loss of connectivity. A constrictivity of zero then also results in an M-factor of zero (according to eqn (14)), which is physically correct. For the pore-phase (Fig. 22(d)), the mean radii of the bulges and the bottlenecks both decrease with decreasing porosity. However, the decrease of the bottleneck radii is stronger, which results in lower constrictivity for lower porosities. It is worth noting that the constrictivity for the pore-phase is considerably larger than the constrictivity of the solid-phases for comparable volume fractions. For example in the dense sample C (composition 40![[thin space (1/6-em)]](https://www.rsc.org/images/entities/char_2009.gif) :
:![[thin space (1/6-em)]](https://www.rsc.org/images/entities/char_2009.gif) 40
40![[thin space (1/6-em)]](https://www.rsc.org/images/entities/char_2009.gif) :
:![[thin space (1/6-em)]](https://www.rsc.org/images/entities/char_2009.gif) 20), the pore-phase with 20% volume fraction shows a higher constrictivity than the solid-phases with 40% volume fraction. This is again a characteristic feature of the sphere-packing structure, where the overlap of spheres results in relatively narrow bottlenecks for the solid-phases, while this is not the case for the remaining pore-phase.
20), the pore-phase with 20% volume fraction shows a higher constrictivity than the solid-phases with 40% volume fraction. This is again a characteristic feature of the sphere-packing structure, where the overlap of spheres results in relatively narrow bottlenecks for the solid-phases, while this is not the case for the remaining pore-phase.
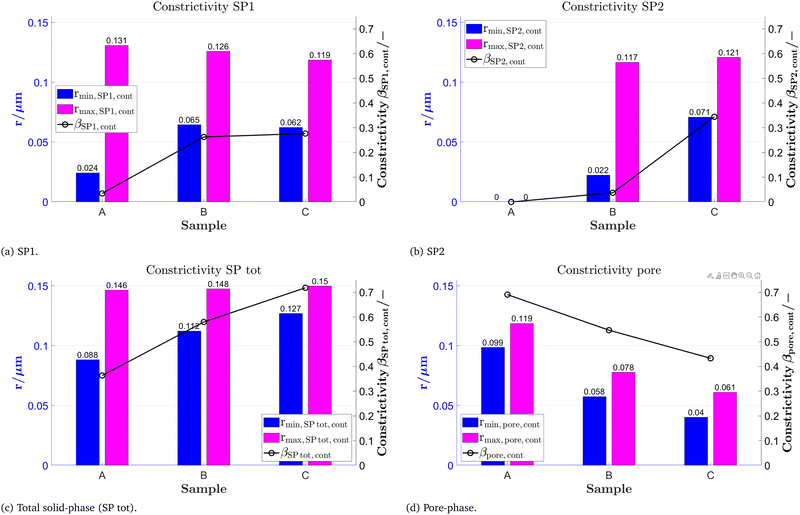 | ||
| Fig. 22 Mean radius of bottlenecks rmin, mean radius of bulges rmax and corresponding constrictivity β for (a) SP1, (b) SP2, (c) total solid-phase (SP tot) and (d) the pore-phase for the sphere-packing structures. The used variables and their definitions are summarized in Table 5. | ||
Fig. 23 shows the geodesic tortuosities, which are used for prediction of the M-factor. The results for all other tortuosity types are reported in Section H of the ESI.† Overall, the values for geodesic tortuosity vary in a relatively narrow range between 1.03 to 1.34. Exceptions in sample A (composition 30![[thin space (1/6-em)]](https://www.rsc.org/images/entities/char_2009.gif) :
:![[thin space (1/6-em)]](https://www.rsc.org/images/entities/char_2009.gif) 20
20![[thin space (1/6-em)]](https://www.rsc.org/images/entities/char_2009.gif) :
:![[thin space (1/6-em)]](https://www.rsc.org/images/entities/char_2009.gif) 50) can be attributed to the high porosity and associated low absolute volume fractions in the solid phases, which then leads to loss of connectivity. The geodesic tortuosity generally decreases with increasing phase volume fraction. However, there are other factors influencing the tortuosities as well. For example, in the intermediate sample B (composition 40
50) can be attributed to the high porosity and associated low absolute volume fractions in the solid phases, which then leads to loss of connectivity. The geodesic tortuosity generally decreases with increasing phase volume fraction. However, there are other factors influencing the tortuosities as well. For example, in the intermediate sample B (composition 40![[thin space (1/6-em)]](https://www.rsc.org/images/entities/char_2009.gif) :
:![[thin space (1/6-em)]](https://www.rsc.org/images/entities/char_2009.gif) 30
30![[thin space (1/6-em)]](https://www.rsc.org/images/entities/char_2009.gif) :
:![[thin space (1/6-em)]](https://www.rsc.org/images/entities/char_2009.gif) 30), SP2 and pore-phase have the same volume fraction, but for SP2 with poorly connected spheres, the geodesic tortuosity is τdir,geod,pore,cont = 1.34, while the geodesic tortuosity of the well-connected pore-phase is only τdir,geod,pore,cont = 1.09.
30), SP2 and pore-phase have the same volume fraction, but for SP2 with poorly connected spheres, the geodesic tortuosity is τdir,geod,pore,cont = 1.34, while the geodesic tortuosity of the well-connected pore-phase is only τdir,geod,pore,cont = 1.09.
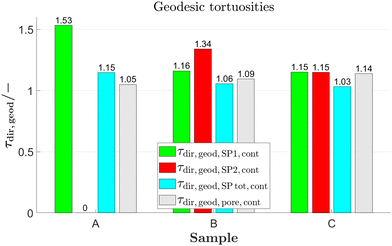 | ||
| Fig. 23 Geodesic tortuosity for SP1, SP2, total solid-phase (SP tot) and the pore-phase for the sphere-packing structures. | ||
In Fig. 24, the M-factor predictions I are reported together with the simulated M-factors. The predicted M-factors (black curves) are very similar to the simulated M-factors (red curves), which confirms that the underlying micro–macro relationships (see Table 10, eqn (13)–(18)) capture the involved microstructure effects in a reliable way. The different contributions for the M-factor prediction I from phase volume fraction (ϕ1.15), tortuosity (τ−4.39) and constrictivity (β0.37) are also shown as blue, cyan and pink bars, respectively. In principle, the M-factors correlate well with the phase volume fractions. This trend is supported by the fact, that also the contributions from tortuosity and constrictivity show a positive correlation with the phase volume fractions. However, the extent of these correlations is not the same for the solid as for the pore phases. The M-factors of the pore-phase decrease with decreasing porosity. However, the constrictivity and the tortuosity contributions remain relatively high, even for low porosities. This results in a considerably higher M-factor for the pore-phase compared to the solid-phases with the same volume fractions. This difference can be illustrated, when comparing results for pore and solid phases with the same volume fractions. For example, in sample A (composition 20![[thin space (1/6-em)]](https://www.rsc.org/images/entities/char_2009.gif) :
:![[thin space (1/6-em)]](https://www.rsc.org/images/entities/char_2009.gif) 30
30![[thin space (1/6-em)]](https://www.rsc.org/images/entities/char_2009.gif) :
:![[thin space (1/6-em)]](https://www.rsc.org/images/entities/char_2009.gif) 50) the volume fractions of the total solid-phase and the pore-phase are both 50%, but the M-factor of the pore-phase is higher by a factor of 2.4 (comparing M-factors of sample A in Fig. 24(c) and (d)). In a similar way, in the intermediate sample B (composition 40
50) the volume fractions of the total solid-phase and the pore-phase are both 50%, but the M-factor of the pore-phase is higher by a factor of 2.4 (comparing M-factors of sample A in Fig. 24(c) and (d)). In a similar way, in the intermediate sample B (composition 40![[thin space (1/6-em)]](https://www.rsc.org/images/entities/char_2009.gif) :
:![[thin space (1/6-em)]](https://www.rsc.org/images/entities/char_2009.gif) 30
30![[thin space (1/6-em)]](https://www.rsc.org/images/entities/char_2009.gif) :
:![[thin space (1/6-em)]](https://www.rsc.org/images/entities/char_2009.gif) 30), SP2 and pores both have a volume fraction of 30%, but the M-factor of the pore-phase is higher by factor of 7.1 (comparing the M-factors for sample B in Fig. 24(b) and (d)).
30), SP2 and pores both have a volume fraction of 30%, but the M-factor of the pore-phase is higher by factor of 7.1 (comparing the M-factors for sample B in Fig. 24(b) and (d)).
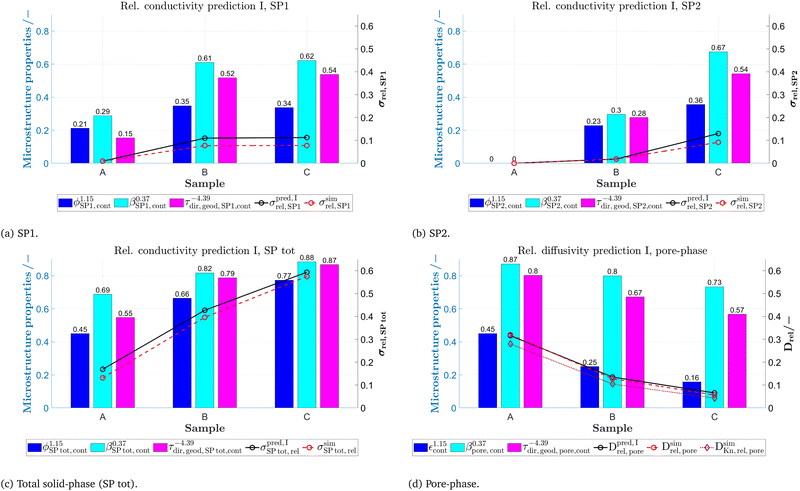 | ||
| Fig. 24 M-factor prediction I (black lines) and its three components (volume fraction effect ϕ1.15, constrictivity effect β0.37 and tortuosity effect τdir,geod−4.39) and simulated M-factors (red lines), for (a) SP1, (b) SP2, (c) total solid-phase (SP tot) and (d) the pore-phase of the sphere-packing structures. The used variables are summarized in the Tables 9 and 10. | ||
These results clearly illustrate the effect of the poorly connected solid-phases in microstructures that are created with a sphere-packing algorithm, resulting in a considerably lower M-factor for the solid-phases compared to the pore-phase. However, this poor connectivity of particles cannot be observed for sintered materials such as the LSTN–CGO dataset, where the M-factors of the pore-phase and the solid-phases are in the same range for comparable volume fractions. The particles of the sintered solid-phases are better connected than in the structures from sphere-packing, which leads to higher M-factors. For example, SP1 (CGO) for the CGO60–LSTN40 structure with a volume fraction of 36.7% shows an M-factor 0.167, while SP1 of the sphere-packing structure B with a volume fraction of 40% shows a much lower M-factor of 0.077. The M-factors for the pore-phases are in a similar range for the LSTN–CGO and the sphere-packing structures, when samples with similar volume fractions are compared. In summary, these comparisons already show that simple sphere-packing structures are not an appropriate representation for the LSTN–CGO structures. A more suitable approach for digital microstructure twins for SOC electrodes are e.g., pluri-Gaussian models (see e.g., Moussaoui et al.26 or Neumann et al.27), which will be discussed in detail in a separate publication of this series. For the whole sphere-packing dataset, prediction I corresponds well to the simulated M-factors, which shows that the argumentation with the contributions for the phase volume fraction, tortuosity and constrictivity is valid. The M-factors for prediction II are very similar to those of prediction I and are reported in Section H of the ESI.†
If it is assumed that the solid phases of the sphere-packing samples consist of materials with MIEC properties (like the LSTN–CGO anodes), the composite conductivity of the total solids is more relevant for the anode performance than the single-phase conductivity of SP1 and SP2. In Fig. 25, the relative ionic and electronic composite conductivities for the total solid-phase are reported (as green and red bars, respectively), according to the definitions in Section 2.3.2. The ratio of the intrinsic electronic conductivities of SP1 and SP2 are defined as λeon = σ0,eon,SP1/σ0,eon,SP2 = 0.1 and their ratio of the intrinsic ionic conductivities as λion = σ0,ion,SP2/σ0,ion,SP1 = 0.1. As a reference, the relative single-phase conductivities (M-factors) of SP1, SP2 and the total solid-phase SP tot are reported as line-plots. As expected, the relative composite conductivities (for the total solid-phase) are larger than the corresponding single-phase conductivities (M-factors of SP1 and SP2), but lower than the relative conductivity (M-factor) of the total solid-phase. We restrict our discussion to a selection of important points. Thereby, it should be remembered that SP1 (CGO) is the phase with a higher intrinsic ionic conductivity, whereas SP2 (LSTN) has a higher intrinsic electronic conductivity. For the high porous structure A (composition 30![[thin space (1/6-em)]](https://www.rsc.org/images/entities/char_2009.gif) :
:![[thin space (1/6-em)]](https://www.rsc.org/images/entities/char_2009.gif) 20
20![[thin space (1/6-em)]](https://www.rsc.org/images/entities/char_2009.gif) :
:![[thin space (1/6-em)]](https://www.rsc.org/images/entities/char_2009.gif) 50), SP2 does not percolate (i.e., the single-phase conductivity is zero), but still an electronic composite conductivity of σrel,eon,comp = 0.029 remains. Note that SP1 also owns an electronic conductivity, which is 10 times lower than that of SP2 and only contributes a value of 0.0009 from its single-phase electronic conductivity. However, in a composite MIEC anode, SP1 is able to bridge the non-percolating spheres of SP2, which results in the significantly higher electronic composite conductivity. For the intermediate structure B (composition 40
50), SP2 does not percolate (i.e., the single-phase conductivity is zero), but still an electronic composite conductivity of σrel,eon,comp = 0.029 remains. Note that SP1 also owns an electronic conductivity, which is 10 times lower than that of SP2 and only contributes a value of 0.0009 from its single-phase electronic conductivity. However, in a composite MIEC anode, SP1 is able to bridge the non-percolating spheres of SP2, which results in the significantly higher electronic composite conductivity. For the intermediate structure B (composition 40![[thin space (1/6-em)]](https://www.rsc.org/images/entities/char_2009.gif) :
:![[thin space (1/6-em)]](https://www.rsc.org/images/entities/char_2009.gif) 30
30![[thin space (1/6-em)]](https://www.rsc.org/images/entities/char_2009.gif) :
:![[thin space (1/6-em)]](https://www.rsc.org/images/entities/char_2009.gif) 30), we can observe that the composite conductivity effect (i.e., difference between single-phase and composite conductivities) is generally larger if the phase with the better conductivity owns the lower volume fraction. The relative ionic composite conductivity is two times higher the relative single-phase conductivity of SP1 with the larger volume fraction. However, the relative electronic composite conductivity exceeds the relative single-phase conductivity of SP2 with the lower volume fraction by a factor of 6, which is a much larger effect.
30), we can observe that the composite conductivity effect (i.e., difference between single-phase and composite conductivities) is generally larger if the phase with the better conductivity owns the lower volume fraction. The relative ionic composite conductivity is two times higher the relative single-phase conductivity of SP1 with the larger volume fraction. However, the relative electronic composite conductivity exceeds the relative single-phase conductivity of SP2 with the lower volume fraction by a factor of 6, which is a much larger effect.
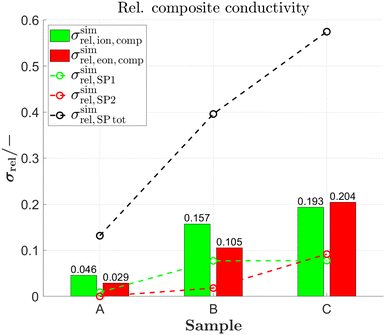 | ||
| Fig. 25 Green and red bars show the relative ionic and electronic composite conductivities for the total solid-phase with λeon = λion = 0.1, reported for the sphere-packing structures. As a reference, the relative single-phase conductivities (M-factors) of the SP1, SP2 and the total solid-phase (SP tot) are reported as line-plots. Note: σsimrel,SPtot corresponds to the reference case where SP1 and SP2 have the same intrinsic conductivities (i.e., λeon = λion = 1). The used variables are summarized in Table 11. | ||
Remark: additional characteristics for the pore-phase associated with gas permeability and Knudsen diffusion are reported in Section H of the ESI.†
4 Conclusion
In this contribution, we present a standardized and automated workflow for the microstructure characterization of SOC electrodes. With an app running in GeoDict, 3D microstructures can be analysed quantitatively, either on a local computer (sequentially) or, for badges with many microstructures, in the cloud (parallel). The microstructure characterization is applicable for all the relevant electrode types (e.g., Ni-YSZ, Ni–CGO, titanate-CGO, YSZ-LSM etc.). Thereby, a large number of microstructure properties is collected for the two solid-phases, for the pore-phase and for the interfaces. The input for standardized characterization consists of 3D images, either from tomography (real) or from stochastic geometry modeling (virtual). The app for standardized characterization is based on a modular architecture, which enables to choose characteristics and properties of interest selectively (e.g., it is possible to analyse only the properties of the pore-phase). A series of modules is based on quantitative image analysis for determination of microstructure characteristics (e.g., various types of tortuosities, phase volume fractions, surface/interface areas, TPB-lengths etc.). A second series of modules is based on numerical transport simulations in order to determine the relative/effective transport properties (e.g., electronic/ionic conductivity of solid-phases, gas diffusivity in pores etc.). The relative/effective properties for the gas and charge transport are determined in two ways: (a) using numerical transport simulations providing a high accuracy and (b) using predictions based on empirical equations that include morphological parameters (microstructure characteristics), revealing the limiting effects of specific microstructure features on the transport properties. For composite electrodes with mixed ionic-electronic conducting phases (MIECs), the specific charge transports (e.g., electronic or ionic) take place in both solid-phases (e.g., CGO and titanate), which have different intrinsic transport properties. The characterization-app is capable to compute the composite conductivity for different material scenarios (e.g., composite electrode with either two MIECs or, alternatively, with one MIEC and a single-phase conductor such as CGO-Ni).The outcome of standardized microstructure characterization is illustrated for a dataset of three real microstructures (i.e., 3D reconstruction of LSTN–CGO anodes from tomography) and for a set of three virtual microstructures (i.e., relatively simple microstructures obtained by sphere-packing). The LSTN–CGO structures are well connected and all phases are still percolating to a large degree, even for phase volume fractions below 15%. In contrast, the virtual sphere-packing structures show a complete loss of percolation already for a solid-phase volume fraction of 20%. Consequently, the relative conductivity of the well-connected LSTN–CGO structures is generally higher for comparable phase volume fractions compared to the sphere-packing structures with distinct bottlenecks. This bad connection of particles in the sphere-packing structures also leads to a significantly higher M-factor for the pore-phase compared to the solid-phases (with comparable phase volume fractions). In contrast, for the LSTN–CGO structures, the M-factors for the solid-phases are only marginally lower than the M-factors for the pore-phase. These different transport limitations can be analysed and explained with the morphological parameters (e.g., phase volume fractions, tortuosity and constrictivity) very well, which demonstrates the added value of the morphological analysis compared to the more accurate but less informative results from numerical simulations. These results illustrate that a well sintered structure as commonly present in SOC electrodes can hardly be described appropriately with a simple sphere-packing approach. Thus, alternative methods as e.g., structure generation based on a pluri-Gaussian model have been reported (e.g., by Moussaoui et al.,26 Neumann et al.27) to match SOC-structures more naturally. The construction of stochastic digital microstructure twins based on this method will be described in a further publication in this series.
Recent advances and trends in tomography and stochastic modeling call for a standardized and automated microstructure characterization. Advances in FIB-SEM tomography enable the acquisition of more samples. Nevertheless, 3D-imaging is still expensive in terms of time and costs and the availability of 3D-structures from tomography still represents a bottleneck for the data-driven microstructure optimization. However, it is expected that open science concepts will result in a tremendous increase of publicly available 3D-microstructure data of energy materials. In order to make reasonable comparisons of these 3D-microstructures from different sources and to make reliable statistical analyses, these structures need to be analysed with standardized 3D image processing tools. Thereby, the presented characterization tool can serve as a basis for efficient and reproducible 3D analysis of SOC microstructures. The characterization-app is fully automatized in GeoDict, which minimizes the needed effort. Moreover, the commercial GeoDict platform guaranties the long-term maintenance and availability of the SOC characterization. The application fields for the standardized characterization tool are versatile and flexible. For example, the emerging methods for Digital Materials Design (DMD) enable to create numerous virtual but realistic microstructure scenarios of SOC electrodes using stochastic microstructure modeling and to test them with multiphysics electrode simulations. For such a DMD workflow, many virtual microstructures need to be characterized. Thus, the availability of a standardized, efficient and automated microstructure characterization tool is a crucial prerequisite for such data-driven optimizations of energy materials. Furthermore, big data from real and from virtual microstructures also represents a suitable basis for microstructure optimization by statistical analysis and/or artificial intelligence (AI) methods. Moreover, the presented characterization of SOC electrodes could easily be adapted to other energy applications like PEM fuel cells, Li-ion batteries or flow batteries. Thus, the standardized and automated microstructure characterization is a key element to exploit the full potential of open science, Digital Materials Design (DMD) and artificial intelligence (AI) for the data-driven optimization of SOC electrodes and beyond by providing standardized high quality microstructure property data.
Author contributions
Philip Marmet: conceptualization, methodology, formal analysis, software, writing – original draft. Lorenz Holzer: conceptualization, methodology, investigation, funding acquisition, project administration, supervision, writing – review and editing. Thomas Hocker, Gernot K. Boiger, Holger Bausinger, Andreas Mai, Joseph M. Brader: methodology, funding acquisition, project administration, supervision, writing – review and editing. Mathias Fingerle, Sarah Reeb, Dominik Michel: methodology, funding acquisition, project administration, software, writing – review and editing.Conflicts of interest
There are no conflicts to declare.Acknowledgements
This publication is based mainly on two research projects that received financial support from the Swiss Federal Office of Energy (SFOE, grant SI/501792-01 – 8100076) and from Eurostars (grant E!115455). Furthermore, the tomography data of LSTN–CGO anodes presented in this publication, originate from a previous research project funded by SNSF (grant 407040_154047, NRP 70 “Energy Turnaround”). The LSTN powder was synthesized by A. Heel and D. Burnat (ZHAW/IMPE). The acquisition of FIB-SEM tomography was performed at ETH Zurich (ScopeM) by Ph. Gasser. All financial supports (SFOE, Eurostars, SNSF) and experimental contributions from ETHZ (ScopeM) and ZHAW (IMPE) are gratefully acknowledged.References
- GeoDict simulation software Release 2022, by Math2Market GmbH, Germany DOI:10.30423/release.geodict2022.
- P. Marmet, L. Holzer, T. Hocker, G. K. Boiger, H. Bausinger, A. Mai, M. Fingerle, S. Reeb, D. Michel and J. M. Brader, Characterization-app: Standardized microstructure characterization of SOC electrodes as a key element for Digital Materials Design, 2023 DOI:10.5281/zenodo.7741305.
- L. Shu, J. Sunarso, S. S. Hashim, J. Mao, W. Zhou and F. Liang, Int. J. Hydrogen Energy, 2019, 44, 31275–31304 CrossRef CAS.
- D. Burnat, G. Nasdaurk, L. Holzer, M. Kopecki and A. Heel, J. Power Sources, 2018, 385, 62–75 CrossRef CAS.
- R. Price, M. Cassidy, J. G. Grolig, A. Mai and J. T. S. Irvine, J. Electrochem. Soc., 2019, 166, F343–F349 CrossRef CAS.
- A. Sciazko, Y. Komatsu, R. Yokoi, T. Shimura and N. Shikazono, J. Eur. Ceram. Soc., 2022, 42, 1556–1567 CrossRef CAS.
- Y. Matsuzaki and I. Yasuda, Solid State Ionics, 2000, 132, 261–269 CrossRef CAS.
- D. Fouquet, A. C. Müller, A. Weber and E. Ivers-Tiffée, Ionics, 2003, 9, 103–108 CrossRef CAS.
- H. He and J. M. Hill, Appl. Catal., A, 2007, 317, 284–292 CrossRef CAS.
- L. Holzer, B. Iwanschitz, T. Hocker, B. Münch, M. Prestat, D. Wiedenmann, U. Vogt, P. Holtappels, J. Sfeir, A. Mai and T. Graule, J. Power Sources, 2011, 196, 1279–1294 CrossRef CAS.
- M. S. Khan, S. B. Lee, R. H. Song, J. W. Lee, T. H. Lim and S. J. Park, Ceram. Int., 2016, 42, 35–48 CrossRef CAS.
- F. Yu, J. Xiao, Y. Zhang, W. Cai, Y. Xie, N. Yang, J. Liu and M. Liu, Appl. Energy, 2019, 256, 113910 CrossRef CAS.
- L. Holzer, P. Marmet, M. Fingerle, A. Wiegmann, M. Neumann and V. Schmidt, Tortuosity and microstructure effects in porous media: classical theories, empirical data and modern methods, Springer, Cham, 1st edn, 2023 Search PubMed.
- S. J. Cooper, A. Bertei, P. R. Shearing, J. A. Kilner and N. P. Brandon, SoftwareX, 2016, 5, 203–210 CrossRef.
- M. Ebner and V. Wood, J. Electrochem. Soc., 2015, 162, A3064–A3070 CrossRef CAS.
- B. Münch and L. Holzer, J. Am. Ceram. Soc., 2008, 91, 4059–4067 CrossRef.
- G. Gaiselmann, M. Neumann, V. Schmidt, O. Pecho, T. Hocker and L. Holzer, AIChE J., 2014, 60, 1983–1999 CrossRef CAS.
- L. Holzer, O. Stenzel, O. Pecho, T. Ott, G. Boiger, M. Gorbar, Y. de Hazan, D. Penner, I. Schneider, R. Cervera and P. Gasser, Mater. Des., 2016, 99, 314–327 CrossRef CAS.
- M. Neumann, O. Stenzel, F. Willot, L. Holzer and V. Schmidt, Int. J. Solids Struct., 2020, 184, 211–220 CrossRef.
- B. Prifling, M. Röding, P. Townsend, M. Neumann and V. Schmidt, Front. Mater., 2021, 8, 1–21 Search PubMed.
- O. Stenzel, O. Pecho, L. Holzer, M. Neumann and V. Schmidt, AIChE J., 2016, 62, 1834–1843 CrossRef CAS.
- O. Stenzel, O. Pecho, L. Holzer, M. Neumann and V. Schmidt, AIChE J., 2017, 63, 4224–4232 CrossRef CAS.
- A. Blumer, S. Rief and B. Planas, GeoDict 2022 User Guide. MatDict handbook, Math2Market GmbH, Germany, 2022, DOI:10.30423/userguide.geodict.
- J. Ohser and F. Mücklich, Statistical Analysis of Microstructures in Materials Science, Wiley and Sons, 2000, p. 115 Search PubMed.
- L. Holzer, D. Wiedenmann, B. Münch, L. Keller, M. Prestat, P. Gasser, I. Robertson and B. Grobéty, J. Mater. Sci., 2013, 48, 2934–2952 CrossRef CAS.
- H. Moussaoui, J. Laurencin, Y. Gavet, G. Delette, M. Hubert, P. Cloetens, T. Le Bihan and J. Debayle, Comput. Mater. Sci., 2018, 143, 262–276 CrossRef CAS.
- M. Neumann, B. Abdallah, L. Holzer, F. Willot and V. Schmidt, Transp. Porous Media, 2019, 128, 179–200 CrossRef.
- M. Neumann, M. Osenberg, A. Hilger, D. Franzen, T. Turek, I. Manke and V. Schmidt, Comput. Mater. Sci., 2019, 156, 325–331 CrossRef CAS.
- C. Lantuejoul and S. Beucher, J. Microsc., 1981, 121, 39–49 CrossRef.
- C. J. Gommes, A. J. Bons, S. Blacher, J. H. Dunsmuir and A. H. Tsou, AIChE J., 2009, 55, 2000–2012 CrossRef CAS.
- A. Koponen, M. Kataja and J. Timonen, Phys. Rev. E: Stat. Phys., Plasmas, Fluids, Relat. Interdiscip. Top., 1996, 54, 406–410 CrossRef CAS PubMed.
- M. Matyka and Z. Koza, AIP Conf. Proc., 2011, 1453, 17–22 Search PubMed.
- L. Holzer, B. Münch, B. Iwanschitz, M. Cantoni, T. Hocker and T. Graule, J. Power Sources, 2011, 196, 7076–7089 CrossRef CAS.
- L. Holzer, B. Iwanschitz, T. Hocker, L. Keller, O. Pecho, G. Sartoris, P. Gasser and B. Muench, J. Power Sources, 2013, 242, 179–194 CrossRef CAS.
- O. M. Pecho, O. Stenzel, B. Iwanschitz, P. Gasser, M. Neumann, V. Schmidt, M. Prestat, T. Hocker, R. J. Flatt and L. Holzer, Materials, 2015, 8, 5554–5585 CrossRef CAS PubMed.
- M. Neumann, O. Furat, D. Hlushkou, U. Tallarek, L. Holzer and V. Schmidt, Communications in Computer and Information Science, 2018, pp. 145–158 Search PubMed.
- L. Holzer, O. Pecho, J. Schumacher, P. Marmet, O. Stenzel, F. N. Büchi, A. Lamibrac and B. Münch, Electrochim. Acta, 2017, 227, 419–434 CrossRef CAS.
- P. Marmet, Digital Materials Design of Solid Oxide Fuel Cell Anodes, PhD thesis, University of Fribourg, Switzerland, 2023 Search PubMed.
- R. Krishna and J. A. Wesselingh, Chem. Eng. Sci., 1997, 52, 861–911 CrossRef CAS.
- S. Liu, W. Kong and Z. Lin, J. Power Sources, 2009, 194, 854–863 CrossRef CAS.
- A. Bertei and C. Nicolella, J. Power Sources, 2015, 279, 133–137 CrossRef CAS.
- M. Kishimoto, M. Lomberg, E. Ruiz-Trejo and N. P. Brandon, Electrochim. Acta, 2016, 190, 178–185 CrossRef CAS.
- P. Marmet, L. Holzer, J. G. Grolig, H. Bausinger, A. Mai, J. M. Brader and T. Hocker, Phys. Chem. Chem. Phys., 2021, 23, 23042–23074 RSC.
- T. Nakamura, K. Yashiro, A. Kaimai, T. Otake, K. Sato, T. Kawada and J. Mizusaki, J. Electrochem. Soc., 2008, 155, B1244–B1250 CrossRef CAS.
- C. Graves, L. Martinez and B. R. Sudireddy, ECS Trans., 2016, 72, 183–192 CrossRef CAS.
- A. Nenning, M. Holzmann, J. Fleig and A. K. Opitz, Mater. Adv., 2021, 2, 5422–5431 RSC.
- D. Burnat, R. Kontic, L. Holzer, P. Steiger, D. Ferri and A. Heel, J. Mater. Chem. A, 2016, 4, 11939–11948 RSC.
- A. Heel, D. Burnat and L. Holzer, NRP70, Energy Turnaround, 2023, https://www.nfp-energie.ch/en/projects/977/ Search PubMed.
- B. C. Steele, Solid State Ionics, 2000, 129, 95–110 CrossRef CAS.
- X. Zhou, N. Yan, K. T. Chuang and J. Luo, RSC Adv., 2014, 4, 118–131 RSC.
Footnotes |
| † Electronic supplementary information (ESI) available. See DOI: https://doi.org/10.1039/d3ya00132f |
| ‡ Present address: Celeroton AG, CH-8604 Volketswil, Switzerland. |
| § Present address: Topsoe Germany GmbH, Alfredstrasse 81, 45130 Essen, Germany. |
| This journal is © The Royal Society of Chemistry 2023 |


