Effects of hydrophobic side chains in poly(fluorenyl-co-aryl piperidinium) ionomers for durable anion exchange membrane fuel cells†
Chuan
Hu‡
,
Jong Heyong
Park‡
 ,
Na Yoon
Kang
,
Xiaohua
Zhang
,
Young Jun
Lee
,
Seung Won
Jeong
and
Young Moo
Lee
,
Na Yoon
Kang
,
Xiaohua
Zhang
,
Young Jun
Lee
,
Seung Won
Jeong
and
Young Moo
Lee
 *
*
Department of Energy Engineering, College of Engineering, Hanyang University, Seoul, 04763, Republic of Korea. E-mail: ymlee@hanyang.ac.kr
First published on 5th January 2023
Abstract
Durable and conductive catalyst layers are critical for anion exchange membrane fuel cells (AEMFCs) to achieve high power density and sufficient lifespan. Great efforts have been devoted to improving the quality of anion exchange membranes (AEMs), while research on ionomer design has rarely been reported. Here, we propose a convenient strategy to improve the stability of fuel cells by introducing hydrophobic side chains in poly(fluorenyl-co-aryl piperidinium) (PFAP) ionomers to promote dimensional stability and electrochemical stability of the catalyst layers. We systemically studied the effects of hydrophobic side chain length, grafting position, and polymer backbone on the physical and electrochemical properties of ionomers. Specifically, ionomers with hydrophobic side chains naturally possess decreased water adsorption and improved dimensional stability. The polymers with hydrophobic side chains grafted on the piperidinium group (s-PFAP-Pip-Cx, x denotes the side chain carbon length) possess limited alkaline stability and hydroxide conductivity (<90 mS cm−1 at 80 °C). Conversely, polymers with hydrophobic side chains grafted onto the fluorene monomer (s-PFAP-FLN-Cx) possess improved dimensional stability (swelling ratio <50% vs. reference poly(fluorenyl-co-biphenyl piperidinium) of 90%) and conductivity (>134 mS cm−1 at 80 °C) and good mechanical properties (tensile strength >60 MPa, Young's modulus >1000 MPa) and electrochemical stability. Importantly, s-PFBP-FLN-C8 ionomer-based fuel cells showed a remarkable peak power density of 2.607 W cm−2 at 80 °C. Moreover, the s-PFBP-FLN-C8 ionomer-based fuel cell exhibited a 26 times lower voltage decay rate than the benchmark fuel cell with PFBP ionomer after operating at a constant current density of 0.6 A cm−2 at 70 °C.
Introduction
With deterioration of living environments and shortages of fossil fuels, hydrogen fuel cells have attracted much attention due to their high energy conversion efficiency and environmentally-friendly properties.1–5 Among them, anion exchange membrane fuel cells (AEMFCs) have emerged as a promising successor to commercial proton exchange membrane fuel cells (PEMFCs) due to the alkaline operating environment, which allows the AEMFCs to utilize low-cost non-platinum group metal (PGM) catalysts and hydrocarbon-based electrolytes.6,7 However, the majority of AEMFCs shows insufficient power density and in situ durability due to the lack of qualified alkaline polymer electrolytes (APEs).4To develop high-performance APEs, those with different polymer backbones and cationic groups have been widely studied in the past decades.8–12 Numerous studies have revealed that polymer backbones containing ether groups and electron-withdrawing groups are vulnerable to alkaline conditions, which accelerates their degradation.13,14 Very recently, ether-free APEs have been documented to possess exceptional chemical stability and ionic conductivity.15–18 Tang and co-workers designed a series of cobaltocenium-containing polyolefins, which displayed remarkable alkaline stability (maintained 95% conductivity at 1 M NaOH, 80 °C for one month) and conductivity (90 mS cm−1 at 90 °C).11 Yan and co-workers reported several types of poly(aryl piperidinium)-based APEs with an outstanding conductivity of 193 mS cm−1 at 95 °C and alkaline stability.18 Recently, our group developed a series of poly(aryl-co-terphenyl piperidinium) copolymers that exhibited promising conductivity greater than 150 mS cm−1 at 80 °C and durable alkaline stability at 1, 5, and 10 M NaOH solutions for longer than 1000 h.16,19–21 Although the state-of-the-art APEs have advanced in parallel to commercial proton exchange membranes (PEMs), it is rare that the reported AEMFCs simultaneously possess a power density greater than 1.5 W cm−2 and excellent in situ durability.22–24
Water (the reactant and product of electrode reactions) greatly affects the performance and longevity of AEMFCs.25,26 As is widely documented, water management in AEMFCs is more challenging than in PEMFCs.23,27 Specifically, the water generation reaction at the anode and the water consumption reaction at the cathode exacerbate the water imbalance between the two electrodes.28 Thus, AEMFCs simultaneously face challenges of anode flooding and cathode dehydration when the fuel cell is operated at high current density.29 An anode ionomer with high swelling ratio and water uptake will block the porous structure of the catalyst layer, resulting in increased mass transport resistance.30 Moreover, the water adsorption and dehydration process of the ionomer will impair the stability of catalyst layers, causing exfoliation of catalyst layers and aggregation of catalyst particles.31,32 On the cathode side, dehydration aggravates the nucleophilicity of OH−, which accelerates the degradation of ionomers.33 Therefore, an ionomer with high chemical stability and a low swelling ratio is critical for achieving high-performance AEMFCs and long-term operation. Zhuang and co-workers designed a series of fluorine-containing polymers for use as anode ionomers.34 The hydrophobic ionomer well addressed the water flooding issue at the anode and greatly promoted the stability of fuel cells. Yan and co-workers reported a strategy to enhance the stability of ionomers by applying a hydrophobic flexible spacer on the polymer backbones.35 Similarly, Kim et al. revealed that the formation of harsh alkaline environments in the cathode mainly caused degeneration of fuel cell performance, and applying a hydrophobic alkyl spacer in the cathode ionomer backbone greatly improved the durability of AEMFCs.33
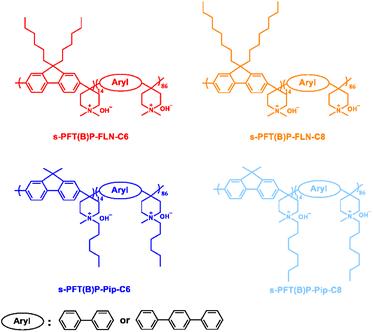
In this work, we prepared a series of poly(fluorenyl-co-aryl piperidinium) (PFAP)-based ionomers with different lengths of hydrophobic alkyl spacers located at different positions to realize highly durable AEMFCs, as shown in Fig. 1. Poly(dibenzyl-co-terphenyl piperidinium) (PDTP) was selected as the AEM due to its high ionic conductivity (166 mS cm−1 at 80 °C), durable alkaline stability, and mechanical properties.16,36,37 Introduction of hydrophobic spacers greatly limited the swelling and water adsorption of ionomers. The effects of hydrophobic alkyl spacer length and location in PFAP ionomers on water uptake, swelling ratio, ionic conductivity, alkaline stability, power density, and in situ durability were studied.
Results and discussion
Polymer synthesis and characterization
To verify the effects of the location of alkyl side chains on the properties of ionomer, PFAP ionomers with alkyl spacers attached to piperidinium groups and fluorenyl monomers were synthesized. These are referred to as s-PFAP-Pip-Cx and s-PFAP-FLN-Cx (x = 6, 8), respectively, where x denotes the carbon length of the alkyl spacer (see Fig. 1). The synthesis processes of these polymers are displayed in Scheme S1,† which are similar to our previous reports.16,19The chemical structures of the synthesized polymers were confirmed via1H NMR using DMSO-d6 as solvent (see Fig. S1–3†). Specifically, the peaks that appeared at 0.4–0.8 ppm are associated with the protons from the alkyl side chain, suggesting successful introduction of the side chain monomer into the s-PFAM-FLN-Cx polymers (before quaternization) (see Fig. S1†). After quaternization, the characteristic peak of protons from the methyl group appeared at 3.11 ppm, confirming the successful reaction (Fig. S2†). Similarly, the characteristic peaks of s-PFAP-Pip-Cx showed a one-to-one correspondence with chemical structures, indicating successful polymer synthesis (Fig. S3†). Good solubility is critical for ionomers to prepare catalyst inks. Table S1† summarizes the solubility of ionomers in common organic solvents. All the polymers were well dissolved in DMSO and DMF.
Water uptake, swelling ratio, and conductivity
The water uptake (WU,%), swelling ratio (SR,%), and hydroxide conductivity of PFAPs (benchmarks, poly(fluorenyl-co-terphenyl piperidinium) (PFTP), and poly(fluorenyl-co-biphenyl piperidinium) (PFBP) without side chains) and s-PFAPs (side chain type polymers presented in this work) are displayed in Fig. 2 as a function of temperature. Due to the introduction of hydrophobic side chains, s-PFAP membranes possess much lower WU than that of benchmarks (see Fig. 2a and b). Particularly, the s-PFBP-Pip-C8 membrane achieved a WU of 25.2% at room temperature, which is around 1/12th that of the benchmark PFBP (WU: 300% at room temperature) and 1/9th that of s-PFBP-FLN-C8 (WU: 230% at room temperature). The low WU of s-PFBP-Pip-Cx was attributed to their low ion exchange capacity (IEC, see Table 1). A similar phenomenon was observed in s-PFTP polymers (Fig. 2b). Generally, the introduction of hydrophobic side chain on PFTP polymers shows a smaller impact on SR than that of PFBP polymers, which attributes to pristine PFTP's low SR and rigid backbone.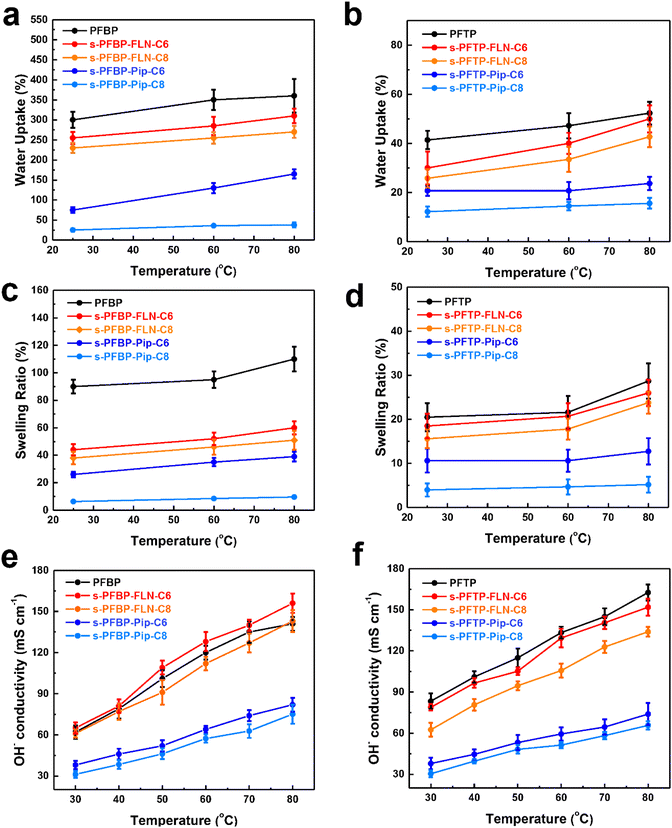 | ||
| Fig. 2 Water uptake (a and b), swelling ratio (c and d), and hydroxide conductivity (e and f) of PFAP and s-PFAPs in OH− form as a function of temperature. | ||
| IEC (meq g−1) | WU (%)b | SR (%)b | TS (MPa) | EB (%) | YM (MPa) | σ (mS cm−1)c | η (dL g−1) | |
|---|---|---|---|---|---|---|---|---|
| a TS: tensile strength; EB: elongation at break; YM: Young's modulus; σ: OH- conductivity; η: intrinsic viscosity. b Measured at room temperature. c Measured at 80 °C. | ||||||||
| PFBP | 3.43 | 300 ± 20.2 | 90 ± 5 | 53 | 14 | 692 | 141.3 ± 5 | 3.5 |
| s-PFBP-FLN-C6 | 3.22 | 255 ± 15.1 | 44 ± 4 | 76.4 | 14 | 1197 | 156.5 ± 4 | 3.9 |
| s-PFBP-FLN-C8 | 3.14 | 230 ± 12.7 | 38 ± 4.6 | 66.5 | 16 | 1014 | 143.2 ± 3 | 4.8 |
| s-PFBP-Pip-C6 | 2.8 | 75 ± 7.1 | 26 ± 2 | 37.2 | 18.3 | 513 | 82.4 ± 3 | 3.9 |
| s-PFBP-Pip-C8 | 2.59 | 25.2 ± 3.1 | 6.3 ± 0.5 | 18.9 | 13.1 | 260 | 75.1 ± 2.5 | 2.4 |
| PFTP | 2.78 | 41.4 ± 3.7 | 20.5 ± 3.2 | 62.4 | 25.8 | 1118 | 163.1 ± 5.7 | 4.1 |
| s-PFTP-FLN-C6 | 2.66 | 30 ± 6.7 | 18.5 ± 2.8 | 93.2 | 24.6 | 1331 | 151.7 ± 2.3 | 4.6 |
| s-PFTP-FLN-C8 | 2.6 | 25.8 ± 3.7 | 15.6 ± 2.1 | 79.4 | 23.6 | 1115 | 134.5 ± 5.1 | 4.7 |
| s-PFTP-Pip-C6 | 2.36 | 20.7 ± 2.1 | 10.6 ± 2.7 | 36.5 | 18.6 | 651 | 73.9 ± 4.2 | 3.8 |
| s-PFTP-Pip-C8 | 2.22 | 12.2 ± 2.1 | 4.2 ± 1.5 | 31.2 | 19.2 | 349 | 65.7 ± 2.6 | 3.7 |
The dimensional stability of an ionomer is critical for long-term operation of the fuel cell.31,32 Ionomers with excessive SR will degrade the physical stability of catalyst layers, causing collapse and detachment. Additionally, excessively swollen ionomers will block the gas channel, resulting in high mass transfer resistance.30 As displayed in Fig. 2c, the SR of s-PFBP membranes was lower than 60% at 80 °C, which is half of the PFBP. Specifically, the s-PFBP-Pip-C8 membrane achieved the lowest SR of 9.6% at 80 °C due to its low IEC and the long hydrophobic side chain, which decreases the hydrophilicity of expected. A similar trend was observed in s-PFTP membranes, as shown in Fig. 2d. Compared to s-PFBP membranes, s-PFTP membranes showed much lower SR (<25% at 80 °C) due to the rigid terphenyl monomer in the backbone, which prohibits swelling of the membranes.
Fig. 2e and f shows the hydroxide conductivity of PFAP and s-PFAPs as a function of temperature. s-PFAP-Pip-Cx membranes show an obvious conductivity loss (<85 mS cm−1 at 80 °C) after the alkyl spacer was attached to the piperidinium group, which is attributed to loss of ion transport channels by alkyl chains in piperidinium. Conversely, s-PFAP-FLN-Cx membranes achieved a high conductivity greater than 120 mS cm−1 at 80 °C. Specifically, s-PFBP-FLN-C6 possesses an improved conductivity of 156 mS cm−1 compared to PFBP (141 mS cm−1 at 80 °C) due to the improved dimensional stability. The excessive swelling ratio is believed to dilute the ionic concentration resulting in decreased conductivity.38,39 On the other hand, s-PFTP-FLN-Cx displayed a slightly decreased conductivity compared to that of PFTP, which is attributed to the limited WU.
Morphology
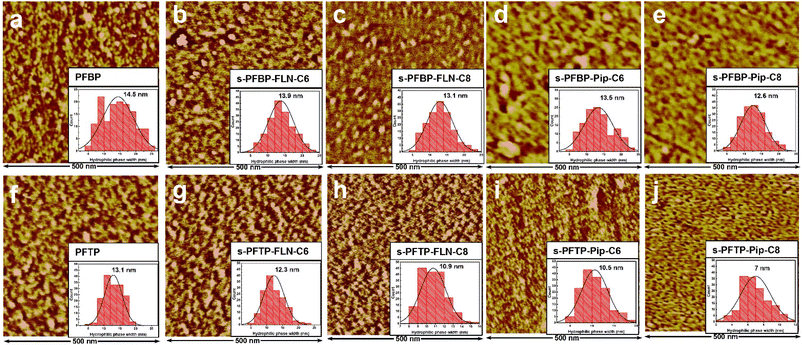
The surface morphologies of PFAP and s-PFAP membranes were observed using atomic force microscopy (AFM) in tapping mode at ambient conditions. As exhibited in Fig. 3, all the prepared membranes show obvious microphase separation structures, where the bright area indicates the hydrophobic backbone, and the dark region is associated with hydrophilic piperidinium groups.Compared to pristine PFAP membranes, the s-PFAP membranes showed decreased hydrophilic phase width (see inset figures), hydrophilic area ratio (Fig. S4a†), and hydrophilicity (see contact angles in Fig. S4b†). For instance, the hydrophilic domain widths of s-PFBP-FLN-C6 and s-PFTP-FLN-C6 membranes were 13.9 and 12.3 nm, respectively, which were slightly lower than those of the benchmarks PFBP (14.5 nm) and PFTP (13.1 nm). Membranes with developed hydrophilic channels normally achieve a high conductivity. However, the excessive swelling ratio (>90% at room temperature) of PFBP membrane (see Table 1) dilutes the ionic concentration, especially at high temperatures, causing a decreased conductivity over s-PFBP-FLN-C6 membrane. Therefore, appropriate SR and WU are also important for high conductivity.
On the other hand, the membranes with hydrophobic alkyl spacers attached to fluorene monomer exhibited wider hydrophilic channels than membranes with hydrophobic side chains attached to the piperidinium group (Fig. 3). This suggests that the hydrophobic side chain on the piperidinium group disturbs the hydrophilic/hydrophobic segment self-assembly. Specifically, s-PFTP-Pip-Cx membranes exhibited much lower conductivity than s-PFTP-FLN-Cx membranes due to the limited WU (<30% at 80 °C) and IEC (<2.4 mmol g−1) (see Table 1 and Fig. 2e and f).
Mechanical and thermal properties
Mechanical properties are equally important for AEMs and ionomers. Ionomers with satisfactory mechanical properties are believed to enhance the interactions of catalyst layers, promoting the stability of fuel cells. As shown in Fig. 4, s-PFAP-FLN-Cx membranes possess much higher tensile strength (>60 MPa) than s-PFAP-Pip-Cx and reference samples (PFBP and PFTP) due to their higher molecular weight (intrinsic viscosity > 4.0 dL g−1, see Table 1). The membranes with short alkyl spacers exhibited higher tensile strength and Young's modulus than the membranes with long alkyl spacers (Table 1 and Fig. 4). The s-PFBP-FLN-C6 membrane showed a higher tensile strength (76.4 MPa vs. 66 MPa) and Young's modulus (1197 MPa vs. 1014 MPa) than the s-PFBP-FLN-C8 membrane (Fig. 4a). Moreover, the s-PFTP-FLN-C6 membrane achieved the highest tensile strength of 93.2 MPa along with an elongation at break of 24.6% (Fig. 4b), suggesting that it is also a good candidate for AEMs.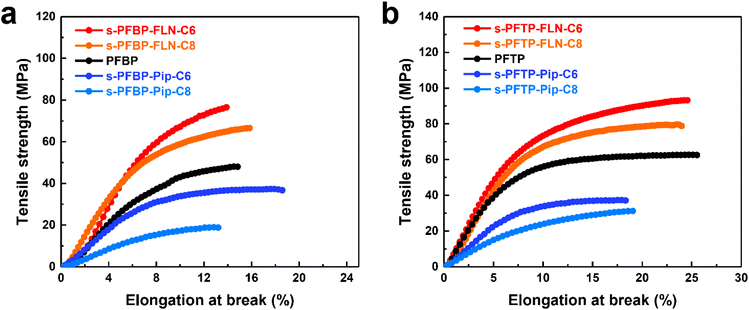 | ||
| Fig. 4 Mechanical properties of PFAP and s-PFAPs membranes in I− form in the dry state at ambient conditions: (a) PFBP and s-PFBPs and (b) PFTP and s-PFTPs. | ||
The thermal stability of s-PFAP polymers was evaluated from 50 to 500 °C using thermogravimetric analysis (TGA). All the prepared membranes were thermally stable up to 200 °C (Fig. S5†). s-PFAP-FLN-Cx membranes generally display higher thermal stability than s-PFAP-Pip-Cx membranes. A possible reason for this is that the alkyl spacers attached to the piperidinium group induce thermal degradation of polymers.
Dynamic mechanical analysis (DMA) was applied to measure the glass transition temperatures (Tg) and storage modulus of s-PFAPs membranes (Fig. S6†). The s-PFTP-FLN-C6 membrane possesses a higher Tg (354 °C) than s-PFTP-FLN-C8 with long alkyl spacers and s-PFTP-Pip-Cx membranes. Similarly, the s-PFBP-FLN-C6 membrane displays a higher Tg than s-PFBP-FLN-C8 and s-PFBP-Pip-Cx membranes. Moreover, all the prepared membranes achieved a high storage modulus greater than 800 MPa at 80 °C, suggesting their outstanding dynamic mechanical properties.
Alkaline stability
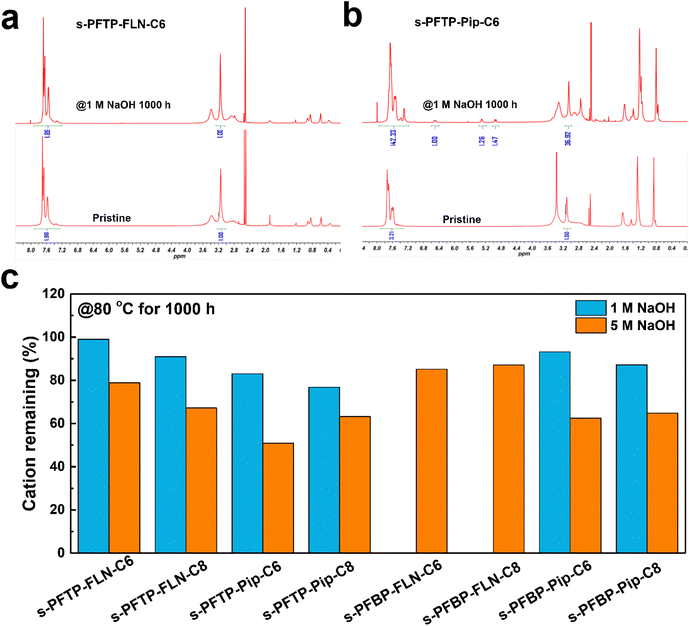
The alkaline stability of polymers was evaluated using 1 and 5 M NaOH solutions at 80 °C for 1000 h. Fig. 5 summarized the remaining cation ratio of the as-synthesized polymer after alkaline treatment for 1000 h. Compared to pristine PFTP membrane,19 the cation remaining ratio of s-PFTP-FLN-C6 membrane increased from 96.9% to 99% after being treated with 1 M NaOH solution for 1000 h suggesting its excellent alkaline stability. There were no obvious degradation peaks in the 1H NMR spectrum after 1 M NaOH measurement (Fig. 5a). Generally, s-PFAP-FLN-Cx membranes possessed better alkaline tolerance than s-PFAP-Pip-Cx membranes. For instance, the s-PFTP-FLN-C6 membrane retained 99% and 79% of the cationic groups after being treated with 1 and 5 M NaOH solution for 1000 h, respectively, which is 1.2 and 1.5 times higher than that of s-PFTP-FLN-C6 membrane at the same respective conditions. The poor alkaline stability of s-PFAP-Pip-Cx membranes suggests that the introduction of alkyl spacers disturbs the stable conformation of the six-membered rings in piperidinium, resulting in accelerated degradation (Fig. 5b) due to the SN2 reaction and Hoffmann elimination reaction.40 Moreover, the long alkyl spacers in s-PFTP-FLN-Cx membranes exacerbated the chemical degradation. s-PFTP-FLN-C8 membranes exhibited lower alkaline stability (67.2% vs. 78.9% of cations remaining) than the s-PFTP-FLN-C6 membrane. The reduced stability is supposed to relate to its low water uptake. The water surrounding the cationic groups can protect them from OH− ions.41 s-PFBPs membranes showed trends similar to s-PFTPs membranes (Fig. 5c). Specifically, s-PFBP-FLN-C6 and C8 membranes retained 85.2% and 87.1% of the cationic groups after being treated in 5 M NaOH solutions, respectively. Moreover, s-PFBPs membranes showed better alkaline stability than s-PFTPs membranes, which is attributed to their high WU. The 1H NMR spectra of s-PFAPs are displayed in Fig. S7.†Fuel cell performance
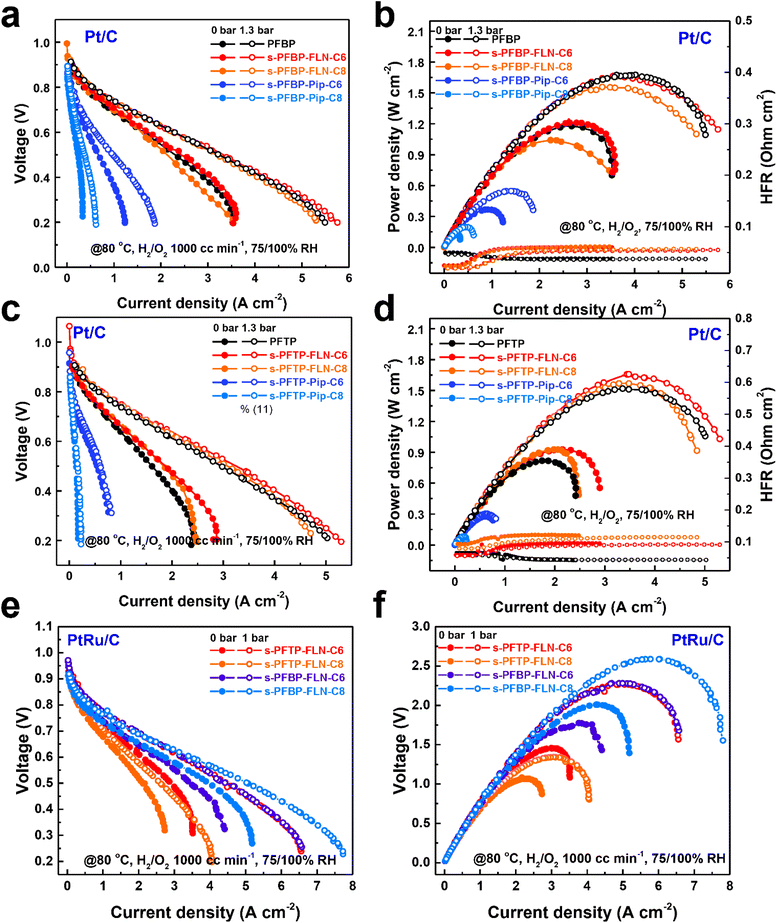
PDTP membranes (22 ± 2 μm) were selected as the AEMs to measure fuel cell performance due to its excellent electrochemical properties.16Fig. 6 reveals the polarization curves and power density plots of fuel cells with different ionomers and catalysts. s-PFBP-FLN-Cx ionomer-based fuel cells achieved comparable peak power densities (PPDs) greater than 1.5 W cm−2 to the benchmark of PFBP ionomer-based fuel cells (Fig. 6a and b). The higher high-frequency resistance (HFR) of s-PFBP-FLN-Cx ionomer-based fuel cells reveals that the fuel cells lack in water during the test. To manage the water environment, an asymmetric ionomer strategy was applied which will be discussed later. On the other hand, the PPDs of s-PFBP-Pip-Cx ionomer-based fuel cells were less than 0.6 W cm−2 even though back pressure was applied. Impressively, s-PFTP-FLN-C6 ionomer-based fuel cells exhibited remarkable PPDs of 1.65 W cm−2 using Pt/C as the catalyst, which is even higher than that of benchmark PFTP ionomer-based fuel cells (1.51 W cm−2) (Fig. 6c and d). The improved power density attributes to the hydrophobic ionomer alleviating the flooding issue. Replacing anode catalyst Pt/C with a more reactive PtRu/C, the PPDs of fuel cells were improved further, as displayed in Fig. 6e and f. The s-PFBP-FLN-C8 ionomer-based fuel cell achieved a remarkable PPD of 2.607 W cm−2. The slightly increased hydrophobicity of s-PFBP-FLN-C8 compared to s-PFBP-FLN-C6 is supposed to improve the tolerance to anode flooding, particularly at high current density where water management is more important. s-PFTP-FLN-C6 and s-PFBP-FLN-C6 ionomer-based fuel cells reached a similar PPD of 2.28 W cm−2 at 80 °C.Asymmetric ionomer design strategies were demonstrated to optimize the water environment in fuel cells, thus achieving higher power density and stability. s-PFBP-FLN-C8 (hydrophobic) and pristine PFBP (hydrophilic) were used as ionomers due to their excellent fuel cell performance. As displayed in Fig. S8,† the fuel cells using an asymmetric ionomer strategy in both electrodes (that is, different ionomers in the anode and cathode) achieved a higher power density of 1.8 W cm−2 (@80 °C using Pt/C catalyst) compared with fuel cells with symmetric ionomers (PFBP/PFBP anode/cathode (A/C) ionomer: 1.655 W cm−2; s-PFBP-FLN-C8/s-PFBP-FLN-C8 A/C: 1.522 W cm−2).
Galvanostatic electrochemical impedance spectra (GEIS) of fuel cells with asymmetric ionomers at different current densities and flow rates were evaluated to verify the superiority of asymmetric ionomers (see Fig. S9†). The fuel cell with relatively hydrophobic s-PFBP-FLN-C8 ionomer at the cathode side showed a smaller GEIS plot radius than the fuel cell with s-PFBP-FLN-C8 at the anode side (Fig. S9a and b†). The relatively hydrophobic ionomer at the cathode side was supposed to promote water back diffusion, which is consistent with Mustain's and Kim's reports.22,29 The imbalance of water distribution was exacerbated at a low anode flow rate (Fig. S9c and d†). The GEIS plot radius at a low flow rate was larger than that of at a high anode flow rate, suggesting that fuel cells operated at a low anode flow rate are more prone to flooding issues.
In situ durability
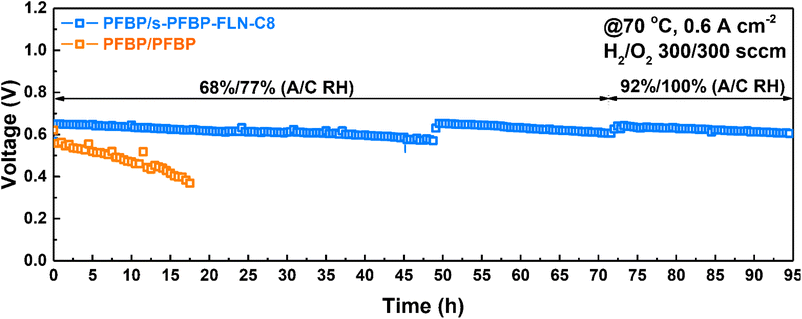
Currently, the majority of reported AEMFCs was operated at a low current density (e.g., 0.4, 0.2, 0.1 A cm−2) to extend the longevity of the fuel cells.42–45 The in situ stability of fuel cells in this work was evaluated at a constant current density of 0.6 A cm−2 at 70 °C using Pt/C catalyst to accelerate the durability test. s-PFBP-FLN-C8 and PFBP polymers were selected as the cathode and anode ionomers, respectively, due to their excellent electrochemical properties. As shown in Fig. 7, the fuel cell with asymmetric ionomers on both sides exhibited a higher initial voltage than the reference fuel cell (PFBP/PFBP A/C ionomer on both sides), suggesting its higher electrochemical activity. More importantly, the voltage of the reference fuel cell decreased from 0.56 to 0.37 V within 18 h, a voltage decay rate of 10.5 mV h−1. The fuel cell with s-PFBP-FLN-C8 ionomer on the cathode side exhibited a 26 times lower voltage degradation rate of 0.4 mV h−1 than the reference fuel cell (voltage decay rate of 10.5 mV h−1). The improved in situ durability of the asymmetric ionomer case was due to the relatively hydrophobic ionomer on the cathode side that increased the water gradient between the anode and cathode catalyst layers and promoted water back-diffusion. In addition, hydrophobic ionomers in the cathode were reported to enhance the electrochemical stability of catalyst layers. To extend the longevity of fuel cells, the relative humidity (RH) in the cathode and anode was improved to 92% and 100%, respectively. The voltage was recovered, suggesting that initial voltage loss was caused by unfavorable operation conditions. After a 95 h durability test, the total voltage decay rate was less than 0.4 mV h−1, indicating its potential for future applications.Conclusions
In summary, we presented a series of poly(fluorenyl-co-aryl piperidinium) ionomers with hydrophobic side chains for durable AEMFCs. The effects of hydrophobic side chain length and position of the graft on the physical and electrochemical properties of polymers were studied. The polymers (s-PFAP-Pip-Cx) with hydrophobic side chains attached to the piperidinium group showed improved dimensional stability, decreased water adsorption, and limited alkaline stability and conductivity. Conversely, the hydrophobic side chains grafted onto the fluorene monomer promoted the dimensional stability, improved the mechanical properties, and increased the electrochemical stability of polymers (s-PFAP-FLN-Cx). For instance, s-PFAP-FLN-Cx membranes exhibited a TS over 60 MPa, YM over 1000 MPa along with high conductivity higher than 130 mS cm−1. Importantly, an s-PFBP-FLN-C8 ionomer-based fuel cell reached a remarkable peak power density of 2.607 W cm−2 at 80 °C. The fuel cell with s-PFBP-FLN-C8 ionomer in the cathode side exhibited a 27 times lower voltage decay rate than the benchmark fuel cell with PFBP ionomer on both electrode sides after operating at a constant current density of 0.6 A cm−2 at 70 °C.Experimental
Materials
p-Terphenyl (TP), biphenyl (BP), 1-methyl-4-piperidone (MP), 9,9-dihexylfluorene (FLN-C6), 9,9-dioctylfluorene (FLN-C8), 1-bromohexane (Br-Hex), 1-bromooctane (Br-Oct), trifluoroacetic acid (TFA), trifluoromethanesulfonic acid (TFSA), and iodomethane (CH3I) were purchased from TCI Development Co. Ltd (Japan). Other solvents and chemicals were purchased from Daejung Chemicals & Metals (Siheung-si, Gyeonggi-do, Korea). All chemicals were used without further purification.Synthesis of s-PFTM-FLN-Cx and PFTM
s-PFTM-FLN-C6 and s-PFTM-FLN-C8 copolymers were synthesized in the same way, based on s-PFTM-C6 as an example. Typically, FLN-C6 (3 mmol, 1.003 g), TP (27 mmol, 6.218 g), MP (36 mmol, 4.073 g), and 24 mL CH2Cl2 were added into a double-layer reactor with a mechanical stirring system. Then, 3.6 mL TFA was slowly added into the mixture solution, and the reaction system was maintained at 0 °C for 30 min. After that, 24 mL TFSA was added dropwise to the reaction system to avoid fumes. Thereafter, the reaction was held at this temperature for ∼7 h. The resulting solution with high viscosity was precipitated in deionized water. The white chunk solid was crushed with a blender and then washed with deionized water until the pH of the water was neutral. Finally, the solid was dried in a convection oven at 80 °C for 24 h.Synthesis of s-PFTP-FLN-Cx
s-PFTP-FLN-Cx was synthesized via the Menschutkin reaction between s-PFTM-FLN-Cx and iodomethane. Typically, fully dried s-PFTM-FLN-C6 (10 g, 20 mmol) was dissolved in 200 mL DMSO to form a homogeneous solution. Subsequently, K2CO3 (8.285 g, 60 mmol) and CH3I (8.51 g, 60 mmol) were added to the above solution and reacted in a dark environment at room temperature for 24 h. The resulting solution was precipitated in ethyl acetate. The white fiber-like solid was washed with ethyl acetate and deionized water several times and then dried in a convection oven at 80 °C for 24 h.Synthesis of s-PFTP-Pip-Cx
Briefly, fully dried PFTM (10 g, 20.56 mmol) was dissolved in 200 mL DMSO to form a homogeneous solution. Subsequently, K2CO3 (8.525 g, 61.68 mmol) and Br-Hex (10.181 g, 61.68 mmol) or Br-Oct (11.912 g, 61.68 mmol) were added into the above solution and reacted at 80 °C for 24 h. The resulting solution was slowly poured into 500 mL ethyl acetate to precipitate the white fibers. Subsequently, the white product was washed with ethyl acetate and deionized water to remove impurities. Finally, s-PFTP-Pip-C6 or s-PFTP-Pip-C8 was dried in a convection oven at 80 °C for 24 h.Membrane preparation
Typically, the s-PFTP-FLN-C6 powder was dissolved in DMSO to form a 5 wt% solution. Subsequently, the polymer solution was filtered with 0.45 μm PTFE filters, then cast on a glass plate. After that, the polymer solution was dried in an oven at 90 °C for 24 h and then at 140 °C for another 12 h to completely remove the residual solvent. Finally, a transparent film was obtained.Characterization
 | (1) |
 | (2) |
 | (3) |
 | (4) |
![[thin space (1/6-em)]](https://www.rsc.org/images/entities/char_2009.gif) :
:![[thin space (1/6-em)]](https://www.rsc.org/images/entities/char_2009.gif) 1.75
1.75![[thin space (1/6-em)]](https://www.rsc.org/images/entities/char_2009.gif) :
:![[thin space (1/6-em)]](https://www.rsc.org/images/entities/char_2009.gif) 1.5 and 1
1.5 and 1![[thin space (1/6-em)]](https://www.rsc.org/images/entities/char_2009.gif) :
:![[thin space (1/6-em)]](https://www.rsc.org/images/entities/char_2009.gif) 2
2![[thin space (1/6-em)]](https://www.rsc.org/images/entities/char_2009.gif) :
:![[thin space (1/6-em)]](https://www.rsc.org/images/entities/char_2009.gif) 1.33, respectively. The precious metal loadings at the anode and cathode were 0.39 ± 0.04 and 0.26 ± 0.04 mg cm2, respectively. The prepared CCM was immersed in 1 M NaOH solution for 24 h to exchange ions to OH− form and then was washed with deionized water to remove residual alkaline species. Subsequently, the CCM was assembled with two sheets of gas diffusion layers (GDL, SGL 22BB, Sigracet®), gaskets, and graphite bipolar plates at a torque of 6.78 N m without hot pressing.
1.33, respectively. The precious metal loadings at the anode and cathode were 0.39 ± 0.04 and 0.26 ± 0.04 mg cm2, respectively. The prepared CCM was immersed in 1 M NaOH solution for 24 h to exchange ions to OH− form and then was washed with deionized water to remove residual alkaline species. Subsequently, the CCM was assembled with two sheets of gas diffusion layers (GDL, SGL 22BB, Sigracet®), gaskets, and graphite bipolar plates at a torque of 6.78 N m without hot pressing.
Prior to performance measurements, the fuel cell was activated at a constant voltage of 0.5 V at 70 °C and 100% relative humidity (RH) with an H2–O2 flow rate of 1000 mL min−1 until a constant current was achieved. After that, the temperatures of humidifiers and cells were increased to the set points. The polarization curves and power curves were recorded at a voltage scan rate of 0.01 V s−1.
The in situ durability of the fuel cell was measured at a constant current density of 0.6 A cm−2 at 70 °C using Pt/C as the catalyst. In contrast to fuel cells for IV curve measurements, the GDL for durability tests was replaced with Toray 060. During the test, the fuel cell operated at an H2–O2 flow rate of 300 mL min−1 under 68%/77% (anode/cathode) RH.
Author contributions
Chuan Hu: Investigation, methodology, formal analysis visualization, writing - original draft. Jong Hyeong Park: Investigation, methodology, formal analysis visualization, resources. Na Yoon Kang: Investigation, resources. Xiaohua Zhang: Investigation, resources. Young Jun Lee: Methodology. Seung Won Jeong: Methodology. Young Moo Lee: Conceptualization, visualization, writing-review editing, project administration, funding acquisition, supervision.Conflicts of interest
There are no conflicts to declare.Acknowledgements
This research was supported by the Technology Development Program to Solve Climate Change through the National Research Foundation of Korea (NRF) funded by the Ministry of Science and ICT (NRF-2018M1A2A2061979) and Material Component Technology Development (20010955) through the Korea Evaluation Institute of Industrial Technology (KEIT) funded by the Ministry of Trade, Industry and Energy, South Korea. C. Hu appreciates the financial support from the China Scholarship Council (CSC) [No: 201906310144].Notes and references
- C. H. Park, S. Y. Lee, D. S. Hwang, D. W. Shin, D. H. Cho, K. H. Lee, T. W. Kim, T. W. Kim, M. Lee, D. S. Kim, C. M. Doherty, A. W. Thornton, A. J. Hill, M. D. Guiver and Y. M. Lee, Nature, 2016, 532, 480–483 CrossRef PubMed.
- N. Chen and Y. M. Lee, Trends Chem., 2022, 4, 236–249 CrossRef CAS.
- N. Chen and Y. M. Lee, Prog. Polym. Sci., 2021, 113, 101345 CrossRef CAS.
- S. Gottesfeld, D. R. Dekel, M. Page, C. Bae, Y. Yan, P. Zelenay and Y. S. Kim, J. Power Sources, 2018, 375, 170–184 CrossRef CAS.
- D. W. Shin, M. D. Guiver and Y. M. Lee, Chem. Rev., 2017, 117, 4759–4805 CrossRef CAS PubMed.
- Y. Yang, C. R. Peltier, R. Zeng, R. Schimmenti, Q. Li, X. Huang, Z. Yan, G. Potsi, R. Selhorst, X. Lu, W. Xu, M. Tader, A. V. Soudackov, H. Zhang, M. Krumov, E. Murray, P. Xu, J. Hitt, L. Xu, H. Y. Ko, B. G. Ernst, C. Bundschu, A. Luo, D. Markovich, M. Hu, C. He, H. Wang, J. Fang, R. A. DiStasio, Jr, L. F. Kourkoutis, A. Singer, K. J. T. Noonan, L. Xiao, L. Zhuang, B. S. Pivovar, P. Zelenay, E. Herrero, J. M. Feliu, J. Suntivich, E. P. Giannelis, S. Hammes-Schiffer, T. Arias, M. Mavrikakis, T. E. Mallouk, J. D. Brock, D. A. Muller, F. J. DiSalvo, G. W. Coates and H. D. Abruna, Chem. Rev., 2022, 122, 6117–6321 CrossRef CAS PubMed.
- J. R. Varcoe, P. Atanassov, D. R. Dekel, A. M. Herring, M. A. Hickner, P. A. Kohl, A. R. Kucernak, W. E. Mustain, K. Nijmeijer, K. Scott, T. Xu and L. Zhuang, Energy Environ. Sci., 2014, 7, 3135–3191 RSC.
- K. H. Lee, D. H. Cho, Y. M. Kim, S. J. Moon, J. G. Seong, D. W. Shin, J. Y. Sohn, J. F. Kim and Y. M. Lee, Energy Environ. Sci., 2017, 10, 275–285 RSC.
- A. G. Wright, J. Fan, B. Britton, T. Weissbach, H.-F. Lee, E. A. Kitching, T. J. Peckham and S. Holdcroft, Energy Environ. Sci., 2016, 9, 2130–2142 RSC.
- Z. Yang, R. Guo, R. Malpass-Evans, M. Carta, N. B. McKeown, M. D. Guiver, L. Wu and T. Xu, Angew. Chem., Int. Ed. Engl., 2016, 55, 11499–11502 CrossRef CAS PubMed.
- T. Zhu, S. Xu, A. Rahman, E. Dogdibegovic, P. Yang, P. Pageni, M. P. Kabir, X. D. Zhou and C. Tang, Angew. Chem., Int. Ed. Engl., 2018, 57, 2388–2392 CrossRef CAS PubMed.
- C. Hu, Q. Zhang, H. Wu, X. Deng, Q. Yang, P. Liu, Y. Hong, A. Zhu and Q. Liu, J. Membr. Sci., 2020, 595, 117521 CrossRef.
- C. Hu, Q. Zhang, C. Lin, Z. Lin, L. Li, F. Soyekwo, A. Zhu and Q. Liu, J. Mater. Chem. A, 2018, 6, 13302–13311 RSC.
- J. S. Olsson, T. H. Pham and P. Jannasch, Adv. Funct. Mater., 2018, 28, 1702758 CrossRef.
- H. Peng, Q. Li, M. Hu, L. Xiao, J. Lu and L. Zhuang, J. Power Sources, 2018, 390, 165–167 CrossRef CAS.
- N. Chen, C. Hu, H. H. Wang, S. P. Kim, H. M. Kim, W. H. Lee, J. Y. Bae, J. H. Park and Y. M. Lee, Angew. Chem., Int. Ed., 2021, 60, 7710–7718 CrossRef CAS PubMed.
- C. Hu, J. H. Park, H. M. Kim, H. H. Wang, J. Y. Bae, N. Y. Kang, N. Chen and Y. M. Lee, J. Membr. Sci., 2022, 647 Search PubMed.
- J. Wang, Y. Zhao, B. P. Setzler, S. Rojas-Carbonell, C. Ben Yehuda, A. Amel, M. Page, L. Wang, K. Hu, L. Shi, S. Gottesfeld, B. Xu and Y. Yan, Nat. Energy, 2019, 4, 392–398 CrossRef CAS.
- N. Chen, H. H. Wang, S. P. Kim, H. M. Kim, W. H. Lee, C. Hu, J. Y. Bae, E. S. Sim, Y. C. Chung, J. H. Jang, S. J. Yoo, Y. Zhuang and Y. M. Lee, Nat. Commun., 2021, 12, 2367 CrossRef CAS PubMed.
- N. Chen, C. Hu, H. H. Wang, J. H. Park, H. M. Kim and Y. M. Lee, J. Membr. Sci., 2021, 638, 119685 CrossRef CAS.
- N. Chen, J. H. Park, C. Hu, H. H. Wang, H. M. Kim, N. Y. Kang and Y. M. Lee, J. Mater. Chem. A, 2022, 10, 3678–3687 RSC.
- N. Ul Hassan, M. Mandal, G. Huang, H. A. Firouzjaie, P. A. Kohl and W. E. Mustain, Adv. Energy Mater., 2020, 10, 2001986 CrossRef CAS.
- W. E. Mustain, M. Chatenet, M. Page and Y. S. Kim, Energy Environ. Sci., 2020, 13, 2805–2838 RSC.
- L. Wang, X. Peng, W. E. Mustain and J. R. Varcoe, Energy Environ. Sci., 2019, 12, 1575–1579 RSC.
- M. Mandal, G. Huang, N. Ul Hassan, X. Peng, T. L. Gu, A. H. Brooks-Starks, B. Bahar, W. E. Mustain and P. A. Kohl, J. Electrochem. Soc., 2020, 167, 054501 CrossRef CAS.
- Y. Zheng, U. Ash, R. P. Pandey, A. G. Ozioko, J. Ponce-González, M. Handl, T. Weissbach, J. R. Varcoe, S. Holdcroft, M. W. Liberatore, R. Hiesgen and D. R. Dekel, Macromolecules, 2018, 51, 3264–3278 CrossRef CAS.
- W. E. Mustain, Curr. Opin. Electrochem., 2018, 12, 233–239 CrossRef CAS.
- C. A. Hu, H. H. Wang, J. H. Park, H. M. Kim, N. J. Chen and Y. M. Lee, J. Electrochem. Soc., 2022, 169 Search PubMed.
- D. P. Leonard, S. Maurya, E. J. Park, L. Delfin Manriquez, S. Noh, X. Wang, C. Bae, E. D. Baca, C. Fujimoto and Y. S. Kim, J. Mater. Chem. A, 2020, 8, 14135–14144 RSC.
- J. Zhang, W. Zhu, T. Huang, C. Zheng, Y. Pei, G. Shen, Z. Nie, D. Xiao, Y. Yin and M. D. Guiver, Adv. Sci., 2021, 8, e2100284 CrossRef PubMed.
- B. Wang, J. Pan, X. Zou, J. Zhao, G. Xu, Z. Jin, Z. Sun and F. Yan, J. Mater. Chem. A, 2022, 10, 13355–13367 RSC.
- X. Liang, M. A. Shehzad, Y. Zhu, L. Q. Wang, X. L. Ge, J. J. Zhang, Z. J. Yang, L. Wu, J. R. Varcoe and T. W. Xu, Chem. Mater., 2019, 31, 7812–7820 CrossRef CAS.
- J. Hyun, S. H. Yang, G. Doo, S. Choi, D.-H. Lee, D. W. Lee, J. Kwen, W. Jo, S.-H. Shin, J. Y. Lee and H.-T. Kim, J. Mater. Chem. A, 2021, 9, 18546–18556 RSC.
- M. Hu, Q. Li, H. Peng, H. Ma, L. Xiao, G. Wang, J. Lu and L. Zhuang, J. Power Sources, 2020, 472 Search PubMed.
- H. Cao, J. Pan, H. Zhu, Z. Sun, B. Wang, J. Zhao and F. Yan, Adv. Sci., 2021, 8, 2101744 CrossRef CAS PubMed.
- H. M. Kim, C. Hu, H. H. Wang, J. H. Park, N. Chen and Y. M. Lee, J. Membr. Sci., 2022, 644 Search PubMed.
- C. Hu, J. H. Park, H. M. Kim, H. H. Wang, J. Y. Bae, M.-L. Liu, N. Y. Kang, K.-s. Yoon, C.-d. Park, N. Chen and Y. M. Lee, J. Mater. Chem. A, 2022, 10, 6587–6595 RSC.
- D. Lua, D. Lia, L. Wena and L. Xue, J. Membr. Sci., 2017, 533, 201–219 CrossRef.
- H. Wei, Y. Li, S. Wang, G. Tao, T. Wang, S. Cheng, S. Yang and Y. Ding, J. Membr. Sci., 2019, 579, 219–229 CrossRef CAS.
- N. Chen, Y. Jin, H. Liu, C. Hu, B. Wu, S. Xu, H. Li, J. Fan and Y. M. Lee, Angew. Chem., Int. Ed. Engl., 2021, 60, 19272–19280 CrossRef CAS PubMed.
- D. R. Dekel, I. G. Rasin and S. Brandon, J. Power Sources, 2019, 420, 118–123 CrossRef CAS.
- J. Xue, L. Liu, J. Liao, Y. Shen and N. Li, J. Mater. Chem. A, 2018, 6, 11317–11326 RSC.
- L. Ma, M. Hussain, L. Li, N. A. Qaisrani, L. Bai, Y. Jia, X. Yan, F. Zhang and G. He, J. Membr. Sci., 2021, 636 Search PubMed.
- C. A. Hu, X. L. Deng, X. C. Dong, Y. Z. Hong, Q. G. Zhang and Q. L. Liu, J. Membr. Sci., 2021, 619, 118806 CrossRef CAS.
- W. Yu, J. Zhang, X. Liang, X. Ge, C. Wei, Z. Ge, K. Zhang, G. Li, W. Song, M. A. Shehzad, L. Wu and T. Xu, J. Membr. Sci., 2021, 634 Search PubMed.
Footnotes |
| † Electronic supplementary information (ESI) available: Polymer synthesis process; NMR spectra of polymers; solubility of polymers; hydrophilic domain ratio and contact angles; thermal properties of polymers; dynamic mechanical analysis of membranes; NMR spectra of polymers after alkaline treatment; fuel cell performance with asymmetric ionomers; GEIS plots of fuel cells with asymmetric ionomers. See DOI: https://doi.org/10.1039/d2ta08726j |
| ‡ These authors contributed equally to this work. |
| This journal is © The Royal Society of Chemistry 2023 |

