 Open Access Article
Isolation of hydroxyapatite from Atlantic salmon processing waste using a protease and lipase mixture†
Sarah
Boudreau
a,
Sabahudin
Hrapovic
b,
Yali
Liu
b,
Alfred C. W.
Leung
b,
Edmond
Lam
 *bc and
Francesca M.
Kerton
 *a
*a
aDepartment of Chemistry, Memorial University, St. John's, NL A1B 3X7, Canada. E-mail: fkerton@mun.ca
bAquatic and Crop Resource Development, National Research Council Canada, Montreal, QC H4P 2R2, Canada
cDepartment of Chemistry, McGill University, 801 Sherbrooke St. West, Montreal, QC H3A 0B8, Canada. E-mail: Edmond.lam@mcgill.ca
First published on 7th August 2023
Abstract
There is a need to solve ongoing waste management issues in food processing industries. The demand for fish, including salmon, is higher than ever because of the growing global population and protein needs, however this results in large quantities of wasted by-products. This waste is problematic because it is potentially harmful to the environment and results in significant disposal costs for industries. The salmon frame (bones) is disposed of during processing but is a potential feedstock for hydroxyapatite, a mineral for value-added applications. While previous research has accessed hydroxyapatite from animal wastes, these processes either use very high temperatures or chemicals that are more costly and hazardous than the method described herein. In this study, we developed an enzymatic treatment using a protease and lipase simultaneously to clean the residual meat from salmon frames to isolate collagen-containing hydroxyapatite (sHAP) using Design of Experiment (DoE) under benign conditions. The parameters were optimized using 23 and 24 factorial designs by varying the temperature from 25–55 °C, the enzyme loadings from 0.5–25 μL g−1, and the reaction time from 1–24 h. It was determined by characterization techniques, weight loss calculations, and thermogravimetric analysis that the meat from the salmon frame was successfully hydrolyzed with 15 μL g−1 Neutrase and 7.5 μL g−1 Lipozyme CALB L in 40 °C tap water for 6 h. We have performed a life cycle analysis to compare the current method with previously reported processes used to treat fishery waste. The method reported herein is less impactful (environment, hazard, cost, carbon footprint) than others in the literature, as there are no organic solvents required, enzymes are easily disposed, and temperatures do not exceed 100 °C during the entire process. Furthermore, the optimized conditions were then used on a larger scale and up to 15 salmon frames were easily processed at one time.
Sustainability spotlightFisheries and aquaculture industries are important in terms of global protein production, especially in coastal, rural areas (UN SDG2, Zero Hunger). Fish processing produces significant volumes of biological waste. In many emerging economies, this waste is dumped at sea and can affect life below water (UN SDG14, Life Below Water). Development of benign and safe methods to process waste impacts the economic viability of fish processing plants and affords a second product stream (UN SDG8, Decent Work and Economic Growth and UN SDG12, Responsible Consumption and Production). Life cycle analysis demonstrates that the method described is more sustainable than previously reported processes that produce hydroxyapatite from fishery waste streams. |
Introduction
Waste management solutions for the food industry, including fishing and aquaculture sectors, are becoming increasingly important as worldwide human population continues to grow. According to the Food and Agriculture Organization (FAO) of the United Nations (UN), aquaculture is and will continue to be an important contributor to global food security. People are generally consuming more fish than ever: in the 1960s, people would eat on average 9.9 kg of fish, but that has increased to 14.4 kg in the 1990s, 19.7 kg in 2013, and 20.1 kg in 2014.1 As more fish is being consumed, more waste is being generated including heads, fins, viscera, and backbones. These discards are often disposed of in landfills and overtime, the organic matter rots and releases methane and carbon dioxide into the atmosphere.2 In developing regions, fish wastes are normally disposed of in the ocean, leading to eutrophication3 and ocean acidification.2 While these outcomes have a negative environmental impact, it is also an economic disadvantage for the food processing industry since disposal often involves significant costs and there is an untapped potential for profiting from these wasted discards.Canada is one of the leading producers of fish and in 2020, approximately 141 kt of aquaculturally sourced fish4 and 776 kt of captured fish5,6 were processed. Atlantic salmon (Salmo salar) is of particular interest since it makes up 70% of all aquaculture production in Canada.7 Canada is also the fourth largest producer of farmed Atlantic salmon globally, making salmon production a significant contributor to the economy of coastal rural communities.7 Since salmon is of such economic value for Canadians, its processing leads to a very large quantity of waste disposal in landfills and thus needs a solution.
The principles of green chemistry, a discipline that has made significant progress over the last two decades, can be used to mitigate this ongoing waste management issue. As environmental implications become increasingly important, developing renewable and sustainable materials from biomass has been heavily researched.8 Typically, researchers have focused on extracting biopolymers and organic compounds from marine waste biomass specifically collagen,9 peptides,10 and chitin.11 The isolation of biominerals from marine sources is less prevalent compared to organic compounds despite the large number of applications for minerals (quarried, mined, or made synthetically) that can be substituted with biominerals. For example, calcium carbonate can be synthesized using additives such as surfactants,12 however it has also been extracted from blue mussel shells,13 thus decreasing the amount of wasted shells disposed of in landfills or the ocean. Calcium carbonate is the most studied inorganic material isolated from marine biomass and is found in shellfish (molluscs and crustaceans).
Unlike shellfish, fish have vertebrae which are rich in hydroxyapatite (HAP), Ca10(PO4)6(OH)2, a naturally occurring mineral, which makes up 60% of the bone matrix of vertebrates.14 The organic content of vertebrae bones, primarily collagen, makes up 30% of the bone matrix and the remaining 10% is attributed to water.14 In 1 kg of waste fish by-products, there is approximately 100 g of bones, and so theoretically 60 g of HAP can be isolated and the protein hydrolysate co-product can be used in fertilizers. The primary use of synthetic and biological HAP is in biomedicine since it is produced naturally in the body.15 For example, HAP isolated from biomass has been used as a scaffold for tissue engineering because it is biocompatible.16 Since apatites make up 97% of enamel,17 HAP is often employed in dental applications such as remineralization of enamel.18 Beyond biomedical applications, it has been used in bioremediation, catalysis, and energy storage. For example, synthetic and biogenic HAP has been used to adsorb a range of organic19–23 and inorganic24–27 pollutants from wastewater. Recently, synthetic HAP has been employed as a scaffold in damaged solar cells to absorb released lead so that it does not contaminate water sources.28 Synthetic HAP has also been used as a catalyst support for the oxidation of carbon monoxide29 and 1,2-dichloroethane,30 and it has also been used as a catalyst for the dehydration of lactic acid to acrylic acid.31
Synthetic methods to prepare HAP involve diammonium hydrogen phosphate, nitric acid, and/or calcination.30,31 Alternatively, HAP has been isolated from biological sources including mammalian bones,23,32–34 egg shells,19 fish scales,26,35–47 and fish bones.20,21,34,48–60 However, the methods often use techniques that are neither environmentally nor industrially friendly, as such there is no existing industrial process to isolate HAP from waste.
Enzymes offer a solution to this issue because they do not require hazardous conditions that would pose a risk to the environment or workers.61 Enzymes have been used as a biocatalyst for several biotechnological applications including uses in food, pharmaceutical, and chemical industries.62 Few researchers have explored the potential of using enzymes to isolate HAP from biomass and those studies reported to date have only used proteases.39,40,57 Salmon is a species of fish very rich in lipids, especially omega-3 fatty acids, therefore a lipase could be beneficial in hydrolyzing these to improve the isolation of HAP from salmon. While using enzymes simultaneously is not common in literature, there are few examples where it has been proven beneficial, including the hydrolysis of oil palm empty fruit bunch fiber and wastewater sludge.63,64 We describe an optimized, environmentally, and industrially friendly method to extract HAP derived from salmon (sHAP) while simultaneously using two food grade enzymes: Neutrase and Lipozyme CALB L. Neutrase, being a zinc metalloendoprotease, is expected to have a catalytic mechanism that involves nucleophilic attack of a water molecule on a carbonyl belonging to the peptide bond of a protein.65 Lipozyme CALB L is a lipase and perform hydrolysis reactions of esters at active sites consisting of an aspartic acid, histidine and serine triad.66 We chose these enzymes specifically because they are commercially available and function over a broad, neutral pH range, allowing for use of tap water as a reaction medium. Tap water is preferential for industrial purposes since fish processing plants have access to water and using distilled/deionized water or buffer solutions would lead to increased processing costs. Also, the protein–lipid hydrolysate solution that remains after the enzyme treatment could be used in other applications, such as agriculture,67 by using water and avoiding organic solvents. Additionally, the enzymes are stable from 30 to 60 °C, reaction temperatures that could minimize the energy required for the hydrolysis of proteins and lipids. These enzymes are not immobilized, therefore this allows them access to the heterogeneous substrate more efficiently. A Design of Experiment (DoE) methodology was used in this research to optimize the enzymatic treatment because there are multiple variables (temperature, time, and enzyme loading) that may interact with each other.68 This is the most environmentally friendly and only industrially scalable method described in literature to date.
Experimental
Materials
For optimization experiments, Atlantic salmon (Salmo salar) frames were donated from several local seafood markets in St. John's, NL, Canada: Sis's Seafood, The Fish Depot, and The Seafood Shop. For large-scale experiments, Atlantic salmon frames were purchased from Frandon Seafoods in Montreal, QC, Canada. Remaining heads, fins, and skin on the salmon frames were discarded using scissors and a knife. Each frame was stored in a freezer bag and kept frozen until required.Neutrase® 0.8L (Novozymes, Denmark) and Lipozyme® CALB L (Novozymes, Denmark) were received from Strem, USA. Neutrase® is an endoprotease with a declared activity of 0.8 AU g−1 derived from Bacillus amyloliquefaciens that randomly hydrolyzes internal peptide bonds. Lipozyme® CALB L is a lipase from Candida antarctica B. with an activity of 5000 LU g−1 that has substrate specificity towards alcohols and esters.
Tap water was used as the reaction medium for all experiments described and its pH was measured to be 7.35.
Design of Experiment (DoE) parameters
For the optimization of the enzymatic treatment that used only Neutrase as an enzyme, three variables were assessed using a 23 experimental design: enzyme loading (X1), time (X2), and temperature (X3). The variables were studied at a low (−1) and high (+1) level and for enzyme loading this was 0.5 and 5.0 μL g−1, time was 2 and 6 h, and temperature was 25 and 55 °C (Table 1). The enzyme loadings were calculated relative to the mass of minced fish frame while excluding the mass of water being used as a reaction medium.| Factor | Name | Low actual | High actual | Low code | High code |
|---|---|---|---|---|---|
| X1 | Enzyme loading | 0.5 μL g−1 | 5.0 μL g−1 | −1 | +1 |
| X2 | Time | 2 h | 6 h | −1 | +1 |
| X3 | Temperature | 25 °C | 55 °C | −1 | +1 |
The optimization of the Neutrase and Lipozyme CALB L enzymatic treatment was studied using a 24 experimental design. In this case, four variables were manipulated: Neutrase loading (X1), Lipozyme CALB L loading (X2), time (X3), and temperature (X4). The low level (−1) and high level (+1) of Neutrase loading was adjusted to 1 and 25 μL g−1, Lipozyme CALB L was 0.5 and 25 μL g−1, time was 1 and 24 h, and temperature was 30 and 55 °C (Table 2).
| Factor | Name | Low actual | High actual | Low code | High code |
|---|---|---|---|---|---|
| X1 | Neutrase loading | 1.0 μL g−1 | 25 μL g−1 | −1 | +1 |
| X2 | Lipozyme CALB L loading | 0.5 μL g−1 | 25 μL g−1 | −1 | +1 |
| X3 | Time | 1 h | 24 h | −1 | +1 |
| X4 | Temperature | 30 °C | 55 °C | −1 | +1 |
Weight loss calculation of enzymatic treatments
The mass loss for each experiment was calculated by weighing the minced sample of salmon frame by-product and comparing it to the mass of the final, dried sHAP product (eqn (1)). | (1) |
Characterization of sHAP
sHAP product from each experiment were classified as either pure sHAP or crude sHAP. Pure sHAP is the result of a successful enzymatic treatment in which all non-collagenous proteins and lipids have been hydrolyzed, while crude sHAP is the product of an unsuccessful enzymatic treatment.For characterization purposes, sHAP was pulverized into a powder by grinding using a SPEX Sample Prep 8000 M mixer mill and a stainless-steel vial with 10 × 2.5′′ stainless steel balls for 10 min time periods.
Powder X-ray diffraction (XRD) was performed using a Rigaku Mini Flex 600 6G (Rigaku, Japan) with Cu Kβ radiation (40 kV, 15 mA) in continuous scan mode. The scan speed was set to 2.000° min−1, the sample width to 0.020°, and the scan range of 2θ = 10.000 to 90.000°.
Fourier transform infrared (FTIR) spectroscopy in attenuated total reflectance (ATR) mode was completed with a Bruker Alpha FTIR (Bruker, USA) equipped with a single-bounce diamond ATR platform. The spectra were obtained using a scan range between 400 to 4000 cm−1 with 24 scans and a resolution of 4 cm−1.
Thermogravimetric analysis (TGA) was performed using a Netzsch STA 449 F1 Jupiter (Netzsch, Germany) equipped with a steel furnace. The samples were heated from 25 to 1000 °C at a rate of 10 °C min−1 in the presence of 20 L min−1 air (80% nitrogen, 20% oxygen).
1H MAS (magic angle spinning) NMR (nuclear magnetic resonance) spectra were recorded on a Bruker AVANCE II 600 MHz NMR spectrometer (Bruker, USA).
Scanning electron microscopy (SEM) analysis was performed on a Hitachi S-3000N SEM (Hitachi Scientific Instruments, Japan) using secondary electron detector operating in high vacuum mode at 0° angle, 15 kV accelerating voltage and a 5–15 mm working distance. Prior to SEM analysis, dry samples were carefully deposited on a carbon double-side Pelco 12 mm diameter tabs (Ted Pella Inc.) avoiding the particles loosely ‘stacking’. Finally, the samples were sputtered with gold for 120 s using Cressington Model 108 Sputter Coater (Ted Pella Inc.) in order to prevent charging effects and improve the resolution.
Observation using a transmission electron microscope (TEM, HITACHI H-7500, Japan) equipped with bottom-mounted AMT NanoSprint 12MP camera and operating at 80 kV in high-contrast mode, was performed on negatively-stained samples. TEM grids (copper 200 mesh, 12–25 nm carbon supported, Ted Pella Inc.) were freshly glow-discharged using EMS GloQube-D, Dual chamber glow discharge system (Electron Microscopy Sciences, PA) in negative mode with plasma current of 25 mA during 45 s. Such grids were floated on 10 μL sample aliquots on Parafilm for 2 min. The excess droplets were subsequently wicked away from the edge of the grid with the filter paper strips (Whatman™ 541). The grid was then rinsed with droplets of double distilled water. Immediately after water rinse, the grid was exposed to 10 μL of Van Gieson's staining solution for 60 s and the stain was carefully removed using a fresh piece of filter paper. Finally, the grid was dried at the ambient conditions for 2 h and used for TEM analysis.
Dynamic light scattering (DLS) was used to determine the average particle size and the zeta potential of samples (1 mg mL−1) using a Zetasizer Nano-ZS (Malvern Instruments, Malvern, UK). The DLS analyses were done in triplicate and the average is reported.
Procedure
Pre-treatment of salmon frames
Salmon frames were thawed for at least 12 h at room temperature prior to treatment. The remaining loose flesh on the frames was removed using a spatula while carefully avoiding the vertebrae. Using a food processor (Oster 8 speed blender), the frame was minced into a paste to increase the surface area so the enzymes can access the proteins and lipids efficiently.The minced frame was boiled in tap water for 1 h to remove a considerable amount of organic content from the vertebrae, especially lipids that formed an orange film suspended in the aqueous solution. Once boiling was complete, the sample was filtered using a sieve while still warm and the water (filtrate) discarded. The mineral sample (residue) was not allowed to dry between this pre-treatment and enzymatic treatment.
Enzymatic treatment of salmon frames
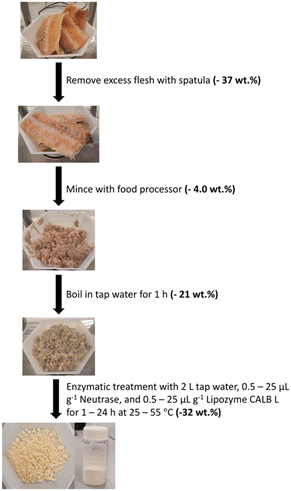
The amount of enzyme added to the solution was calculated by multiplying the desired enzyme loading by the mass of the freshly boiled frame. For exploratory experiments, the sample (15–50 g) was put into an Erlenmeyer flask with 50 mL tap water and the appropriate amount of enzyme. These samples were placed into a pre-heated incubator (Eppendorf New Brunswick™ Innova® 40 Shaker, Eppendorf, Germany) and shaken at 220 rpm for the set amount of time. For optimization experiments using Neutrase and Lipozyme CALB L, the sample (200–450 g) was treated in a beaker with approximately 2 L tap water. The enzymes were added to the water once the appropriate temperature was reached and stirred using an overhead stirrer (IKA). Once the enzymatic treatment was complete, sHAP was filtered from the hydrolysate and left to dry overnight in air. The entire process is summarized in Fig. 1.Scaled up enzymatic treatment of salmon frames
For the large-scale experiments, five salmon frames or fifteen salmon frames were manually cleaned with a spatula and minced (minced mass of 5 frames: 691 g; minced mass of 15 frames: 2200 g) using an industrial grade food processor (Retsch GM300 Knife Mill, Retsch, Germany) before being boiled in tap water for 1 h. A 20 L Radleys Reactor-Ready Pilot Lab Reactor (Radleys, UK) was used to enzymatically treat five salmon frames in 10 L or fifteen salmon frames in 20 L of tap water set to the desired temperature with appropriate stirring. The sHAP was collected with a sieve by draining the hydrolysate from the bottom of the reactor.Results and discussion
To study the efficiency of the proposed enzymatic treatment and the effect of different variables, mass balance and several characterization methods were used. The ratio of meat to bone varies depending on the source of salmon because of variations in butchering. However, minced samples should have more consistent meat to bone ratio because at this stage excess flesh has been removed.FTIR and XRD were used as the primary characterization techniques to determine whether trace amounts of organic compounds remain present in the sHAP since these quantities are often too low to impact the mass loss, which would be detectable by TGA. In related research, residual protein levels attached to mussel shells after bioprocessing could be determined by TGA.13
Since sHAP in this work is isolated from a biological source, we expect trace amounts of collagen and carbonate ions to be present as reported by others.14 By comparing the FTIR spectra of raw salmon meat (Fig. S5 and Table S2†) and pure sHAP, it is possible to determine if proteins and lipids have been hydrolyzed by the enzymatic treatment. Pure sHAP is the biomaterial isolated from our optimized enzymatic process. This process, and our route to it, will be described in detail later. Fig. 2 shows the FTIR spectra of raw salmon meat, crude sHAP, and pure sHAP. In this case, crude sHAP is the product of an enzymatic treatment that does not remove all non-collagenous proteins and lipids. Bands observed in the FTIR spectra were assigned based on literature precedent for analysis of bones from other species.34,48,50,51 The FTIR spectrum of pure sHAP demonstrates HAP is present as its phosphate ions are present (1021, 599, and 561 cm−1) and that collagen remains in the matrix (1641, 1547, and 1244 cm−1) (Fig. S10 and Table S4†). There is a significant decrease in the intensity of the carbonyl peak that appears at 1743–1756 cm−1 from raw salmon meat to pure sHAP. In raw salmon meat and crude sHAP samples, this band was attributed to carbonyl stretches from residual lipids (Fig. S6 and Table S3†). In pure sHAP, we assigned this band to carbonyl-containing functional groups on residual amino acids in the collagen enclosed within the mineral matrix. Additionally, carbonate ions are present in crude sHAP and pure sHAP with 2 vibrations from 1412–1447 cm−1.
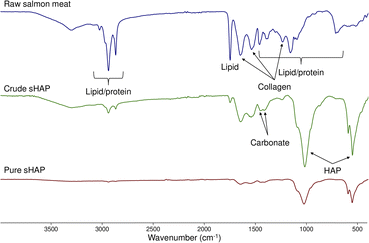 | ||
| Fig. 2 FTIR spectra of raw salmon meat (top, blue), crude sHAP (middle, green) and pure sHAP (bottom, red). | ||
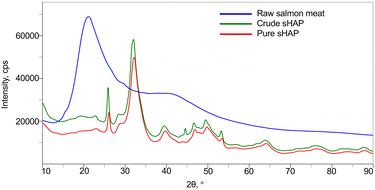
The XRD diffractograms of raw salmon meat, crude sHAP, and pure sHAP are shown in Fig. 3. The XRD diffractogram of raw salmon meat displays a broad amorphous diffraction at 2θ = 19° that decreases dramatically in intensity in crude sHAP and decreases further in pure sHAP, signifying that the meat (i.e. non-collagenous proteins and lipids) has been hydrolyzed by the enzymes. Also, at 2θ = 45° in crude sHAP (Fig. S11†) a small but defined peak is seen that is absent in the diffractogram of pure sHAP (Fig. S12†). We assume this is from the presence of trace amounts of organic compounds since the diffractogram of synthetic HAP does not contain a signal at this position.38,50
Initial DoE optimization screening results using Neutrase
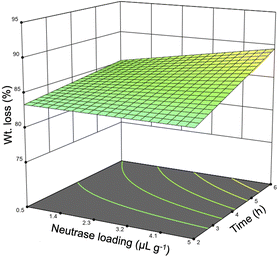
Preliminary investigation into the isolation of sHAP from salmon frames began with only Neutrase as earlier studies had focused on proteases.39,40 Neutrase was chosen because it has optimal activity at neutral pH and mild temperatures. Each sample was pre-treated and then enzymatically treated, as described in Fig. 1, using an incubator set to shake at 220 rpm. The samples used for these studies were 15 to 50 g sections of individual salmon frames (Fig. S1†). The temperature range, 25–55 °C, was chosen based on the optimal activity of Neutrase and increasing the temperature above 55 °C could negatively impact the enzyme's ability to hydrolyze proteins. The reaction time and the enzyme loading ranges for these screening studies were determined based off previous studies that use enzymes to treat biomass.13 Twenty-one samples were treated using this method and the weight (wt) loss varied from 78 to 93% (Table 3). Every variable was deemed significant using the analysis of variance (ANOVA) method as the Neutrase loading and the reaction time had p-values of 0.0068 while the temperature had a p-value of <0.0001. Additionally, the correlation between the wt loss and reaction time was 0.362, enzyme loading was 0.366, and temperature was 0.576. Therefore, we note that temperature has the greatest impact on the protein hydrolysis which is important because increasing the enzyme could potentially make the process less economically viable. Fig. 4 is the three-dimensional response surface of the relationship between wt loss, time, and Neutrase loading when temperature is set to 55 °C. It shows that by increasing the Neutrase loading and the time of the reaction, we achieve a higher wt loss. Other response surface figures showing different relationships are found in the ESI (Fig. S2 and S3†).| Entry | Enzyme loading (μL g−1) | Temperature (°C) | Time (h) | Wt loss (%) |
|---|---|---|---|---|
| 1A | 5.0 | 55.0 | 6 | 92.1 |
| 1B | 5.0 | 55.0 | 2 | 87.1 |
| 1C | 0.50 | 55.0 | 6 | 88.1 |
| 1D | 0.50 | 55.0 | 2 | 82.2 |
| 1E | 5.0 | 25.0 | 6 | 79.4 |
| 1F | 5.0 | 25.0 | 2 | 82.0 |
| 1G | 0.50 | 25.0 | 6 | 78.6 |
| 1H | 0.50 | 25.0 | 2 | 89.2 |
| 1I | 2.8 | 40.0 | 6 | 79.8 |
| 1J | 0.50 | 40.0 | 4 | 86.8 |
| 1K | 5.0 | 40.0 | 4 | 81.6 |
| 1L | 2.8 | 40.0 | 2 | 82.8 |
| 1M | 2.8 | 55.0 | 4 | 79.5 |
| 1N | 2.8 | 25.0 | 4 | 84.4 |
| 1O | 1.6 | 47.5 | 5 | 84.3 |
| 1P | 1.6 | 47.5 | 3 | 87.0 |
| 1Q | 3.9 | 47.5 | 5 | 87.4 |
| 1R | 5.0 | 55.0 | 4 | 84.0 |
| 1S | 5.0 | 55.0 | 2 | 84.3 |
| 1T | 0.50 | 55.0 | 4 | 83.9 |
| 1U | 3.5 | 55.0 | 6 | 87.3 |
The sHAP isolated from the experiment performed as entry 1A in Table 3 is considered “crude sHAP” herein. Before moving on with more DoE experiments, we wanted to study the reproducibility of this enzymatic treatment. Three samples were treated with 5 μL g−1 Neutrase for 6 h at 55 °C and resulted in wt losses of 83.6%, 84.5%, and 92.1%. Furthermore, the FTIR spectra of these samples indicate that there are varying amounts of organic compounds remaining within the sample, especially lipids (Fig. S7†). While the relative intensities of the characteristic collagen vibrations compared to the HAP vibrations remain similar, there is a large variation in the intensity of the carbonyl bands associated with lipid presence.
Exploring the potential of using Neutrase and Lipozyme CALB L simultaneously
Lipozyme CALB L was introduced into the process alongside the Neutrase to hydrolyze both the lipids and proteins present in this waste stream. In a previously reported study, two proteases were added to the reaction medium in two different steps.38 In our procedure, the enzymes are added to the medium at the same time, which is uncommon for biocatalytic methods used to process food waste streams. However, we also screened processes using sequential addition of enzymes (i.e. Neutrase to hydrolyze protein residue, isolation of crude sHAP, followed by Lipozyme CALB L treatment) and those using premixed enzyme solutions (both used immediately after mixing, and stored enzyme mixtures). In all cases, identical outcomes were observed as to simultaneous addition of aliquots of each enzyme at the start of the process. We saw no evidence of deactivation of the lipase by the protease. Below we describe efforts to optimize this process to ensure complete non-collagenous protein and lipid removal.The upper limit of enzyme concentrations was increased from 5.0 to 25 μL g−1 to make sure there was enough protease and lipase. To determine the importance of each enzyme, two pieces of salmon backbone were treated with 25 μL g−1 of Neutrase and Lipozyme CALB L, respectively, for 24 h at 55 °C. The sample treated with Neutrase alone had a wt loss of 92% and the sample treated with Lipozyme CALB L alone had a wt loss of 78%. Therefore, we decided that Lipozyme CALB L's enzyme loading would be halved compared to Neutrase for enzyme concentration optimization studies.
The upper limit of reaction times studied for the enzymatic treatment was increased from 6 to 24 h to ensure that the enzymes had enough time to completely hydrolyze non-collagenous proteins and lipids. The upper temperature limit did not change, however the lower limit increased from 25 to 30 °C because in initial screenings it was shown that experiments were not successful at 25 °C, and 30 °C is the minimum temperature described by the suppliers for the optimal activity of Neutrase and Lipozyme CALB L.
Before completing the DoE for this process, we wanted to evaluate the experimental setup and assess whether our initial screening method was reproducible. In the incubator, three samples were treated at 55 °C for 24 h with 25 μL g−1 Neutrase and 25 μL g−1 Lipozyme CALB L. The resulting wt loss of these samples were 88.4%, 89.1%, and 91.2% and while these variations do not seem significant, they are in the narrow range of 80–93% observed for all processing methods explored here. The FTIR spectra however are very similar for these samples (Fig. S8†) and suggest a similar level of purity. Since samples have variations in the starting ratio of meat to bone, using only wt loss as the sole determining factor to assess protein and lipids had been hydrolyzed is inadequate. Therefore, for the optimization experiments using Neutrase and Lipozyme CALB L, characterization techniques and visual inspection were used alongside wt loss to determine if an experiment is successful.
Optimized enzymatic treatment to isolate sHAP from salmon frames
For the final optimization experiments, we used a pass/fail response system using a combination of wt loss, spectroscopic techniques, and by visually inspecting the samples. To pass this test, a sample must (i) experience a wt loss of > 85%, (ii) its FTIR spectrum must have no peaks associated to lipids (1743 cm−1) or non-collagenous protein (1393, 1305, 1160, and 1117 cm−1), (iii) no significant peaks at 2θ = 20 or 45° observed in the XRD diffractogram and (iv) there must be no meat visible on the sample. Even trace amounts of meat present on the sHAP would result in a fail response. An example of what a pass or fail response to sHAP isolation is shown in Fig. 5. While a pass/fail response was not used for initial screening optimizations using Neutrase since it was believed at the time that wt loss would be sufficient, the table has been updated to include whether the result of those experiments would be pass/fail (Table S1†).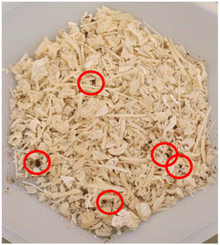 | ||
| Fig. 5 Example of sHAP that would be considered a fail response (crude sHAP). Small and dark pieces of flesh remain within the sample (circled in red). | ||
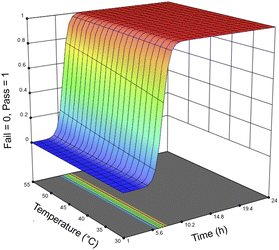
For the optimization of the enzymatic treatment, an entire salmon frame was used as a sample rather than pieces of the frame to minimize potential variations caused by mass (Fig. S9†). To accommodate the increased biomass loading for the optimization study, samples were mixed using an overhead stirrer and heated using a hot plate rather than using an incubator shaker. Based on the first DoE that only looked at using Neutrase alone, the variables were optimized in order of significance: first the enzyme loading, followed by the reaction time, and then finally the temperature. Seventeen samples were treated with 1–25 μL g−1 Neutrase and 0.5–25 μL g−1 Lipozyme CALB L at 30–55 °C for 1–24 h (Table 4). Fig. 6 shows the response surface of the probability of all meat being removed by the enzymes, the time, and the temperature. Because we are using a pass/fail system, the response surface looks different than those of the Neutrase-only experiments, however it shows that by increasing the time and temperature there is a higher probability that the proteins and lipids have been hydrolyzed. The response surface figure of the relationship between time, enzyme loadings, and the probability of all meat being hydrolyzed is shown in Fig. S4.†
| Entry | Neutrase loading (μL g−1) | Lipozyme CALB L loading (μL g−1) | Temperature (°C) | Time (h) | Pass/fail |
|---|---|---|---|---|---|
| 2A | 25 | 25 | 55 | 24 | Pass |
| 2B | 25 | 25 | 55 | 6.0 | Pass |
| 2C | 25 | 25 | 55 | 20 | Pass |
| 2D | 25 | 25 | 55 | 18 | Pass |
| 2E | 25 | 25 | 55 | 10 | Pass |
| 2F | 25 | 25 | 55 | 2.0 | Fail |
| 2G | 25 | 25 | 55 | 1.0 | Fail |
| 2H | 25 | 25 | 55 | 3.0 | Fail |
| 2I | 25 | 25 | 55 | 4.0 | Fail |
| 2J | 25 | 25 | 55 | 5.0 | Fail |
| 2K | 10 | 5.0 | 55 | 6.0 | Fail |
| 2L | 1.0 | 0.50 | 55 | 6.0 | Fail |
| 2M | 5.0 | 2.5 | 55 | 6.0 | Fail |
| 2N | 15 | 7.5 | 55 | 6.0 | Pass |
| 2O | 15 | 7.5 | 35 | 6.0 | Fail |
| 2P | 15 | 7.5 | 30 | 6.0 | Fail |
| 2Q | 15 | 7.5 | 40 | 6.0 | Pass |
The final parameters for an optimized enzymatic treatment to isolate sHAP from a single salmon frame (mass range: 200–450 g) were 6 h at 40 °C using 15 μL g−1 Neutrase and 7.5 μL g−1 Lipozyme CALB L and the resulting wt loss from this optimized treatment was 90.6 ± 1.1%. We characterized the isolated sHAP from entry 2Q (Table 4) using FTIR and XRD (Fig. S10 and S12†) to confirm the biomineral isolated was pure. Herein, the product from 2Q will be referred to as “pure sHAP” and the FTIR and XRD data were discussed above (Fig. 2 and 3).
TGA was used to quantify the collagen remaining in pure sHAP (Fig. 7). There was a total mass loss of 41.6%. The first significant mass loss of 4.55%, from 0 to 200 °C, is associated with water evaporating. The 35.6% mass change from 200 to 650 °C is from water and residual collagen remaining in the bone matrix. The 1.25% mass loss from 650 to 1000 °C is from the decomposition of carbonate ions. If the remaining 58.4% HAP is added with the mass of carbonate ions, we get 59.7%, consistent with 60% mass of bones composed of inorganic content (including carbonate ions), and 30% organic compounds and 10% water.14 Therefore, we conclude that the lipids and non-collagenous proteins from the salmon frame have been completely hydrolyzed.
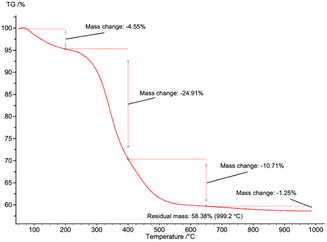 | ||
| Fig. 7 TGA curve of pure sHAP (2Q: 15 μL g−1 Neutrase, 7.5 μL g−1 Lipozyme CALB L, 6 h, 40 °C) from 0 to 1000 °C. | ||
The morphology of the isolated sHAP particles were observed by SEM and TEM. The SEM images (Fig. 8) show that there is a large size distribution in particles, and this was corroborated by DLS providing an average diameter of the particles of 1241 nm with a large polydispersity index (PDI) of 0.72. The TEM image (Fig. 9) show the presence of both micron and nano-sized particles, along with collagen that appear as black fibers (highlight in yellow circles). Furthermore, the sHAP particles tend to aggregate which correlates with their low surface zeta potential of −8.67 mV.
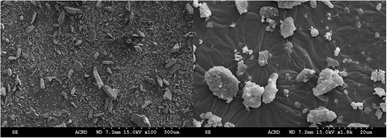 | ||
| Fig. 8 SEM images of pure sHAP (2Q: 15 μL g−1 Neutrase, 7.5 μL g−1 Lipozyme CALB L, 6 h, 40 °C) at 100× and 1800× magnification. | ||
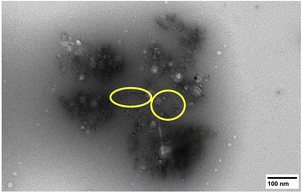 | ||
| Fig. 9 TEM image of pure sHAP (2Q: 15 μL g−1 Neutrase, 7.5 μL g−1 Lipozyme CALB L, 6 h, 40 °C). Collagen fibres are circled in yellow. | ||
1H MAS NMR spectroscopy was used to analyze the isolated pure sHAP and the resulting deconvoluted spectrum is shown in Fig. 10. The spectrum is similar to those reported in previous work of on HAP from bones.69
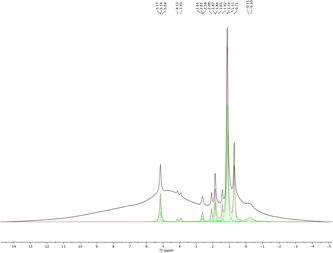 | ||
| Fig. 10 1H MAS NMR and deconvoluted spectra of pure sHAP (2Q: 15 μL g−1 Neutrase, 7.5 μL g−1 Lipozyme CALB L, 6 h, 40 °C). | ||
This optimized enzymatic treatment process was tested at larger volume to determine the feasibility of increasing the scale of the process. We were successful in isolating 54 g of sHAP by treating five salmon frames in a single treatment at 10 L with a resulting wt loss of 92%, similar to the treatment of a single frame at 2 L scale. Additionally, we were able to further produce 150 g of sHAP by treating fifteen salmon frames in a single treatment at 20 L with a 93% wt loss. FTIR analyses of the isolated sHAP, from both 10 L and 20 L scales were consistent with those obtained by single frame treatment.
HAP has been isolated from animal and fish sources previously, however these methods often use hazardous conditions that are not suitable for industry and are environmentally harmful. We compared our method with four others found in literature that use different treatments, including enzymes, calcination, and base treatment (Table 5) using a simplified Life Cycle Analysis (LCA) developed by Mercer et al.70 Full details on calculations are available in the ESI.† Our work and Nam et al.57 use enzymes and have very low potentials, but our method is slightly better for the environment as there are less CO2 emissions involved. Venkatesan et al. use NaOH and acetone,52 thus emitting more CO2, and having moderate potentials for human inhalation toxicity, human ingestion toxicity, and persistence. Ahamed et al. also use high concentrations of NaOH and acetone as well as butanol and calcination,60 thus producing even more CO2 through energy expenditures. This method leads to high potentials for smog formation, global warming, and human ingestion toxicity. Yamamura et al. use a lower concentration of NaOH, H2O2, and calcination,58 therefore its global warming potential is actually relatively low, however the human toxicity potential is far too high to be considered for industrial applications.
| a LCA = Life Cycle Analysis; ISF = smog formation potential; IGW = global warming potential; IINHT = human inhalation toxicity potential; IINGT = human ingestion toxicity potential; PER = persistence potential; ACCU = bioaccumulation potential. |
|---|

|
While we are not the first to have used enzymes to isolate HAP from fish sources,39,40,57 the previously reported methods have not been optimized and do not provide sufficient details on their experimental procedures. For example, Huang et al. do not elaborate on what protease was used in the first step of enzymatic process and do not describe the pH, temperature, or medium of the reaction.39 Nam et al. and Ismail et al. use enzymatic processes that are relatively mild, however they still use calcination as the final step which requires a lot of energy and would add significant costs on an industrial scale and increase the carbon footprint for the process.40,57 We have successfully developed and optimized an enzymatic process that could be implemented in industry and has the lowest LCA potentials compared to various other treatment methods. Additionally, we have further proven that this process is potentially scalable to larger volumes to produce sHAP from salmon frames.
Another important consideration for industrial applicability is the cost of the process, so we performed a rudimentary economic assessment based on the cost of the enzymes used. From university suppliers of chemicals, Neutrase can be purchased at $165.00 for 250 mL, or 250![[thin space (1/6-em)]](https://www.rsc.org/images/entities/char_2009.gif) 000 μL. On a 10 L scale, 1674 g of fish frame (five fish frames) were treated and required 8355 μL Neutrase, producing 54 g sHAP and costing $5.56. Lipozyme CALB L can be purchased for $270.00 for 250 mL and based on the similar calculations, it would cost $4.51 to treat five fish frames. Therefore, the total cost for the enzyme mixture to treat five frames and produce 54 g sHAP is $10.02, or approximately $2.00 per frame or $0.19 per gram. Meanwhile, the price for 100 g of reagent grade HAP from a university chemical supplier is $553.00, or $5.53 per gram. This demonstrates that the cost of enzymes should not be a hindrance to commercializing this sort of process.
000 μL. On a 10 L scale, 1674 g of fish frame (five fish frames) were treated and required 8355 μL Neutrase, producing 54 g sHAP and costing $5.56. Lipozyme CALB L can be purchased for $270.00 for 250 mL and based on the similar calculations, it would cost $4.51 to treat five fish frames. Therefore, the total cost for the enzyme mixture to treat five frames and produce 54 g sHAP is $10.02, or approximately $2.00 per frame or $0.19 per gram. Meanwhile, the price for 100 g of reagent grade HAP from a university chemical supplier is $553.00, or $5.53 per gram. This demonstrates that the cost of enzymes should not be a hindrance to commercializing this sort of process.
Conclusions
Current methods to valorize fish bones by isolating HAP typically involve very high temperatures or high concentrations of NaOH, therefore it would be a challenge for fish processing plants to replicate them and produce a new renewable, mineral product stream. Using enzymes provides a unique, green, energy efficient, and cost-friendly method to isolate HAP that could potentially be applied industrially in fish processing plants. We optimized the process to ensure that as little energy and enzyme are necessary to yield high-quality sHAP. Minced salmon frames were pre-treated with boiling tap water for 1 h followed by enzymatic hydrolysis for 6 h at 40 °C using 15 μL g−1 Neutrase and 7.5 μL g−1 Lipozyme CALB L. We then demonstrated the scalability of the optimized process to 20 L scale. A simplified LCA was performed to compare the environmental and industrial hazards associated with current methods to isolate HAP and our treatment had the lowest LCA potentials. We are now focusing on scaling up the process even further and developing novel applications for the sHAP. Further optimizations could potentially allow recycling or reuse of the enzymes, however this would require much more research.71Author contributions
Conceptualization, F. M. K. and E. L.; methodology, S. B., F. M. K., and E. L.; characterization, S. B., Y. L. and S. H.; writing – original draft preparation, S. B.; writing – review and editing, S. B., F. M. K., E. L., A. C. W. L., Y. L. and S. H.; supervision, E. L. and F. M. K., funding acquisition, F. M. K. and E. L. All authors listed have agreed to the final version of this manuscript and have made significant contributions.Conflicts of interest
There are no conflicts to declare.Acknowledgements
We thank NRC Ocean program, OGEN (OCN-110-4), OFI, NSERC of Canada, and Memorial University (MUNL) for funding. We thank The Seafood Shop, Sis' Seafood, and The Fish Depot for their donation of salmon frames. The authors also thank Dr Kelly Hawboldt (Faculty of Engineering, MUNL) for the use of her laboratory, Heather Fifield (Department of Biochemistry, MUNL) for the use of her freeze dryer, and Dr Céline Schneider (C-CART, MUNL) for the analysis and advice using 1H MAS NMR.References
- Food and Agriculture Organization of the United Nations, The State of World Fisheries and Aquaculture, Contributing to Food Security and Nutrition for All, Rome, 2016, vol. 200 Search PubMed.
- J. W. Levis and M. A. Barlaz, Environ. Sci. Technol., 2011, 45, 7438–7444 CrossRef CAS PubMed.
- V. N. de Jonge, M. Elliott and E. Orive, Causes, historical development, effects, and future challenges of a common environmental problem: eutrophication, in Nutrients and Eutrophication in Estuaries and Coastal Waters, ed. E. Orive, M. Elliott and V. N. de Jonge, Kluwer Academic Publishers, Amsterdam, 2002, pp. 1–19 Search PubMed.
- Fisheries and Oceans Canada, https://www.dfo-mpo.gc.ca/stats/aqua/aqua20-eng.htm, accessed July 23rd, 2023.
- Fisheries and Oceans Canada, https://www.dfo-mpo.gc.ca/stats/commercial/land-debarq/freshwater-eaudouce/2020-eng.htm, accessed July 23rd, 2023.
- Fisheries and Oceans Canada, https://www.dfo-mpo.gc.ca/stats/commercial/land-debarq/sea-maritimes/s2020pv-eng.htm, accessed July 23rd, 2023.
- Fisheries and Oceans Canada, https://www.dfo-mpo.gc.ca/aquaculture/sector-secteur/species-especes/salmon-saumon-eng.htm, accessed July 23rd, 2023.
- M. Lancaster, Green Chemistry: an Introductory Text, Royal Society of Chemistry, Cambridge, 3rd edn, 2016 Search PubMed.
- H. Jafari, A. Lista, M. M. Siekapen, P. Ghaffari-Bohlouli, L. Nie, H. Alimoradi and A. Shavandi, Polymers, 2020, 12, 2230 CrossRef CAS PubMed.
- L. Najafian and A. S. Babji, Peptides, 2012, 33, 178–185 CrossRef CAS PubMed.
- F. Hajiali, J. Vidal, T. Jin, L. C. de la Garza, M. Santos, G. Yang and A. Moores, ACS Sustainable Chem. Eng., 2022, 10, 11348–11357 CrossRef CAS.
- L.-B. Mao, H.-L. Gao, H.-B. Yao, L. Liu, H. Cölfen, G. Liu, S.-M. Chen, S.-K. Li, Y.-X. Yan, Y.-Y. Liu and S.-H. Yu, Science, 2016, 354, 107–110 CrossRef CAS PubMed.
- J. N. Murphy, K. Hawboldt and F. M. Kerton, Green Chem., 2018, 20, 2913–2920 RSC.
- X. Feng, Curr. Chem. Biol., 2009, 3, 189–196 CAS.
- S. M. George, C. Nayak, I. Singh and K. Balani, ACS Biomater. Sci. Eng., 2022, 8, 3162–3186 CrossRef CAS PubMed.
- M. Sari, P. Hening, Chotimah, I. D. Ana and Y. Yusuf, Biomater. Res., 2021, 25, 2 CrossRef CAS PubMed.
- S. V. Dorozhkin and M. Epple, Angew. Chem., Int. Ed. Engl., 2002, 41, 3130–3146 CrossRef CAS PubMed.
- A. Mathirat, P. A. Dalavi, A. Prabhu, Y. Devi G.V., S. Anil, K. Senthilkumar, G. H. Seong, S. S. Sargod, S. S. Bhat and J. Venkatesan, Nanomaterials, 2022, 12, 3993 CrossRef CAS PubMed.
- A. I. Adeogun, E. A. Ofudje, M. A. Idowu, S. O. Kareem, S. Vahidhabanu and B. R. Babu, ACS Omega, 2018, 3, 1991–2000 CrossRef CAS PubMed.
- M. Nurhadi, R. Kusumawardani, W. Wirhanuddin, R. Gunawan and H. Nur, Bull. Chem. React. Eng. Catal., 2019, 14, 660–671 CrossRef.
- S. Sathiyavimal, S. Vasantharaj, M. Shanmugavel, E. Manikandan, P. Nguyen-Tri, K. Brindhadevi and A. Pugazhendhi, Prog. Org. Coat., 2020, 148, 105890 CrossRef CAS.
- H. Hou, R. Zhou, P. Wu and L. Wu, Chem. Eng. J., 2012, 211–212, 336–342 CrossRef CAS.
- K. Aziz, R. Mamouni, A. Azrrar, B. Kjidaa, N. Saffaj and F. Aziz, Ceram. Int., 2022, 48, 15811–15823 CrossRef CAS.
- A. Corami, S. Mignardi and V. Ferrini, J. Colloid Interface Sci., 2008, 317, 402–408 CrossRef CAS PubMed.
- W. Dungkaew, K. J. Haller, A. E. Flood and J. F. Scamehorn, Adv. Mater. Res., 2012, 506, 413–416 CAS.
- P. Sricharoen, N. Limchoowong, P. Nuengmatcha and S. Chanthai, Ultrason. Sonochem., 2020, 63, 104966 CrossRef CAS PubMed.
- M. Galamboš, P. Suchánek and O. Rosskopfová, J. Radioanal. Nucl. Chem., 2012, 293, 613–633 CrossRef.
- M. Z. Mokhtar, J. He, M. Li, Q. Chen, J. C. R. Ke, D. J. Lewis, A. G. Thomas, B. F. Spencer, S. A. Haque and B. R. Saunders, Chem. Commun., 2021, 57, 994–997 RSC.
- R. More and P. More, Bull. Mater. Sci., 2022, 45, 111 CrossRef CAS.
- Z. Boukha, J. González-Prior, B. de Rivas, J. R. González-Velasco, R. López-Fonseca and J. I. Gutiérrez-Ortiz, Appl. Catal., B, 2016, 190, 125–136 CrossRef CAS.
- V. C. Ghantani, S. T. Lomate, M. K. Dongare and S. B. Umbarkar, Green Chem., 2013, 15, 1211–1217 RSC.
- W. Khoo, F. M. Nor, H. Ardhyananta and D. Kurniawan, Procedia Manuf., 2015, 2, 196–201 CrossRef.
- J. A. Rincón-López, J. A. Hermann-Muñoz, A. L. Giraldo-Betancur, A. De Vizcaya- Ruiz, J. M. Alvarado-Orozco and J. Muñoz-Saldaña, Materials, 2018, 11, 333 CrossRef PubMed.
- O. A. Osuchukwu, A. Salihi, I. Abdullahi and D. O. Obada, Mater. Today: Proc., 2022, 62, 4182–4187 CrossRef CAS.
- Y. Chai and M. Tagaya, Mater. Lett., 2018, 222, 156–159 CrossRef CAS.
- P. Deb, A. B. Deoghare and E. Barua, IOP Conf. Ser.: Mater. Sci. Eng., 2018, 377, 012009 Search PubMed.
- S. Paul, A. Pal, A. R. Choudhury, S. Bodhak, V. K. Balla, A. Sinha and M. Das, Ceram. Int., 2017, 43, 15678–15684 CrossRef CAS.
- D. Ulfyana, F. Anugroho, S. H. Sumarlan and Y. Wibisono, IOP Conf. Ser.: Earth Environ. Sci., 2018, 131, 012038 CrossRef.
- Y.-C. Huang, P.-C. Hsiao and H.-J. Chai, Ceram. Int., 2011, 37, 1825–1831 CrossRef CAS.
- N. F. Ismail, S. Hamzah, N. A. Razali, W. M. H. W. Yussof, N. Ali and A. W. Mohammad, Malaysian J. Anal. Sci., 2019, 23, 938–949 Search PubMed.
- W. Pon-On, P. Suntornsaratoon, N. Charoenphandhu, J. Thongbunchoo, N. Krishnamra and I. M. Tang, Mater. Sci. Eng., C, 2016, 62, 183–189 CrossRef CAS PubMed.
- M. Alias, S. Hamzah and J. Saidin, Int. J. Eng. Technol., 2018, 7, 3726–3730 CrossRef CAS.
- Y. Alparslan, J. Food Sci., 2017, 90–96 Search PubMed.
- D. Ayala-Barajas, V. González-Vélez, M. Vélez-Tirado and J. Aguilar-Pliego, Hydroxyapatite extraction from fish scales of Tilapia, in 42nd Annual International Conference of the IEEE Engineering in Medicine & Biology Society, Institute of Electrical and Electronics Engineers, Montreal, 2020, pp. 2206–2208 Search PubMed.
- J. Athinarayanan, V. S. Periasamy and A. A. Alshatwi, Mater. Sci. Eng., C, 2020, 117, 111313 CrossRef CAS PubMed.
- N. S. S. A. Buraiki, B. Ali Albadri, S. Alsheriqi, B. Alshabibi, S. Al-Mammari, S. Premkumar, M. K. Sah and M. S. Sudhakar, Mater. Today: Proc., 2020, 27, 2609–2616 CrossRef CAS.
- N. Muhammad, Y. Gao, F. Iqbal, P. Ahmad, R. Ge, U. Nishan, A. Rahim, G. Gonfa and Z. Ullah, Sep. Purif. Technol., 2016, 161, 129–135 CrossRef CAS.
- P. Surya, A. Nithin, A. Sundaramanickam and M. Sathish, J. Mech. Behav. Biomed. Mater., 2021, 119, 104501 CrossRef CAS PubMed.
- M. Boutinguiza, J. Pou, R. Comesaña, F. Lusquiños, A. de Carlos and B. León, Mater. Sci. Eng., C, 2012, 32, 478–486 CrossRef CAS.
- P. Shi, M. Liu, F. Fan, C. Yu, W. Lu and M. Du, Mater. Sci. Eng., C, 2018, 90, 706–712 CrossRef CAS PubMed.
- J. A. da Cruz, W. R. Weinand, A. M. Neto, R. S. Palácios, A. J. M. Sales, P. R. Prezas, M. M. Costa and M. P. F. Graça, JOM, 2020, 72, 1435–1442 CrossRef CAS.
- J. Venkatesan, B. Lowe, P. Manivasagan, K.-H. Kang, E. P. Chalisserry, S. Anil, D. G. Kim and S.-K. Kim, Mater., 2015, 8, 5426–5439 CrossRef CAS PubMed.
- B. R. Sunil and M. Jagannatham, Mater. Lett., 2016, 185, 411–414 CrossRef CAS.
- T. M. Coelho, E. S. Nogueira, W. R. Weinand, W. M. Lima, A. Steimacher, A. N. Medina, M. L. Baesso and A. C. Bento, J. Appl. Phys., 2007, 101, 084701 CrossRef.
- T. Goto and K. Sasaki, Ceram. Int., 2014, 40, 10777–10785 CrossRef CAS.
- M. Ozawa and S. Suzuki, J. Am. Ceram. Soc., 2002, 85, 1315–1317 CrossRef CAS.
- P. V. Nam, N. V. Hoa and T. S. Trung, Ceram. Int., 2019, 45, 20141–20147 CrossRef CAS.
- H. Yamamura, V. H. P. da Silva, P. L. M. Ruiz, V. Ussui, D. R. R. Lazar, A. C. M. Renno and D. A. Ribeiro, J. Mech. Behav. Biomed. Mater., 2018, 80, 137–142 CrossRef CAS PubMed.
- A. Pal, S. Paul, A. R. Choudhury, V. K. Balla, M. Das and A. Sinha, Mater. Lett., 2017, 203, 89–92 CrossRef CAS.
- A. F. Ahamed, M. Manimohan and N. Kalaivasan, J. Inorg. Organomet. Polym., 2022, 32, 3902–3922 CrossRef CAS.
- M. C. R. Franssen, P. Steunenberg, E. L. Scott, H. Zuilhof and J. P. M. Sanders, Chem. Soc. Rev., 2013, 42, 6491–6533 RSC.
- A. R. M. Silva, J. Y. N. H. Alexandre, J. E. S. Souza, J. G. L. Neto, P. G. S. Junior, M. P. V. Rocha and J. C. S. dos Santos, Molecules, 2022, 27, 4529 CrossRef CAS PubMed.
- O. Hassan, T. P. Ling, M. Y. Maskat, R. Md. Illias, K. Badri, J. Jahim and N. M. Mahadi, Biomass Bioenergy, 2013, 56, 137–146 CrossRef CAS.
- J. V. Tongco, S. Kim, B.-R. Oh, S.-Y. Heo, J. Lee and S. Hwang, Biotechnol. Bioprocess Eng., 2020, 25, 132–140 CrossRef CAS.
- O. A. Adekoya and I. Sylte, in Encyclopedia of Metalloproteins, ed. R. H. Kretsinger, V. N. Uversky and E. A. Permyakov, Springer, New York, NY, 2013, pp. 2213–2221 Search PubMed.
- E. Castillo, L. Casas-Godoy and G. Sandoval, Biocatalysis, 2015, 1, 178–188 Search PubMed.
- NL Marine Organics, https://nlmarineorganics.com/accessed July 23rd, 2023.
- D. C. Montgomery, Design and Analysis of Experiments, John Wiley and Sons, Hoboken NJ, 8th edn, 2013 Search PubMed.
- A. Kaflak-Hachulska, A. Samoson and W. Kolodziejski, Calcif. Tissue Int., 2003, 73, 476–486 CrossRef CAS PubMed.
- S. M. Mercer, J. Andraos and P. G. Jessop, J. Chem. Educ., 2012, 89, 215–220 CrossRef CAS.
- H. Jorgensen and M. Pinelo, Biofuels, Bioprod. Biorefin., 2016, 1, 150–167 Search PubMed.
Footnote |
| † Electronic supplementary information (ESI) available: Response surface plots, FTIR spectra, XRD diffractograms, NMR spectrum, LCA calculations. See DOI: https://doi.org/10.1039/d3su00102d |
| This journal is © The Royal Society of Chemistry 2023 |

