 Open Access Article
Creative Commons Attribution 3.0 Unported Licence
Platinum–tin as a superior catalyst for proton exchange membrane fuel cells†
Prabal
Sapkota
a,
Sean
Lim
 b and
Kondo-Francois
Aguey-Zinsou
 *c
*c
aMERLin, School of Chemical Engineering, The University of New South Wales, Sydney, NSW 2052, Australia
bElectron Microscope Unit, University of New South Wales, Sydney, NSW 2052, Australia
cMERLin, School of Chemistry, University of Sydney, NSW 2006, Australia. E-mail: f.aguey@sydney.edu.au
First published on 15th February 2023
Abstract
This work reports on the synthesis of a platinum (Pt)–tin (Sn) catalyst supported on Vulcan carbon (VC) for the superior electrooxidation of molecular hydrogen at the anode and electroreduction of molecular oxygen at the cathode of a proton exchange membrane fuel cell. The synthesis was done by using the polyol process. The resulting electrocatalyst with a Pt/Sn mass ratio of 3 (PtSn/VC(3)) demonstrated superior electrocatalytic activity of 3- and 1.4-fold over Pt/VC (synthesized as a reference catalyst) for the reduction of oxygen and oxidation of hydrogen, respectively. The developed PtSn/VC(3) catalyst also demonstrated a greater mass activity of 373 mA mgPt−1, i.e. a 2.4-fold improvement compared to Pt/VC for oxygen reduction. The superiority of PtSn/VC(3) was further confirmed upon operation in a self-breathing fuel cell. A maximum power density of 96 mW cm−2 was observed, i.e. a 45% improvement in terms of power density as compared to Pt/VC. In addition, this new PtSn/VC(3) catalyst demonstrated remarkable stability under accelerated stress test where a fuel cell performance degradation of 9% was observed after 60![[thin space (1/6-em)]](https://www.rsc.org/images/entities/char_2009.gif) 000 fuel cell cycles with a 85% of maximum power density retention.
000 fuel cell cycles with a 85% of maximum power density retention.
Sustainability spotlightThis works addresses the SDG 7 by advancing technologies in the form of better electrocatalysts and fuel cells architectures that can help to ensure the access to affordable, reliable, and sustainable energy and modern energy for all. |
Introduction
Proton Exchange Membrane Fuel Cells (PEMFCs) are important in the context of the hydrogen economy as they generate electrical power in a wide range of applications from miniature devices to vehicles.1 In PEMFCs, platinum (Pt) remains the preferred catalyst at both the anode and the cathode.2 However, due to its cost and limited availability, the amount of platinum that is being used must be minimized if not completely eliminated. The amount of Pt used at the cathode is higher than at the anode mainly due to the slow kinetic of the Oxygen Reduction Reaction (ORR) at the cathode. It is 5 fold slower than the Hydrogen Oxidation Reaction (HOR) at the anode.3 As a consequence, most of the Pt in PEMFCs is at the cathode.4To reduce the amount of Pt in fuel cells two main approaches have emerged along: (1) the alloying of Pt with other elements with the aim to enhance the catalytic activity for ORR with the assumption that alloying leads to an increase in catalytic active sites;2,5 and (2) the development of non-platinum based catalysts. Pt-alloys that have been reported include transition metals such as copper (Cu), nickel (Ni), cobalt (Co) and iron (Fe)4 and the following trend of increasing electrocatalytic activities Pt < Pt3Ti < Pt3V < Pt3Ni < Pt3Fe ≈ Pt3Co has been reported.4,6–8 In this case, the activity of Pt3Co exceeded that of Pt by 3-fold (at 0.9 V vs. SHE 0.1 M HClO4).
Non-platinum based catalysts, mainly include carbon based catalysts: such as carbon (C)/nitrogen (N) composites,9 C/N/Fe4,10 and Fe/Ni/N-graphene.4,11 These catalysts have shown good electrocatalytic activity, for example FeNC, displayed an ORR activity of 2.5 mA cm−2 (at the half wave potential E1/2 = 0.76 V vs. SHE, 0.05 M H2SO4).12
When Pt is alloyed with transition metals, it is expected that the Pt–Pt bond distance is reduced, and this would lead to a decrease in the chemisorption energy of the adsorbates (e.g. O˙ and HO˙) at the active sites and thus improved catalytic activity.13 Alloying Pt with other elements of different atomic sizes (e.g. Co, Fe) are found to increase the surface roughness, and as a result increase the catalytic surface area.14 A weaker adsorption of intercedes species (e.g. HO˙, HOO˙ and O˙) has also been reported as a result of the downshift in the d-band center of Pt upon alloying, and this leads to improved ORR.4,6,13,14 In addition, due to a weaker adsorption of the intermediary species (i.e. O˙, HO˙ and HOO˙) at the catalytic site, the surface of Pt based alloys is less prone to the formation of an oxide layer.2,15
Apart from Pt, other noble metals such as Pd alloyed with Pt, Ru and Ir have also been investigated for ORR. For example, bimetallic Pd0.33Pt0.66 and trimetallic PtPdCu have been found to surpass the performance of Pt by 1.7-fold (at E1/2 = 0.84 V vs. SHE, 0.1 M HClO4) and 4.7-fold (at E1/2 = 0.94 V vs. SHE, 0.1 M HClO4), respectively.16,17
Although Pt plays a crucial role at both the anode and cathode of PEMFCs, considerably less work has been reported on HOR in comparison to ORR. Among the few reports, Pd was alloyed with noble metals such as Ru, Ir 2,18and PdIr showed enhanced electroactivity over Pt by a factor 1.8 (at 0.20 V vs. SHE, 0.5 M H2SO4).18 Similarly, Pt alloyed with Cu showed a 2.4 fold increase in HOR activity compared to Pt (at 0.2 V vs. SHE, 0.1 HClO4)4 and PtP2 (platinum phosphide)/PNC (phosphorous and nitrogen doped carbon) showed a 1.47 fold (0.2 V vs. SHE, 0.1 HClO4) enhancement over Pt/C.19
Despite the excellent performances of some of the alternative Pt alloy catalysts for both the oxidation of hydrogen and the reduction of oxygen, very few of these catalysts have been tested under real fuel cell environments. Accordingly, it is difficult to assess the potential of these catalysts as an alternative to Pt.13 To date, the focus of PEMFCs research has been mainly on vehicular applications. However, the need for better power sources for portable and miniature applications cannot be overlooked. The amount of Pt used in small fuel cell stacks of low power rating is higher (i.e. 0.5 mg cm−2) in comparison to stacks for commercial vehicular application (i.e. 0.25–0.35 mg cm−2);20 and this is driven by the lower operating temperature of small stacks of a few 100 W and the slow reaction kinetics at low temperatures. The need to reduce the amount of Pt in small stacks is thus important.
Herein, we report on a single-step method to make a very active and durable platinum–tin on Vulcan Carbon (VC), noted as PtSn/VC(3) ORR and HOR electrocatalyst.4,21 The catalyst contains a minimum amount of Pt (20 wt%) and is suitable for both the anode and cathode of a PEMFC. Sn has been found to be effective in the decomposition of water and the electrooxidation of ethanol and methanol in fuel cells to produce H+.22–24 Accordingly, we assumed that the addition of Sn to Pt would facilitate the oxidation of H2 as Pt–Sn and PtSnO2 have been reported to be highly active in methanol and ethanol oxidation.25,26 Through theoretical studies, the addition of Sn to Pt was also reported to increase the number of ‘H˙’ adsorption sites and decrease the energy for hydrogen adsorption at active sites (0.5 eV for Pt compared to 0.38 eV for a thin layer of Sn deposited on the surface of Pt).27 In addition to facilitating the oxidation of H2, Sn was also reported to facilitate O2 reduction, for example the introduction of Sn to Pt was found to facilitate the adsorption of O2 at a lower potential (0.45 V vs. SHE) than Pt (0.8 V vs. SHE).28 The formation of SnO2 during ORR is finally assumed to prevent the oxidation of Pt. The latter helps to minimize Pt dissolution and increases the number of active sites for O2 adsorption.24,29 Alloying Sn with Pt was thus expected to enhance its electrocatalytic activity as well as lead to synergistic effects for both HOR and ORR. Accordingly, this work reports on a new catalyst suitable for both ORR and HOR and its performance in a self-breathing PEMFC. To the best of our knowledge, this is among the first attempts to do so. In addition, an accelerated stress test of PtSn/VC(3) revealed a remarkably low fuel cell performance degradation of 9% over 60![[thin space (1/6-em)]](https://www.rsc.org/images/entities/char_2009.gif) 000 cycles.
000 cycles.
Experimental section
Materials
Chloroplatinic acid hexahydrate (H2PtCl6·6H2O, ≥99.9% trace metals basis), tin(II) chloride dihydrate (SnCl2·2H2O, 98%), ethylene glycol (anhydrous 99.8%), 2-propanol (99.7%), perchloric acid (70%, 99.99%) were purchased from Sigma-Aldrich. Vulcan XC 72R, Nafion™ 212, Nafion™ dispersion (10 wt%), Gas Diffusion Layer (GDL): (Freudenberg H23C2), 40 wt% platinum on Vulcan Carbon (VC) (fuel cell grade) were purchased from Fuel Cell Store. For all the synthesis, Milli Q water was used.Synthesis of platinum–tin alloy on vulcan carbon PtSn/VC(3)
Platinum–tin on VC was prepared based on the polyol process previously reported.4,21,30 In brief, 50 mg of VC was mixed with 33 mL of ethylene glycol, 17 mL of Milli Q water, 30 mg of H2PtCl6·6H2O and 10 mg of SnCl2·2H2O in a 100 mL single neck round bottom flask. After sonication for 5 min for homogenization the mixture was continuously stirred for 15 h at room temperature. The following day, the round flask, containing the total mixture, was heated to 120 °C for 2 h under reflux and continuously stirred for the reduction of Pt and Sn on the carbon substate. After cooling, the obtained catalyst was washed three times with Milli Q water and separated by centrifugation at 10![[thin space (1/6-em)]](https://www.rsc.org/images/entities/char_2009.gif) 000 rpm. The resulting material was dried under vacuum at 60 °C for 15 h. The same procedure was repeated to synthesize all the catalysts of varied amounts of Pt/Sn. The synthesized catalysts supported by VC are noted as PtSn/VC(3) for 20% Pt 7% Sn as PtSn/VC(1.5) for 20% Pt 14% Sn and PtSn/VC(1) for 20% Pt 20% Sn and commercial 40% Pt/VC as Pt*/VC. The same method was used to synthesized 20% Pt on VC without Sn and this is referred to as Pt/VC. The number in brackets corresponds to the mass ratio Pt/Sn. By ICP-OES, it was confirmed that PtSn/VC(3) contained 19.4 ± 0.2% of Pt and 6.8 ± 0.1% of Sn, which means that the material corresponded to the initial amounts of Pt and Sn used for the synthesis.
000 rpm. The resulting material was dried under vacuum at 60 °C for 15 h. The same procedure was repeated to synthesize all the catalysts of varied amounts of Pt/Sn. The synthesized catalysts supported by VC are noted as PtSn/VC(3) for 20% Pt 7% Sn as PtSn/VC(1.5) for 20% Pt 14% Sn and PtSn/VC(1) for 20% Pt 20% Sn and commercial 40% Pt/VC as Pt*/VC. The same method was used to synthesized 20% Pt on VC without Sn and this is referred to as Pt/VC. The number in brackets corresponds to the mass ratio Pt/Sn. By ICP-OES, it was confirmed that PtSn/VC(3) contained 19.4 ± 0.2% of Pt and 6.8 ± 0.1% of Sn, which means that the material corresponded to the initial amounts of Pt and Sn used for the synthesis.
Preparation of the catalyst ink
1.1 mg of as-synthesised catalyst, 480 μL of Milli Q water, 20 μL of Nafion 10% in water and 120 μL of 2-propanol were mixed and sonicated for 5 min to form a homogenous mixture. A glassy carbon electrode was polished with the help of an alumina suspension on a microcloth disk. 2 μL of the catalyst ink was pipetted and dropped onto the polished glassy carbon electrode surface (3 mm diameter) and left to dry at room temperature. The catalyst loading for all the experiments by Rotating Disk Electrode (RDE) was 50 μg cm−2.For making the fuel cell, 24 mg of as-synthesized catalyst was added to a vial. 125 μL of Milli Q water, 100 μL Nafion 10% in water and 500 μL of 2-propanol were added. The final volume was adjusted by adding 1.5 mL of 2-propanol. The mixture was sonicated for 5 min and left to stir overnight at room temperature.
Preparation of the membrane electrode assembly
The catalyst ink was dispersed on the microporous layer of the GDL by using the doctor blade technique. This was then dried in an oven at 60 °C for 1 h. Nafion 212 was used without pre-treatment. The Membrane Electrode Assembly (MEA) was formed by placing the catalyst coated GDL on either side of the Nafion membrane and hot pressing at 0.18 MPa and 90 °C for 2 min. The catalyst (metals on VC) loading in all the MEAs was 0.8 mg cm−2, the ionomer (Nafion) in the MEA was 30 wt% of the solid dispersed in the catalyst ink. The active area of the MEA was 2 cm2.Characterization
High-Resolution Transmission Electron Microscopy (HRTEM) and Energy Dispersive X-ray Spectroscopy (EDS) were performed with a JEOL JEM-F200 cold field emission gun operated at 200 kV with an attached windowless 100 mm2 silicon drift X-ray detector. To this aim, the as-synthesized catalysts were dispersed in ethanol and sonicated before being dropped casted onto a carbon coated copper grid.X-Ray Diffraction (XRD) was performed by using a Philips X'pert Multipurpose XRD system operated at 40 mA and 45 kV and equipped with a monochromated Cu Kα radiation (λ = 1.541 Å). Diffraction patterns were recorded between 15 to 80°. X-Ray Photoelectron Spectroscopy (XPS) was performed by using a Thermo ESCALAB250Xi XPS system operated at 160 W and equipped with a mono-chromated Al K-α (1486.68 eV) X-ray source.
The amount of Pt and Sn in the as-synthesized catalysts was determined by inductively coupled plasma-optical emission spectrometry (ICP-OES) by using an Optima7300DV (PerkinElmer, USA). For this, the materials were digested in acid (3HCl + 1HNO3).
Cyclic Voltammetry (CV) and Linear Sweep Voltammetry (LSV) were performed by using a VMP3-Biologic potentiostat. The potentiostat was connected to a Rotating Disk Electrode (Basi RDE 2) having a 3 electrodes electrochemical cell. Ag/AgCl saturated with 3 M NaCl was used as the reference electrode and a Pt wire as the counter electrode. Freshly prepared 0.1 M HClO4 was used as electrolyte. The catalyst activity reported was determined by subtracting the background measurement and iR correction.
Fuel cell testing was done by using a self-breathing single PEMFC as described in Fig. 1.31 The anode had a mixed serpentine flow field (Fig. 1a), and the opening at the air cathode was 35% of the active area of the cell (Fig. 1c), ∼2 cm2. A silicon gasket was used for sealing (Fig. 1d). Full detailed design of the self-breathing PEMFC can be found in a ref. 31.
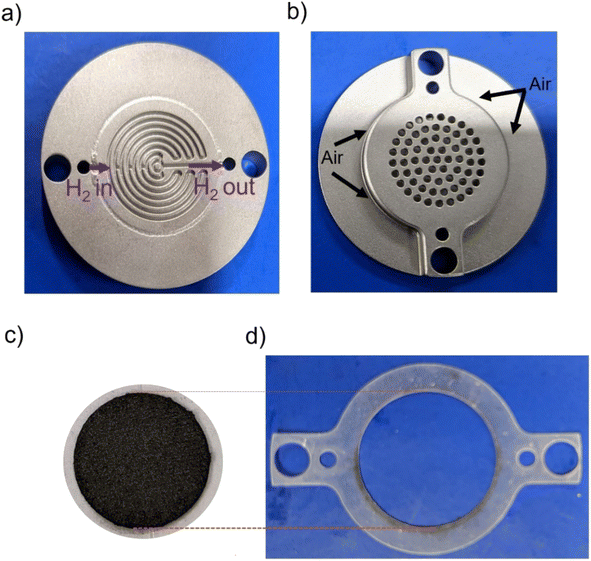 | ||
| Fig. 1 Photo of the self-breathing PEMFC showing the (a) anode, (b) open cathode, (c) MEA, (d) silicon sealing gasket. | ||
An Accelerated Stress Test (AST) was performed by modifying the protocol proposed by the US DOE and other research groups.32–35 In brief, polarization curves were run between the Open Circuit Voltage (OCV) and 0.4 V, and between each cycle, the potential was held for 3 s at the OCV and 0.4 V. The total number of cycles were 60![[thin space (1/6-em)]](https://www.rsc.org/images/entities/char_2009.gif) 000 at room temperature (25 °C) with H2 humidified at 20% RH at the anode. Although various AST protocols have been proposed to analyze the durability of Pt/C under fuel cells.32–34,36 Most of these protocols rely on testing under N2 at the cathode for 30
000 at room temperature (25 °C) with H2 humidified at 20% RH at the anode. Although various AST protocols have been proposed to analyze the durability of Pt/C under fuel cells.32–34,36 Most of these protocols rely on testing under N2 at the cathode for 30![[thin space (1/6-em)]](https://www.rsc.org/images/entities/char_2009.gif) 000.32 However, higher fuel cell degradation was reported when N2 was replaced by O2/air.33 Testing under O2/air also replicates a more realistic fuel cell environment. In addition, all current testing protocols have been designed for the scenario of vehicular application,32 and do not address the operating conditions of stationary and portable applications. As per our knowledge, there has not been any research in the past where the performance of Pt or Pt alloy catalysts has been observed under AST at low temperature and humidity. So, this work is among the first of its kind to determine the performance of catalysts under self-breathing operation for an extended period. This ensures the practicality of the platinum–tin alloy catalyst reported here.
000.32 However, higher fuel cell degradation was reported when N2 was replaced by O2/air.33 Testing under O2/air also replicates a more realistic fuel cell environment. In addition, all current testing protocols have been designed for the scenario of vehicular application,32 and do not address the operating conditions of stationary and portable applications. As per our knowledge, there has not been any research in the past where the performance of Pt or Pt alloy catalysts has been observed under AST at low temperature and humidity. So, this work is among the first of its kind to determine the performance of catalysts under self-breathing operation for an extended period. This ensures the practicality of the platinum–tin alloy catalyst reported here.
Results and discussion
Synthesis of the platinum–tin alloys
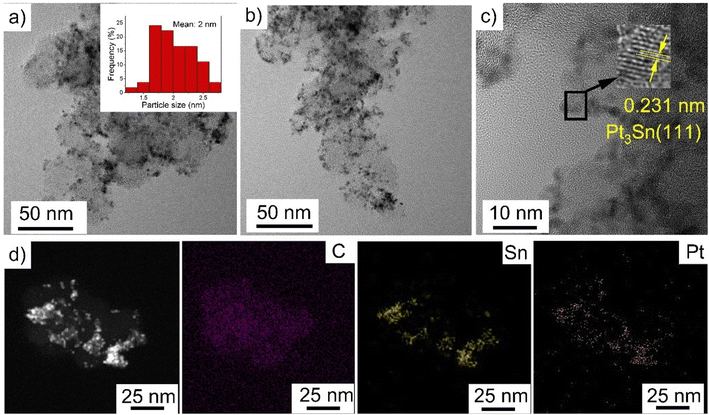
Ethylene glycol is commonly used in the polyol process because it provides good control over the particle size distribution and spatial dispersion at the surface of the support. During synthesis, it is expected that the dehydration of ethylene glycol in the presence of H2PtCl6 and SnCl2 results in the formation of acetaldehyde, which reduces Pt4+ and Sn2+ to lead to diacetyl.4,37 In this process, Pt and Sn nuclei are generated in solution and heterogenous nucleation and growth is expected to occur at the defective sites of the VC.38Characterization of PtSn/VC(3) by TEM revealed particles with an average size of 2 ± 0.3 nm uniformly dispersed on VC as shown Fig. 2. The particles had a d spacing of 0.231 nm and this would correspond to Pt3Sn (111) (Fig. 2c). The d spacing of Pt was 0.223 mm in line with previous reports.39 Increase in d spacing upon alloying Pt with Sn has been reported due to the larger atomic size of Sn(158 pm) as compared to Pt (138 pm).27,40,41
Further, STEM and elemental mapping of PtSn/VC(3) showed an uniform distribution of Pt and Sn ‘co-located’ on the VC support. This suggests that Pt3Sn particles have been synthesized on VC at a Pt/Sn mass ratio of 3 (Fig. S1†).
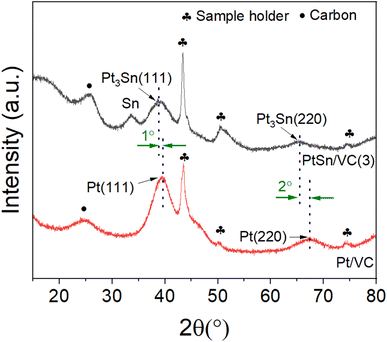
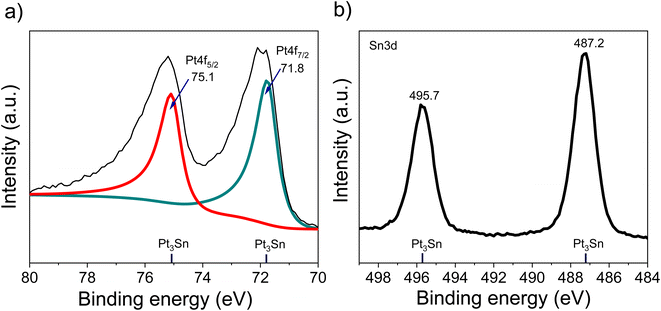
The XRD of the as-synthesized PtSn/VC(3) is shown Fig. 3. The diffraction peaks are assigned to cubic Pt3Sn. In particular, the diffraction peaks at 38.8 and 65.5° were assigned to Pt3Sn (111) and Pt3Sn (220), respectively. These peak positions are shifted slightly towards lower diffraction angles in comparison to Pt/VC synthesized in a similar manner (Fig. 3). This is in line with previous reports where a slight shift of the peaks towards lower diffraction angles is reported for PtSn/C materials.42,43 Such a shift towards lower diffraction angles suggests the formation of defects due to the formation of vacancies and dislocation as a result of alloying.44 It is noteworthy, that the observed Pt3Sn phase is in line with the Pt–Sn phase diagram (Fig. S2†) where Pt3Sn is formed at a 25% Sn and 75% Pt composition. A small diffraction peak is observed at 33.3° indicating the presence of Sn and this is assumed to be due to some Sn particles directly forming at the surface of VC.45 There is a possibility that isolated Pt particles would also have formed but their diffraction peaks would overlap with the peaks of Pt3Sn.46 The diffraction peaks at 39.8 and 67.5° are assigned to cubic Pt (111) and Pt (220), respectively. Further characterization of the as-synthesized PtSn/VC(3) by XPS is shown Fig. 4. The binding energies of Pt 4f, i.e. 71.8 and 75.1 eV are shifted by 0.7 and 0.4 eV, respectively compared to the Pt/VC (Fig. 4a and S3†). This shift to higher binding energies can be attributed to a transfer of electron from Sn to Pt as expected upon the formation of a Pt–Sn bond.47–50 Sn/SnO2 peaks were not observed by XPS and this could be due to the overlapping of these peaks (485.8–486.7 eV) with the Pt3Sn peaks (487.2 eV).51,52
Alloying also increases the d vacancy and lowers the Fermi level of Pt.49,50 Similarly, the binding energies 487.2 and 495.7 eV in the Sn 3d spectrum could be assigned to the formation of a Pt3Sn alloy.47,53 Accordingly, the XPS results are in agreement with the observations made by XRD and confirmed that no isolated Pt particles were formed at the surface of VC.
Electrocatalytic activity of platinum–tin alloys for the HOR
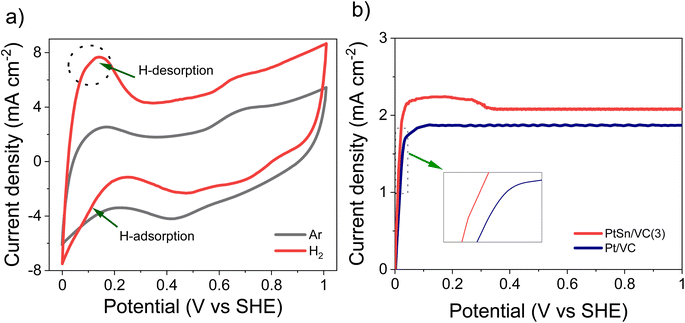
The CV of as-synthesized PtSn/VC(3) in 0.1 M aqueous HClO4 under saturated Ar and H2 at the scan rate of 50 mV s−1 is shown Fig. 5a. Under saturated Ar, the adsorption and desorption of underpotential deposited H (HUPD) were not clearly visible and the oxidative and reductive peaks extended over a wide potential range of 0.6–1.0 V and 0.4–0.8 V vs. SHE, respectively.54 This is in line with the results reported in the literature where broad peaks were observed, and platinum oxide formation and reduction were not distinct mainly due to the presence of Sn.55–57Under saturated H2, the HUPD was very pronounced in the range 0.05–0.3 V and the CV profile displayed much larger currents due to the occurring HOR. This increase in current density for PtSn/VC(3) in comparison to Pt/VC clearly indicates that PtSn/VC(3) is a good HOR catalyst (Fig. 5 and S4a†). The enhanced HOR performance of PtSn/VC(3) can be explained by considering the theoretical reports predicting that alloying Sn with Pt would result in a decrease in the adsorption energy of H2 at the Pt–Sn surface by ∼0.12 eV in comparison to Pt. Alloying is also assumed to provide more active sites for H2 adsorption owing to the “uneven surface” formed upon alloying Pt with Sn because of Sn larger atomic size (158 pm) as compared to Pt (138 pm).27 This better HOR performance of the PtSn/VC(3) was further confirmed by LSV (Fig. 5b), where hydrogen oxidation at PtSn/VC(3) started at a marginally lower potential (∼13 mV vs. SHE) than on Pt/VC. The broader LSV peak in the case of PtSn/VC(3) could be due to accumulation of hydrogen at the working electrode,58 in agreement with previous observations.59,60
Electrocatalytic activity of platinum–tin alloys for the ORR
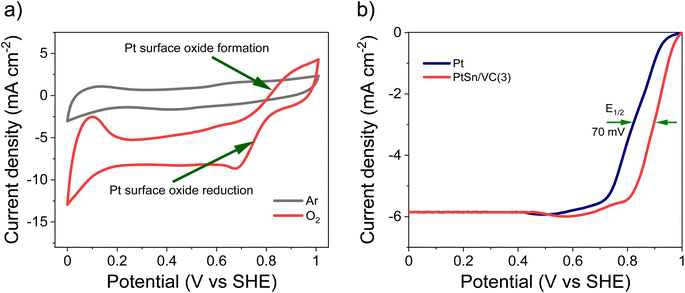
As-synthesized PtSn/VC(3) was also examined for ORR under saturated O2. In this case, more pronounced HUPD and the formation and reduction of oxides at the Pt3Sn surface was observed (Fig. 6a, S4b†). Better performance of Pt3Sn as compared to Pt was further evidenced by LSV measurement under saturated O2, with a shift in half wave potential (E1/2) of +70 mV as compared to Pt/VC (Fig. 6b).It has been predicted by theoretical calculations that when Sn is alloyed with Pt, the ‘O˙’ hydrogenation reaction (O˙ + H˙ → OH˙) would occur with a lower activation barrier of 0.66 eV for Pt3Sn as compared to the 0.77 eV for Pt.61 This would facilitate the formation of H2O during ORR.
Influence of Sn/Pt ratios
The result obtained above shows that alloying Sn with Pt leads to some substantial enhancements in terms of both ORR and HOR. The optimum amount of Sn was thus investigated by varying the Sn/Pt ratios in the alloy to 1.5 and 1. The XRD of as-synthesized Pt/VC, PtSn/VC(1.5) and PtSn/VC(1) which correspond to a lower and higher (Sn/Pt) ratio compared to PtSn/VC(3) are shown in Fig. S5–S7.† For PtSn/VC(1.5), the observed diffraction peaks were assigned to PtSn and for PtSn/VC(1) to Pt2Sn3. By increasing the amount of Sn, the phase changes from cubic Pt3Sn to hexagonal PtSn and finally hexagonal Pt2Sn3. This phase evolution is in line with the phase diagram of Pt–Sn (Fig. S2†),62 and was attributed to changes in concentrations of Sn relative to Pt and their differences in their reduction rates (standard redox potential of [PtCl6]2−/Pt = +0.74 V, Sn2+/Sn = −0.14 V, and ethylene glycol is 2.24 V).63–67 The final phases of the alloy may also be influenced by the galvanic reaction between Pt and the other metal ion, i.e. Sn2+.66,68The influence of Sn/Pt ratios on the morphology of the Pt–Sn particles was further investigated by TEM (Fig. S8–S9†). In all the materials, the Pt–Sn particles were well dispersed on VC and the particle size increased from 1.5 ± 0.3 to 3.5 ± 0.5 nm with higher amounts of Sn (Fig. S9†). This can be explained by the faster reduction of Pt in comparison to the Sn precursor, and the associated nucleation and growth mode. Indeed, increasing amounts of SnCl2 would result in a prolonged generation of Sn nuclei and eventually leads to further particle growth.69Table 1 summarizes the composition of the catalysts and their average particle size.
| Catalyst | wt% of metals | at% of metals | Average particle size (nm) | ||
|---|---|---|---|---|---|
| Pt | Sn | Pt | Sn | ||
| Pt/VC | 19.6 | 0 | 100 | 0 | 1.5 ± 0.3 |
| PtSn/VC(3) | 19.4 | 6.8 | 83 | 17 | 2 ± 0.3 |
| PtSn/VC(1.5) | 19.8 | 13.9 | 62 | 38 | 2.5 ± 0.5 |
| PtSn/VC(1) | 19.6 | 19.8 | 52 | 48 | 3.5 ± 0.5 |
Influence of Sn/Pt ratios on electrocatalytic activities
Fig. 7a and S11† summarizes the electrocatalytic activity for the HOR of the as-synthesized catalysts at various Pt to Sn ratios. HOR increased by increasing Sn amounts and a maximum electroactivity of 2.52 mA cm−2 was observed at a Pt/Sn ratio of 1.5 (Fig. 7a). However, in the case of ORR (Fig. 7b and S12†), the electroactivity was found to be prominent (4.56 mA cm−2 at 0.85 V vs. SHE) at a Pt/Sn ratio of 3. The exact reason for this is unknown; however, it can be assumed that higher amounts of Sn at the particle surface could block access to the Pt active sites.23 Indeed, the electrochemical surface area (ECSA) decreased from 72 m2 g−1 to 50 m2 g−1 upon decreasing Pt/Sn ratio from 1.5 to 1.0 (Fig. S13†). This suggests that a lower Pt surface is exposed per mass of Pt upon increasing amounts of Sn. It is noteworthy that hydrogen adsorption was reported to be significantly suppressed on Pt alloys due to an alternation of electronic properties at the Pt surface upon alloying. As a consequence, an underestimation of ECSA of nearly 50% is commonly reported.6,70 A ECSA of ∼80 m2 g−1 was observed with Pt/VC.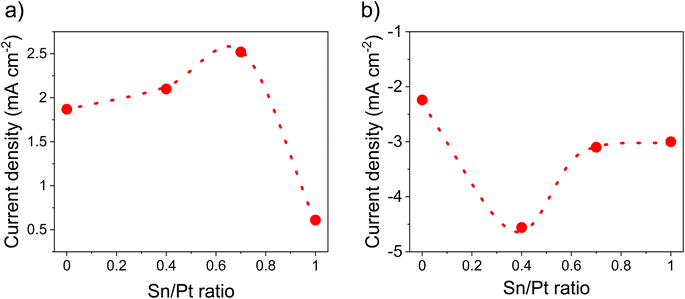 | ||
| Fig. 7 Activity comparison at various Sn/Pt ratios, (a) HOR activity @ 0.2 V vs. SHE, (b) ORR activity @ 0.85 V vs. SHE. These values were determined from LSV (Fig. S10 and 11†) in 0.1 M HClO4 under saturated (a) H2 and (b) O2, at a scan rate of 10 mV s−1 @1600 rpm. The catalyst loading was 50 μg cm−2. | ||
PtSn/VC(3) also showed better performance in terms of mass activity (373 mA mgPt−1) for ORR, which is higher than Pt/VC (153 mA mgPt−1) (Fig. S14†). The number of electrons involved during ORR was found to be 3.92 for PtSn/VC(3) and this indicates that the ORR could occur along the four-electron path (Fig. S15 and 16†). The ORR can follow a four-electron path that leads to the formation of H2O (reaction 1) or a two-electron path leading to the formation of H2O2 (reaction 2). H2O2 has a detrimental effect on the proton conducting membrane, because it leads to its oxidation and thus premature degradation. Upon the two-electron path, the fuel cell potential also decreases to 0.68 V, which is almost half of the potential (1.23 V) of the four-electron path.4,71
| O2 + 4H+ + 4e− → 2H2O (E° = 1.23 V) | (1) |
| O2 + 2H+ + 2e− → H2O2 (E° = 0.68 V) | (2) |
Evaluation of the performance of platinum–tin alloys in a self-breathing PEMFC
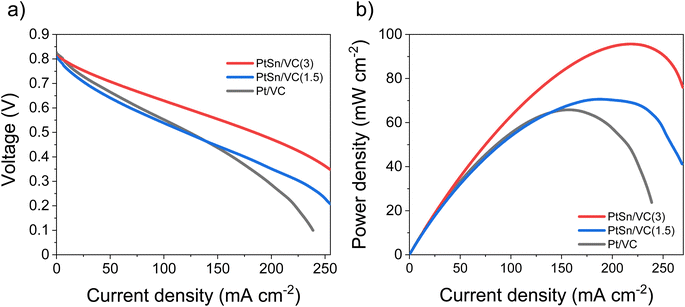
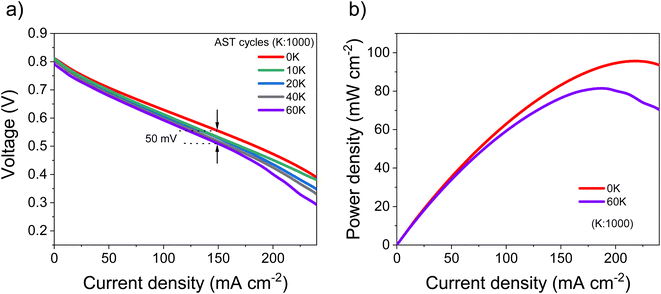
Based on the electrocatalytic activity results from the RDE analysis, both PtSn/VC(3) and PtSn/VC(1.5) showed good electroactivity for HOR and ORR when compared to pure Pt/VC, respectively. Accordingly, both catalysts were evaluated as anode and cathode catalysts in a self-breathing PEMFC operated at an ambient condition (25 °C, 1 bar and 20% RH at the anode). As shown in Fig. 8, PtSn/VC(3) was loaded at both sides of the MEA and delivered superior fuel cell performance compared to PtSn/VC(1.5) and Pt/VC, with a maximum power density of 96 mW cm−2 for PtSn/VC(3). For PtSn/VC(1.5) and Pt/VC, a maximum power density of 70.6 and 66.0 mW cm−2 were observed, respectively. These observations are in agreement with the RDE analyses, where both HOR and ORR activities of PtSn/VC(3) and PtSn/VC(1.5) were superior to that of Pt/VC. Better performance of PtSn/VC over Pt/VC could also be attributed to a lower impedance of MEA with PtSn/VC(3) in comparison to Pt/VC as shown Fig. S17.†The best performing PtSn/VC(3) was further analyzed for stability by conducting an accelerated stress test (AST) within the self-breathing PEMFC. The resulting polarization curves up to 60![[thin space (1/6-em)]](https://www.rsc.org/images/entities/char_2009.gif) 000 cycles are shown Fig. 9a. The performance loss after 60
000 cycles are shown Fig. 9a. The performance loss after 60![[thin space (1/6-em)]](https://www.rsc.org/images/entities/char_2009.gif) 000 cycles was only 9% (at 150 mA cm−2), while one-third of the loss occurred during the first 10
000 cycles was only 9% (at 150 mA cm−2), while one-third of the loss occurred during the first 10![[thin space (1/6-em)]](https://www.rsc.org/images/entities/char_2009.gif) 000 cycles. 85% of the maximum power density was retained after 60
000 cycles. 85% of the maximum power density was retained after 60![[thin space (1/6-em)]](https://www.rsc.org/images/entities/char_2009.gif) 000 cycles (Fig. 9b).
000 cycles (Fig. 9b).
The decrease in the performance (4.3%) in the low current density region (<50 mA cm−2) was expected owing to the normally occurring initial ‘loss’ in catalytic active sites.34 However, at high current (>100 mA cm−2) mass transfer losses (mainly O2 and H2O) have been reported to limit performance.34 Accordingly, the performance degradation of 9% (at 150 mA cm−2) observed at higher current density is assumed to be due to an initial ‘loss’ in catalytic active sites in addition to some mass transport limitations.34
A stable performance under AST proves the capability of these PtSn/VC(3) catalysts to be operated under abrupt load conditions. The maximum power density after 60![[thin space (1/6-em)]](https://www.rsc.org/images/entities/char_2009.gif) 000 cycles decreased by 15% in comparison to the first cycle. In a recent work, a performance degradation of 15% after 30
000 cycles decreased by 15% in comparison to the first cycle. In a recent work, a performance degradation of 15% after 30![[thin space (1/6-em)]](https://www.rsc.org/images/entities/char_2009.gif) 000 cycles was reported with the PtCu/VC catalyst.72 This work cannot be directly compared with other ASTs done at 80 °C, 100% RH and N2 at the cathode due to the unique nature of self-breathing operation, however, ASTs on conventional PEMFCs operated with H2, air at 80 °C and 80% RH with a Pt Ketjenblack catalyst showed a degradation of 6% after 10
000 cycles was reported with the PtCu/VC catalyst.72 This work cannot be directly compared with other ASTs done at 80 °C, 100% RH and N2 at the cathode due to the unique nature of self-breathing operation, however, ASTs on conventional PEMFCs operated with H2, air at 80 °C and 80% RH with a Pt Ketjenblack catalyst showed a degradation of 6% after 10![[thin space (1/6-em)]](https://www.rsc.org/images/entities/char_2009.gif) 000 cycles at 100 mA cm−2.35 A higher performance degradation of 12% (at 100 mA cm−2 after 10
000 cycles at 100 mA cm−2.35 A higher performance degradation of 12% (at 100 mA cm−2 after 10![[thin space (1/6-em)]](https://www.rsc.org/images/entities/char_2009.gif) 000 cycles 35and 20% (at 220 mA cm−2 was also reported after 1000 cycles for Pt/C in conventional PEMFCs.73 The results reported here are thus superior to earlier reports in the literature.35,73 A performance degradation of 50 mV for PtSn/VC(3) after 60
000 cycles 35and 20% (at 220 mA cm−2 was also reported after 1000 cycles for Pt/C in conventional PEMFCs.73 The results reported here are thus superior to earlier reports in the literature.35,73 A performance degradation of 50 mV for PtSn/VC(3) after 60![[thin space (1/6-em)]](https://www.rsc.org/images/entities/char_2009.gif) 000 cycles is remarkable as a maximum degradation of 30 mV is the target set by the US Department of Energy after 30
000 cycles is remarkable as a maximum degradation of 30 mV is the target set by the US Department of Energy after 30![[thin space (1/6-em)]](https://www.rsc.org/images/entities/char_2009.gif) 000 cycles.32
000 cycles.32
It is thus apparent that alloying Pt with Sn leads to superior electrocatalytic activity for the electrooxidation of molecular hydrogen and the electroreduction of molecular oxygen at the anode and cathode of the fuel cell, respectively. The electrocatalytic activity and mass activity improved by 2 and 2.5-fold, respectively, against Pt. This improved performance over Pt/VC is assumed to be due to a change in binding energy of intermediate species such as HO˙, HOO˙ and O˙ on the PtSn/VC(3) surface. Alloying is also assumed to lead to an increase in the d-vacancy of Pt and, as such, an enhanced catalytic activity.
Successful application of these catalysts at both the anode and cathode of the self-breathing PEMFC demonstrates their appropriateness at the MEA of a PEMFC. There are very few instances in the literature where Pt-alloys were successfully used at the anode and the cathode of PEMFCs, among which a MEA developed with a Pt7Cu demonstrated a power density of 45.16 mW cm−2. This corresponds to 1.4-fold output power increment over Pt operated under similar conditions.4 Future work would aim at understanding the degradation mechanism under fuel cell operation.
Conclusions
This work reports on the synthesis of PtSn/VC alloy catalysts suitable for the electrooxidation of molecular hydrogen and the electroreduction of molecular oxygen for PEMFCs. The PtSn/VC(3) reported here exceeds the electrocatalytic activity of Pt/VC by delivering 1.3- and 2-fold improvements in HOR and ORR activities, respectively. The enhanced performance with PtSn/VC(3) was mainly attributed to the facilitation of the four-electron path, which leads to the formation of H2O instead of the promotion of H2O2. Under self-breathing PEMFC operation at ambient condition, a maximum power density of 96 mW cm−2 (at 225 mA cm−2) was observed. This is 1.5 times more power than Pt/VC operated under the same conditions. The MEA developed from the PtSn/VC(3) catalyst was operated for 60![[thin space (1/6-em)]](https://www.rsc.org/images/entities/char_2009.gif) 000 cycles under the self-breathing operation of a fuel cell. The catalyst showed outstanding performance stability with only 9% reduction in performance between the first and the 60
000 cycles under the self-breathing operation of a fuel cell. The catalyst showed outstanding performance stability with only 9% reduction in performance between the first and the 60![[thin space (1/6-em)]](https://www.rsc.org/images/entities/char_2009.gif) 000 cycle. With a simple and scalable approach to synthesis, superior mass activity and proven exceptional performance under self-breathing PEMFC operation, the PtSn/VC(3) alloy reported here can be regarded as a potential candidate to replace existing Pt/carbon catalysts at anode and cathode of fuel cells.
000 cycle. With a simple and scalable approach to synthesis, superior mass activity and proven exceptional performance under self-breathing PEMFC operation, the PtSn/VC(3) alloy reported here can be regarded as a potential candidate to replace existing Pt/carbon catalysts at anode and cathode of fuel cells.
Conflicts of interest
The authors declare no conflict of interest.References
- P. Sapkota and H. Kim, J. Ind. Eng. Chem., 2009, 15, 445–450 CrossRef CAS.
- P. Sapkota, C. Boyer, R. Dutta, C. Cazorla and K.-F. Aguey-Zinsou, Sustainable Energy Fuels, 2020, 4, 439–468 RSC.
- E. C. Tse and A. A. Gewirth, J. Phys. Chem. A, 2015, 119, 1246–1255 CrossRef CAS PubMed.
- P. Sapkota, C. Boyer, S. Lim and K.-F. Aguey-Zinsou, Res. Chem. Intermed., 2022, 48, 3019–3037 CrossRef CAS.
- E. Higuchi, K. Adachi, S. Nohara and H. Inoue, Res. Chem. Intermed., 2009, 35, 985–995 CrossRef CAS.
- M. Shao, Q. Chang, J. P. Dodelet and R. Chenitz, Chem. Rev., 2016, 116, 3594–3657 CrossRef CAS PubMed.
- Z. P. Wu, D. T. Caracciolo, Y. Maswadeh, J. Wen, Z. Kong, S. Shan, J. A. Vargas, S. Yan, E. Hopkins, K. Park, A. Sharma, Y. Ren, V. Petkov, L. Wang and C. J. Zhong, Nat. Commun., 2021, 12, 859 CrossRef CAS PubMed.
- C. Chen, Y. Kang, Z. Huo, Z. Zhu, W. Huang, H. L. Xin, J. D. Snyder, D. Li, J. A. Herron, M. Mavrikakis, M. Chi, K. L. More, Y. Li, N. M. Markovic, G. A. Somorjai, P. Yang and V. R. Stamenkovic, Science, 2014, 343, 1339–1343 CrossRef CAS PubMed.
- G. Ren, S. Chen, J. Zhang, N. Zhang, C. Jiao, H. Qiu, C. Liu and H.-L. Wang, J. Mater. Chem. A, 2021, 9, 5751–5758 RSC.
- T. Marshall-Roth, N. J. Libretto, A. T. Wrobel, K. J. Anderton, M. L. Pegis, N. D. Ricke, T. V. Voorhis, J. T. Miller and Y. Surendranath, Nat. Commun., 2020, 11, 5283 CrossRef CAS PubMed.
- R. Sirirak, B. Jarulertwathana, V. Laokawee, W. Susingrat and T. Sarakonsri, Res. Chem. Intermed., 2016, 43, 2905–2919 CrossRef.
- A. Mehmood, B. Ali, M. Gong, M. Gyu Kim, J. Y. Kim, J. H. Bae, A. Kucernak, Y. M. Kang and K. W. Nam, J. Colloid Interface Sci., 2021, 596, 148–157 CrossRef CAS PubMed.
- D. Banham and S. Y. Ye, ACS Energy Lett., 2017, 2, 629–638 CrossRef CAS.
- J. Durst, M. Lopez-Haro, L. Dubau, M. Chatenet, Y. Soldo-Olivier, L. Guetaz, P. Bayle-Guillemaud and F. Maillard, J. Phys. Chem. Lett., 2014, 5, 434–439 CrossRef CAS PubMed.
- M. Shao, J. H. Odell, A. Peles and D. Su, Chem. Commun., 2014, 50, 2173–2176 RSC.
- Z. Q. Li, X. T. Deng, H. K. Zhou, W. Xuan, Z. Y. Xie and F. Liu, J. Solid State Electrochem., 2020, 24, 195–206 CrossRef CAS.
- H. Wang, S. Yin, Y. Xu, X. Li, A. A. Alshehri, Y. Yamauchi, H. Xue, Y. V. Kaneti and L. Wang, J. Mater. Chem. A, 2018, 6, 8662–8668 RSC.
- F. Tzorbatzoglou, A. Brouzgou, S. Jing, Y. Wang, S. Song and P. Tsiakaras, Int. J. Hydrogen Energy, 2018, 43, 11766–11777 CrossRef CAS.
- Z. Pu, R. Cheng, J. Zhao, Z. Hu, C. Li, W. Li, P. Wang, I. S. Amiinu, Z. Wang, W. Min, D. Chen and S. Mu, iScience, 2020, 23, 101793 CrossRef CAS PubMed.
- D. Banham, J. Zou, S. Mukerjee, Z. Liu, D. Yang, Y. Zhang, Y. Peng and A. Dong, J. Power Sources, 2021, 490 Search PubMed.
- F. Fievet, S. Ammar-Merah, R. Brayner, F. Chau, M. Giraud, F. Mammeri, J. Peron, J. Y. Piquemal, L. Sicard and G. Viau, Chem. Soc. Rev., 2018, 47, 5187–5233 RSC.
- Y. Wang, Y. Mi, N. Redmon and J. Holiday, J. Phys. Chem. C. Nanomater. Interfaces, 2010, 114, 317–326 CrossRef CAS PubMed.
- I. Borbáth, I. Bakos, Z. Pászti, G. P. Szijjártó and A. Tompos, Catal. Today, 2021, 366, 20–30 CrossRef.
- Y. Uemura, Y. Inada, K. K. Bando, T. Sasaki, N. Kamiuchi, K. Eguchi, A. Yagishita, M. Nomura, M. Tada and Y. Iwasawa, Phys. Chem. Chem. Phys., 2011, 13, 15833–15844 RSC.
- H. Gharibi, S. Sadeghi and F. Golmohammadi, Electrochim. Acta, 2016, 190, 1100–1112 CrossRef CAS.
- M. Amani, M. Kazemeini, M. Hamedanian, H. Pahlavanzadeh and H. Gharibi, Mater. Res. Bull., 2015, 68, 166–178 CrossRef CAS.
- J. Fearon and G. W. Watson, J. Mater. Chem., 2006, 16, 1989–1996 RSC.
- N. Furuya and S. Motoo, J. Electroanal. Chem. Interfacial Electrochem., 1979, 98, 195–202 CrossRef.
- S.-Y. Yan, C.-W. Liu, T.-H. Huang, Y.-Z. Guo, S.-W. Lee, J.-H. Wang and K.-W. Wang, Int. J. Hydrogen Energy, 2018, 43, 14427–14438 CrossRef CAS.
- S. Ott, A. Orfanidi, H. Schmies, B. Anke, H. N. Nong, J. Hubner, U. Gernert, M. Gliech, M. Lerch and P. Strasser, Nat. Mater., 2020, 19, 77–85 CrossRef CAS PubMed.
- P. Sapkota, P. Brockbank and K.-F. Aguey-Zinsou, Int. J. Hydrogen Energy, 2022, 47, 23833–23844 CrossRef CAS.
- DOE, Multi-year Research, Development and Demonstration Plan: 3.4 Fuel Cells, Fuel Cell Technol. Off., 2017, 3, 1–58 Search PubMed.
- L. Osmieri, D. A. Cullen, H. T. Chung, R. K. Ahluwalia and K. C. Neyerlin, Nano Energy, 2020, 78, 105209 CrossRef CAS.
- E. Padgett, V. Yarlagadda, M. E. Holtz, M. Ko, B. D. A. Levin, R. S. Kukreja, J. M. Ziegelbauer, R. N. Andrews, J. Ilavsky, A. Kongkanand and D. A. Muller, J. Electrochem. Soc., 2019, 166, F198–F207 CrossRef CAS.
- A. Kobayashi, T. Fujii, C. Harada, E. Yasumoto, K. Takeda, K. Kakinuma and M. Uchida, ACS Appl. Energy Mater., 2021, 4, 2307–2317 CrossRef CAS.
- I. Bloom, L. K. Walker, J. K. Basco, T. Malkow, A. Saturnio, G. De Marco and G. Tsotridis, J. Power Sources, 2013, 243, 451–457 CrossRef CAS.
- Y. Holade, N. Sahin, K. Servat, T. Napporn and K. Kokoh, Catalysts, 2015, 5, 310–348 CrossRef CAS.
- L. Dennany, P. Sherrell, J. Chen, P. C. Innis, G. G. Wallace and A. I. Minett, Phys. Chem. Chem. Phys., 2010, 12, 4135–4141 RSC.
- Z. Wang, L. Wang, W. Zhu, T. Zeng, W. Wu, Z. Lei, Y. Tan, H. Lv and N. Cheng, Nanoscale Adv., 2021, 3, 5062–5067 RSC.
- V. A. Lubarda, Mech. Mater., 2003, 35, 53–68 CrossRef.
- T. Ma, S. Wang, M. Chen, R. V. Maligal-Ganesh, L.-L. Wang, D. D. Johnson, M. J. Kramer, W. Huang and L. Zhou, Chem, 2019, 5, 1235–1247 CAS.
- C.-T. Shen, K.-W. Wang, C.-J. Tseng, K.-R. Lee and Y.-J. Hsueh, RSC Adv., 2016, 6, 44205–44211 RSC.
- S. Stevanović, D. Tripković, V. Tripković, D. Minić, A. Gavrilović, A. Tripković and V. M. Jovanović, J. Phys. Chem. C, 2013, 118, 278–289 CrossRef.
- R. Kumar, S. R. Bakshi, J. Joardar, S. Parida, V. S. Raja and R. K. Singh Raman, Materials, 2017, 10 CrossRef PubMed.
- E. Antolini, Int. J. Hydrogen Energy, 2011, 36, 11043–11047 CrossRef CAS.
- M. M. Magalhães, J. F. Gomes, G. Tremiliosi-Filho, P. B. S. de Figueiredo, R. B. de Lima and F. Colmati, J. Appl. Electrochem., 2020, 51, 173–181 CrossRef.
- D. W. Boukhvalov, A. Marchionni, J. Filippi, C.-N. Kuo, J. Fujii, R. Edla, S. Nappini, G. D'Olimpio, L. Ottaviano, C. S. Lue, P. Torelli, F. Vizza and A. Politano, J. Mater. Chem. A, 2020, 8, 2349–2355 RSC.
- D. J. Miller, H. Oberg, S. Kaya, H. Sanchez Casalongue, D. Friebel, T. Anniyev, H. Ogasawara, H. Bluhm, L. G. Pettersson and A. Nilsson, Phys. Rev. Lett., 2011, 107, 195502 CrossRef CAS PubMed.
- I. Farid, J. Chutia and H. Bailung, J. Chem. Sci., 2022, 134 Search PubMed.
- H. M. Duan, Q. Hao and C. X. Xu, J. Power Sources, 2015, 280, 483–490 CrossRef CAS.
- M. Batzill, J. Kim, D. E. Beck and B. E. Koel, Phys. Rev. B: Condens. Matter Mater. Phys., 2004, 69, 165403 CrossRef.
- I. Borbáth, D. Gubán, Z. Pászti, I. E. Sajó, E. Drotár, J. L. G. de la Fuente, T. Herranz, S. Rojas and A. Tompos, Top. Catal., 2013, 56, 1033–1046 CrossRef.
- H. Zhu, J. Chen, X. Li, Y. Liu, L. Gao and J. Chen, Mater. Res. Express, 2019, 6, 115048 CrossRef CAS.
- J. N. Schwammlein, P. A. L. Torres, H. A. Gasteiger and H. A. El-Sayed, Sci. Rep., 2020, 10, 59 CrossRef PubMed.
- T. S. Almeida, A. R. Van Wassen, R. B. VanDover, A. R. de Andrade and H. D. Abruña, J. Power Sources, 2015, 284, 623–630 CrossRef CAS.
- X. H. Xia, Electrochim. Acta, 1999, 45, 1057–1066 CrossRef CAS.
- M. C. Santos and L. O. S. Bulhões, Electrochim. Acta, 2003, 48, 2607–2614 CrossRef CAS.
- S. Prass, J. St-Pierre, M. Klingele, K. A. Friedrich and N. Zamel, Electrocatalysis, 2020, 12, 45–55 CrossRef.
- S. Ke, L. Qiu, W. Zhao, C. Sun, B. Cui, G. Xu and M. Dou, ACS Appl. Mater. Interfaces, 2022, 14, 7768–7778 CrossRef CAS PubMed.
- M. K. Kundu, R. Mishra, T. Bhowmik and S. Barman, J. Mater. Chem. A, 2018, 6, 23531–23541 RSC.
- X. Wang, X. Li, S. Liao and B. Li, Comput. Mater. Sci., 2018, 149, 107–114 CrossRef CAS.
- H. Okamoto, J. Phase Equilib., 2003, 24, 276 CrossRef.
- Y. Kang, B. Jiang, Z. A. Alothman, A. Y. Badjah, M. Naushad, M. Habila, S. Wabaidur, J. Henzie, H. Li and Y. Yamauchi, Chemistry, 2019, 25, 343–348 CrossRef CAS PubMed.
- Y. Li, Y. Jiang, M. Chen, H. Liao, R. Huang, Z. Zhou, N. Tian, S. Chen and S. Sun, Chem. Commun., 2012, 48, 9531–9533 RSC.
- F. Bonet, C. Guéry, D. Guyomard, R. Herrera Urbina, K. Tekaia-Elhsissen and J. M. Tarascon, Int. J. Inorg. Mater., 1999, 1, 47–51 CrossRef CAS.
- Y. Chen, Z. Lai, X. Zhang, Z. Fan, Q. He, C. Tan and H. Zhang, Nat. Rev. Chem., 2020, 4, 243–256 CrossRef CAS.
- D. Y. DeSario and F. J. DiSalvo, Chem. Mater., 2014, 26, 2750–2757 CrossRef CAS.
- J. Grand, S. R. Ferreira, V. de Waele, S. Mintova and T. M. Nenoff, J. Phys. Chem. C, 2018, 122, 12573–12588 CrossRef CAS.
- C. Tojo and N. Vila-Romeu, Materials, 2014, 7, 7513–7532 CrossRef PubMed.
- S. Moniri, T. Van Cleve and S. Linic, J. Catal., 2017, 345, 1–10 CrossRef CAS.
- S. Taylor, E. Fabbri, P. Levecque, T. J. Schmidt and O. Conrad, Electrocatalysis, 2016, 7, 287–296 CrossRef CAS.
- Z. Xiao, H. Wu, H. Zhong, A. Abdelhafiz and J. Zeng, Nanoscale, 2021, 13, 13896–13904 RSC.
- Q. Xue, J. B. Huang, D. J. Yang, B. Li and C. M. Zhang, RSC Adv., 2021, 11, 19417–19425 RSC.
Footnote |
| † Electronic supplementary information (ESI) available. See DOI: https://doi.org/10.1039/d2su00129b |
| This journal is © The Royal Society of Chemistry 2023 |

