 Open Access Article
Creative Commons Attribution 3.0 Unported Licence
Rapid screening of wood and leaf tissues: investigating silicon-based phytoliths in Populus trichocarpa for carbon storage applications using laser-induced breakdown spectroscopy and scanning electron microscopy–energy dispersive X-ray spectroscopy
Hunter B.
Andrews
 *a,
Ann M.
Wymore
b,
E. E.
Wetter
 cd,
Elizabeth M.
Herndon
 c,
Hui
Li
ce,
Samir A.
Martin
f,
Natalie A.
Griffiths
c,
Xiaohan
Yang
b,
Wellington
Muchero
b,
David J.
Weston
b and
Madhavi Z.
Martin
b
c,
Hui
Li
ce,
Samir A.
Martin
f,
Natalie A.
Griffiths
c,
Xiaohan
Yang
b,
Wellington
Muchero
b,
David J.
Weston
b and
Madhavi Z.
Martin
b
aRadioisotope Science and Technology Division, Oak Ridge National Laboratory, 1 Bethel Valley Rd., Oak Ridge, TN 37831, USA. E-mail: andrewshb@ornl.gov
bBiosciences Division, Oak Ridge National Laboratory, Oak Ridge, TN 37831, USA
cEnvironmental Sciences Division, Oak Ridge National Laboratory, Oak Ridge, TN 37831, USA
dUniversity of Delaware, Newark, DE 19716, USA
eNorth Carolina State University, Raleigh, NC 27695, USA
fUniversity of Tennessee, Knoxville, TN 37996, USA
First published on 4th October 2023
Abstract
Phytoliths, which are noncrystalline particles of amorphous silica that form inside plant cells, contribute to the global carbon cycle through their ability to occlude organic carbon. The organic carbon within phytoliths is less susceptible to decomposition; thus, a better understanding of the relationship between phytolith formation and silicon levels in plant tissues may enable bioengineered species to maximize carbon capture during litter decomposition. To establish a high-throughput capability for the phenotypic characterization of phytolith formation in plants, this study used laser-induced breakdown spectroscopy (LIBS) and scanning electron microscope–energy dispersive X-ray spectroscopy (SEM–EDS) to investigate the relationship between silicon concentration, silicon distribution, and phytolith formation in Populus trichocarpa. The results demonstrated the ability to use LIBS with a standard addition approach to calibration to quantify silicon concentrations in pelletized wood and leaf plant tissues with limits of detection of 28.9 and 150 ppm, respectively. This technique enabled rapid testing to rank samples based on silicon levels to be used in genome-wide association studies or to screen samples prior to SEM–EDS testing. SEM–EDS mapping of leaves revealed that phytolith formation occurred primarily at moderate silicon concentrations, estimated as surface silicon concentrations between 0.5–6 wt%. In contrast, phytoliths were not observed at very low concentrations (<0.5 wt%) or at high concentrations (>6 wt%) where silicon was instead dispersed across the leaf. Additionally, phytolith size distributions could be quantified using image analyses of silicon maps derived from SEM–EDS. Neither LIBS nor SEM–EDS results indicated a significant relationship between the silicon levels in the leaves and high- and low-silicon expressing genotypes. However, silicon concentrations were strongly associated with the geographical origin of the sample, indicating that seasonality (i.e., plant phenology) or environmental factors, such as the silicon availability in soil, may play an important role in phytolith formation.
Introduction
Continued CO2 emissions in the twenty-first century are predicted to lead to adverse climate changes on both short- and long-time scales that would be essentially irreversible.1 Other possible climate change effects include Arctic sea ice retreating, increases in heavy rainfall and flooding, permafrost thaw, loss of glaciers and snowpack with associated changes in water supply, increased intensity of hurricanes, and more. In connection with this issue is an effort to engineer biologically based solutions for carbon capture and storage.2 One potential carbon sequestration strategy could involve enhancing the formation of phytoliths in plant tissues.3–5 Phytoliths are noncrystalline particles of silica that form inside cells and cell walls of different plant organs and tissues. Organic carbon in living cells can be occluded in phytoliths during plant growth. These small amounts of carbon are known as phytolith-occluded carbon (PhytOC).6 It is generally assumed that the source of this PhytOC is atmospheric CO2 that was fixed by the plant via photosynthesis. Thus, PhytOC has been documented as an important, long-term terrestrial carbon reservoir that plays a major role in the global carbon cycle.7,8 Furthermore, silicon, which is the predominant element in phytoliths, is widely recognized as a beneficial element that enhances plant tolerance to various abiotic (e.g., drought stress, salinity) and biotic stresses (e.g., pathogen, insects).9–11 In contrast, scientific publications also mention that the accumulation of silicon in plant tissues inhibits bioprocessing applications of bioenergy feedstocks.12,13 Thus, the manipulation of the silicon pathway will directly influence plant productivity and potentially extend to influencing bioprocessing or even ecosystem-level processes (e.g., carbon storage). Previous research has demonstrated that the capability of silicon accumulation varies with plant species and even genotypes within a species.11A number of spectroscopic and other elemental analytical methods have been used to detect silicon and organic carbon (e.g., PhytOC) in phytolith structures in a variety of plant species. The effect of various chemical digestion methods on the composition of phytoliths in bamboo has been examined using Raman, infrared, and X-ray photoelectron spectroscopies. Watling et al. isolated intact bilobate phytoliths suitable for interrogation by Raman microprobe analysis.14 They used a microwave wet ashing technique that involved H2O2 with HNO3 and HCl. There was evidence of cellulose, lignin, and carboxylic acids in the PhytOC. Corbineau et al. worked to develop two protocols for extracting phytoliths from plants with 100% phytolith purity for PhytOC analysis, with the first protocol involving a multistep process of dry ashing and acid digestion, and the second protocol using acid digestion and a separate alkali immersion step to remove surface layers.15 Purity was semi-quantitatively gauged using scanning electron microscope (SEM)–energy dispersive X-ray spectroscopy (EDS), which acted as a quality check for phytolith purity. The scarcity of in situ characterizations of PhytOC in phytoliths caused inconsistencies, which fed into the increasing debate surrounding PhytOC. Alexandre et al. used 3D X-ray microscopy to reconstruct the 3D structure of harvested grass short cell phytoliths at high spatial resolution.16 This technique had never before been applied in high resolution to silica particles. They also investigated the location of PhytOC within the plant tissues using nanoscale secondary ion mass spectrometry (NanoSIMS). They found that micrometric internal cavities exist within the silica structure and are sometimes observed isolated from the outside. The opening of the cavities may be an original feature or might result from silica dissolution starting during the chemical extraction procedure (which also mimics the progressive dissolution process that can happen in natural environments). Thus, the PhytOC that may originally occupy the cavities is susceptible to rapid oxidation. The NanoSIMS analysis did not detect this rapid oxidation. Another pool of PhytOC was observed continuously distributed in and protected by the silica structure. This pool probably had amino acids present based on its nitrogen/carbon ratio of 0.27. These findings represented a large step toward the goal of assessing the significance of PhytOC in the global carbon cycle; however, many of these detection methods can be time consuming and/or rely on state-of-the-art equipment.
Laser-induced breakdown spectroscopy (LIBS) is an elemental analysis technique that can be performed rapidly with minimal equipment, which has led to it being explored as a high-throughput screening tool in many fields. LIBS is performed by firing and focusing a pulsed laser to excite a sample surface. This laser pulse has sufficient power density at the sample surface to ablate the material and excite atoms and ions into a plasma plume. The optical emissions created as the excited species in the plasma return to their ground states are measured to form an elemental fingerprint of the sample. Using matrix-matched standards, these emissions can be quantifiable via a calibration model. The ability to examine materials with little-to-no sample preparation, along with a wide range of elemental sensitivity, particularly for light elements, drives the continued use of LIBS for environmental applications. Here, the main challenge of measuring PhytOC via LIBS directly revolved around difficulties in distinguishing C in the PhytOC from C in the plant matrix. Therefore, this study focused on measuring silicon levels via LIBS as an indicator of potential phytolith formation. Extensive work in the detection and quantification of total elemental concentrations from biological matrices such as plants (e.g., roots, stem, and leaves) for carbon storage and phytoremediation applications has been demonstrated previously.17–19 Additionally, trace elements have been mapped in biological matrices using LIBS at resolutions down to 10–30 μm.20 For instance, previous work has observed that certain metals will accumulate in the leaf blade portion of the leaf tissue, and others will collect in the midriff and veins of the leaf.20 In applications such as these, LIBS provides a potentially attractive alternative to standard methods of analyzing metal accumulation because sample mass requirements are greatly reduced, measurement times range from seconds to minutes, and sample preparation is minimal. Tripathi et al. demonstrated that silicon levels in wheat plants determined using LIBS corresponded to phytolith analysis performed through dry ashing.21 Recently, the authors of the present study identified genes encoding silicon transporters in poplar (Populus trichocarpa) and assessed expression patterns of silicon transporters across a poplar genome-wide association study (GWAS) population.22 Phenotypic characterization of silicon accumulation in poplar plants would facilitate future investigation of genetic mechanisms controlling phytolith formation in their tissues.
SEM–EDS is a micron- to mm-scale imaging and semi-quantitative element analysis technique used to visualize material structures and their chemical compositions. Scanning electron microscopes bombard samples with electrons that interact with the surface and either backscatter to the detector to yield compositional information or produce secondary electrons that form a detailed surface image.23 Although conventional SEMs operate under high vacuum and require samples to be coated with a conductive element, hydrated and non-conductive materials such as leaves can be examined with little to no sample preparation using environmental SEMs that operate under low vacuum.24 The interaction of the electron beam with the top ∼1 μm of material also generates characteristic X-rays that are used by the EDS detector to produce chemical maps. Light microscopy and SEM are typically performed on phytoliths that have been isolated from leaves and woody biomass by oxidizing and removing the organic matrix16,25,26 or from soils via gravimetric separation,27 enabling detailed morphological characterization. Here, we use SEM images and corresponding EDS maps of Si to quantify the abundance and size distribution of phytoliths within intact leaves, enabling insight into their foliar distribution.
The goal of the present study is to establish a procedure for investigating silicon content in poplar wood and leaf tissues using LIBS and SEM–EDS measurements. The study aimed to answer three main questions: (1) if a LIBS model can be calibrated for evaluating silicon in environmental plant samples to enable rapid screening; (2) if genetic variation exists on the concentration of silicon within leaves of P. trichocarpa; and (3) how the silicon and phytolith distributions differ based on a leaf's silicon concentration. The ability of the LIBS technique to benchmark silicon levels in samples at a high throughput made it an ideal screening tool, although traditional LIBS’ reliance on matrix-matched standards generated a unique challenge for environmental sample quantification. While a calibration free – LIBS approach,28,29 or the one-point calibration LIBS approach,29 could be used to circumvent the need for a matrix matched calibration, these techniques require a time-resolved spectrometer which was not available for this work. SEM–EDS provided high-spatial resolution mapping capabilities and the ability to do semiquantitative analysis to better understand surface-level silicon concentration and the structure of the phytoliths in the plant tissues.
Experimental
Sample background
Several sample types were evaluated during this study to investigate silicon levels in relation to phytolith formation in P. trichocarpa. These samples included woody pellets, leaf pellets, and whole leaves mapped via SEM–EDS. The woody (tree trunk) pellet samples were from a population of P. trichocarpa genotypes collected across the western coast of North America.30 Thousands of traits for this population have been measured over the last decade for GWAS. The silicon levels of these samples as measured by LIBS could help identify key characteristics in the GWAS modeling.The leaf pellets were made from samples used as part of a 132 day leaf decomposition study. Senesced leaves were collected from P. trichocarpa trees growing in control and drought plots in a common garden at the University of California, Davis. Within each plot, samples came from trees of different genotypes, and replicate samples were taken for each genotype (n = 3–6). Four genotypes were selected based on their rate of expression of genes involved in silicon uptake; two genotypes (BESC-152 and BESC-315) expressed these genes at a low rate, and the other two genotypes (CHWH-27-5 and GW-11053) expressed these genes at a high rate.22 Preweighed, air-dried leaves were placed into mesh bags and allowed to decompose on the floor of a temperate deciduous forest (Walker Branch Watershed, East Tennessee, USA). Leaf samples collected before and after decomposition were analyzed for silicon content via LIBS.
Lastly, green leaves were collected from P. trichocarpa trees growing in a common garden in Clatskanie, Oregon on July 15, 2021, and senesced leaves were collected from Davis, California plots on October 27, 2021. These leaves were evaluated using SEM–EDS to investigate the influence of genotype on phytolith formation. A summary of the LIBS leaf pellets and SEM–EDS whole leaf samples that were tested is provided in Tables 1 and 2, respectively.
| Location | Genotype | Treatment | Decomposition duration (days) | Replicates |
|---|---|---|---|---|
| California site | BESC-152 | Control | 0 | 3 |
| BESC-315 | Control | 0 | 3 | |
| CHWH-27-5 | Control | 0 | 2 | |
| GW-11053 | Control | 0 | 3 | |
| BESC-152 | Drought | 0 | 7 | |
| CHWH-27-5 | Drought | 0 | 4 | |
| GW-11053 | Drought | 0 | 3 | |
| BESC-152 | Control | 132 | 3 | |
| BESC-315 | Control | 132 | 3 | |
| CHWH-27-5 | Control | 132 | 3 | |
| GW-11053 | Control | 132 | 3 | |
| BESC-152 | Drought | 132 | 6 | |
| CHWH-27-5 | Drought | 132 | 4 | |
| GW-11053 | Drought | 132 | 3 |
| Location | Genotype | Individual tree ID | Date collected | EDS Si wt% (quantified at 30× magnification) | ||||
|---|---|---|---|---|---|---|---|---|
| Site 1 | Site 2 | Site 3 | Mean | Std. dev. | ||||
| Oregon site | BESC-152 | 1-34-19 | 7/15/2021 | 4.3 | 1.9 | 5.3 | 3.8 | 1.7 |
| BESC-315 | 3-87-4 | 7/15/2021 | 3.7 | 4.3 | 1.6 | 3.2 | 1.4 | |
| CHWH-27-5 | 3-94-28 | 7/15/2021 | 0.5 | 0.6 | 0.1 | 0.4 | 0.3 | |
| GW-11053 | 3-88-17 | 7/15/2021 | 1.3 | 1.0 | 1.1 | 1.1 | 0.2 | |
| California site (control plots) | BESC-152 | 1-17-13 | 10/27/2021 | 9.0 | 9.5 | 8.8 | 9.1 | 0.4 |
| 1-20-55 | 10/27/2021 | 8.7 | 8.5 | 8.5 | 8.6 | 0.1 | ||
| 2-20-55 | 10/27/2021 | 7.6 | 9.4 | 7.8 | 8.3 | 1.0 | ||
| BESC-315 | 1-13-27 | 10/27/2021 | 3.4 | 6.4 | 4.0 | 4.6 | 1.6 | |
| 2-25-37 | 10/27/2021 | 9.2 | 9.2 | 9.4 | 9.3 | 0.1 | ||
| CHWH-27-5 | 1-19-9 | 10/27/2021 | 3.3 | 4.4 | 4.0 | 3.9 | 0.6 | |
| 2-25-57 | 10/27/2021 | 8.6 | 8.5 | 9.2 | 8.8 | 0.4 | ||
| GW-11053 | 1-41-5 | 10/27/2021 | 11.3 | 11.5 | 11.2 | 11.3 | 0.2 | |
| 2-40-n.a. | 10/27/2021 | 6.3 | 7.9 | 4.3 | 6.2 | 1.8 | ||
Laser-induced breakdown spectroscopy sample preparation and measurements
Bark was first removed from the wood samples, after which they were cubed and dried overnight at 70 °C. They were then milled with a Thomas Wiley mill (Thomas Scientific) fitted with a 40-mesh adapter. The milled wood was sieved through a US Standard testing sieve No. 30 (600 μm mesh size) and then stored in airtight containers. A 300 mg portion of the milled sample was weighed out and hydrated overnight in a humidified chamber. The hydrated wood samples were loaded into a 13 mm pellet die (Carver) and pressed at 18![[thin space (1/6-em)]](https://www.rsc.org/images/entities/char_2009.gif) 000 psi for 2 min. The pellets were stored in dry polyvinyl chloride bottles until analyzed. The leaf samples from the decomposition experiment were oven-dried at 70 °C for 24 h, after which they were ground to a fine powder using a plant tissue homogenizer (Geno Grinder) and stored in clean glass vials. The ground leaf material was then pelletized following the procedure described previously in this paragraph.
000 psi for 2 min. The pellets were stored in dry polyvinyl chloride bottles until analyzed. The leaf samples from the decomposition experiment were oven-dried at 70 °C for 24 h, after which they were ground to a fine powder using a plant tissue homogenizer (Geno Grinder) and stored in clean glass vials. The ground leaf material was then pelletized following the procedure described previously in this paragraph.
Calibration standards were made by first diluting the 2% silicon standard (Agilent) in liquid chromatography–mass spectrometry grade water (Thermo Scientific Pierce water) to obtain a concentration range from 0 to 1000 ppm in 100 ppm increments. Several wood samples whose silicon levels were already determined to be below the LIBS detection limits were then mixed with the standard solutions to prepare biological replicates. Briefly, 500 μL of each standard dilution was added to 300 mg of a milled and sieved wood sample, vortexed for several minutes to mix thoroughly until each particle of wood was evenly coated, transferred to a hood to dry overnight, hydrated in a humidified chamber overnight, then processed into pellets as described previously. Calibration standards from pelletized leaf samples were prepared in the same fashion as the woody pellets. For each calibration, wood and leaf pellets, calibration samples were prepared with an increasing amount of Si until the intensity range for the respective sample population was covered by the calibration. This resulted in 11 calibration samples for the wood pellets and only 5 for the leaf pellets.
The LIBS measurements in this study were performed using a LIBS-8 module from Applied Photonics. This system uses a 1064 nm Nd:YAG laser (Litron) that can be fired at up to 10 Hz and with a laser energy of up to 150 mJ. In this system, the laser passes through a beam expansion module and is then focused onto the sample surface through a fixed lens such that the focal point of the laser is slightly below the sample surface, resulting in a more repetitive plasma with lower atmospheric effects. The plasma light was collected through eight collection optics, which then transmitted the light to an eight-channel spectrometer. The spectrometer was set to collect the spectra ranging from 190 to 1000 nm, the gate delay was optimized between 1–3 μs, and the exposure time was optimized between 10–50 μs. The pelletized samples were tested in a 3 × 3 grid pattern with a 3 mm space between shot locations and 10 shots at each location, resulting in 90 shots per sample. The optimal laser power was determined to be 65 mJ. This pattern and shot repetition served to remove variance owing to slight nonhomogeneity within the pelletized sample.
Scanning electron microscopy–energy dispersive X-ray spectroscopy sample preparation and measurements
Phytolith size distributions and silicon concentrations in leaf tissue were investigated using SEM–EDS. The selected leaves for SEM–EDS analysis were prepared through flattening, air-drying, and then removing dust from the leaf surface with compressed air. Leaves were mounted onto aluminum stubs using carbon or copper sticky tape. Images of the leaf surface were collected with an SEM (Hitachi TM4000) operating in backscatter mode at a 15 kV accelerating voltage. Corresponding silicon maps were collected with an EDS system (Oxford AZtecOne) at a 15 kV accelerating voltage. Images were captured at 30× magnification from three sites selected at random on one leaf from each individual tree. Carbon, oxygen, and silicon dominated the chemical composition of the leaves, and semiquantitative values were recorded of silicon concentration (weight percent) integrated across the entire mapped area.The images captured using SEM and EDS were processed using the image processing software ImageJ (Version 1.53q) and Fiji. The contrast of the SEM images was increased to allow for better identification of putative phytoliths, which appeared as bright spots in the leaves because of the increased electron backscatter of silicon relative to the surrounding organic matrix. Phytolith size distributions were quantified using silicon distribution maps obtained with EDS. Briefly, silicon maps were cropped to exclude labels, converted to 8 bit grayscale, and set to a known scale. A Gaussian blur was applied at a sigma level of 2–4 to improve thresholding. The threshold tool was used to highlight areas identified as phytoliths based on their appearance in the SEM image and high silicon content in the EDS image. Thresholding generated binary images with pixels identified as phytolith or not phytolith and areas designated as phytoliths were subsequently measured using the Analyze Particles function to determine their number, individual diameter (μm), and total area (μm2).
Results and discussion
Laser-induced breakdown spectroscopy spectra and optimization
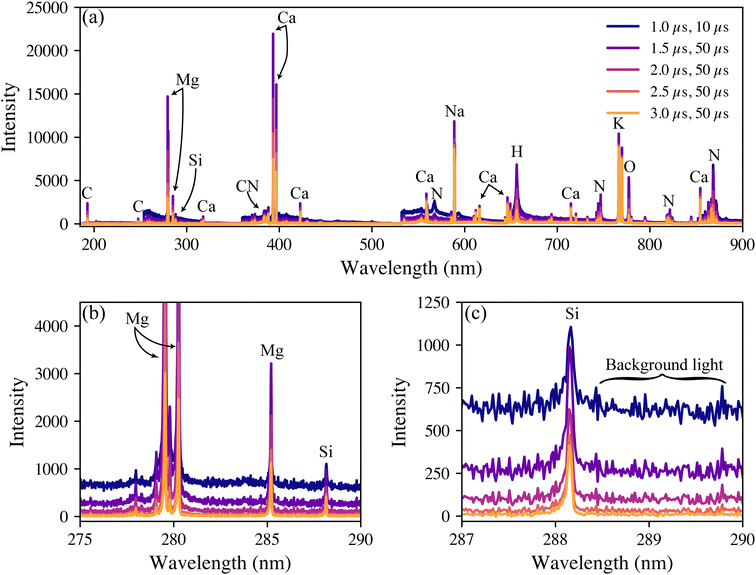
Representative broadband spectra from a woody P. trichocarpa pellet are shown in Fig. 1(a) with the emission peaks labelled. All emissions were verified in the National Institute of Standards and Technology atomic spectral database.31 The spectra are dominated by the anticipated major elements in environmental samples (hydrogen, carbon, nitrogen, oxygen, sodium, magnesium, potassium, and calcium). All these light elements provide strong emissions in LIBS spectra, highlighting the technique's applicability for environmental sample analysis. While C is highly relevant to this study, it was not quantified here due to the inability to distinguish natural C from PhytoC. The strongest silicon peak is the neutral emission located at 288.17 nm, shown in Fig. 1(b). In these samples, silicon is expected at trace levels; thus, its emission is significantly smaller than the other species and is much more affected by changes in the background light levels, as seen in Fig. 1(c).LIBS spectral intensities vary based on the point of measurement during a plasma lifetime. Early in the plasma lifetime, a large emission of white light releases as the plasma is still heating and expanding. Then, the plasma begins to cool, and elemental emissions emerge. The emissions change from being dominated by ionized transitions to being largely atomic transitions. The latter portion of the plasma lifetime then sees the emergence of molecular emissions as species in the plasma recombine. From a quantification standpoint, it is crucial to optimize the spectrometer collection settings to measure the maximum signal-to-background ratio (SBR), defined as eqn (1):
 | (1) |
Woody biomass pellets
A total of 300 pelletized wood samples were tested for their silicon content using LIBS. The 288 nm silicon intensities varied greatly between the samples. Although the raw silicon intensities could be used qualitatively and as an input for genotype modeling, quantifiable silicon levels were desired. To have matrix-matched standards, several pellets with low 288 nm silicon emissions (i.e., indistinguishable from noise) were ground, mixed, and spiked with a known amount of silicon to form a calibration set. Further details are provided in the Experimental section.For the calibration, the spectra were normalized to the 422 nm calcium emission intensities. Normalizing the trace species intensity to that of a major species that is always present helps to make the model more robust to variations in laser energy and in the plasma formation.32 Of all the other major elements considered (hydrogen, carbon, magnesium, sodium, and potassium), the 422 nm calcium emission served as the best reference. While calcium is a macronutrient in plant systems, its emission intensity was found to vary little across the population making it an acceptable reference. Looking back at Fig. 1, this emission is not the most intense Ca line. This intermediate-intensity emission is less likely to be affected by saturation or self-absorption, making it an ideal reference line. The normalized silicon intensities of the calibration data set are shown in Fig. 2(a).
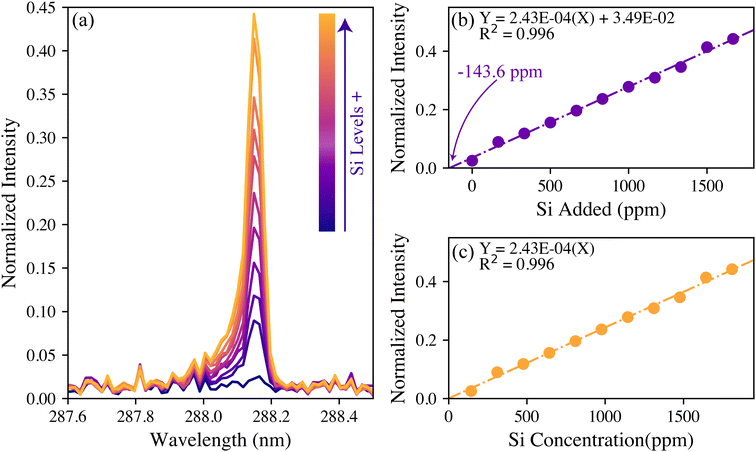 | ||
| Fig. 2 (a) The silicon spectral response to an increasing amount of silicon spike and the corresponding calibration curves (b) before and (c) after standard addition corrections. | ||
The univariate calibration comparing the normalized silicon intensity with the spiked silicon levels is shown in Fig. 2(b). The regression line crosses the x-axis at −143.6 ppm, which was expected because these were spiked samples that should contain a minor amount of silicon naturally. As is done with standard addition methods, the calibration concentrations were offset by this value to account for the natural silicon, and the result is shown in Fig. 2(c). The resultant univariate calibration model shows a strong linear fit, shown by its R2 value of 0.996. The limit of detection (LOD) for the model can be estimated as eqn (2):
 | (2) |
| Wood pellets (ppm) | Leaf pellets (wt%) | Leaf pelletsa (ppm) | |
|---|---|---|---|
a 1 wt% = 10![[thin space (1/6-em)]](https://www.rsc.org/images/entities/char_2009.gif) 000 ppm.
b Limit of quantification (LOQ) = 3.3 × LOD.
c Root-mean-squared-error (RMSE) percent is calculated by dividing the RMSE by the median concentration of the calibration. Cross-validation (CV) was performed using a leave-one-out-approach (LOOCV). For further details on CV and RMSE the reader is referred elsewhere.32,35 000 ppm.
b Limit of quantification (LOQ) = 3.3 × LOD.
c Root-mean-squared-error (RMSE) percent is calculated by dividing the RMSE by the median concentration of the calibration. Cross-validation (CV) was performed using a leave-one-out-approach (LOOCV). For further details on CV and RMSE the reader is referred elsewhere.32,35
|
|||
| R 2 | 0.996 | 0.987 | 0.987 |
| LOD | 28.9 | 0.015 | 150 |
| LOQb | 96.2 | 0.050 | 500 |
| RMSEC | 34.3 | 0.058 | 580 |
| RMSEC%c | 3.51% | 2.45% | 2.45% |
| RMSECV | 0.011 | 0.017 | 168 |
| RMSECV%c | 0.001% | 0.708% | 0.708% |
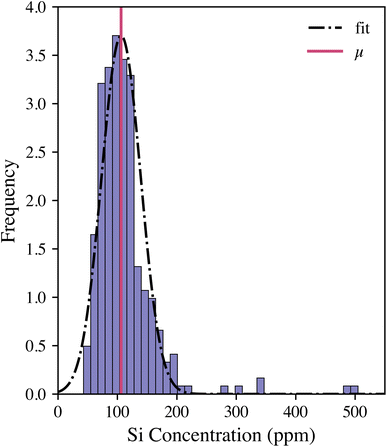
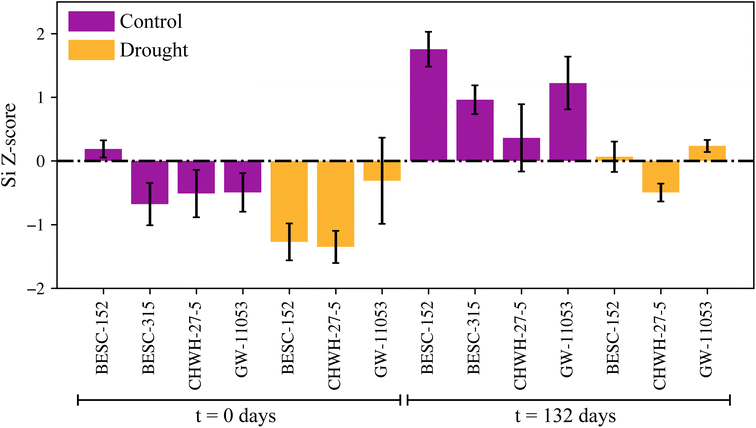
The calibration model was then applied to the entire woody pellet data set to quantify the silicon concentrations of samples from different P. trichocarpa genotypes. The silicon concentration distribution is illustrated in Fig. 3. The Gaussian distribution was fit to the data after outliers (Z-score > 3) were removed. The genotypes were ranked by their silicon concentrations compared with the sample population using their Z-score:
 | (3) |
Leaf pellets
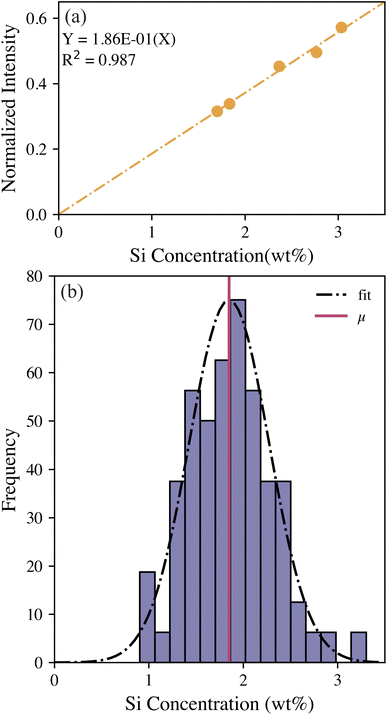
Leaves from P. trichocarpa were also examined (n = 75 samples). Although evaluating intact leaves is possible using LIBS, even resulting in elemental maps, quantification on raw leaves can be difficult because of the thin samples ripping and flaking during the ablation process. To enable quantification and rapid throughput, the same pelletizing and standard addition calibration procedure used on the woody pellets was employed for leaf samples. The previous calibration with woody pellets could not be transferred to the leaf pellets owing to differences in the matrix, and the leaves inherently had much higher silicon concentrations than the woody pellets (wt% versus ppm levels). Because of the change in the matrix composition, the silicon intensities in the leaf pellets were normalized to the 656 nm hydrogen peak. The 422 nm calcium peak used to normalize the woody pellet spectra was much more intense in the leaf spectra; this higher intensity likely resulted in self-absorption in some samples, making it a poor reference line. Fortunately, the pelletized leaves showed a consistent level of hydration making hydrogen an excellent reference. The leaf pellet calibration, after standard addition correction, is shown in Fig. 4(a). The LOD for this calibration model was estimated to be 0.015 wt% (150 ppm) silicon using eqn (2). Details and figures of merit for the two calibration models are provided in Table 3. The leaf pellet population was evaluated using the calibration, and the samples were ranked using the previously discussed levels based on the silicon concentration distribution, as shown in Fig. 4(b).The silicon concentration Z-scores can be used to investigate differing behavior between the genotypes under various conditions (Fig. 5); however, detailed analysis of this data will be performed in a follow-on study. Briefly, silicon concentrations were higher in the leaf samples that had been decomposed for 132 days versus leaves that were not decomposed (t = 0 days), regardless of genotype and source of the leaves (i.e., control, drought plots). This result is explained by the residual enrichment of silicon as carbon is lost during decomposition and affirms the stability of phytoliths. Leaves from trees that were growing in the drought plots showed consistently lower silicon levels than the levels of the leaves from trees growing in the control plots across the genotypes tested. No consistent trends existed in silicon concentration Z-scores among the different genotypes.
Phytolith detection using scanning electron microscopy–energy dispersive X-ray spectroscopy
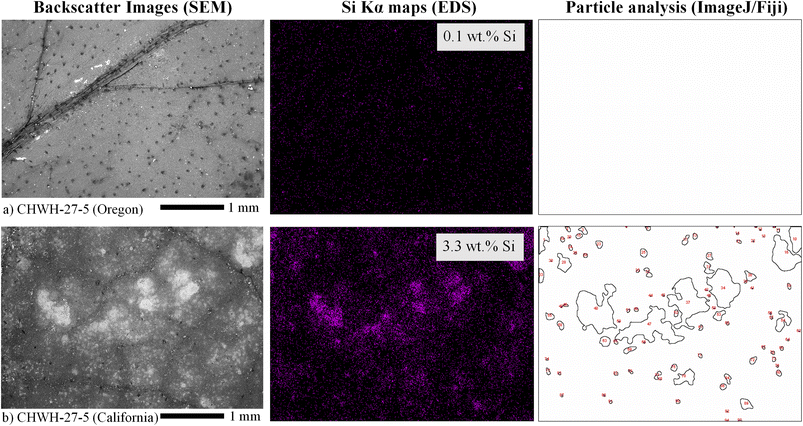
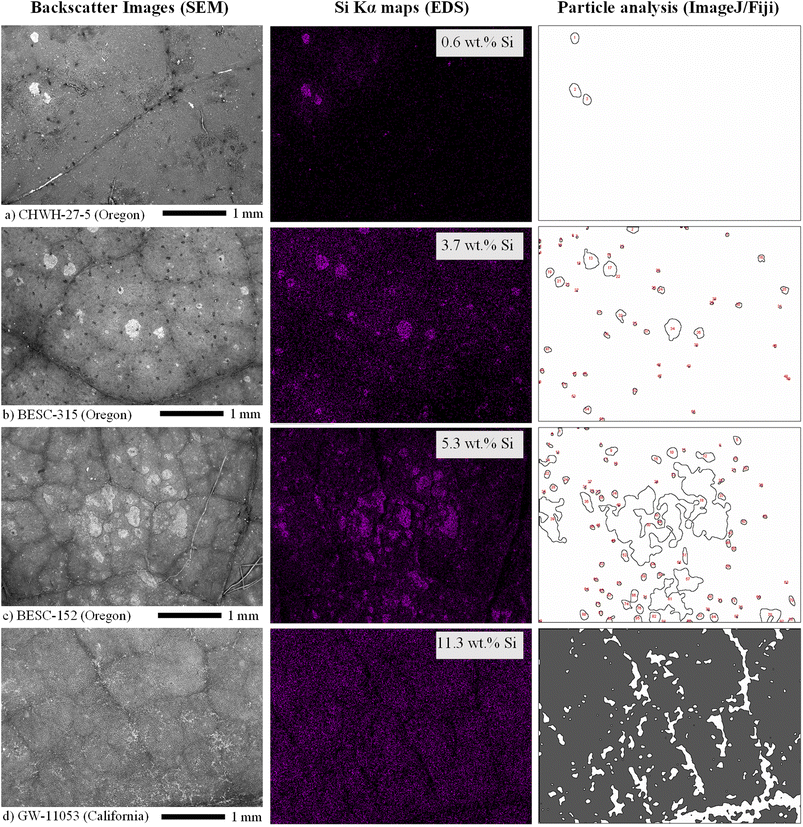
Silicon concentrations measured in the leaves by SEM–EDS ranged from 0.1 to 11.5 wt%, which was a wider range than that reported by bulk LIBS analysis, although similar trends were seen between genotype and Si level in both LIBS and SEM–EDS. Element concentrations reported by SEM–EDS are considered semiquantitative given that the technique probes the surface layer of the material (<10 μm) over a limited area and, therefore, should not be considered representative of bulk leaf tissue. Silicon concentrations with phytolith characteristics within each site of each leaf were compared to verify the presence of phytoliths and to evaluate their spatial distribution within the leaves. Phytoliths, when present, were fairly evenly distributed across the leaf. At very low silicon concentrations, no phytoliths were observed (e.g., one site from the CHWH-27-5 genotype from Oregon [3-94-28] contained 0.1 wt% silicon and no phytoliths) (Fig. 6). Phytoliths were visible at silicon concentrations >0.1 wt% and became more abundant with increasing silicon concentrations up to approximately 6 wt%, as shown in Fig. 7(a–c). As silicon approached 6 wt%, phytoliths became less distinct from each other and from the background leaf tissue, as shown in Fig. 7(c). Notably, Fig. 7(b–c) have significantly brighter backgrounds in their EDS images than Fig. 7(a), which is nearly all black. The brighter background suggests that background silicon concentrations were increasing at the same time as more phytoliths are forming. Phytoliths were not observed at silicon concentrations greater than approximately 6 wt%, either because they were indistinguishable from the high silicon background or because they were completely absent. In these silicon-rich leaves, silicon was evenly distributed throughout the leaf tissue but absent from the veins. It is unclear if the silicon in the high-silicon tissues is in a mineral form or a soluble form that is dispersed evenly throughout the matrix.The number and size of phytoliths were evaluated in leaves from the Oregon site. In total, 620 phytoliths, each having a mean area of 10![[thin space (1/6-em)]](https://www.rsc.org/images/entities/char_2009.gif) 610 ± 1845 μm2 (median = 2411 μm2; range from 45 to 829
610 ± 1845 μm2 (median = 2411 μm2; range from 45 to 829![[thin space (1/6-em)]](https://www.rsc.org/images/entities/char_2009.gif) 802 μm2), were identified across 12 areas from four different leaves (three areas per leaf), as shown in Fig. 8(a). The number of identified phytoliths and median phytolith size tended to increase with increasing silicon concentration, as shown in Fig. 8(b). The formation of new phytoliths would contribute to increases in the number of identified phytoliths and total phytolith area, and increasing median phytolith size can be further explained by the growth and/or merger of existing phytoliths. Phytolith characteristics could not be evaluated in most leaves from the California site because none could be distinguished against the high silicon background, as shown in Fig. 7(d).
802 μm2), were identified across 12 areas from four different leaves (three areas per leaf), as shown in Fig. 8(a). The number of identified phytoliths and median phytolith size tended to increase with increasing silicon concentration, as shown in Fig. 8(b). The formation of new phytoliths would contribute to increases in the number of identified phytoliths and total phytolith area, and increasing median phytolith size can be further explained by the growth and/or merger of existing phytoliths. Phytolith characteristics could not be evaluated in most leaves from the California site because none could be distinguished against the high silicon background, as shown in Fig. 7(d).
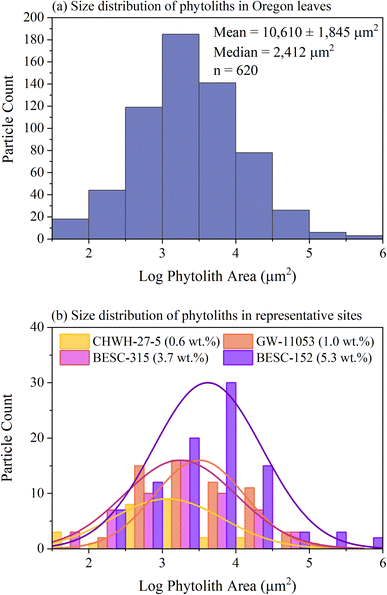 | ||
| Fig. 8 Size distributions of phytoliths identified as individual particles using the particle analysis tool in ImageJ/Fiji, where the size of each phytolith is represented by its area (μm2). Values have been converted to a log scale to generate near-normal distributions. Panel (a) contains information for all 12 sites analyzed across all four leaves from Oregon and reports the mean (±standard error of the measurement) and median phytolith sizes, and the number of phytoliths analyzed. Panel (b) shows size distributions for analysis sites from leaves of each genotype that represent a gradient of silicon concentrations from 0.6 to 5.3 wt%. Three of the distributions correspond to images shown in Fig. 7. | ||
Leaves collected at the California site had, on average, approximately 3.5× higher silicon concentrations than those collected from the Oregon site. All Oregon leaves had low to moderate levels of phytolith abundance and silicon concentrations. No examples of Oregon samples had a total lack of identifiable phytoliths. Most California images had high silicon concentrations and no apparent phytoliths; however, one California leaf had a moderate silicon concentration (3.3 wt%) and visible phytoliths, as shown in Fig. 6(b). Leaves from California also had dust particles appearing as bright spots on the leaf surface in SEM that were not removed during the cleaning process, as can be observed in the SEM image in Fig. 7(d). Although it is possible that the dust particles may have contributed to higher silicon concentrations, they were not visible as particles against the high-silicon background of the California samples in EDS images at the 30× magnification level used for this study.
Differences in silicon content and phytolith appearance between the two sites may be partially explained by collection date. Leaves from the California site were collected in October and had already senesced, whereas the Oregon leaves were collected in mid-July when they were still green. Because senescence draws many leaf constituents back into the main plant but leaves behind silicon, the leaf silicon concentration should rise after senescence, as shown through the LIBS analysis in the leaf pellets section of this paper.36,37 It is also possible that silicon may be distributed differently depending on the age of the leaf. Phytoliths may be continuously formed throughout the life of a leaf, or biomineralization may occur at certain time points in a noncontinuous manner. Environmental conditions (e.g., the bioavailability of silicon in the soil at each site) could also have driven differences in silicon concentrations.
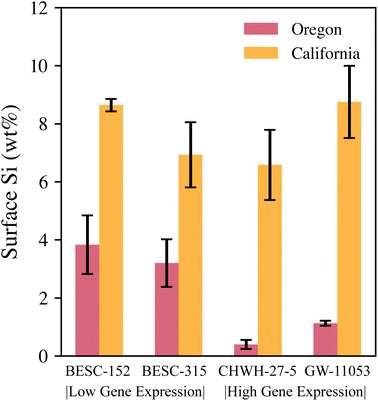
The two gene expression categories for genotypes (BESC-152 and BESC-315: low Si gene expression rate, CHWH-27-5 and GW-11053: high Si gene expression rate) poorly predicted trends in silicon concentration, as was the case with the LIBS analysis of leaf pellets in Fig. 5. The expected trends were not seen in the measured data (Fig. 9). In leaves from the Oregon site, the reverse of the expected trend was observed; the low-gene expression genotypes combined had a higher silicon concentration than the high-gene expression genotypes combined. However, notably, only one representative from each genotype was examined for the Oregon site, and no definitive conclusions regarding the influence of genotype on silicon levels can be made owing to the lack of replication. In the leaves from the California site, no clear differences exist in silicon concentrations between the genotypes.
Despite not seeing any trends with genotypes, the clear difference in silicon concentrations and phytolith distributions between the California and Oregon sites may again point toward site-available silicon in the soil playing an important role. Future work could use LIBS in the field to gauge silicon levels in the soils at the various sites. Additionally, LIBS could be used to screen leaf samples for silicon levels before SEM–EDS analysis. However, investigation of the relationship between bulk silicon concentration and local silicon levels on the surface of the leaves would be needed to fully realize LIBS as a screening tool. Based on the weak predictive strength of genotype and the large difference in silicon content in leaves between the two sites, this study concluded that environmental factors and seasonal differences may influence P. trichocarpa leaf silicon concentration more strongly than genotype.
Conclusions
Investigating phytolith formation is vital to better understanding the carbon cycle in plants. This study has demonstrated the use of LIBS to rapidly quantify silicon in wood and leaf samples from P. trichocarpa with low LODs using a standard addition approach for calibration. LIBS can be used to screen hundreds of samples to classify genotypes based on their silicon levels and benchmark genomes for GWAS modeling. Based on the SEM–EDS work discussed here, it is hypothesized that phytolith formation is most prevalent in samples with moderate silicon levels, measured as <6 wt% of silicon in the leaf surface. No phytoliths were observed at higher silicon concentrations either because of an inability to distinguish between phytoliths and a high silicon background or differences in how silicon is distributed across the leaf tissue. Preliminary results indicate that genotypes associated with the expression of particular silicon uptake genes may not directly correspond to silicon levels in wood and leaf biomass. One of the clearest results was the significant difference in Si accumulation in plants grown in control versus drought conditions. This further emphasizes that phenology and environmental conditions are likely to more strongly influence silicon uptake and phytolith formation. This information provides another opportunity where LIBS may be able to benchmark silicon levels in soils at the sampling location to provide further insight into this phenomenon.Notice
This manuscript has been authored by UT-Battelle, LLC, under contract DE-AC05-00OR22725 with the US Department of Energy (DOE). The US government retains and the publisher, by accepting the article for publication, acknowledges that the US government retains a nonexclusive, paid-up, irrevocable, world-wide license to publish or reproduce the published form of this manuscript, or allow others to do so, for US government purposes. DOE will provide public access to these results of federally sponsored research in accordance with the DOE Public Access Plan (http://energy.gov/downloads/doe_public_access_plan).Conflicts of interest
The authors have no conflicts of interest to declare.Acknowledgements
This work was supported by the Laboratory Directed Research and Development program at the US Department of Energy's Oak Ridge National Laboratory. This manuscript has been authored by UT-Battelle, LLC under Contract No. DE-AC05-00OR22725 with the US Department of Energy.References
- C. C. Ipcc, Mitigation of climate change, Contribution of working group III to the fifth assessment report of the intergovernmental panel on climate change, Cambridge University Press, Cambridge, United Kingdom and New York, NY, USA, 2014 Search PubMed.
- C. Jansson, S. D. Wullschleger, U. C. Kalluri and G. A. Tuskan, BioScience, 2010, 60, 685–696 CrossRef.
- Z. Song, C. Liu, K. Müller, X. Yang, Y. Wu and H. Wang, Earth Sci. Rev., 2018, 185, 463–475 CrossRef CAS.
- Z. Song, J. F. Parr and F. Guo, PLoS One, 2013, 8, e73747 CrossRef CAS PubMed.
- X. Yang, D. Liu, H. Lu, D. J. Weston, J.-G. Chen, W. Muchero, S. Martin, Y. Liu, M. M. Hassan, G. Yuan, U. C. Kalluri, T. J. Tschaplinski, J. C. Mitchell, S. D. Wullschleger and G. A. Tuskan, BioDesign Res., 2021, 2021, 1–22 CrossRef PubMed.
- J. F. Parr and L. A. Sullivan, Soil Biol. Biochem., 2005, 37, 117–124 CrossRef CAS.
- Z. Song, H. Liu, C. A. E. Strömberg, X. Yang and X. Zhang, Sci. Total Environ., 2017, 603–604, 502–509 CrossRef CAS PubMed.
- Z. Song, K. McGrouther and H. Wang, Earth-Sci. Rev., 2016, 158, 19–30 CrossRef CAS.
- M. A. Ahanger, J. A. Bhat, M. H. Siddiqui, J. Rinklebe and P. Ahmad, J. Exp. Bot., 2020, 71, 6758–6774 CrossRef CAS PubMed.
- S. Gaur, J. Kumar, D. Kumar, D. K. Chauhan, S. M. Prasad and P. K. Srivastava, Ecotoxicol. Environ. Saf., 2020, 202, 110885 CrossRef CAS.
- Z. Souri, K. Khanna, N. Karimi and P. Ahmad, J. Plant Growth Regul., 2021, 40, 906–925 CrossRef CAS.
- K. P. Woli, M. B. David, J. Tsai, T. B. Voigt, R. G. Darmody and C. A. Mitchell, Biomass Bioenergy, 2011, 35, 2807–2813 CrossRef CAS.
- H. M. El-Nashaar, S. M. Griffith, J. J. Steiner and G. M. Banowetz, Bioresour. Technol., 2009, 100, 3526–3531 CrossRef CAS PubMed.
- K. M. Watling, J. F. Parr, L. Rintoul, C. L. Brown and L. A. Sullivan, Spectrochim. Acta, Part A, 2011, 80, 106–111 CrossRef CAS PubMed.
- R. Corbineau, P. E. Reyerson, A. Alexandre and G. M. Santos, Rev. Palaeobot. Palynol., 2013, 197, 179–185 CrossRef.
- A. Alexandre, I. Basile-Doelsch, T. Delhaye, D. Borshneck, J.-C. Mazur, P. Reyerson and G. Santos, Biogeosciences, 2015, 12, 863–873 CrossRef.
- H. B. Andrews, M. Z. Martin, A. M. Wymore and U. C. Kalluri, Plant Soil, 2023, 1–10 Search PubMed.
- M. Z. Martin, N. Labbé, N. André, S. D. Wullschleger, R. D. Harris and M. H. Ebinger, Soil Sci. Soc. Am. J., 2010, 74, 87–93 CrossRef CAS.
- M. Z. Martin, D. C. Glasgow, T. J. Tschaplinski, G. A. Tuskan, L. E. Gunter, N. L. Engle, A. M. Wymore and D. J. Weston, Spectrochim. Acta, Part B, 2017, 138, 46–53 CrossRef CAS.
- J. Kaiser, K. Novotný, M. Z. Martin, A. Hrdlička, R. Malina, M. Hartl, V. Adam and R. Kizek, Surf. Sci. Rep., 2012, 67, 233–243 CrossRef CAS.
- D. K. Tripathi, R. Kumar, A. K. Pathak, D. K. Chauhan and A. K. Rai, Agric. Res., 2012, 1, 352–361 CrossRef CAS.
- M. M. Hassan, S. Martin, K. Feng, T. B. Yates, G. Yuan, M. Z. Martin, S. Martin, W. Muchero, N. A. Griffiths, D. J. Weston and X. Yang, Plant Biotechnol. Rep., 2023, 17, 285–302 CrossRef CAS.
- K. D. Vernon-Parry, III-Vs Rev., 2000, 13, 40–44 CrossRef.
- A. M. Donald, Nat. Mater., 2003, 2, 511–516 CrossRef CAS PubMed.
- R. R. Evett and R. Q. Cuthrell, J. Archaeol. Sci., 2016, 68, 70–78 CrossRef.
- G. Gao, D. Jie, L. Liu, H. Liu, Z. Gao, D. Li and N. Li, Rev. Palaeobot. Palynol., 2018, 255, 43–56 CrossRef.
- F. de Tombeur, B. Turner, E. Laliberté, H. Lambers, G. Mahy, M.-P. Faucon, G. Zemunik and J.-T. Cornelis, Science, 2020, 369, 1245–1248 CrossRef CAS.
- F. Poggialini, B. Campanella, B. Cocciaro, G. Lorenzetti, V. Palleschi and S. Legnaioli, J. Anal. At. Spectrom., 2023, 3642 CAS.
- L. C. L. Borduchi, D. M. B. P. Milori, M. C. Meyer and P. R. Villas-Boas, Spectrochim. Acta, Part B, 2022, 198, 106561 CrossRef CAS.
- W. Muchero, J. Guo, S. P. DiFazio, J.-G. Chen, P. Ranjan, G. T. Slavov, L. E. Gunter, S. Jawdy, A. C. Bryan and R. Sykes, BMC Genomics, 2015, 16, 1–14 CrossRef PubMed.
- A. Kramida, Y. Ralchenko and J. Reader, NIST Atomic Spectra Database (ver. 5.3), DOI:10.18434/T4W30F.
- H. Andrews and S. Phongikaroon, Nucl. Technol., 2019, 205, 891–904 CrossRef.
- D. W. Hahn and N. Omenetto, Appl. Spectrosc., 2012, 66, 347–419 CrossRef CAS.
- I. Porth, J. Klapšte, O. Skyba, J. Hannemann, A. D. McKown, R. D. Guy, S. P. DiFazio, W. Muchero, P. Ranjan, G. A. Tuskan, M. C. Friedmann, J. Ehlting, Q. C. B. Cronk, Y. A. El-Kassaby, C. J. Douglas and S. D. Mansfield, New Phytol., 2013, 200, 710–726 CrossRef CAS PubMed.
- H. B. Andrews, L. R. Sadergaski and S. K. Cary, ACS Omega, 2023, 8(2), 2281–2290 CrossRef CAS PubMed.
- M.-P. Turpault, G. Kirchen, C. Calvaruso, P.-O. Redon and M. Dincher, Biogeochemistry, 2021, 152, 51–71 CrossRef.
- A. Maillard, S. Diquélou, V. Billard, P. Laîné, M. Garnica, M. Prudent, J.-M. Garcia-Mina, J.-C. Yvin and A. Ourry, Front. Recent Dev. Plant Sci., 2015, 6, 317 Search PubMed.
| This journal is © The Royal Society of Chemistry 2023 |

