 Open Access Article
Creative Commons Attribution 3.0 Unported Licence
Discerning subtle high-pressure phase transitions in glyphosate†‡
Cameron J. G.
Wilson
 a,
Peter A.
Wood
 b and
Simon
Parsons
 *a
*a
aCentre for Science at Extreme Conditions, School of Chemistry, The University of Edinburgh, King's Buildings, West Mains Road, Edinburgh, UK. E-mail: S.Parsons@ed.ac.uk
bThe Cambridge Crystallographic Data Centre, 12 Union Road, Cambridge, UK
First published on 11th January 2023
Abstract
The common garden herbicide glyphosate, N-(phosphonomethyl)glycine, has been studied between ambient pressure and 5.17 GPa using single crystal X-ray diffraction. Glyphosate forms a structure composed of layers parallel to the (1 0 −2) planes. Hydrogen bonds form along the stacking direction, which are very incompressible so that the effects of pressure are accommodated mostly within the layers. This study has confirmed two high pressure phase transitions previously observed by Raman spectroscopy, enabling the structural signatures of the transitions to be identified. Both transitions are very subtle and second order, involving changes to the way the structure responds to pressure rather than changes to the structure. The first transition occurs between 0.93–1.21 GPa and corresponds to the onset of greater compressibility within the layers. The second transition between 3.78–4.23 GPa is an intramolecular feature signalling a deformation of the molecular backbone. In the absence of a first order phase transition, the packing remains in a compressed form of its ambient pressure form up until the highest pressure measured. A reconstructive phase transition occurs at 5.98 GPa forming a polycrystalline high-pressure phase.
1. Introduction
The use of high pressure to study the phase behaviour of molecular materials is becoming an increasingly more accessible technique with a wide range of applications.1 Vibrational spectroscopy provides a sensitive method for studying subtle transitions, but these sometimes do not appear to have an obvious structural effect on, for example, cell dimensions, volumes, or atomic positions. Identification of these transitions crystallographically can be complex and involve sifting through large amounts of numerical data, with the risk that subtle features could be missed. For example, the presence or absence of a phase transition in naphthalene has been debated since Bridgeman's first observations over 80 years ago.2–11 Clear discontinuities seen in high-pressure infra-red spectra of naphthalene are hardly discernable in crystal structure data.Glyphosate, N-(phosphonomethyl)glycine, is a common garden herbicide, used widely in domestic products such as Weedol® and Roundup®. The Cambridge Structural Database (CSD)12 features five entries for glyphosate under the refcode family PHOGLY. The first four (PHOGLY-PHOGLY03) are studies on crystals of the same phase (space group P21/c) obtained directly from commercial weed-killer samples at ambient temperature and pressure.13–15 The final entry (PHOGLY04) is again an ambient temperature and pressure structure but features a unique polymorph in the space group P21, obtained on using MnO2 in the presence of H2SO4 to oxidise N-(phosphonomethyl)iminodiacetic acid.16
Glyphosate was recently studied to 6.2 GPa using high pressure Raman spectroscopy in the spectral range 45 to 3700 cm−1 by Holanda et al.17 two high pressure phase transitions were identified. The first transition was located at between 0.97 and 1.5 GPa and the second between 4.29 and 4.63 GPa. The transitions were identified based on discontinuities in plots of vibrational frequency versus pressure, splitting and changes in the intensities of bands as well as the appearance of new modes. For example, the appearance at 0.97 GPa of a new mode at 61 cm−1 was taken to indicate a change in space group symmetry. The second transition was identified above 3.86 GPa, where a band at 82 cm−1 merges to form a single wide band with another previously at 90 cm−1. Glyphosate has not previously been studied using high pressure X-ray diffraction and the motivation for this work was to identify the structural character of the transitions.
2. Materials and methods
2.1 Single crystal X-ray diffraction
Crystals of glyphosate (Sigma Aldrich) were grown by slow evaporation of an aqueous solution of concentration 10 mg mL−1. Diffraction data were collected on a Bruker AXS D8 Venture diffractometer using Ag Kα radiation (λ = 0.56083 Å), first at ambient conditions and then at high pressure in two separate studies. In each case, a crystal was loaded into a Merrill–Bassett diamond-anvil cell (DAC) with half opening angle of 38°, 600 μm Boehler–Almax-cut diamonds and tungsten carbide backing plates.18,19 A tungsten gasket of thickness 300 μm indented to 150 μm and hole diameter of 300 μm was used, with a 4![[thin space (1/6-em)]](https://www.rsc.org/images/entities/char_2009.gif) :
:![[thin space (1/6-em)]](https://www.rsc.org/images/entities/char_2009.gif) 1 mixture of methanol and ethanol as a pressure transmitting medium.20 A small ruby chip was also included in the sample loading and the ruby fluorescence method was used to measure the pressure; the values quoted have an uncertainty of 0.05 GPa.21 The data at ambient pressure were collected in the DAC prior to addition of the pressure transmitting medium. The maximum pressure reached was 5.17 GPa. The data quality deteriorated at 5.60 GPa, and increasing pressure further to 5.98 GPa led to a proliferation of diffraction spots which pointed to the sample undergoing a destructive phase transition forming a new polycrystalline phase. Attempts to determine the unit cell dimensions of the new phase were unsuccessful.
1 mixture of methanol and ethanol as a pressure transmitting medium.20 A small ruby chip was also included in the sample loading and the ruby fluorescence method was used to measure the pressure; the values quoted have an uncertainty of 0.05 GPa.21 The data at ambient pressure were collected in the DAC prior to addition of the pressure transmitting medium. The maximum pressure reached was 5.17 GPa. The data quality deteriorated at 5.60 GPa, and increasing pressure further to 5.98 GPa led to a proliferation of diffraction spots which pointed to the sample undergoing a destructive phase transition forming a new polycrystalline phase. Attempts to determine the unit cell dimensions of the new phase were unsuccessful.
The diffraction patterns were indexed using APEX4 and integrated using SAINT.22 Corrections for the gasket shading, absorption and other systematic errors were applied using the multiscan procedures in SADABS.23 The structure at ambient pressure was solved using dual-space methods (SHELXT),24 and refinement of all structures was against |F|2 (SHELXL),25 from within the OLEX-2 interface.26 The starting model at each pressure point was taken from the previous point in the series and all intramolecular bond lengths and angles restrained to their values at ambient pressure. All non-hydrogen atoms were refined with anisotropic displacement parameters (adps) and hydrogen atoms attached to carbon were placed at calculated positions and allowed to ride their parent atoms; those attached to oxygen were treated as rotating rigid groups. Adps were subject to enhanced rigid bond restraints.27 Listings of crystal and refinement data are available in Table S1.‡ Structures were visualised using Mercury28 and Diamond.29
2.2 Periodic DFT calculations
The high-pressure crystal structures were optimised using periodic density functional theory (DFT) using CASTEP with the Perdew–Burke–Ernzerhof (PBE)30 exchange-correlation functional and ‘on the fly’ pseudopotentials.31 The basis set cut-off and k-point spacing were 920 eV and 0.07 Å−1, giving a convergence in the total energy of 0.1 meV per atom. The convergence criteria for the geometry optimisations were: 5 × 10⁻⁶ eV per atom (energy), 0.01 eV Å−1 (force) and 5 × 10⁻⁴ Å (displacement). The unit cell parameters were fixed at observed values throughout. DFT optimized structures were used in all calculations and figures unless stated otherwise.2.3 Occupied volume (‘CellVol’) calculations
Occupied (‘network’) and unoccupied (‘void’) volumes in crystal structures were evaluated in a Monte Carlo procedure using the CellVol code;32 a short summary is available in the ESI.‡2.4 Pixel calculations
Intermolecular interaction energies were calculated via the Pixel method33–35 using the MrPixel interface.36 Gaussian-0937 was used to calculate the electron density at the MP2 level of theory with the 6-31G** basis set. The molecular electron density was calculated on a grid of 0.08 × 0.08 × 0.08 Å3 and a condensation level of 4 was used for the Pixel calculations with a cluster radius of 14 Å. The positions of H-atoms, which strongly influence intermolecular interaction energies, are systematically in error when determined by X-ray diffraction as the result of the asymmetry of their local electron distributions. In addition, the position of H3 in the refined crystal structures exhibited some instability as a function of pressure, with an oscillation in the torsion at successive pressure points. This is likely to be an artefact, perhaps the result of the relatively low (∼40%) completeness of high-pressure data sets, a result of shading by the diamond anvil cell. Pixel calculations were therefore based on coordinates obtained from geometry-optimisation of the crystal structures using periodic DFT.3. Results and discussion
3.1 Ambient pressure structure
Glyphosate, N-(phosphonomethyl)glycine, crystallizes in space group P21/c with one molecule in the asymmetric unit.38 The molecules adopt the zwitterionic tautomeric form (Fig. 1), with formal positive and negative charges on the ammonium group based on N3 and phosphate groups based on P5, respectively. The bond distances, angles and conformation have been discussed in detail in ref. 13.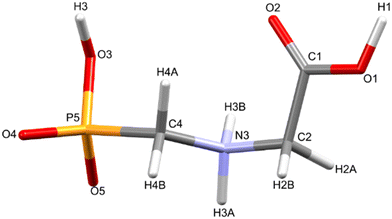 | ||
| Fig. 1 The zwitterionic molecular structure of glyphosate featuring the numbering scheme used in this work. | ||
Intermolecular interactions are dominated by H-bonding. Intermolecular interaction energies, evaluated using the Pixel method (Table 1) show that the first coordination sphere, consisting of those molecules forming interactions to a central reference molecule with non-zero Pauli repulsion terms, contains 13 molecules (Fig. 2). The prediction of mechanical properties based on slip planes described by Bryant, Maloney and Sykes39 indicates that the most probable slip plane in the structure of glyphosate is (1 0 −2), and the crystal structure can be described in terms of layers parallel to these planes (Fig. 2i).
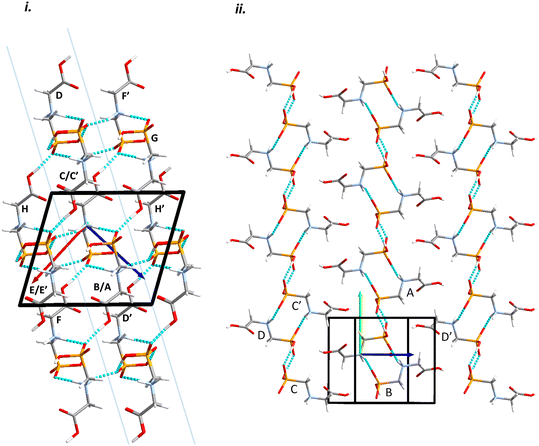 | ||
| Fig. 2 Packing diagrams for glyphosate. The interactions within the first coordination sphere are labelled. Slashes indicate those molecules hidden by symmetry from the view. Vectors drawn from the central reference molecule on the diagram represent the principal axes of the strain tensor; red, green and blue are used for the numerically smallest, middle and largest eigenvalues. i) A view down the b-direction reveals the layered structure parallel to (1 0 −2) slip planes, indicated by blue lines. ii) A view of a single layer. Note that labels refer to molecule–molecule interactions, as listed in Table 1, rather than individual contacts such as H-bonds. | ||
Within the layer (Fig. 2ii) the phosphate moieties form pairs of O3H3⋯O4 H-bonds across inversion centres in a ring motif (contact A, centroid separation 6.868 Å, total energy −114.7 kJ mol−1). These units are linked into a chain which runs along b by pairs of N3H3B⋯O5 H-bonds, also forming ring motifs across inversion centres, between the ammonium and phosphate groups (contact B, centroid separation 5.033 Å, total energy −267.3 kJ mol−1). This interaction between oppositely charged groups is the most stabilising contact in the structure. The chains are connected into a layer which is parallel to the (1 0 −2) planes on one side by weaker interactions C/C′ and D and on the other by a symmetry-equivalent interaction D′. Neither C/C′ nor D/D′ forms H-bonds with the central molecule. C is barely stabilising at all with a total energy equal to −0.6 kJ mol−1, composed principally of destabilising coulombic and stabilising dispersion components (+10.4 and −14.8 kJ mol−1, respectively). The closest atom-atom distances, formed between C2H2A and carboxyl, measure 2.7–3.0 Å, and the centroid separation is 5.995 Å. Contact D is a longer-range electrostatic interaction (centroid separation 8.854 Å and total energy −28.4 kJ mol−1).
The stacking of the layers involves four further H-bonded contacts. The most stabilising of these forms N3H3A⋯O4 H-bonds with the central molecule (contact E/E′, centroid separation 6.532 Å, total energy −144.5 kJ mol−1). Further H-bonds (contact F/F′) are formed through lattice translations along a, forming a head-to-tail arrangement involving O1H1⋯O5 (centroid separation 8.669 Å, total energy −90.6 kJ mol−1). Destabilising electrostatic interactions G (centroid separation 6.460 Å, total energy 5.8 kJ mol−1) and H/H′ (centroid separation 5.135 Å, total energy 32.2 kJ mol−1) are also formed between the layers as the result of the juxtaposition of like-charged moieties. The formation of destabilising contacts has been noted in other zwitterionic structures such as amino acids.40,41
3.2 Response of the unit cell parameters to pressure
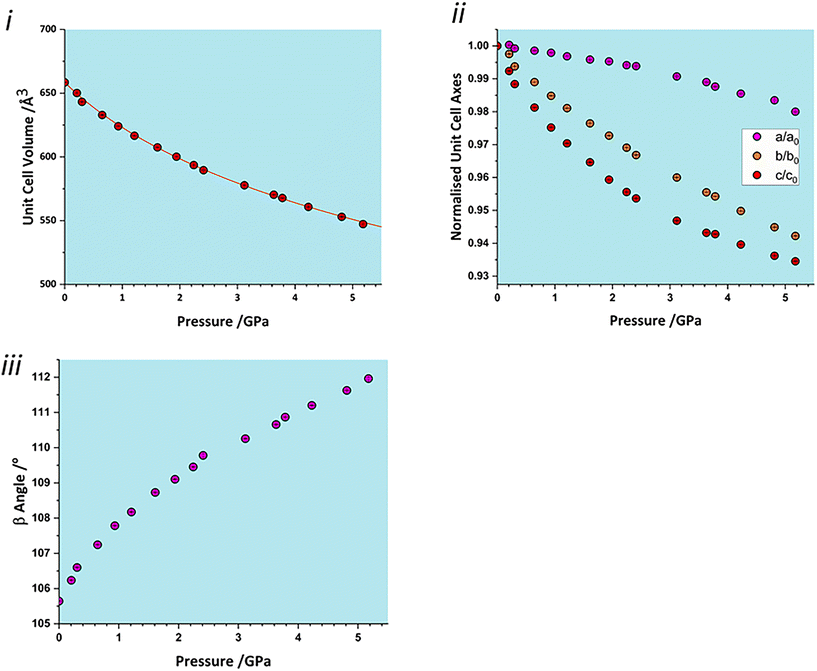
The total unit cell volume decreases monotonically (Fig. 3i), with no apparent discontinuities at between 0.97 and 1.5 GPa or between 4.29 and 4.63 GPa associated with the phase transitions reported in Holanda et al.'s study.17 The volume versus pressure data can be fitted (χ2 = 0.93) to a single third-order Birch–Murnaghan equation of state (EoS) to yield a bulk modulus of 14.8(4) GPa with a pressure derivative of 7.5(4).42 These values are typical of H-bonded molecular crystals, and are comparable to other amino acids such as serine [19(2) GPa],32 alanine [13.1(6) GPa]43 and histidine [14.0(5) GPa].40The compressibility of the unit cell parameters is anisotropic, following the order c (6.5% between ambient pressure and 5.17 GPa) > b (5.8%) > a (2.0%) (Fig. 3ii); the value of β increases monotonically (Fig. 3iii). None of the unit cell parameters show any significant features at the first reported transition pressure, though the a and c axis lengths show small discontinuities at 3.8 GPa, marking of the onset of the second transition.
The anisotropy of compression is much clearer in the strain tensor.44,45 The smallest eigenvalue determined between ambient pressure and 5.17 GPa (Table 2) is over an order of magnitude smaller than the other two [−0.0012(4) versus −0.0587(3) and −0.1204(4)]. The eigenvectors (Fig. 2) show that the numerically largest eigenvalue is located in the planes described above in the direction of the very weak contacts C and D. By symmetry, one eigenvector must lie along b, and in glyphosate this is the middle axis, the smaller compression being consistent with the occurrence of the chain-forming H-bonds A and B described above. The axis of minimum compression lies perpendicular to the first two axes, approximately along the strongly H-bonded stacking direction, and has an eigenvalue which is barely significantly different zero. The essentially two-dimensional character of the compression in glyphosate thus reflects the relative incompressibility of strong H-bonds.
| Axis | Strain | <a/° | <b/° | <c/° |
|---|---|---|---|---|
| 1 | −0.0012(4) | 27.1 | 90.0 | 132.8 |
| 2 | −0.0578(3) | 90.0 | 0.0 | 90.0 |
| 3 | −0.1204(4) | 62.9 | 90.0 | 42.8 |
3.3 Intermolecular interactions
The centroid-centroid separation of most contacts reduces with increasing pressure, except for contact G, which remains relatively constant at ∼6.5 Å. Contacts which do not involve hydrogen bonds (C, D and H) generally show a greater reduction in centroid separation with the greatest reductions seen for contacts C and D in the direction of the most compressible strain axis (0.538, 0.761, 0.37 Å for contacts C, D and H respectively). Amongst the H-bonded contacts A, B, E and F, A shows a significantly higher change in centroid separation (0.46 Å) than the others, for which compression is more consistent (0.155, 0.148 and 0.173 Å for contacts B, E and F respectively). Both contact A and B align with the middle strain axis while contacts E and F align with the least compressible strain axis.The energies of each of the 13 intermolecular contacts are shown as a function of the centroid separation in Fig. 4. The trends are monotonic for most of the contacts, but there is some scatter for the chain-forming H-bonded interactions A and B. These energies are highly sensitive to random errors in the atomic (particularly the H) positions. Even though the coordinates used in the Pixel calculations were optimised by periodic DFT, the cell dimensions were fixed at their experimental values during these optimisations, and so some random error persists. We are of the opinion that since the scatter does not align with the phase transitions, it probably reflects random error.
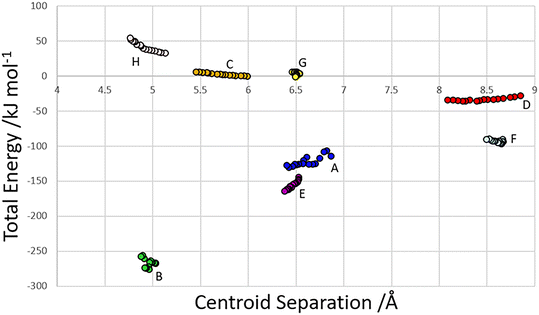 | ||
| Fig. 4 Total dimer energies versus centroid separation for contacts within the first coordination sphere. | ||
3.4 Volume analysis
The volume of a crystal structure can be partitioned into regions which are occupied by molecules and their network of intra and intermolecular interactions and unoccupied interstitial voids. We refer to these as the as the ‘network’ and ‘void’ regions, respectively and their volumes are Vnet and Vvoid.32 Trends in Vnet and Vvoid with pressure can be more sensitive to subtle structural transitions than the overall unit cell dimensions. The method has recently been used to identify structural behaviour in naphthalene, the Blatter radical and in 4-methylpyridine pentachlorophenol co-crystals.32,46,47The network and void volumes in glyphosate are shown in Fig. 5 as a function of pressure. While there are no discontinuities in either the overall unit cell volume or intermolecular energies associated with the phase transitions revealed by Raman spectroscopy, small discontinuities do occur in the gradient of the network volume trends at 0.93 and 3.78 GPa. These are less clear in the void volume trends as they are overwhelmed by the greater compressibility of the voids. The trends in Vnet between the transitions are quite linear, and fitting to second order Birch–Murnaghan equations of state yields bulk moduli of 90(12), 105(2) and 96(7) GPa for the three phases with increasing pressure; there is no significant difference between these figures. The average network bulk modulus can be obtained by fitting a second-order Birch–Murnaghan EoS across the entire data range giving K = 104.2(6) GPa (χ2 = 0.86), a value typical of hydrogen bonded networks.32 A third-order Vinet equation of state was applied to the void giving a bulk modulus of 4.4(1) GPa, K′ = 1.17 (9) and a χ2 of 1.29, typical of values seen in our previous work.32
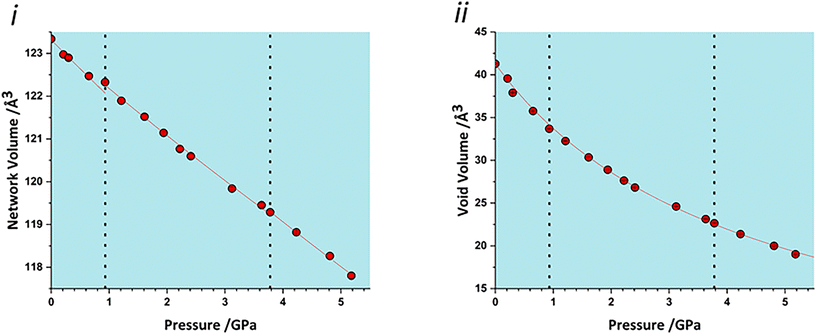 | ||
| Fig. 5 i) Network volumes at increasing pressure. ii) Void volumes at increasing pressure. Dashed lines in all plots represent phase transitions based on this work and that of Holanda et al. | ||
To identify which intermolecular interactions undergo the largest changes at the transitions, the volumes of the glyphosate molecule and dimers and larger clusters were calculated by placing a box around each and evaluating the occupied volume using a similar Monte Carlo procedure to that described above for unit cells. Further details are available in the ESI.‡ The calculation was first applied to the interlayer volume, featuring contacts E, F, G, H and the central molecule (Fig. S2 in the ESI‡). This plot contains no clear discontinuity at the first transition, Fig. 6i. The layer stacking is in the direction of the numerically smallest eigenvalue of the strain tensor and appears to remain unchanged through the first transition. A very slight discontinuity is seen at the second transition. The calculation was then applied to a single layer containing the central molecule and contacts A, B, C and D (Fig. S2 in the ESI‡). This plot features a discontinuity at both transition pressures, indicating that both transitions have a structural signature within the layers, Fig. 6ii. In particular, the layer compressibility appears to level-off immediately before the first transition but becomes re-established afterwards. The first transition can thus be associated with the re-emergence of compressibility within the layers.
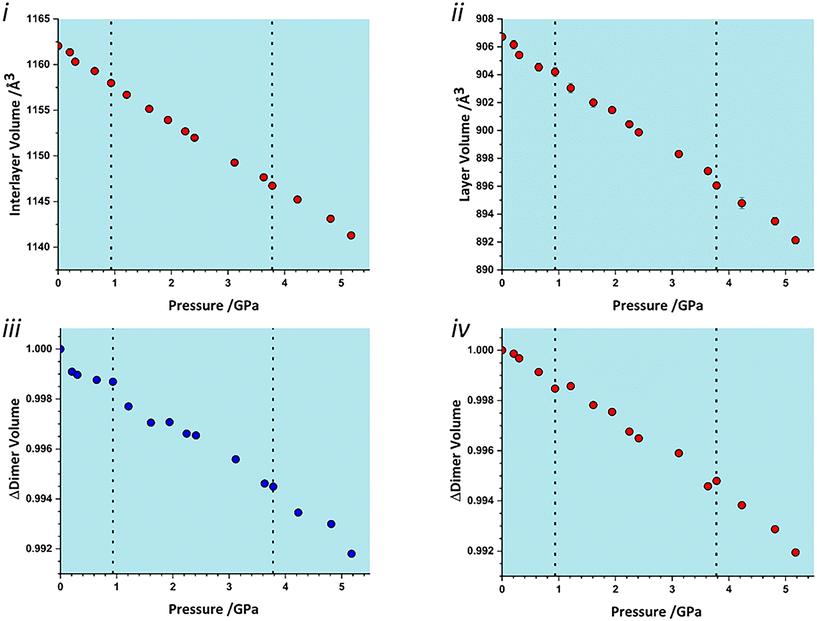 | ||
| Fig. 6 Variation in the volume of subsets of the glyphosate crystal structure. i) Interlayer volume, consisting of the central molecule and those in adjacent layers within the first coordination sphere. ii) Layer volume, consisting of a single layer containing the central molecule. iii) The volume of contact A (Fig. 2). iv) The volume of contact D/D′. | ||
To identify the interactions driving these transitions the Monte Carlo method was then applied to the individual dimers A–H listed in Table 1. Plots for all contacts can be found in the ESI‡ (Fig. S3) with selected contacts presented in Fig. 6iii and iv. Volumes at this scale are very sensitive to structural instabilities and there is some scatter. Nevertheless, contact A and D/D′ show fairly clear discontinuities at the first transition. Contact A shows a reduction in dimer volume and contact D/D′ a smaller increase, so that the re-emergence of layer compressibility can be associated with contact A.
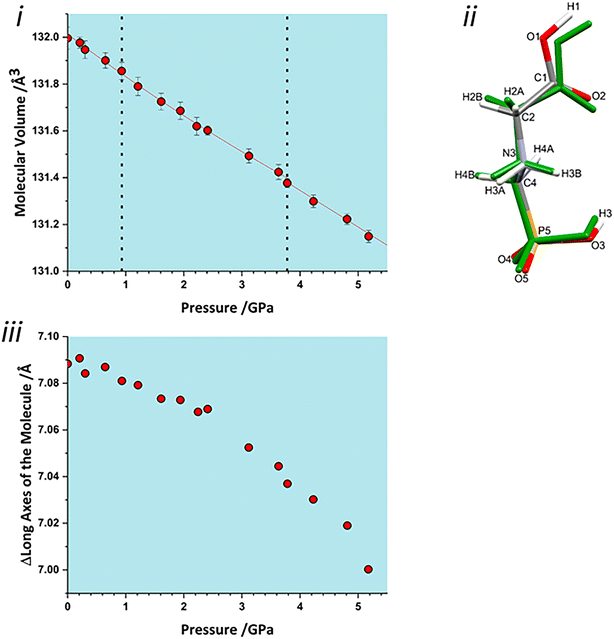
Both interlayer and intralayer plots and virtually all contacts can be interpreted as having a discontinuous change in dimer volume at the second transition. This suggests that the transition may have an intramolecular contribution, and application of the volume calculation to individual molecules reveals a small discontinuity in molecular volume at the second transition, Fig. 7i. As pressure is increased, the long axis of the molecule hunches to a more compressed form, with most of this compression taken up at the carbonyl end of the molecule, Fig. 7ii. As pressure increases, the longest axis of the inertial tensor (see ESI‡) compresses, Fig. 7iii, with the trend becoming steeper after the second transition. The alignment of the long axes with the layer explains why the second transition is more obvious in Fig. 6ii than in 6i.
4. Conclusions
The literature contains many examples of vibrational discontinuities from spectroscopic experiments at high pressure that often seem to not be reproduced by conventional crystallographic analysis. This is especially relevant to second order transitions which instead of accounting for physical changes to structural packing, represent the onset of new mechanisms for accommodating pressure. The network and void volumes appear to be more sensitive than other structural features to these subtle changes.In this paper we have applied these methods to two high pressure phase transitions in glyphosate which had previously been identified by Raman spectroscopy. We have previously noted that the onset of subtle transitions marks a shift from compression of the void space to compression of the more rigid network, and the same in true in glyphosate. The first transition, between 0.93–1.21 GPa corresponds to a discontinuous change in the overlap of van der Waals surfaces within the layers to accommodate further compression. The second transition between 3.78–4.23 GPa is an intramolecular effect, signalling an increased rate of contraction of the molecular backbone to allow further compression. Both transitions occur without a change to space group symmetry or a change to the structural packing. The lack of a discontinuity in either the total volume or energy for either transition, suggests that they are both second order.
Funding information
We thank the Cambridge Crystallographic Data Centre, the Engineering and Physical Sciences Research Council (UK) and the University of Edinburgh for studentship funding to CJGW.Conflicts of interest
There are no conflicts to declare.References
- S. A. Moggach and I. D. H. Oswald, in 21st Century Challenges in Chemical Crystallography I: History and Technical Developments, ed. D. M. P. Mingos and P. R. Raithby, Cham: Springer International Publishing, 2020, pp. 141–198 Search PubMed.
- P. W. Bridgman, Proc. Am. Acad. Arts Sci., 1938, 72, 227–268 CrossRef CAS.
- S. Block, C. E. Weir and G. J. Piermarini, Science, 1970, 169, 586–587 CrossRef CAS PubMed.
- S. N. Vaidya and G. C. Kennedy, J. Chem. Phys., 1971, 55, 987–992 CrossRef CAS.
- M. Nicol, M. Vernon and J. T. Woo, J. Chem. Phys., 1975, 63, 1992–1999 CrossRef CAS.
- S. D. Hamann, High Temp. – High Pressures, 1978, 10, 503–510 CAS.
- K. P. Meletov, Phys. Solid State, 2013, 55, 581–588 CrossRef CAS.
- E. O'Bannon and Q. Williams, Phys. Chem. Miner., 2016, 43, 181–208 CrossRef.
- F. P. A. Fabbiani, D. R. Allan, S. Parsons and C. R. Pulham, Acta Crystallogr., Sect. B: Struct. Sci., 2006, 62, 826–842 CrossRef PubMed.
- A. Y. Likhacheva, S. V. Rashchenko and K. D. Litasov, J. Appl. Crystallogr., 2014, 47, 984–991 CrossRef CAS.
- A. Y. Likhacheva, S. V. Rashchenko, A. D. Chanyshev, T. M. Inerbaev, K. D. Litasov and D. S. Kilin, J. Chem. Phys., 2014, 140, 164508 CrossRef PubMed.
- C. R. Groom, I. J. Bruno, M. P. Lightfoot and S. C. Ward, Acta Crystallogr., Sect. B: Struct. Sci., Cryst. Eng. Mater., 2016, 72, 171–179 CrossRef CAS PubMed.
- P. Knuuttila and H. Knuuttila, Acta Chem. Scand., Ser. B, 1979, 33, 623–626 CrossRef.
- W. S. Sheldrick and M. Morr, Acta Crystallogr., Sect. B: Struct. Crystallogr. Cryst. Chem., 1981, 37, 733–734 CrossRef.
- L. M. Shkol'nikova, M. A. Porai-Koshits, N. M. Dyatlova, G. F. Yaroshenko, M. V. Rudomino and E. K. Kolova, Zh. Strukt. Khim., 1982, 23, 98–107 Search PubMed.
- H. Krawczyk and T. J. Bartczak, Phosphorus, Sulfur Silicon Relat. Elem., 1993, 82, 117–125 CrossRef CAS.
- R. O. Holanda, C. B. da Silva, D. L. M. Vasconcelos and P. T. C. Freire, Spectrochim. Acta, Part A, 2020, 242, 118745 CrossRef CAS PubMed.
- L. Merrill and W. A. Bassett, Rev. Sci. Instrum., 1974, 45, 290–294 CrossRef.
- S. A. Moggach, D. R. Allan, S. Parsons and J. E. Warren, J. Appl. Crystallogr., 2008, 41, 249–251 CrossRef CAS.
- S. Klotz, J. C. Chervin, P. Munsch and G. Le Marchand, J. Phys. D: Appl. Phys., 2009, 42, 075413 CrossRef.
- H. K. Mao, P. M. Bell, J. W. T. Shaner and D. J. Steinberg, J. Appl. Phys., 1978, 49, 3276–3283 CrossRef CAS.
- APEX4, Bruker AXS Inc., Madison, Wisconsin, USA, 2021.
- L. Krause, R. Herbst-Irmer, G. M. Sheldrick and D. Stalke, J. Appl. Crystallogr., 2015, 48, 3–10 CrossRef CAS PubMed.
- G. M. Sheldrick, Acta Crystallogr., Sect. A: Found. Adv., 2015, 71, 3–8 CrossRef PubMed.
- G. M. Sheldrick, Acta Crystallogr., Sect. C: Struct. Chem., 2015, 71, 3–8 Search PubMed.
- O. V. Dolomanov, L. J. Bourhis, R. J. Gildea, J. A. K. Howard and H. Puschmann, J. Appl. Crystallogr., 2009, 42, 339–341 CrossRef CAS.
- A. Thorn, B. Dittrich and G. M. Sheldrick, Acta Crystallogr., Sect. A: Found. Crystallogr., 2012, 68, 448–451 CrossRef CAS.
- C. F. Macrae, I. Sovago, S. J. Cottrell, P. T. A. Galek, P. McCabe, E. Pidcock, M. Platings, G. P. Shields, J. S. Stevens, M. Towler and P. A. Wood, J. Appl. Crystallogr., 2020, 53, 226–235 CrossRef CAS PubMed.
- H. Putz and K. Brandenburg, Diamond – Crystal and Molecular Structure Visualization, Crystal Impact, Bonn, Germany, 2020 Search PubMed.
- J. P. Perdew, K. Burke and M. Ernzerhof, Phys. Rev. Lett., 1996, 77, 3865–3868 CrossRef CAS PubMed.
- S. J. Clark, M. D. Segall, C. J. Pickard, P. J. Hasnip, M. I. J. Probert, K. Refson and M. C. Payne, Z. Kristallogr. - Cryst. Mater., 2005, 220, 567–570 CrossRef CAS.
- C. J. G. Wilson, T. Cervenka, P. A. Wood and S. Parsons, Cryst. Growth Des., 2022, 22, 2328–2341 CrossRef CAS PubMed.
- A. Gavezzotti, Molecular Aggregation, Oxford University Press, Oxford, UK, 2007 Search PubMed.
- A. Gavezzotti, Z. Kristallogr. – Cryst. Mater., 2005, 220, 499–510 CrossRef CAS.
- A. Gavezzotti, New J. Chem., 2011, 35, 1360–1368 RSC.
- M. G. Reeves, P. A. Wood and S. Parsons, J. Appl. Crystallogr., 2020, 53, 1154–1162 CrossRef CAS PubMed.
- M. J. Frisch, G. W. Trucks, H. B. Schlegel, G. E. Scuseria, M. A. Robb, J. R. Cheeseman, G. Scalmani, V. Barone, B. Mennucci, G. A. Petersson, H. Nakatsuji, M. Caricato, X. Li, H. P. Hratchian, A. F. Izmaylov, J. Bloino, G. Zheng, J. L. Sonnenberg, M. Hada, M. Ehara, K. Toyota, R. Fukuda, J. Hasegawa, M. Ishida, T. Nakajima, Y. Honda, O. Kitao, H. Nakai, T. Vreven, J. A. Montgomery Jr., J. E. Peralta, F. Ogliaro, M. Bearpark, J. J. Heyd, E. Brothers, K. N. Kudin, V. N. Staroverov, R. Kobayashi, J. Normand, K. Raghavachari, A. Rendell, J. C. Burant, S. S. Iyengar, J. Tomasi, M. Cossi, N. Rega, J. M. Millam, M. Klene, J. E. Knox, J. B. Cross, V. Bakken, C. Adamo, J. Jaramillo, R. Gomperts, R. E. Stratmann, O. Yazyev, A. J. Austin, R. Cammi, C. Pomelli, J. W. Ochterski, R. L. Martin, K. Morokuma, V. G. Zakrzewski, G. A. Voth, P. Salvador, J. J. Dannenberg, S. Dapprich, A. D. Daniels, Ö. Farkas, J. B. Foresman, J. V. Ortiz, J. Cioslowski and D. J. Fox, Gaussian Inc., Wallingford CT, 2016.
- S. A. Moggach, S. Parsons and P. A. Wood, Crystallogr. Rev., 2008, 14, 143–184 CrossRef CAS.
- M. J. Bryant, A. G. P. Maloney and R. A. Sykes, CrystEngComm, 2018, 20, 2698–2704 RSC.
- G. Novelli, H. E. Maynard-Casely, G. J. McIntyre, M. R. Warren and S. Parsons, Cryst. Growth Des., 2020, 20, 7788–7804 CrossRef CAS.
- S. A. Moggach, W. G. Marshall, D. M. Rogers and S. Parsons, CrystEngComm, 2015, 17, 5315–5328 RSC.
- J. Gonzalez-Platas, M. Alvaro, F. Nestola and R. Angel, J. Appl. Crystallogr., 2016, 49, 1377–1382 CrossRef CAS.
- N. P. Funnell, A. Dawson, D. Francis, A. R. Lennie, W. G. Marshall, S. A. Moggach, J. E. Warren and S. Parsons, CrystEngComm, 2010, 12, 2573–2583 RSC.
- Y. Ohashi and C. W. Burnham, Am. Mineral., 1973, 58, 843–849 CAS.
- R. M. Hazen and L. W. Finger, Comparative Crystal Chemistry, John Wiley & Sons, 1982 Search PubMed.
- E. T. Broadhurst, C. J. G. Wilson, G. A. Zissimou, F. Nudelman, C. P. Constantinides, P. A. Koutentis and S. Parsons, Acta Crystallogr., Sect. B: Struct. Sci., Cryst. Eng. Mater., 2022, 78, 107–116 CrossRef CAS PubMed.
- N. P. Funnell, D. R. Allan, A. G. P. Maloney, R. I. Smith, C. J. G. Wilson and S. Parsons, CrystEngComm, 2021, 23, 769–776 RSC.
Footnotes |
| † Dedicated to Paul R. Raithby, celebrating a career in inorganic and organometallic chemistry, on the occasion of his 70th birthday. |
| ‡ Electronic supplementary information (ESI) available. CCDC 2223284–2223299, geometry-optimised structures in cif format, description of occupied volume calculations, crystal structure refinement statistics, strain tensor principal values at each pressure point, supplementary figures referred to in the text. For ESI and crystallographic data in CIF or other electronic format see DOI: https://doi.org/10.1039/d2ce01616h |
| This journal is © The Royal Society of Chemistry 2023 |


