Development of lipidated polycarbonates with broad-spectrum antimicrobial activity†
Ruixuan
Gao
,
Xuming
Li
,
Menglin
Xue
,
Ning
Shen
,
Minghui
Wang
,
Jingyao
Zhang
,
Chuanhai
Cao
and
Jianfeng
Cai
 *
*
Department of Chemistry, University of South Florida, Tampa, FL 33620, USA. E-mail: jianfengcai@usf.edu
First published on 10th January 2023
Abstract
Antimicrobial resistance is a global challenge owing to the lack of discovering effective antibiotic agents. Antimicrobial polymers containing the cationic groups and hydrophobic groups which mimic natural host-defense peptides (HDPs) show great promise in combating bacteria. Herein, we report the synthesis of lipidated polycarbonates bearing primary amino groups and hydrophobic moieties (including both the terminal long alkyl chain and hydrophobic groups in the sequences) by ring-opening polymerization. The hydrophobic/hydrophilic group ratios were adjusted deliberately and the lengths of the alkyl chains at the end of the polymers were modified to achieve the optimized combination for the lead polymers, which exhibited potent and broad-spectrum bactericidal activity against a panel of Gram-positive and Gram-negative bacteria. The polymers only showed very limited hemolytic activity, demonstrating their excellent selectivity. Comprehensive analyses using biochemical and biophysical assays revealed the strong interaction between the polymers and bacteria membranes. Moreover, the polymers also showed strong biofilm inhibition activity and did not readily induce antibiotic resistance. Our results suggest that lipidated polycarbonates could be a new class of antimicrobial agents.
Introduction
Antibiotic resistant bacterial infection has become a heavy burden for public health for a long period of time. According to CDC's report, more than 2.8 million people get infected by antibiotic-resistant pathogens in the United States each year,1 leading to more than 35![[thin space (1/6-em)]](https://www.rsc.org/images/entities/char_2009.gif) 000 annual deaths. With the scarcity of new antibiotics approved for clinical use, bacterial resistance continues to rise.2,3 As the COVID pandemic is still wreaking havoc on the world, scientists have already noted the threat of secondary bacterial infection in COVID-19 patients, urging the discovery of new antimicrobial compounds.4–6
000 annual deaths. With the scarcity of new antibiotics approved for clinical use, bacterial resistance continues to rise.2,3 As the COVID pandemic is still wreaking havoc on the world, scientists have already noted the threat of secondary bacterial infection in COVID-19 patients, urging the discovery of new antimicrobial compounds.4–6
Antimicrobial peptides (AMPs), also known as host-defense peptides (HDPs), were first described in the 1960s, and have now been discovered in a diverse range of natural organisms.7 HDPs are short, amphipathic, mostly cationic peptides with broad-spectrum antimicrobial activities.7,8 They mediate bacteria killing mainly via membrane interaction and subsequently lysing the cell, which generally involves three steps called attraction, attachment and peptide insertion.9 The selectivity of HDPs for bacteria is attributed to the negatively charged feature of the outer leaflet of bacterial membranes.9 Several models have been proposed to rationalize the mechanism of membrane disruption, including barrel-stave, carpet, and toroidal pore models.10 Besides the interaction with bacterial membranes, some HDPs are believed to kill bacteria by additionally targeting essential cellular processes.11 Due to the synergy of multiple mechanisms of action occurring in HDPs, they are believed to have lower probability of developing antibiotic resistance. Despite the considerable achievement, their intrinsic susceptibility to proteolytic degradation, limited antimicrobial activity and high cost in production hampered their practical antimicrobial application.
Polymer chemists harnessed the characteristics of the HDPs for the development of polymeric disinfectants. Compared with HDPs, antimicrobial polymers (APs) are much less expensive, relatively easier to synthesize in large scale, and straightforward to modify with different side chains.12 The APs commonly contain cationic and hydrophobic groups,13–15 analogous to HDPs. However, it is quite interesting that APs with random cationic and hydrophobic groups generally display more potent and more selective activity than block APs bearing defined segments of hydrophobic and cationic regions. For the choice of cationic groups, guanidinium groups,16,17 quaternary ammonium salts,18–20 biguanide groups,21 primary amine groups22,23 have been widely used. On the other hand, hydrophobic groups are also critical since hydrophobicity can significantly impact the antimicrobial activity and toxicity.24,25 Furthermore, the activity of APs can be altered by changing the length of alkyl chains which can be rationalized from aspects of conformation and hydrophobicity.26 Zhou and co-workers synthesized polyhexamethylene guanidine hydrochloride and its analogs with reduced and increased alkyl chain length of the repeat unit. They noticed that with longer alkyl chain, the antibacterial activity was better.27 Similarly, Eren and co-workers synthesized quaternary pyridinium functionalized polynorbornes with different alkyl substituents. They observed an increasing trend in antibacterial activity as well as cytotoxicity with longer alkyl chains.28 Moreover, Dr Locock and co-workers studied the effects of end groups on both sides of the polymethacrylates.29 For polymethacrylates bearing primary amine or guanidine group, they noticed that the longer alkyl end group showed better activities against Gram-positive strains and fungi.
However, it should be noted that there's no approach of “one size fits all” for developing antimicrobial polymers. Nonetheless, it is commonly accepted that the antibacterial activity can be affected by: (1) molecular weight; (2) the balance of amphiphilicity; (3) the nature of hydrophilic and hydrophobic groups; (4) counter ions.26,30–32 Our previous work has shown that polycarbonates bearing primary amino groups are a class of effective antimicrobial agents, however, the polymers only exhibited antibacterial activity toward Gram-positive bacteria.33 As such, we decided to investigate the influence of the alkyl chain at the end of the polymer, in the hope of identifying antimicrobial polycarbonates with broader-spectrum activity, as the long alkyl chain could enhance the antimicrobial activity by sticking the molecules onto the membranes of bacteria. Herein, we reported the synthesis of a series of lipidated polymers with different ratios of hydrophobic/hydrophilic groups. These polymers exhibited broad-spectrum antibacterial activity against both Gram-positive and Gram-negative bacteria. In addition, the length of the alkyl group was found to significantly impact the antimicrobial activity, revealing C14 and C16 tails to be the optimal lengths for achieving the most potent antimicrobial activity. These polymers also show excellent selectivity for bacteria as they generally exhibited neglectable hemolytic activity. A range of mechanistic studies demonstrated that these polymers killed bacterial pathogens by disrupting bacterial membranes, the mechanism akin to that of HDPs.
Results and discussion
Polymer synthesis and characterization
The polymers were synthesized following the previously reported procedure (Scheme 1),33 and were characterized by 1H NMR and MALDI. Typically, the 1H NMR could help to determine the ratio of M1 (repeating unit of hydrophobic group) and M2 (repeating unit of hydrophilic group). In addition, by utilizing MALDI, the accomplishment of polymerization could be assessed by calculating the gap between masses of polymers. As shown in Fig. S2,† the differences between two nearby mass signals match the molecular weight of either M1 or M2, which demonstrates the success of polymer synthesis. Moreover, the expected m/z was able to be observed from the MALDI spectrum (Fig. S3†).We started with the synthesis of homopolymers P1–P4 which contained just cationic groups without any hydrophobic groups using the C16 hexadecanol as the initiator. The C16 tail was chosen because it was previously demonstrated with the best activity for lipidated antimicrobial agents.34,35 The antibacterial activities of synthesized polymers were first probed against two representative bacteria, Gram-positive bacteria MRSA and Gram-negative bacteria E. coli. Although P1 did not show any antimicrobial activity under the tested condition, P2 and P3, with 10 and 15 equiv. of M2 respectively, showed activities against both MRSA and E. coli. This initial exploration suggested that lipidation did endow the polymers with broad-spectrum activity, as our previously developed polycarbonates not bearing long alkyl tails did not exhibit antimicrobial activity toward Gram-negative bacteria (Table 1, P29). Interestingly, after we increased the M2 to 20 equiv., the activity sharply dropped, suggesting that there is an optimal length of polymers in order to make them antimicrobial agents.
| Polymer | Initiator | M1 (m equiv.) | M2 (n equiv.) | Expected molecular weight (g mol−1) | MIC (μg mL−1) | |
|---|---|---|---|---|---|---|
| MRSAa | E. coli | |||||
| a MRSA: Methicillin-resistant Staphylococcus aureus (ATCC 33591). b E. coli : Escherichia coli (ATCC 25922). c NA: no activity. | ||||||
| P1 | 1-Hexadecanol | 0 | 5 | 1258.39 | >250 | 125–250 |
| P2 | 1-Hexadecanol | 0 | 10 | 2274.34 | 62.5–125 | 125–250 |
| P3 | 1-Hexadecanol | 0 | 15 | 3290.29 | 15.62–31.25 | 31.25–62.5 |
| P4 | 1-Hexadecanol | 0 | 20 | 4306.24 | >250 | >250 |
| P5 | 1-Hexadecanol | 2 | 10 | 2774.84 | 62.5–125 | 62.5–125 |
| P6 | 1-Hexadecanol | 4 | 10 | 3275.34 | 31.25–62.5 | 31.25–62.5 |
| P7 | 1-Hexadecanol | 5 | 10 | 3525.59 | 31.25–62.5 | 15.62–31.25 |
| P8 | 1-Hexadecanol | 10 | 10 | 4776.84 | 62.5–125 | 7.81–15.62 |
| P9 | 1-Hexadecanol | 5 | 15 | 4541.54 | 31.25–62.5 | 15.62–31.25 |
| P10 | 1-Hexadecanol | 10 | 15 | 5792.79 | 125–250 | 15.62–31.25 |
| P11 | 1-Hexadecanol | 15 | 15 | 7044.04 | 62.5–125 | 3.9–7.8 |
| P12 | 1-Hexadecanol | 5 | 20 | 5557.49 | >250 | >250 |
| P13 | 1-Hexadecanol | 20 | 20 | 9311.24 | 125–250 | 7.81–15.62 |
| P14 | 1-Octanol | 0 | 15 | 3178.06 | >250 | >250 |
| P15 | 1-Octanol | 5 | 15 | 4429.31 | 62.5–125 | 7.81–15.62 |
| P16 | 1-Dodecanol | 0 | 15 | 3234.18 | >250 | >250 |
| P17 | 1-Dodecanol | 5 | 15 | 4485.43 | >250 | >250 |
| P18 | 1-Tetradecanol | 5 | 10 | 3497.54 | 31.25–62.5 | 15.62–31.25 |
| P19 | 1-Tetradecanol | 0 | 15 | 3262.24 | 62.5–125 | 62.5–125 |
| P20 | 1-Tetradecanol | 5 | 15 | 4513.49 | 15.62–31.25 | 15.62–31.25 |
| P21 | 1-Tetradecanol | 15 | 15 | 7015.99 | 125–250 | 31.25–62.5 |
| P22 | 1-Tetradecanol | 20 | 20 | 9283.19 | 62.5–125 | 3.9–7.81 |
| P23 | 1-Octadecanol | 0 | 10 | 2302.39 | 62.5–125 | 125–250 |
| P24 | 1-Octadecanol | 5 | 10 | 3553.64 | 125–250 | 15.62–31.25 |
| P25 | 1-Octadecanol | 0 | 15 | 3318.34 | >250 | >250 |
| P26 | 1-Octadecanol | 5 | 15 | 4569.59 | 62.5–125 | 31.25–62.5 |
| P27 | 1-Octadecanol | 15 | 15 | 7072.09 | 125–250 | 7.81–15.62 |
| P28 | 1-Octadecanol | 20 | 20 | 9339.29 | 125–250 | 7.81–15.62 |
| P29 33 | Benzyl alcohol | 10 | 10 | 4642.54 | 10 | NAc |
The antimicrobial activities for the HDPs rely on the interaction with the bacteria membrane, which can be affected by both cationic and hydrophobic groups.36–38 By cautiously increasing the amount of M1, the ratio of hydrophobicity/hydrophilicity could be easily tuned. To this end we kept cationic groups constant (10 equiv.), and included 2 equiv., 4 equiv., 5 equiv., and 10 equiv. of M1 to synthesize random block polymers. Compared with homopolymer P2, the addition of M1 steadily improved the activities. For P7, the MIC against MRSA was 31.25–62.5 μg mL−1 and 15.62–31.25 μg mL−1 against E. coli, which increased 2-fold and 4-fold, respectively. However, this trend dissipated after the addition of 5 equiv. M1, when 10 equiv. M1 and 10 equiv. M2 were included to produce P8, whose activity against MRSA decreased and the activity against E. coli slightly increased. Similarly, for P9, P10 and P11 in which the amount of M2 is constant (M2 = 15), the addition of 5 equiv. M1 (P9) showed the best activity toward MRSA, however, P11 revealed a better activity toward E. coli. Consistent with the activity trend observed for P1–P4, P12 and P13 exhibited inferior activities against both Gram-positive and Gram-negative strains when M2 = 20, again supporting the speculation that the optimal number of M2 is 10 or 15. As aforementioned, the length of the alkyl group on the termini could significantly impact the activity of antimicrobial agents.39,40 As such, we used different linear alcohol as initiators to obtain polymers bearing alkyl chains of various lengths. Interestingly, initiators using octanol (C8) and dodecanol (C12) led to weakened activity (P14–P17) compared with P3, whereas polymers bearing C14 tails (P18–P22) generally demonstrated comparable or better activity than their counterparts containing C16 tails. Among them, P20 revealed the optimal and balanced activity against both MSRA and E. coli with MICs of 15.62–31.25 μg mL−1 for both strains. Intriguingly, octadecanol (C18) as the initiator led to the polymers with reduced activity (P23–P28), suggesting that the optimal initiator is tetradecanol (C14). Similar to P13, we also noticed that with 20 equiv. M1 and 20 equiv. M2, the polymers P22 and P28 showed more selective activity against Gram-negative bacterium E. coli. We assumed that with higher amount of M2, the positively charged amino groups have higher binding affinity with the more negatively charged E. coli cell wall.41 This finding may direct the design of antimicrobial agents with specific activity for Gram-negative bacteria in the future.
Taken together, modifying the ratio of hydrophobic/hydrophilic group could manipulate the antibacterial activity of the polymers. With 5 equiv. hydrophobic unit and 10 or 15 equiv. hydrophilic unit, the polymer showed outstanding activity against both MRSA and E. coli. Moreover, the activity of the polymer could be further tuned by adjusting the lengths of the alkyl chains at the end of the polymers. Polymers with C14 or C16 tail showed superior activity compared with the ones with C8, C12 and C18 tails.
To assess whether the polymers exhibit broad-spectrum activity or not, we went ahead and tested the MICs against four other strains for the lead polymers. As shown in Table 2, all six chosen polymers could inhibit the bacteria growth at concentration lower than 62.5 μg mL−1. MICs against different Gram-positive bacteria are similar, as well as the MICs against different Gram-negative bacteria.
| Polymer | MIC (μg mL−1) | HC50 (μg mL−1) | Selective indexa | ||||||
|---|---|---|---|---|---|---|---|---|---|
| G+ | G− | ||||||||
| MRSA | MRSEb | E. F. | E. coli | K. P. | P. A. | MRSA | E. coli | ||
| a Selective index was calculated by HC50/MIC. b MRSE: Methicillin-resistant Staphylococcus epidermidis (RP62A). c E. F.: Enterococcus faecalis (ATCC 700802). d K. P.: Klebsiella pneumoniae (ATCC 13383). e P. A.: Pseudomonas aeruginosa (ATCC 27853). | |||||||||
| P3 | 20–30 | 20–30 | 50–60 | 30–40 | 30–40 | 50–60 | 454.75 | 15.16 | 11.37 |
| P6 | 40–50 | 120–130 | 120–130 | 30–40 | 100–110 | 120–130 | 970.55 | 19.41 | 24.26 |
| P7 | 40–50 | 40–50 | 80–90 | 15–20 | 30–40 | 90–100 | 294.95 | 5.90 | 14.75 |
| P9 | 30–40 | 30–40 | 60–70 | 20–30 | 20–30 | 30–40 | 728.12 | 18.20 | 24.27 |
| P18 | 30–40 | 30–40 | 100–110 | 15–20 | 15–20 | 50–60 | 126.49 | 3.16 | 6.32 |
| P20 | 20–30 | 20–30 | 40–50 | 15–20 | 20–30 | 30–40 | 283.73 | 9.46 | 14.19 |
Hemolytic activity
Hemolysis is an important assessment for the polymer's safety. The polymers were expected to specifically bind to the bacteria cell, however, with the increment of the hydrophobic components, the polymer may non-specifically bind with blood cells causing the irreversible rupture of blood cell membrane.42,43 The hemolytic activities were measured with mouse red blood cells and the HC50 values were calculated and given in Table 2. Most of the polymers show decent selectivity toward MRSA and E. coli with selective indexes higher than 10. P6 and P9 exhibited the lowest hemolysis activity with HC50s of 971 μg mL−1 and 728 μg mL−1, which in the large excess of the MICs. P3 and P20 had slightly higher toxicity to the blood cells, however, the selective indexes are still higher than 10, indicating they also exhibited higher preferences toward bacteria. Unfortunately, P7 and P18 had selective indexes only at around 10 or even lower than 10, which may be due to their higher hydrophobicity.Killing efficiency evaluation
The bactericidal activity for the most potent polymer P20 were then determined by performing MBC test. MBC is the minimum concentration of the tested polymer which kills the microorganism.7 The result (Table 3) showed that the MBC values for P20 were 62.5 μg mL−1 against MRSA (2× MIC), 31.25 μg mL−1 against E. coli (1× MIC), 62.5μg mL−1 against MRSE (2× MIC), 62.5 μg mL−1 against E. F. (1× MIC), 62.5 μg mL−1 against K. P. (2× MIC). P. A. has been shown to have a higher level of resistance (4× MIC) as it is a notorious strain to kill, and the outer membrane permeability of P. A. is about 12- to 100- fold lower than that of E. coli.44 Overall, the close similarity of MICs and MBCs suggested that these lipidated polymers inhibited bacterial growth via the bactericidal mechanism rather than bacteriostatic mechanism.| Polymer | MRSA | E. coli | MRSE | E. F. | K. P. | P. A. |
|---|---|---|---|---|---|---|
| P20 | 62.5 | 31.25 | 62.5 | 62.5 | 62.5 | 250 |
Next, the time-kill experiment was performed to evaluate the killing efficiency of P20. As shown in Fig. 1A, MRSA could be fully eradicated within 2 hours when we used 8× and 4× MIC. The number of bacteria dropped significantly after two-hour treatment when 2× and 1× MIC were used, which is similar to the killing efficiency against MRSE (Fig. 1C) and P. A. (Fig. 1F). The killing rate against E. coli is somewhat faster (Fig. 1B), as the bacteria could be eradicated within 1 hour after being treated with 8× and 4× MIC. Even with 2× MIC, the bacteria could also be killed within 2 hours, which is similar with the bactericidal effect against K. P. (Fig. 1E). The bactericidal activity was low against E. F. within 2 h of incubation time, and we could only observe the eradication of bacteria after treatment with 8× MIC (Fig. 1D), which may suggest that the killing efficiency against E. F. is slower compared with other strains.
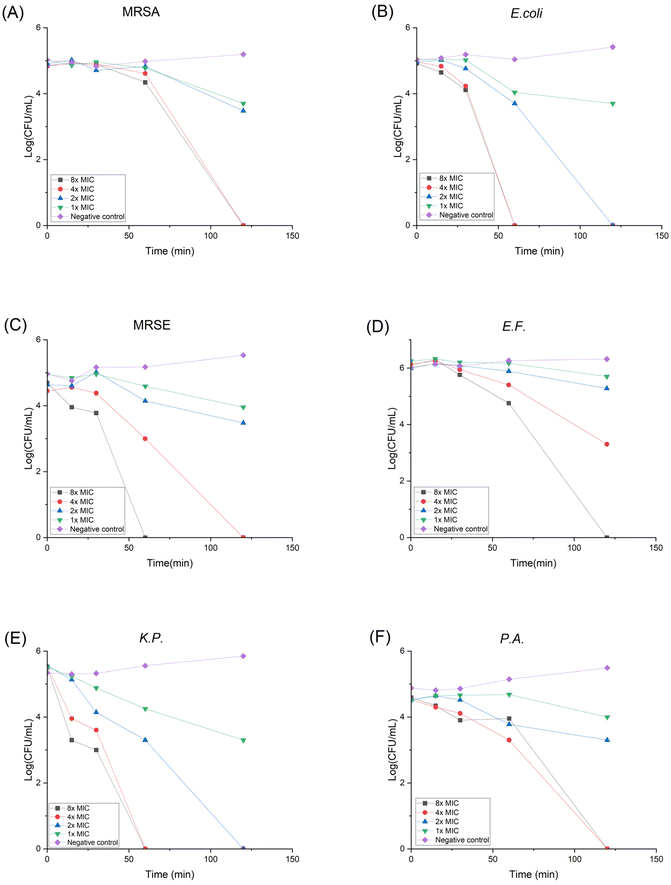 | ||
| Fig. 1 Time kill curve for P20 against different strains. Colony forming unit (CFU) for different strains after co-cultured with P20 for 0, 15, 30, 60, 120 min. | ||
Drug resistance development
When treated with antibiotics, bacteria can gain resistance with three different strategies: (1) lower the drug concentration via efflux pump; (2) destruct the antibiotic; (3) modify or camouflage the drug target.45 It is believed that HDP's non-specific membrane disruption mechanism can lower the possibility of resistance formation. Yet it has been reported that Staphylococcus aureus can modulate the cell wall to reduce the negative charge on its surface, thus lowering the susceptibility to cationic HDPs.46 In order to assess the propensity of bacteria to develop resistance against P20, we conducted the in vitro drug resistance test using MRSA and E. coli as representative bacteria for 14 generations. As shown in Fig. 2, even though the bacteria were repeatedly exposed to P20, the MICs didn't change, indicating no resistance was developed during the treatment. However, the MIC for Ciprofloxacin (CIP) against MRSA started to increase at 9th generation, and the MIC against E. coli increased at 12th generation. Moreover, the MICs against MRSA and E. coli increased 32-fold and 16-fold at the 14th generation with the treatment of CIP, respectively. The overall result demonstrates our polymer shows no likelihood of developing resistance compared with the traditional antibiotics.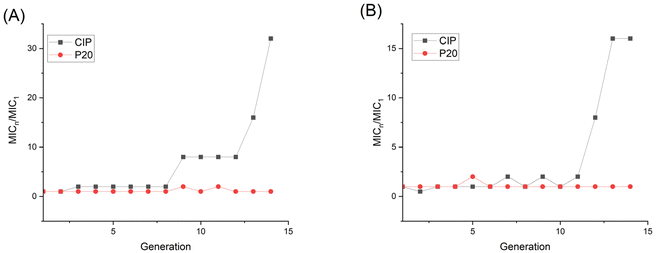 | ||
| Fig. 2 Drug resistance development curve for P20 against (A) MRSA and (B) E. coli. Bacteria were treated with compounds repetitively for 14 generations and the MIC change was plotted. | ||
Microscopy observation
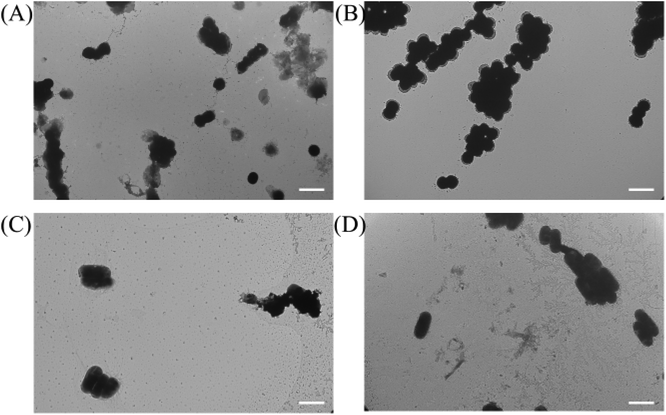
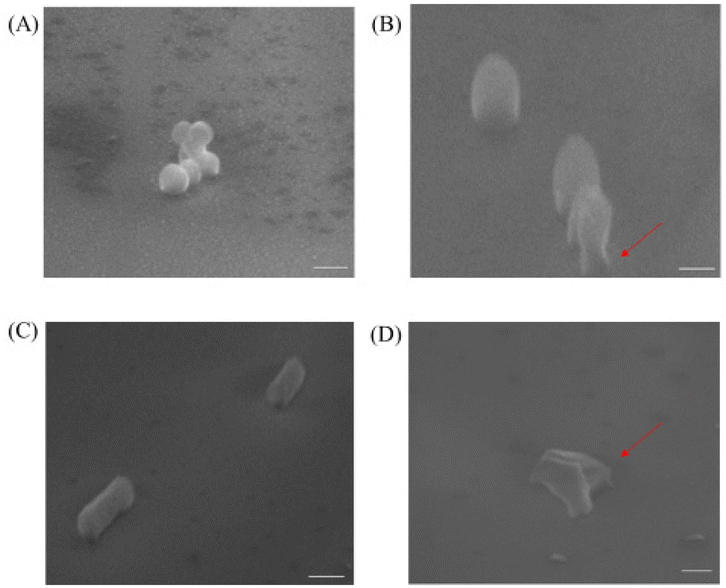
To investigate the mechanism of action for our polymers, we first used the transmission electron microscope (TEM) and scanning electron microscope (SEM) to visualize the effects of our polymer on microbial cells, the confocal microscope was also used to further examine the antibacterial mechanism. As shown in Fig. 3B and D, untreated cells were well-shaped with smooth and intact cell walls. By contrast, after the two-hour treatment, the morphology changes can be clearly seen in Fig. 3A and C. Some bacteria cell walls were destroyed, and the cytoplasmic contents were leaking out of the cells, which caused the destruction of the cells.Similar to the TEM result, we noticed that the non-treated MRSA looked round and undamaged (Fig. 4A). However, after the treatment with P20 for 2 h, the bacteria cell membrane was damaged (Fig. 4B) and they exhibited the oval shape morphologies. As for E. coli, the non-treated bacteria were rod-shaped bacteria (Fig. 4C), whereas the 2 h treatment caused the dramatic shape change(Fig. 4D). The result provides further evidence for the membrane disruption mechanism for P20.
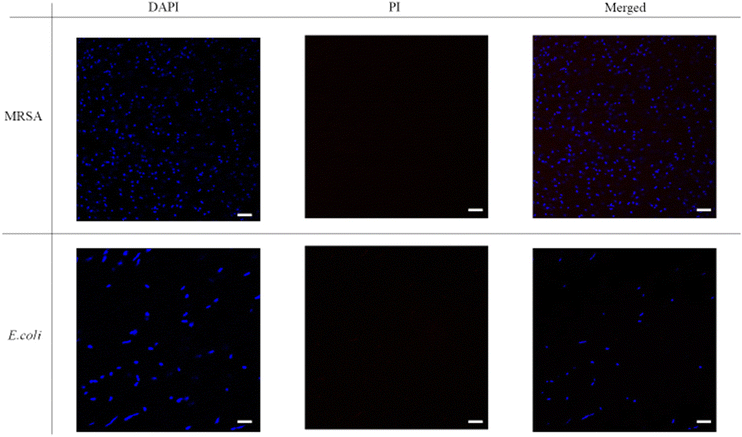
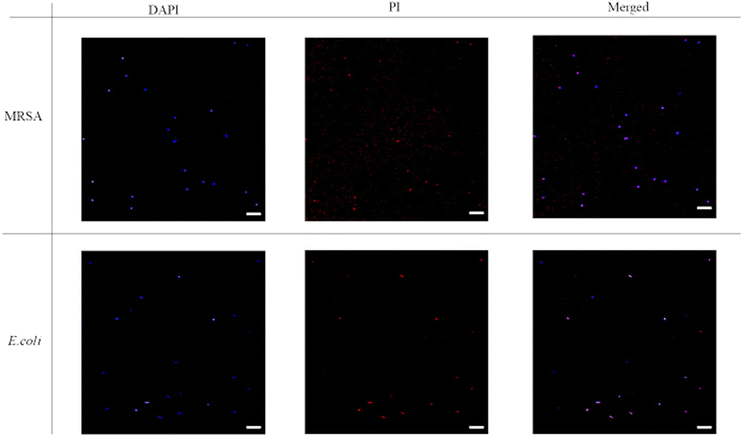
The fluorescence images were then taken with DAPI-PI staining. 4′6′-diamidino-2-phenylindole (DAPI) is a commonly used DNA probe and propidium iodide (PI) can be treated as a dead cell indicator since it can only permeate cells with damaged membrane. From Fig. 5, the untreated bacteria only showed blue fluorescence signal in DAPI channel, and the red fluorescence couldn't be noticed from the PI channel. Thus, in the merged images only blue dots were shown. However, after incubation with P20 for two hours (Fig. 6), most bacteria showed red fluorescence in the PI channel. The merge of two channels (DAPI and PI) led to violet spots which proved the cell membrane lysis of the bacteria. The microscopic studies suggested these lipidated polymers caused bacteria death via the membrane disruption mechanism which is similar to the mechanism of antimicrobial peptides.
Membrane depolarization and permeabilization
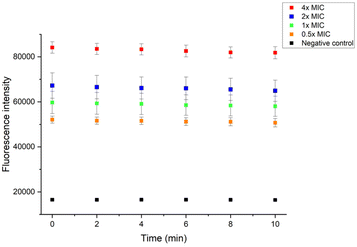
To get further insight into the membrane interaction of our polymer, membrane depolarization, as well as inner and outer membrane permeability tests, were performed. The membrane potential sensitive dye 3,3′-dipropylthiadicarbocyanine iodide (DiSC3(5)) was employed to study the polymer's ability to depolarize the bacterial membrane. DiSC3(5) can enter healthy cytoplasmic membrane and show weak fluorescence due to self-quenching. Once the membrane is disrupted, DiSC3(5) is released into the medium, and the fluorescence intensity will increase correspondingly.47 As shown in Fig. 7A, the fluorescence intensity burst instantaneously after the addition of 1×, 2×, 4×, 8× P20, indicating the MRSA membrane potential lost rapidly.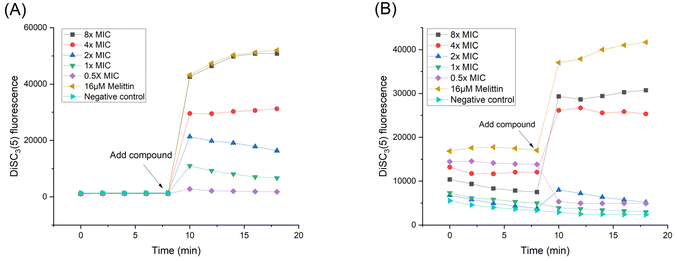 | ||
| Fig. 7 Fluorescence intensity changes of DiSC3(5) in (A) MRSA and (B) E. coli. P20 was added at 8 min. | ||
The fluorescence intensity also increased dramatically after we added 8× MIC and 4× MIC of P20 to E. coli at 8 min, demonstrating the compromisation of E. coli cell membrane after the contact with P20.
Gram-positive and Gram-negative bacteria membranes are substantially different. Gram-negative bacteria have outer membrane (OM) which Gram-positive bacteria don't. The OM is a lipid bilayer that contains phospholipids in the inner leaflet and glycolipids in the outer leaflet.48 When the outer membrane got destroyed, 1-N-phenylnaphthylamine (NPN) contacts with lipidic environment leading to increased fluorescence.49 After exposure to 4× MIC and 2× MIC of P20 for 10 min, the fluorescence intensity increased 5-fold and 4-fold in the presence of NPN, respectively (Fig. 8), indicating the permeabilization of the bacteria OM by P20. With the lower concentrations, the fluorescence intensity exhibited a noticeable increase, albeit less than higher concentrations, suggesting the degree of damage of OM is in a dose-dependent manner.
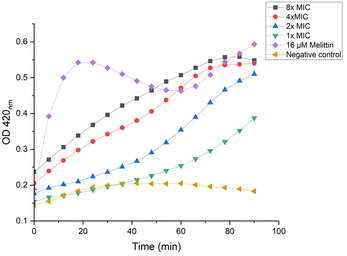
ortho-Nitrophenyl-β-galactoside (ONPG) is a colorless lactose analog and can be hydrolyzed by β-galactosidase to release galactose and yellow compound ortho-nitrophenol, which can be detected with plate reader at OD 420.50 As shown in Fig. 9, when lower concentrations were used (1× and 2× MIC), P20 induced the inner membrane permeability after a lagging time of about 50 min. The increase of OD value was almost immediately detected when higher concentrations were used (8× and 4× MIC), demonstrating the inner membrane was destructed.
Collectively, the findings of both membrane depolarization and permeabilization experiments were in good agreement to suggest that our polymers disintegrate the bacteria membrane rapidly in a dose-dependent manner. The rapid membrane interaction could be observed with higher concentrations (8× and 4× MIC), whereas the lower concentrations displayed a slower but still adequate interaction.
Biofilm inhibition
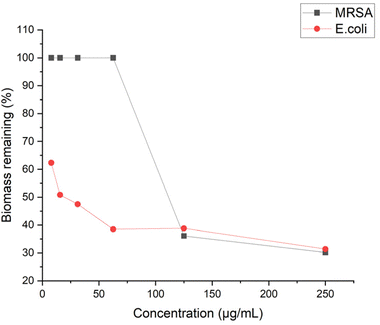
The anti-biofilm activity of antibiotic agents should also be taken into consideration to evaluate their effectiveness. Biofilm is a multilayered cluster of cells that can shell the bacteria cells and help bacteria gain resistance to antibiotics.51 To this end, we examined the antibiofilm ability of P20 by quantifying the biomass with crystal violet staining. P20 didn't show significant inhibition to MRSA biofilm at low concentration, and a reduction of 64% biofilm was started to be observed at 4× MIC (Fig. 10). However, P20 limited the E. coli biofilm at sub-MIC concentrations, 50% and 38% of biofilm formation was reduced at 1/2 MIC and 1/4 MIC, respectively. At a higher concentration, only 30% biofilm remained after the exposure to 8× MIC of P20 for both strains. Biofilm formation generally involves three steps: adhesion, accumulation and detachment.52 We believe that the excellent biofilm inhibition ability is in line with its higher bactericidal efficiency. Based on our time-kill and MBC results, the bactericidal effect against E. coli could be achieved at a lower concentration within less time, indicating fewer bacteria can survive and adhere to the surface at the same exposure time.Conclusion
In conclusion, we have designed and synthesized a class of lipidated polycarbonates with different amphiphilicity which could eradicate bacteria via membrane disruption. These polymers demonstrated effective and broad-spectrum activity against both Gram-positive and Gram-negative bacteria, which is unlike our previous generation of polycarbonate polymers which are only active toward Gram-positive bacteria.33 We believe the enhancement of the activity is due to the introduction of alkyl chains at the end of the polycarbonates using different linear alcohols as initiators. It seemed that the optimal antimicrobial activity could be achieved with C14 and C16 tails, whereas other shorter or longer tails deteriorated antimicrobial activity. In addition, the antimicrobial activity of polymers could be further tuned by varying the ratio of hydrophobic/cationic units. The optimization led to the representative polymer P20 that showed fast bactericidal effect and low hemolytic activity toward blood cells. The ability of the polymers to rapidly compromise both outer and inner membranes, and their low probability to induce antibiotic resistance, rendered lipidated polycarbonates a new class of biomaterials for antimicrobial application.Materials and methods
Solvents and reagents were purchased from either Sigma-Aldrich or Fisher Scientific and used directly. Flash chromatography was carried out with silica gel (200–300 mesh). The final products were dried on a Labcono lyophilizer. The NMR spectra were obtained on Bruker Advance NEO-600 MHz. The MALDI spectra were obtained on Bruker UltraFlextreme MALDI-TOF/TOF. Biotek Synergy HT microtiter plate reader was used in antimicrobial assays. MRSA and E. coli cells were purchased from ATCC®. The mouse red blood cells were kindly provided by the coauthor Prof. Chuanhai Cao (College of Pharmacy, University of South Florida).Monomer synthesis
The monomers were synthesized using the same method reported previously.33 Briefly, 5-methyl-2-oxo-1,3-dioxane-5-carbonyl chloride (MDC) and M1 were prepared following the protocol reported by Yang and Hedrick.53 To prepare M2, MDC (8.28 g, 46 mmol) was then dissolved in 30 mL DCM and added dropwise to the solution of Boc-protected ethanolamine (5 g, 31 mmol) and TEA (6.48 mL, 46 mmol). After overnight reaction, the mixture was washed with HCl, water and brine sequentially. The solution was then dried with sodium sulfate and concentrated under vacuum. The crude product was purified by column chromatography to give the final product M2 (5.83 g, 19 mmol, 62%).Polymer synthesis
Synthesis for random-block polymer P20 is shown here as an example. In a 50 mL round bottom flask filled with N2, M1(5 equiv., 0.0583 g, 0.23 mmol), M2(15 equiv., 0.212 g, 0.70 mmol), 1-tetradecanol (1 equiv., 0.01 g, 0.047 mmol) were added to 10 mL anhydrous DCM. The catalysts 1-(3,4-bis(trifluoromethyl)-phenyl)-3-cyclohexyl-2-thiourea (TU, 1 equiv., 0.0173 g, 0.047 mmol) and 1-8-diazabicyclo[5.4.0]undec-7-ene(DBU,1 equiv., 0.0071 g, 0.047 mmol) were then added. After 24-hour reaction under nitrogen protection, benzoic acid (2 equiv., 0.0114 g, 0.093 mmol) was added to quench the reaction for 4 hours and the reaction mixture was concentrated under vacuum. The resulting polymer was dissolved in THF and precipitated out by dropwise addition of cold hexane, and the precipitation was repeated for three times. The Boc-protecting group was removed by adding 50% (v/v) TFA in 5 mL DCM for 2 h. The solvent was removed by vacuum and the polymer was dissolved in methanol and precipitated again in cold diethyl ether for three times. In the end, the precipitated polymer was dissolved in water, lyophilized to give the final polymer as the puffy white solid which was characterized by 1H NMR and MALDI. Other polymers were prepared in the similar fashion (ESI†).P20: 1H NMR (600 MHz, D2O): δ 7.43 (m, 42.26 H, –Ph), 5.23 (s, 18.14 H, –CH2–Ph), 4.36 (m, 176.78 H, –O–CH2– on backbone), 3.77, 3.36 (m, 93.44 H, –O–CH2–CH2– on M2 sidechain), 2.41, (t, 2H, –O–CH2– from end group), 1.26 (s, 142.36 H, –CH3).
MIC test
Minimal inhibition concentration (MIC) was tested with broth dilution method in the 96-well plate referring to CLSI guidelines.54 Six different strains were used for MIC test. Methicillin-resistant Staphylococcus aureus (MRSA, ATCC 33591), Escherichia coli (E. coli, ATCC 25922), Methicillin-resistant Staphylococcus epidermidis (MRSE, RP62A), Enterococcus faecalis (E. F., ATCC 700802), Klebsiella pneumoniae (K. P., ATCC 13383), Pseudomonas aeruginosa (P. A., ATCC 27853). Single colony of each strain was picked and inoculated in tryptic soy broth (TSB) at 37 °C with agitation for 16 hours, then 100 μL was transferred to 4 mL TSB and allowed to grow to the mid-log phase. Polymer samples were dissolved in DI water to prepare the stock solution of 5 mg mL−1, which was diluted with TSB in 96-well plate to prepare 50 μL polymer solution with the concentration ranging from 500 μg mL−1 to 15 μg mL−1. The bacteria solution was then diluted to approximately 1 × 10⁶ CFU per mL and 50 μL was transferred to the 96-well plate. The plate was incubated at 37 °C for 16 hours and the optical density at 600 nm (OD 600) was measured with plate reader. The MIC was defined as the lowest concentration completely preventing visible growth.MBC test
After the MIC test, the contents from the wells with no visible turbidity were transferred to tryptic soy agar (TSA) plates and incubated at 37 °C for 24 h. Minimal bactericidal concentrations (MBCs) were determined as the lowest concentrations with no visible growth of colonies on the agar subculture.Hemolysis
The mouse red blood cells were washed three times with 2 mL phosphate-buffer saline (PBS) by centrifugation at 3000 rpm for 10 min. Next, the supernatant was removed and the cells were resuspended to a concentration of 5% (v/v) in PBS. The polymers were series diluted in 96-well plate with PBS to give a volume of 50 μL sample solution with final concentrations ranging from 1 mg mL−1 to 7.81 μg mL−1. This was followed by the addition of 50 μL diluted erythrocyte suspension and incubated together at 37 °C for 1 h. The plate was then centrifuged at 3000 rpm for 10 min to pellet the intact cells. 30 μL supernatant was carefully transferred to a new 96-well plate and diluted with 100 μL PBS. The absorbance at 540 nm was recorded on plate reader to determine the release of hemoglobin. The blood cells suspended in PBS and 1% Triton X-100 were used as controls of 0% and 100% hemolysis. Experiments were performed in triplicates. Percentage of hemolysis was calculated using the following equation:Time-kill kinetics study
Polymer samples were 2-fold serially diluted in 1.5 mL centrifuge tubes to obtain 500 μL solution with final concentrations of 8× MIC, 4× MIC, 2× MIC, 1× MIC. Negative control was prepared with 500 μL TSB. The mid-log phase bacteria were adjusted to approximately 1 × 10⁵ CFU per mL and then 500 μL suspension were transferred to each tube. Subsequently, the tubes were placed in the 37 °C incubator. At the 0-, 0.25-, 0.5-, 1-, 2- hour time points, 100 μL 100-fold diluted cultures were spread on TSA and incubated for additional 16 hours followed by colony counting.
Drug resistance study
The MIC test was first performed, then the bacteria culture from the 0.5 x MIC well was diluted to 1 × 10⁶ CFU per mL and added to the freshly prepared polymer solution ranging from 500 μg mL−1 to 15 μg mL−1 in a new 96-well plate. This was repeated for 14 passages, the MIC for each passage was recorded.Membrane depolarization
Mid-log phase bacteria were collected by centrifugation and washed with buffer (5 mM HEPES, 5 mM glucose, pH 7.2). The cell pellets were diluted with buffer (5 mM HEPES![[thin space (1/6-em)]](https://www.rsc.org/images/entities/char_2009.gif) :
:![[thin space (1/6-em)]](https://www.rsc.org/images/entities/char_2009.gif) 5 mM glucose
5 mM glucose![[thin space (1/6-em)]](https://www.rsc.org/images/entities/char_2009.gif) :
:![[thin space (1/6-em)]](https://www.rsc.org/images/entities/char_2009.gif) 100 mM KCl, 1
100 mM KCl, 1![[thin space (1/6-em)]](https://www.rsc.org/images/entities/char_2009.gif) :
:![[thin space (1/6-em)]](https://www.rsc.org/images/entities/char_2009.gif) 1
1![[thin space (1/6-em)]](https://www.rsc.org/images/entities/char_2009.gif) :
:![[thin space (1/6-em)]](https://www.rsc.org/images/entities/char_2009.gif) 1) to OD 600 approximately of 0.1. 100 μL suspension was transferred to the 96-well plate along with 1.1 μL 100 μg mL−1 DiSC3(5). The mixture was allowed to equilibrate and monitored by fluorescence at an excitation wavelength of 622 nm and emission wavelength of 670 nm for 8 min on the plate reader. Polymer with different concentrations were added then and the fluorescence was recorded for an extra 8 min55 The experiment was performed in triplicate.
1) to OD 600 approximately of 0.1. 100 μL suspension was transferred to the 96-well plate along with 1.1 μL 100 μg mL−1 DiSC3(5). The mixture was allowed to equilibrate and monitored by fluorescence at an excitation wavelength of 622 nm and emission wavelength of 670 nm for 8 min on the plate reader. Polymer with different concentrations were added then and the fluorescence was recorded for an extra 8 min55 The experiment was performed in triplicate.
Inner membrane permeability test
2 μL of E. coli frozen stock was transferred to 4 mL Mueller Hinton broth (MHB) containing 2% lactose and cultured for 16 hours. 100 μL bacteria were then transferred to fresh medium and cultured to mid-log phase.56 The cell pellets were collected by centrifugation at 3000 rpm for 10 min followed by a wash with 5 mM HEPES buffer containing 20 mM glucose and 1.5 mM ONPG. The cell pellets were then diluted to the OD 600 of 0.1 with the same buffer. 50 μL suspension was transferred to the 96-well plate, and 50 μL polymer sample with different concentrations were added afterward. 16 μM Melittin and HEPES buffer were selected as the positive and negative control.56 The hydrolysis of ONPG was determined by measuring OD at 420 nm every 6 min on plate reader until the absorbance reached the maximum value. The experiment was performed in triplicate.Outer membrane permeability test
Mid-log phase E. coli cells were centrifuged at 3000 rpm for 10 min, the supernatant was removed by pipette and the cell pellets were washed with 5 mM HEPES buffer containing 5 mM glucose twice.57 Thereafter, the bacteria were suspended to OD 600 of 0.4. 1 mL NPN at a concentration of 40 μM was added to 1 mL suspended cells and the 100 μL mixture was transferred to each well. An equal amount of polymer sample with different concentrations were added into the wells, while HEPES buffer was used as the negative control. 100 μL mixture was transferred to a new 96-well plate and the NPN fluorescence was started to be monitored with the plate reader at the excitation wavelength of 350 nm and emission wavelength at 420 nm. The experiment was performed in triplicate.TEM observation
MRSA and E. coli were cultured in TSB to the mid-log phase, then an aliquot of 100 μL bacteria was transferred to 3 mL TSB with polymer at 2× MIC and cultured at 37 °C with agitation for 2 h. The untreated bacteria suspension was used as negative control. After 2-hour co-culture, the bacteria were washed with PBS three times and then observed under the FEI Morgagni 268D TEM operated at 60 kV with an Olympus MegaView III camera on the microscope.SEM observation
Mid-log phase bacteria were incubated with or without polymer for 2 h with agitation at 37 °C, then centrifuged and washed with PBS buffer three times to completely remove the growth media. The cell pellets were fixed with 4% paraformaldehyde for 4 h, followed by PBS wash twice. After dehydration with 25%, 50%, 75%, 90% and 100% ethanol, bacteria samples were transferred to the 12 mm cover slides and chemically dried with hexamethyldisilazane (HMDS). The cover slides were directly mounted on the metal stub using carbon conductive tabs, and observed under Topcon Aquila Hybrid Scanning Electron Microscope after gold coating.Fluorescence imaging
MRSA and E. coli were cultured and washed using the same method for TEM observation preparation. After the washing step, the cell pellets were collected and stained by 5 μg mL−1 PI and 10 μg mL−1 DAPI for 20 min sequentially. The bacteria were washed three times with PBS to remove the unstained dye. 100 μL PBS was added to suspend the bacteria after the final wash step, and then 10 μL suspension was dropped on the slide for fluorescence imaging with Olympus FV1200 spectral inverted laser scanning confocal microscope.Biofilm inhibition
Inhibition of biofilm formation was evaluated using the method adapted from Adukwu.58 The bacteria overnight culture was diluted 100 fold in TSB supplemented with 1% glucose, then 50 μL suspension was transferred into each well of the 96-well plate along with 50 μL polymer solution ranging from 1 mg mL−1 to 1.95 μg mL−1, with TSB being used as negative control. After 24 h incubation at 37 °C, the media was removed and the formed biofilm was washed with water twice. The plate was left to dry and stained with 0.1% crystal violet for 30 min. Afterwards, the unstained crystal violet was washed away with water and the plate was air-dried. 100 μL 30% acetic acid was added into each well to dissolve the crystal violet for 15 min, and the OD value was measured at 595 using the plate reader. The experiment was performed in triplicate. The remaining biomass percentage was calculated using the formula below:Conflicts of interest
There are no conflicts to declare.Acknowledgements
The work was supported by 5RO1AG056569, 9RO1AI152416 and 5RO1AI149852.References
- CDC, Antibiotic Resistance Threats in the United States, 2019, U.S. Department of Health and Human Services, CDC, Atlanta, GA, 2019 Search PubMed.
- A. Chokshi, Z. Sifri, D. Cennimo and H. Horng, J. Global. Infect. Dis., 2019, 11, 36–42 CrossRef PubMed.
- D. I. Andersson, N. Q. Balaban, F. Baquero, P. Courvalin, P. Glaser, U. Gophna, R. Kishony, S. Molin and T. Tønjum, FEMS Microbiol. Rev., 2020, 44, 171–188 CrossRef CAS PubMed.
- C. Feldman and R. Anderson, Pneumonia, 2021, 13, 5 CrossRef PubMed.
- J. M. Farrell, C. Y. Zhao, K. M. Tarquinio and S. P. Brown, Front. Microbiol., 2021, 12, 682571 CrossRef PubMed.
- M. Vaillancourt and P. Jorth, mBio, 2020, 11, e01806–e01820 CrossRef CAS PubMed.
- N. Mookherjee, M. A. Anderson, H. P. Haagsman and D. J. Davidson, Nat. Rev. Drug Discovery, 2020, 19, 311–332 CrossRef CAS PubMed.
- Y. Huan, Q. Kong, H. Mou and H. Yi, Front. Microbiol., 2020, 11, 582779 CrossRef.
- S. Mukhopadhyay, A. S. Bharath Prasad, C. H. Mehta and U. Y. Nayak, World J. Microbiol. Biotechnol., 2020, 36, 131 CrossRef CAS PubMed.
- P. Kumar, J. N. Kizhakkedathu and S. K. Straus, Biomolecules, 2018, 8, 4 CrossRef PubMed.
- H. Jenssen, P. Hamill and R. E. W. Hancock, Clin. Microbiol. Rev., 2006, 19, 491–511 CrossRef CAS.
- M. F. Ilker, K. Nüsslein, G. N. Tew and E. B. Coughlin, J. Am. Chem. Soc., 2004, 126, 15870–15875 CrossRef CAS.
- S. J. Lam, E. H. H. Wong, C. Boyer and G. G. Qiao, Prog. Polym. Sci., 2018, 76, 40–64 CrossRef CAS.
- Y. Yang, Z. Cai, Z. Huang, X. Tang and X. Zhang, Polym. J., 2018, 50, 33–44 CrossRef CAS.
- S. Bai, J. Wang, K. Yang, C. Zhou, Y. Xu, J. Song, Y. Gu, Z. Chen, M. Wang, C. Shoen, B. Andrade, M. Cynamon, K. Zhou, H. Wang, Q. Cai, E. Oldfield, S. C. Zimmerman, Y. Bai and X. Feng, Sci. Adv., 2021, 7, eabc9917 CrossRef CAS PubMed.
- W. Chin, G. Zhong, Q. Pu, C. Yang, W. Lou, P. F. De Sessions, B. Periaswamy, A. Lee, Z. C. Liang, X. Ding, S. Gao, C. W. Chu, S. Bianco, C. Bao, Y. W. Tong, W. Fan, M. Wu, J. L. Hedrick and Y. Y. Yang, Nat. Commun., 2018, 9, 917 CrossRef PubMed.
- A. Salama, M. Hasanin and P. Hesemann, Carbohydr. Polym., 2020, 241, 116363 CrossRef CAS PubMed.
- F. Nederberg, Y. Zhang, J. P. K. Tan, K. Xu, H. Wang, C. Yang, S. Gao, X. D. Guo, K. Fukushima, L. Li, J. L. Hedrick and Y.-Y. Yang, Nat. Chem., 2011, 3, 409–414 CrossRef CAS PubMed.
- D. S. S. M. Uppu, P. Akkapeddi, G. B. Manjunath, V. Yarlagadda, J. Hoque and J. Haldar, Chem. Commun., 2013, 49, 9389–9391 RSC.
- J. Hoque, P. Akkapeddi, V. Yarlagadda, D. S. S. M. Uppu, P. Kumar and J. Haldar, Langmuir, 2012, 28, 12225–12234 CrossRef CAS PubMed.
- N. F. Kamaruzzaman, S. Q. Y. Chong, K. M. Edmondson-Brown, W. Ntow-Boahene, M. Bardiau and L. Good, Front. Microbiol., 2017, 8, 1518 CrossRef PubMed.
- Y. Wu, Y. Lin, Z. Cong, K. Chen, X. Xiao, X. Wu, L. Liu, Y. She, S. Liu, R. Zhou, G. Yin, X. Shao, Y. Dai, H. Lin and R. Liu, Adv. Funct. Mater., 2022, 32, 2107942 CrossRef CAS.
- S. Chen, X. Shao, X. Xiao, Y. Dai, Y. Wang, J. Xie, W. Jiang, Y. Sun, Z. Cong, Z. Qiao, H. Zhang, L. Liu, Q. Zhang, W. Zhang, L. Zheng, B. Yu, M. Chen, W. Cui, J. Fei and R. Liu, ACS Infect. Dis., 2020, 6, 479–488 CrossRef CAS PubMed.
- P. T. Phuong, S. Oliver, J. He, E. H. H. Wong, R. T. Mathers and C. Boyer, Biomacromolecules, 2020, 21, 5241–5255 CrossRef CAS PubMed.
- K. Kuroda, G. A. Caputo and W. F. DeGrado, Chemistry, 2009, 15, 1123–1133 CrossRef CAS.
- E.-R. Kenawy, S. D. Worley and R. Broughton, Biomacromolecules, 2007, 8, 1359–1384 CrossRef CAS PubMed.
- Z. Zhou, D. Wei, Y. Guan, A. Zheng and J.-J. Zhong, Mater. Sci. Eng., C, 2011, 31, 1836–1843 CrossRef CAS.
- T. Eren, A. Som, J. R. Rennie, C. F. Nelson, Y. Urgina, K. Nüsslein, E. B. Coughlin and G. N. Tew, Macromol. Chem. Phys., 2008, 209, 516–524 CrossRef CAS.
- T. D. Michl, K. E. S. Locock, N. E. Stevens, J. D. Hayball, K. Vasilev, A. Postma, Y. Qu, A. Traven, M. Haeussler, L. Meagher and H. J. Griesser, Polym. Chem., 2014, 5, 5813–5822 RSC.
- W. Ren, W. Cheng, G. Wang and Y. Liu, J. Polym. Sci., Part A: Polym. Chem., 2017, 55, 632–639 CrossRef CAS.
- A. Jain, L. S. Duvvuri, S. Farah, N. Beyth, A. J. Domb and W. Khan, Adv. Healthcare Mater., 2014, 3, 1969–1985 CrossRef CAS PubMed.
- C. Ergene and E. F. Palermo, Curr. Pharm. Des., 2018, 24, 855–865 CrossRef CAS PubMed.
- A. Nimmagadda, X. Liu, P. Teng, M. Su, Y. Li, Q. Qiao, N. K. Khadka, X. Sun, J. Pan, H. Xu, Q. Li and J. Cai, Biomacromolecules, 2017, 18, 87–95 CrossRef CAS PubMed.
- Y. Li, C. Smith, H. Wu, P. Teng, Y. Shi, S. Padhee, T. Jones, A.-M. Nguyen, C. Cao, H. Yin and J. Cai, ChemBioChem, 2014, 15, 2275–2280 CrossRef CAS PubMed.
- M. Su, M. Wang, Y. Hong, A. Nimmagadda, N. Shen, Y. Shi, R. Gao, E. Zhang, C. Cao and J. Cai, Chem. Commun., 2019, 55, 13104–13107 RSC.
- P. Li, X. Li, R. Saravanan, C. M. Li and S. S. J. Leong, RSC Adv., 2012, 2, 4031–4044 RSC.
- H. Takahashi, E. F. Palermo, K. Yasuhara, G. A. Caputo and K. Kuroda, Macromol. Biosci., 2013, 13, 1285–1299 CrossRef CAS PubMed.
- D. S. S. M. Uppu, S. Samaddar, J. Hoque, M. M. Konai, P. Krishnamoorthy, B. R. Shome and J. Haldar, Biomacromolecules, 2016, 17, 3094–3102 CrossRef CAS PubMed.
- M. Wang, R. Gao, M. Zheng, P. Sang, C. Li, E. Zhang, Q. Li and J. Cai, J. Med. Chem., 2020, 63, 15591–15602 CrossRef CAS PubMed.
- M. Wang, X. Feng, R. Gao, P. Sang, X. Pan, L. Wei, C. Lu, C. Wu and J. Cai, J. Med. Chem., 2021, 64, 9894–9905 CrossRef CAS PubMed.
- Y. C. Chung, Y. P. Su, C. C. Chen, G. Jia, H. L. Wang, J. C. Wu and J. G. Lin, Acta Pharmacol. Sin., 2004, 25, 932–936 CAS.
- I. Sovadinova, E. F. Palermo, R. Huang, L. M. Thoma and K. Kuroda, Biomacromolecules, 2011, 12, 260–268 CrossRef CAS PubMed.
- K. Kuroda and G. A. Caputo, Wiley Interdiscip. Rev.: Nanomed. Nanobiotechnol., 2013, 5, 49–66 CAS.
- Z. Pang, R. Raudonis, B. R. Glick, T.-J. Lin and Z. Cheng, Biotechnol. Adv., 2019, 37, 177–192 CrossRef CAS PubMed.
- C. Walsh, Nature, 2000, 406, 775–781 CrossRef CAS PubMed.
- A. Peschel, R. W. Jack, M. Otto, L. V. Collins, P. Staubitz, G. Nicholson, H. Kalbacher, W. F. Nieuwenhuizen, G. Jung, A. Tarkowski, K. P. van Kessel and J. A. van Strijp, J. Exp. Med., 2001, 193, 1067–1076 CrossRef CAS PubMed.
- M. Wu, E. Maier, R. Benz and R. E. W. Hancock, Biochemistry, 1999, 38, 7235–7242 CrossRef CAS PubMed.
- T. J. Silhavy, D. Kahne and S. Walker, Cold Spring Harbor Perspect. Biol., 2010, 2, a000414 Search PubMed.
- O. N. Silva, M. D. T. Torres, J. Cao, E. S. F. Alves, L. V. Rodrigues, J. M. Resende, L. M. Lião, W. F. Porto, I. C. M. Fensterseifer, T. K. Lu, O. L. Franco and C. de la Fuente-Nunez, Proc. Natl. Acad. Sci. U. S. A., 2020, 117, 26936 CrossRef CAS PubMed.
- J. Gravel, C. Paradis-Bleau and A. R. Schmitzer, MedChemComm, 2017, 8, 1408–1413 RSC.
- S.-C. Park, Y. Park and K.-S. Hahm, Int. J. Mol. Sci., 2011, 12, 5971–5992 CrossRef CAS PubMed.
- S.-K. Zhang, J.-W. Song, F. Gong, S.-B. Li, H.-Y. Chang, H.-M. Xie, H.-W. Gao, Y.-X. Tan and S.-P. Ji, Sci. Rep., 2016, 6, 27394 CrossRef CAS PubMed.
- Y. Qiao, C. Yang, D. J. Coady, Z. Y. Ong, J. L. Hedrick and Y. Y. Yang, Biomaterials, 2012, 33, 1146–1153 CrossRef CAS PubMed.
- CLSI, Methods for Dilution Antimicrobial Susceptibility Tests for Bacteria that Grow Aerobically, 11th edn, 2018 Search PubMed.
- M. Cheng, J. X. Huang, S. Ramu, M. S. Butler and M. A. Cooper, Antimicrob. Agents Chemother., 2014, 58, 6819–6827 CrossRef PubMed.
- L. Silvestro, J. N. Weiser and P. H. Axelsen, Antimicrob. Agents Chemother., 2000, 44, 602–607 CrossRef CAS PubMed.
- P. N. Domadia, A. Bhunia, A. Ramamoorthy and S. Bhattacharjya, J. Am. Chem. Soc., 2010, 132, 18417–18428 CrossRef CAS PubMed.
- E. C. Adukwu, S. C. Allen and C. A. Phillips, J. Appl. Microbiol., 2012, 113, 1217–1227 CrossRef CAS PubMed.
Footnote |
| † Electronic supplementary information (ESI) available. See DOI: https://doi.org/10.1039/d2bm01995g |
| This journal is © The Royal Society of Chemistry 2023 |


