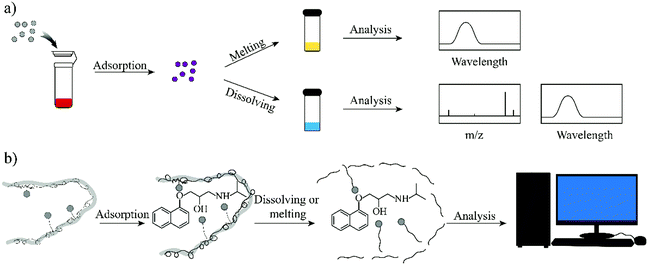
Molecularly imprinted wax
Long
Jiang
,
Tao
Jing
 and
Xiantao
Shen
 *
*
State Key Laboratory of Environment Health (Incubation), Key Laboratory of Environment and Health, Ministry of Education, Key Laboratory of Environment and Health (Wuhan), Ministry of Environmental Protection, School of Public Health, Tongji Medical College, Huazhong University of Science and Technology, #13 Hangkong Road, Wuhan, Hubei, 430030, China. E-mail: xtshenlab@hust.edu.cn
First published on 24th March 2022
Abstract
The development of an elution-free solid-phase extraction (SPE) process is of special interest in sample pretreatment. Due to the phase-change merits at relatively low temperatures and easy dissolution in n-hexane, wax spheres show great potential in this field. However, the conventional wax spheres possess a low affinity towards the target analytes when they are used as SPE adsorbents. In this study, using octadecanoic acid as the functional monomer and wax as the matrix, molecularly imprinted wax (MIW) spheres were successfully prepared. The obtained MIW spheres displayed remarkable molecular recognition ability and high selectivity towards the template. Interestingly, the as-synthesized molecularly imprinted wax (MIW) could be dissolved in n-hexane or melted by heating for subsequent fluorescence and mass spectrum analysis without the target elution process. Moreover, the melted MIW exhibited high repeatability, sensitivity and specificity for solid-state fluorescence detection. We believe that the imprinting method presented in this study will open a new window in analytical chemistry.
1. Introduction
Sample pretreatment is a fundamental part of qualitative and quantitative analysis, especially for biological samples with complex matrices. Among all the sample pretreatment methods, solid-phase extraction (SPE), which utilizes solid adsorbents to separate, enrich and purify the target, has been the most frequently used approach.1 In the literature, various kinds of materials (e.g., polystyrene,2,3 graphene,4,5 carbon nanotubes,6,7 metal–organic frameworks,8,9 covalent organic frameworks,10,11 molecularly imprinted polymers12,13 and other materials14–18) have been reported as efficient SPE adsorbents. Due to the high enrichment factor towards the analytes, SPE shows great potential in food,2,3,11 environment,4–10,12–16 as well as biosample17,18 analysis. However, the selectivity of these SPE adsorbents towards targets is relatively low, and thereby affects the detection sensitivity.Because of their high affinity towards the target substances, molecularly imprinted polymers (MIPs), also named artificial antibodies or synthetic receptors, have attracted increasing attention in analytical chemistry in the past decades.19–27 Generally, MIPs are prepared by the polymerization of functional monomers and cross-linkers in the presence of template molecules. After the polymerization, the templates in the polymers are removed by solvent elution. In this way, imprinted cavities complementary to the template molecules in shape and chemical functionality were “tailor-made”. Thus far, MIP-based SPE (MIP-SPE),28 which exhibits excellent sensitivity in trace target detection, has been widely used in chemical, environmental and food analysis.29 Generally, the MIP-SPE process includes three steps: loading of the target analytes, removal of the non-target interferences by solvent washing, and elution of the target analytes.28 Although MIPs show good selectivity towards the target analytes, it is still difficult to completely elute targets during the SPE process and worse, the elution of target analytes consumes large amounts of solvent. Recently, MIP-based solid-phase microextraction (MIP-SPME)12,13 and MIP-based dispersive micro-solid phase extraction (MIP-DSPE)30 were also successfully developed for the consumption of small volumes of solvents. However, the target elution step was still inevitable.
To completely avoid the utilization of solvents in the solution step, in this work, we propose an elution-free MIP-SPE method. To achieve this goal, the MIPs should have the capability of controllable conversion from the solid-state to the liquid state, by which the adsorbed targets could be used for subsequent instrumental analysis. Due to the low phase transition temperature (50–70 °C) and the high solubility in low polarity solvents (e.g., n-hexane), paraffin wax (a conventional energy storage material)31,32 was introduced in this work to develop an elution-free SPE method. In addition, when heated to the liquid phase, wax is an excellent hydrophobic solvent for the template molecule, which is necessary for the synthesis of molecularly imprinted wax.
Therefore, in this work wax was used as an imprinted matrix to synthesize molecularly imprinted wax (MIW) via a wax-in-water emulsion method. To improve the affinity of MIW for the target, octadecanoic acid (OA), which contains a long alkyl chain and carboxyl group, was selected as the functional monomer to form affinity cavities in the wax. The schematic synthesis of the MIW spheres is shown in Fig. 1, where propranolol (PRO, a typical β-blocker) was selected as the template molecule. During the synthesis of MIW, the excessive OA also acted as a stabilizer for the wax in water emulsions at high temperatures. Scanning electron microscopy (SEM), Fourier transform infrared spectroscopy (FTIR), differential scanning calorimetry (DSC) and thermogravimetric analysis (TGA) were used to characterize the obtained MIW. The binding properties of the template on the MIW including the binding isotherms, kinetics and binding selectivity were carefully studied. To verify the MIW-based SPE process (MIW-SPE), the MIW as an SPE adsorbent that selectively adsorbed the target was then dissolved in n-hexane to form a homogeneous solution for LC–MS/MS or fluorescence analysis. Compared to a typical SPE process, the elution-free SPE process showed significance in saving the consumption of the elution solvents. Moreover, the MIW could be melted by heating and generate a uniform film for solid-state fluorescence detection with high repeatability, sensitivity, and specificity. We believe the generation of MIW in the present study will open a new window in molecular imprinting in analytical chemistry.
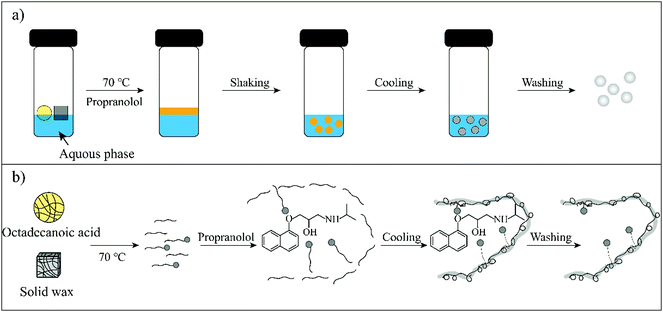 | ||
| Fig. 1 (a) A facile synthesis process for MIW spheres. (b) Schematic illustration of the molecular imprinting process during the synthesis of MIW spheres. | ||
2. Experimental
2.1. Chemical and reagents
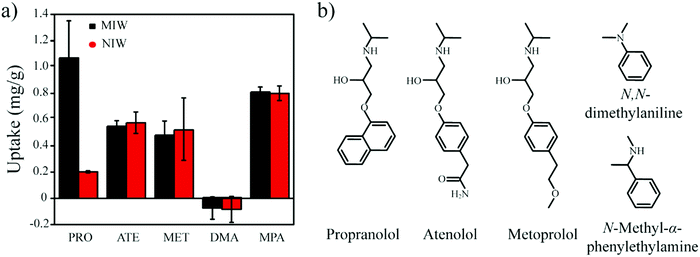
Paraffin wax (with a density of 0.91 g cm−3 and a melting temperature of 60 °C), octadecanoic acid, propranolol (PRO), atenolol (ATE), metoprolol (MET), N,N-dimethylaniline (DMA), N-methyl-α-phenylethylamine (MPA) were purchased from Aladdin Chemical Reagent Co. (Shanghai, China). Methanol (MeOH), ethanol (EtOH), acetonitrile (ACN), dimethylformamide (DMF), dimethyl sulfoxide (DMSO) and n-hexane were purchased from Sinopharm Chemical Reagent Co. Ltd (Shanghai, China).2.2. Preparation of MIW and NIW spheres
Typically, 164 mg of wax, 30 mg of OA, and 10 mg of PRO (free base) were added to a 10 mL glass tube. The glass tube was placed into a water bath at 70 °C. After the melting of the wax, the mixture was kept at 70 °C for ∼5 min to form the OA–PRO complex. In this tube, 4 mL of deionized water (at 70 °C) was added. The mixture system was then added to 20 μL of n-hexane as a porogen and placed at 70 °C for ∼5 min. After vigorously shaking by hand, a wax/water emulsion was formed. The emulsion was quickly poured into a 50 mL beaker containing 20 mL of ethanol (room temperature). The synthetic materials were eluted with 15 mL methanol (6 times) by centrifugation. After vacuum drying at 30 °C for 12 h, the MIW spheres were obtained. As a control, the NIW spheres were also synthesized using the same protocol, except that the template was not added.2.3. Characterization
The surface morphologies of the MIW and NIW spheres were observed by SEM (Zeiss Sigma500, Germany). TGA (NETZSCH STA 449F5, Germany) was performed under N2 with purging from 25 to 600 °C at a heating rate of 30 °C min−1. FTIR spectra of the MIW and NIW spheres were recorded on a spectrometer (Thermo Scientific) from 4000 cm−1 to 1000 cm−1. DSC analysis (TA DSC2-01180, America) was performed in a nitrogen atmosphere with a ramp of 5 °C min−1 from 25 to 80 °C and then with a ramp of 10 °C min−1 from 80 to 10 °C.2.4. Binding experiments
To investigate the effects of water content in the solution on the PRO binding, 5 mg of MIW and NIW spheres were dispersed in 1 mL of a mixture solution (ACN and water) containing 20 mg L−1 PRO. The water content in the mixture solution was varied from 0% to 80%.
![[thin space (1/6-em)]](https://www.rsc.org/images/entities/char_2009.gif) :
:![[thin space (1/6-em)]](https://www.rsc.org/images/entities/char_2009.gif) 4, v/v). The amounts of the MIW and NIW spheres were both 5 mg, the incubation time was 3 h. The initial PRO concentrations were selected at 2, 4, 6, 8, 10, 12 and 20 μg mL−1. In the binding kinetics study, the solvent was a mixture solution of ACN and water (6
4, v/v). The amounts of the MIW and NIW spheres were both 5 mg, the incubation time was 3 h. The initial PRO concentrations were selected at 2, 4, 6, 8, 10, 12 and 20 μg mL−1. In the binding kinetics study, the solvent was a mixture solution of ACN and water (6![[thin space (1/6-em)]](https://www.rsc.org/images/entities/char_2009.gif) :
:![[thin space (1/6-em)]](https://www.rsc.org/images/entities/char_2009.gif) 4, v/v), and the amounts of the MIW and NIW spheres were 5 mg. The initial PRO concentration was 10 μg mL−1. The incubation times were 5, 10, 15, 30, 60 and 90 min.
4, v/v), and the amounts of the MIW and NIW spheres were 5 mg. The initial PRO concentration was 10 μg mL−1. The incubation times were 5, 10, 15, 30, 60 and 90 min.
![[thin space (1/6-em)]](https://www.rsc.org/images/entities/char_2009.gif) :
:![[thin space (1/6-em)]](https://www.rsc.org/images/entities/char_2009.gif) 4, v/v) containing only one substance (PRO, ATE, MET, DMA or MPA). In brief, 5 mg of the MIW and NIW spheres were dispersed in 1 mL of mixture solution containing 20 mg L−1 PRO, ATE, MET, DMA or MPA. After incubation for 3 h at room temperature, the spheres were isolated by centrifugation at 8000 r min−1. The PRO, ATE, MET, DMA or MPA in the supernatant were determined using the fluorescence spectrophotometer. The excitation wavelengths for PRO, ATE, MET, DMA or MPA were 294 nm, 252 nm, 252 nm, 305 nm and 252 nm, respectively. The emission wavelengths for PRO, ATE, MET, DMA or MPA were 340 nm, 302 nm, 303 nm, 353 nm and 298 nm, respectively.
4, v/v) containing only one substance (PRO, ATE, MET, DMA or MPA). In brief, 5 mg of the MIW and NIW spheres were dispersed in 1 mL of mixture solution containing 20 mg L−1 PRO, ATE, MET, DMA or MPA. After incubation for 3 h at room temperature, the spheres were isolated by centrifugation at 8000 r min−1. The PRO, ATE, MET, DMA or MPA in the supernatant were determined using the fluorescence spectrophotometer. The excitation wavelengths for PRO, ATE, MET, DMA or MPA were 294 nm, 252 nm, 252 nm, 305 nm and 252 nm, respectively. The emission wavelengths for PRO, ATE, MET, DMA or MPA were 340 nm, 302 nm, 303 nm, 353 nm and 298 nm, respectively.
2.5. MIW spheres-based SPE coupled with fluorescence analysis
The stock solution was prepared by dissolving 10 mg of PRO in 10 mL methanol. The aqueous sample was obtained by spiking a mixture solution of ACN and deionized water (6![[thin space (1/6-em)]](https://www.rsc.org/images/entities/char_2009.gif) :
:![[thin space (1/6-em)]](https://www.rsc.org/images/entities/char_2009.gif) 4, v/v) with the stock solution to a final PRO concentration of 10 μg mL−1. In a 2 mL Eppendorf tube, different concentrations of PRO (0.2, 0.5, 1, 2, 5, 10 μg mL−1) and 20 mg of the MIW spheres were added, respectively. The suspension was then incubated at room temperature for 3 h. The MIW spheres were isolated by centrifugation at 8000 r min−1, then the materials were dissolved in 1 mL of n-hexane.
4, v/v) with the stock solution to a final PRO concentration of 10 μg mL−1. In a 2 mL Eppendorf tube, different concentrations of PRO (0.2, 0.5, 1, 2, 5, 10 μg mL−1) and 20 mg of the MIW spheres were added, respectively. The suspension was then incubated at room temperature for 3 h. The MIW spheres were isolated by centrifugation at 8000 r min−1, then the materials were dissolved in 1 mL of n-hexane.
The PRO concentration in the n-hexane solution was then analysed using an F97 Pro spectrofluorimeter (Shanghai LengGuang Industrial Co. Ltd, Shanghai, China). The excitation wavelength and emission wavelength for this detection were 294 nm and 343 nm, respectively.
2.6. MIW spheres-based SPE coupled with HPLC–MS/MS analysis
In the MIW spheres-based SPE coupled with HPLC–MS/MS analysis, 20 mg of MIW spheres were added to the solution containing 20 μg mL−1 of PRO. The suspension was incubated for 3 h at room temperature. The MIW spheres were then isolated by centrifugation at 8000 r min−1. After dissolving the MIW spheres bound with PRO by n-hexane, 10 uL of PRO in n-hexane solution was diluted with 990 uL of methanol. It is noted that such a high dilution could effectively reduce the effect of wax on the instrument, although it decreased the detection sensitivity.The chromatographic separation method of LC–MS/MS is presented in Table 1. Mobile phase A was 5 mM ammonium formate/0.1% formic acid in water, and mobile phase B was methanol.
| Retention (min) | Flow (mL min−1) | A (%) | B (%) |
|---|---|---|---|
| 0.00 | 0.50 | 60.0 | 40.0 |
| 4.00 | 0.50 | 60.0 | 40.0 |
The MS parameters for PRO using selected reaction monitoring (SRM) transitions are shown in Table 2. MS was conducted in the positive-ionization mode with sheath gas (40 Arb), aux gas (10 Arb), the vaporizer temperature (350 °C), spray voltage (3.2 kV) and capillary temperature (320 °C).
| Analyte | Parent | Product | SRM Collision energy | Tube lens | Ionization mode |
|---|---|---|---|---|---|
| Pro | 259.700 | 182.900 | 17 | 85 | + |
| 259.700 | 116.100 | 17 | 85 | + |
2.7. Coupling MIW spheres with a solid-state fluorescent sensor
In a 2 mL Eppendorf tube, 400 μL of the sample, 600 μL of ACN and 20 mg of the MIW spheres were added. In this suspension, the initial PRO concentration was 2 μg mL−1. The suspension was incubated at room temperature for 3 h. The MIW spheres were isolated by centrifugation. The MIW spheres bound with PRO melted at 70 °C. 200 uL of the melting wax solution was cast in the hole of the solid fluorescent frame. After cooling to room temperature, PRO was homogenously distributed in the wax film. The film was analysed at an excitation wavelength of 294 nm.3. Results and discussion
3.1. Synthesis and characterizations
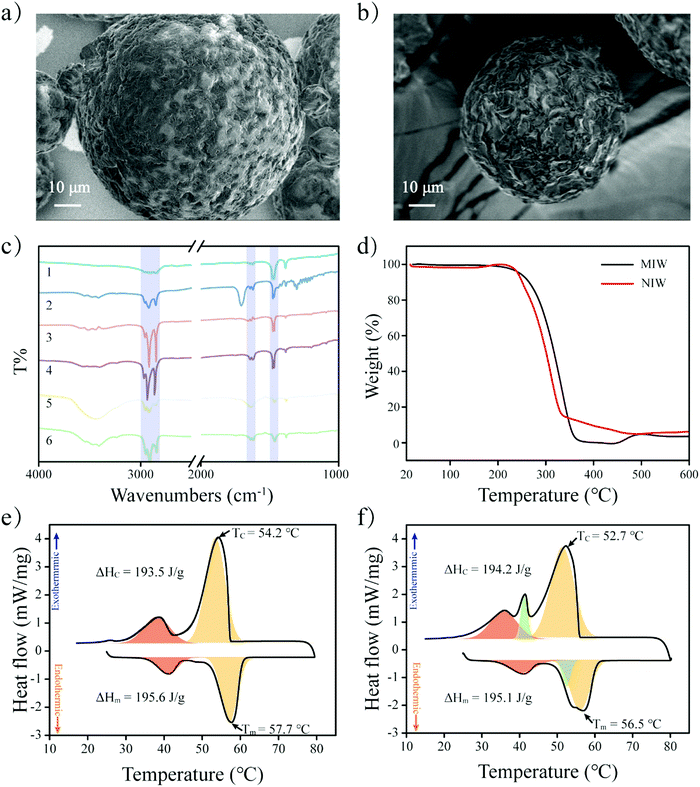
The schematic preparation of the MIW is shown in Fig. 1. Under a relatively high temperature, wax-stearic acid in water emulsion was formed. In this emulsion system, OA functioned as the “functional monomer” and the emulsifier to form the imprinting complex and stable imprinting droplets. The wax spheres were formed by simply cooling the emulsion. After eluting PRO in the obtained wax spheres, imprinted cavities were generated within the MIW spheres. By dissolving the as-synthesized MIW spheres (175.6 mg) in n-hexane, 5.5 mg (21.2 μmol) of PRO was detected. Therefore, the imprinting efficiency was 55% during the synthesis and the contents of imprinted cavities in MIW were 0.12 μmol mg−1. Compared to the traditional synthesis of MIPs, the synthesis process of MIW was different: (i) no cross-linkers and initiators were added to the imprinting system; (ii) no chemical polymerization occurred during the imprinting process.During the synthesis of MIW, the imprinting system (wax-OA in water emulsion) was observed with the SEM images. Fig. 2a and b show that both MIW and NIW had a regular spherical structure with a diameter of ∼76 μm and ∼52 μm, respectively. It is also seen in Fig. 2a and b that the MIW and NIW spheres displayed a rough and porous surface caused by n-hexane.
To study the functional groups on MIW spheres, the FTIR spectra of the MIW and the NIW spheres were reported in Fig. 2c. Both MIW spheres and the NIW spheres showed adsorption bands at 2850, 2918 and 2957 cm−1, which were attributed to the aliphatic C–H stretching. Both spheres also showed clear bending vibrations of methylene (1473 cm−1) and methyl (1463 cm−1) groups. These data indicate the presence of alkyl chains on both the MIW spheres and the NIW spheres. Interestingly, the peaks at 1631 cm−1 and 1651 cm−1 on NIW spheres, which were assigned to the C![[double bond, length as m-dash]](https://www.rsc.org/images/entities/char_e001.gif) O stretching of the -COOH group, were red-shifted to 1617 cm−1 and 1639 cm−1, indicating that the –COOH group of stearic acid played important roles (e.g. formation of electrostatic interactions with the –NH– group on PRO) during the imprinting.
O stretching of the -COOH group, were red-shifted to 1617 cm−1 and 1639 cm−1, indicating that the –COOH group of stearic acid played important roles (e.g. formation of electrostatic interactions with the –NH– group on PRO) during the imprinting.
The thermal stability of the MIW and NIW spheres were also investigated by TGA. It is shown in Fig. 2d that the thermal decomposition of MIW spheres started at 200 °C and ended at 338 °C. For the NIW spheres, the thermal decomposition started at 210 °C and ended at 316 °C. The results indicated that MIW and NIW had slightly different thermal stabilities, which probably resulted from the generation of molecular recognition sites in MIW during the synthesis. For further investigation of the phase-change behaviours and relevant thermal parameters of the MIW and NIW spheres, the fusion heat (ΔHm) and solidification heat (ΔHc) were obtained from the definite integral of the DSC curves. The positive and negative peaks in DSC curves represent exothermic and endothermic peaks, respectively. It is shown in Fig. 2e and f that, as typical paraffin composited materials, the DSC curves of MIW and NIW spheres both exhibited apparent glass transition temperatures (the negative red peaks).33 In detail, the ΔHm and ΔHc for the MIW spheres were 195.6 and 193.5 J g−1, respectively. Due to the similar compositions, NIW spheres had close results of 195.1 and 194.2 J g−1 for ΔHm and ΔHc, respectively. The negative orange peaks represent the heat enthalpy during melting. It is seen in Fig. 2e that the MIW spheres showed unimodal behaviour (negative orange peak) during melting. Interestingly, it was seen in Fig. 2f that NIW spheres displayed a bimodal melting behaviour (negative green and orange peaks), implying the occurrence of phase separation in NIW spheres during melting.34 The phase separation also occurred during NIW sphere crystallization (positive green and orange peaks). These results are consistent with the TGA and indicated that MIW spheres displayed a uniform crystal form while NIW spheres showed two crystal forms, which might be attributed to the addition of templates during the imprinting synthesis.
3.2. Binding profiles of MIW
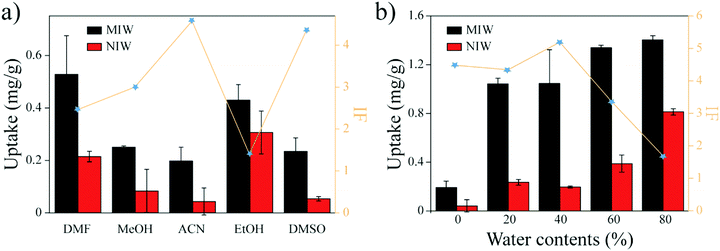
Previous studies35 showed that the binding capacity of the MIPs was also dependent on the water fractions in the solvent. To increase the binding capacity of PRO on the MIW (while maintaining its IF value), water fractions in ACN were optimized. Fig. 3b shows the effects of water fractions in ACN on the banding capacity and the IF value of PRO on MIW. As shown in Fig. 3b, the binding capacity of PRO on MIW increased when water was present in ACN. When the water fractions in ACN were 40%, the IF value of MIW was the highest (5.3). Therefore, in the following studies, a mixture solvent of water and ACN (4![[thin space (1/6-em)]](https://www.rsc.org/images/entities/char_2009.gif) :
:![[thin space (1/6-em)]](https://www.rsc.org/images/entities/char_2009.gif) 6, v/v) was used as the binding solvent.
6, v/v) was used as the binding solvent.
The Langmuir isotherm model was often used to demonstrate the binding mechanism of the template on the MIPs.36,37 In this work, the Langmuir isotherm model was also utilized to display the binding process of PRO on the MIW spheres. The Langmuir isotherm model can be described as follows:
 | (1) |
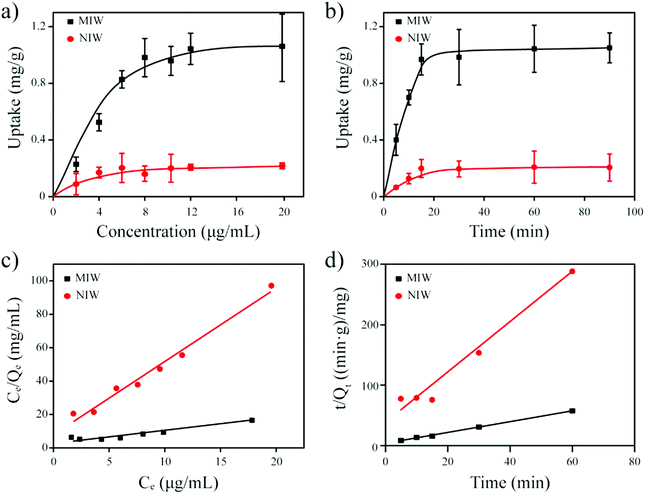
In this equation, Ce (μg mL−1) and Qe (mg g−1) represent the supernatant concentration of PRO after adsorption and the binding capacity of PRO on MIW spheres at the binding equilibrium, respectively; Qm (mg g−1) is the maximum PRO binding capacity; k represents the Langmuir constant. The parameters obtained from the Langmuir isotherm plot are listed in Table 3.
As seen in Table 3, the correlation coefficient values (R2) for MIW and NIW spheres are 0.91 and 0.98, respectively, suggesting that the binding process of PRO on both the MIW and NIW spheres generally followed the Langmuir isotherm model, indicating that the template binding on the MIW was monolayer adsorption. Moreover, the Qm for PRO binding on the MIW spheres was 1.44 mg g−1, which was 6.3 fold as compared to that on the NIW spheres (0.23 mg g−1). This larger binding capacity of the MIW spheres towards the template was due to the high affinity of the MIW spheres towards the template.
 | (2) |
In this equation, Qt (mg g−1) represents the binding amount of the template at t min, Qe is the maximum PRO binding capacity, and kQe2 (mg g−1 min−1) is the initial binding rate of the pseudo-second-order sorption.
The fitting parameters from Fig. 4d are summarized in Table 4. Results in this table show that the correlation coefficient values (R2) for PRO binding on the MIW and NIW spheres were 0.99 and 0.97, respectively. These data indicated that the binding process on both materials generally followed the pseudo-second-order model. Moreover, the initial binding rates of the MIW and NIW spheres towards PRO were 0.18 and 0.03 mg g−1 min−1, respectively. Compared with the NIW spheres, the MIW spheres showed a 6-fold enhanced initial binding rate. The larger adsorption capacity and the enhanced sorption rate of the MIW spheres suggested a successful imprinting process during the synthesis of MIW spheres.
3.3. Advantages of the MIW spheres
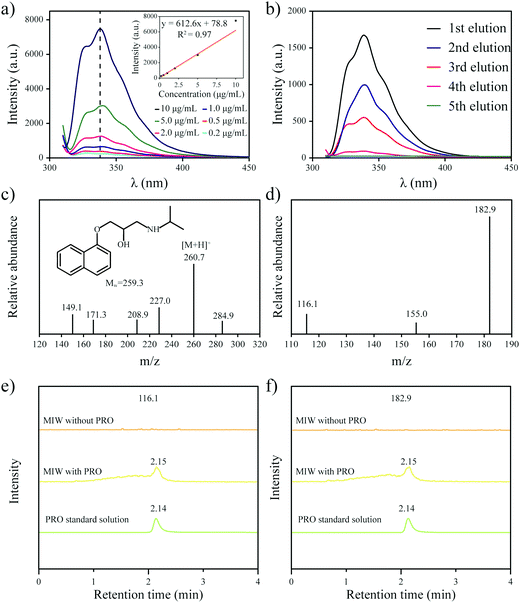
One goal of the present work is to develop an elution-free SPE process by using the merits of the MIW spheres. The MIW spheres-based SPE process is shown in Fig. 6. Because the matrix of the MIW spheres was wax, the MIW spheres (loaded with the target analytes) could be easily dissolved by the organic solvent (e.g., n-hexane) or melted by heating to 70 °C. In this case, the target analytes loading on the MIW spheres are simply released into the solution for the following instrumental analysis.The MIW spheres-based SPE process was also coupled with HPLC–MS/MS analysis. Fig. 7c is the mass spectrum of PRO in the MS detection and it shows the highest peak at an m/z of 260.7, corresponding to the PRO molecule combined with![[thin space (1/6-em)]](https://www.rsc.org/images/entities/char_2009.gif) H+. For the detection of PRO in the samples, two product ions (116.1 and 182.9 in m/z) were selected (Fig. 7d). Similar to the process in fluorescence analysis, the MIW spheres that adsorbed PRO were dissolved with n-hexane. To eliminate the potential influence of wax on instruments, the PRO in n-hexane solution was diluted with methanol 100-fold before the HPLC–MS/MS measurement. Fig. 7e and f show that no target leakage was found on the MIW spheres. After the SPE process, PRO could be successfully detected in the n-hexane solution. These results further confirmed that the MIW spheres-based SPE process had great potential in analytical chemistry.
H+. For the detection of PRO in the samples, two product ions (116.1 and 182.9 in m/z) were selected (Fig. 7d). Similar to the process in fluorescence analysis, the MIW spheres that adsorbed PRO were dissolved with n-hexane. To eliminate the potential influence of wax on instruments, the PRO in n-hexane solution was diluted with methanol 100-fold before the HPLC–MS/MS measurement. Fig. 7e and f show that no target leakage was found on the MIW spheres. After the SPE process, PRO could be successfully detected in the n-hexane solution. These results further confirmed that the MIW spheres-based SPE process had great potential in analytical chemistry.
Generally, the above two studies proved that the MIW spheres-based SPE process could be coupled with various instrumental analysis methods. Compared to the traditional MIP-based SPE method, the present MIW spheres-based SPE process simplified the process (without the need for the solvent elution of the targets). Moreover, the target bound on the MIW spheres could be completely transferred into the n-hexane solution, which was very difficult in the traditional SPE method using solvent elution.
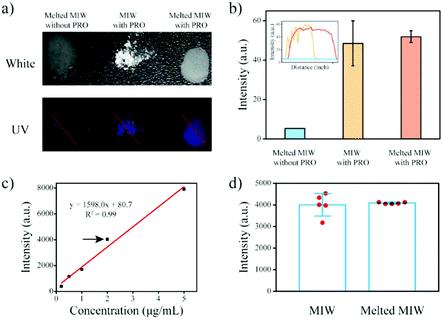
MIP particles-based solid-phase fluorescence sensors have been widely used in analytical chemistry.40,41 However, when the MIP particles bound with the targets were cast on the quartz slide, the fluorescence signal was generally not uniform (Fig. 8a and b). When a different region was selected, the detection result was different. Due to the merits of the wax, the melting wax containing the target could be homogenously cast on the slide. After cooling, the fluorescence signal of the target in the wax film was then uniform. This re-processing of the MIW spheres greatly enhanced the detection accuracy of the fluorescence sensor.
This method was also used to measure the target concentration in different samples. The results in Fig. 8c show that the fluorescence intensity of the wax film increased with the increase of the initial PRO concentration in the samples. By plotting the fluorescence intensity of the films to the initial PRO concentrations, a standard curve for the measurement of PRO in aqueous samples was obtained. Fig. 8d shows that the present MIW fluorescence sensor had a linear detection range of 0.2–5 mg L−1 with a limit of detection (LOD, S/N = 3) of 0.03 mg L−1.
Compared with the MIW spheres-based SPE coupled with fluorescence analysis, the detection accuracy of the MIW sensor was enhanced, which was mainly due to there being no need for dilution in this method.
To further confirm the enhanced detection accuracy by the re-processing, repeated detections of the fluorescence sensor with and without the re-processing were performed. Fig. 8d shows that when the MIW spheres bound with the targets were coated on the quartz slide, the fluorescence signal of PRO bound on the fluorescence sensor was 3976, 4338, 4010, 3177, and 4536 a.u., respectively. The relative error of this method was 13%. However, when the MIW spheres bound with the targets were re-processed and then cast on the quartz slide, the fluorescence signal of PRO bound on the fluorescence sensor was 4038, 4133, 4073, 4127, and 4067 a.u., respectively. The relative error of this method (with re-processing) was only 1%. This comparison demonstrated that the re-processing of the MIW spheres greatly enhanced the detection accuracy of the fluorescence sensor.
Conclusions
In this study, by using octadecanoic acid as the functional monomer and wax as the matrix, MIW spheres were successfully prepared. Characterizations showed that the MIW spheres had a diameter of ∼76 μm. The obtained MIW spheres displayed remarkable molecular recognition ability, fast rebinding kinetics, and high selectivity towards the template. Due to the excellent solubility in n-hexane, the MIW spheres realized an elution-free SPE process. Compared to a typical SPE process, the elution-free SPE process showed significance in saving the consumption of the elution solvents (more than 10-fold). Moreover, because of the simple re-processing of the MIW spheres by the change of temperature, the detection accuracy of the MIWs-based optical sensors was greatly enhanced. To the best of our knowledge, this is the first time that MIW spheres were produced. We believe the imprinting method presented in this study will open a new window in analytical chemistry.Conflicts of interest
There are no conflicts to declare.Acknowledgements
This work was supported by the National Natural Science Foundation of China (Grant number 21874050).References
- A. Azzouz, S. K. Kailasa, S. S. Lee, A. J. Rascón, E. Ballesteros, M. Zhang and K. H. Kim, TrAC, Trends Anal. Chem., 2018, 108, 347–369 CrossRef CAS.
- X. Yu and H. Yang, Food Chem., 2017, 217, 303–310 CrossRef CAS PubMed.
- V. V. Tolmacheva, V. V. Apyari, A. A. Furletov, S. G. Dmitrienko and Y. A. Zolotov, Talanta, 2016, 152, 203–210 CrossRef CAS PubMed.
- N. N. Naing, S. F. Y. Li and H. K. Lee, J. Chromatogr. A, 2015, 1426, 69–76 CrossRef CAS PubMed.
- Q. Liu, J. Shi, J. Sun, T. Wang, L. Zeng and G. Jiang, Angew. Chem., Int. Ed., 2011, 123, 6035–6039 CrossRef.
- A. Speltini, F. Maraschi, M. Sturini, M. Contini and A. Profumo, Anal. Bioanal. Chem., 2017, 409, 6709–6718 CrossRef CAS PubMed.
- C. Hu, M. He, B. Chen and B. Hu, J. Chromatogr. A, 2015, 1394, 36–45 CrossRef CAS PubMed.
- S. Li, M. Jia, H. Guo and X. Hou, Anal. Bioanal. Chem., 2018, 410, 6619–6632 CrossRef CAS PubMed.
- H. Su, Z. Wang, Y. Jia, L. Deng, X. Chen, R. Zhao and T. W. D. Chan, J. Chromatogr. A, 2015, 1422, 334–339 CrossRef CAS PubMed.
- L. Liu, W. K. Meng, Y. S. Zhou, X. Wang, G. J. Xu, M. L. Wang, J. M. Lin and R. S. Zhao, Chem. Eng. J., 2019, 356, 926–933 CrossRef CAS.
- J. X. Guo, H. L. Qian, X. Zhao, C. Yang and X. P. Yan, J. Mater. Chem. A, 2019, 7, 13249–13255 RSC.
- Y. Liu, Y. Liu, Z. Liu, F. Du, G. Qin, G. Li, X. Hu, Z. Xu and Z. Cai, J. Hazard. Mater., 2019, 368, 358–364 CrossRef CAS PubMed.
- V. Mohammadi, M. Saraji and M. T. Jafari, Microchim. Acta, 2019, 186, 1–9 CrossRef CAS PubMed.
- A. D. S. Nectoux, L. F. Medeiros, R. D. S. B. Rodrigues, R. M. D. Soares and A. N. Fernandes, J. Appl. Polym. Sci., 2019, 136, 47189 CrossRef.
- S. Dong, Q. Lou, G. Huang, J. Guo, X. Wang and T. Huang, Anal. Bioanal. Chem., 2018, 410, 7337–7346 CrossRef CAS PubMed.
- M. M. Ariffin, A. H. M. Azmi, N. M. Saleh, S. Mohamad and S. K. M. Rozi, Microchem. J., 2019, 147, 930–940 CrossRef CAS.
- Y. Sun, L. Xie, F. Feng, Q. Han, L. Wei, Z. Tang and X. Kang, J. Chromatogr. B: Anal. Technol. Biomed. Life Sci., 2020, 1159, 122358 CrossRef CAS PubMed.
- R. Zhao, L. Chu, Y. Wang, Y. Song, P. Liu, C. Li, J. Huang and X. Kang, Clin. Chim. Acta, 2017, 468, 120–125 CrossRef CAS PubMed.
- J. Wang, R. Cheng, Y. Wang, L. Sun, L. Chen, X. Dai, J. Pan, G. Pan and Y. Yan, Sens. Actuators, B, 2018, 263, 533–542 CrossRef CAS.
- H. Zhu, H. Yao, K. Xia, J. Liu, X. Yin, W. Zhang and J. Pan, Chem. Eng. J., 2018, 346, 317–328 CrossRef CAS.
- Y. Ma, J. Gao, C. Zheng and H. Zhang, J. Mater. Chem. B, 2019, 7, 2474–2483 RSC.
- C. Giovannoli, C. Passini, F. D. Nardo, L. Anfossi, C. Baggiani and I. A. Nicholls, Polymers, 2018, 10, 192 CrossRef PubMed.
- Q. D. Huang, C. H. Lv, X. L. Yuan, M. He, J. P. Lai and H. Sun, Sens. Actuators, B, 2021, 328, 129000 CrossRef CAS.
- K. Golker, G. D. Olsson and I. A. Nicholls, Eur. Polym. J., 2017, 92, 137–149 CrossRef CAS.
- Y. Ma, G. Pan, Y. Zhang, X. Guo and H. Zhang, Angew. Chem., Int. Ed., 2013, 125, 1551–1554 CrossRef.
- M. Liu, J. Pi, X. Wang, R. Huang, Y. Du, X. Yu, W. Tan, F. Liu and K. J. Shea, Anal. Chim. Acta, 2016, 932, 29–40 CrossRef CAS PubMed.
- T. Saeki, E. Takano, H. Sunayama, Y. Kamon, R. Horikawa, Y. Kitayama and T. Takeuchi, J. Mater. Chem. B, 2020, 8, 7987–7993 RSC.
- M. Arabi, A. Ostovan, A. R. Bagheri, X. Guo, L. Wang, J. Li, X. Wang, B. Li and L. Chen, TrAC, Trends Anal. Chem., 2020, 128, 115923 CrossRef CAS.
- Q. Yang, J. Li, X. Wang, H. Peng, H. Xiong and L. Chen, Biosens. Bioelectron., 2018, 112, 54–71 CrossRef CAS PubMed.
- G. D. Jayasinghe and A. Moreda-Piñeiro, Separations, 2021, 8, 99 CrossRef CAS.
- R. Yang, D. Li, S. L. Salazar, Z. Rao, M. Arıcı and W. Wei, Sol. Energy Mater. Sol. Cells, 2021, 219, 110792 CrossRef CAS.
- G. Chen, Y. Su, D. Jiang, L. Pan and S. Li, Appl. Energy, 2020, 264, 114786 CrossRef CAS.
- S. Kumar, K. M. Agrawal, H. U. Khan and A. Sikora, Pet. Sci. Technol., 2004, 22, 337–345 CrossRef CAS.
- I. Krupa, G. Miková and A. S. Luyt, Eur. Polym. J., 2007, 43, 4695–4705 CrossRef CAS.
- G. Székely, E. Fritz, J. Bandarra, W. Heggie and B. Sellergren, J. Chromatogr. A, 2012, 1240, 52–58 CrossRef PubMed.
- Z. Chen, Y. Luo, C. Huang and X. Shen, Chem. Eng. J., 2021, 414, 128914 CrossRef CAS.
- L. Wan, H. Liu, C. Huang and X. Shen, J. Mater. Chem. A, 2020, 8, 25931–25940 RSC.
- Z. Chen, X. Liu, C. Huang, J. Li and X. Shen, ACS Appl. Mater. Interfaces, 2020, 12, 6615–6626 CrossRef CAS PubMed.
- Z. Lin, Z. Xia, J. Zheng, D. Zheng, L. Zhang, H. Yang and G. Chen, J. Mater. Chem., 2012, 22, 17914–17922 RSC.
- B. Li, Z. Zhang, J. Qi, N. Zhou, S. Qin, J. Choo and L. Chen, ACS Sens., 2017, 2, 243–250 CrossRef CAS PubMed.
- Y. Li, W. He, Q. Peng, L. Hou, J. He and K. Li, Food Chem., 2019, 287, 55–60 CrossRef CAS PubMed.
| This journal is © The Royal Society of Chemistry 2022 |

