 Open Access Article
Creative Commons Attribution 3.0 Unported Licence
Recyclable nanoparticles based on a boronic acid–diol complex for the real-time monitoring of imprinting, molecular recognition and copper ion detection†
Xiaoting
Xue
,
Man
Zhang
,
Haiyue
Gong‡
and
Lei
Ye
 *
*
Division of Pure and Applied Biochemistry, Department of Chemistry, Lund University, Box 124, Lund 221 00, Sweden. E-mail: lei.ye@tbiokem.lth.se; Tel: +46 46 2229560
First published on 11th November 2021
Abstract
Molecularly imprinted polymers (MIPs) have now become one of the most remarkable materials in the field of molecular recognition. Although many efforts have been made to study the process and mechanism of molecular imprinting, it has not been possible to monitor the interactions between the template and the growing polymer chains under real-time experimental conditions. The behavior of the template–monomer complex during the whole polymerization process has remained largely unknown. In this work, we introduce a fluorescence technique that allows monitoring of the template–functional monomer complex during an actual imprinting process, as well as the real-time signaling of template binding and dissociation from the imprinted polymer. For the first proof-of-principle, we select Alizarin Red S (ARS) and 4-vinylphenylboronic acid as the template and functional monomer, respectively, to synthesize MIP particles via precipitation polymerization. As the formation of the template–functional monomer complex leads to strong fluorescence emission, it allows the status of the template binding to be monitored throughout the whole reaction process in real time. Using the same fluorescence technique, the kinetics of template binding and dissociation can be studied directly without particle separation. The hydrophilic MIP particles can be used as a scavenger to remove ARS from water. In addition, the MIP particles can be used as a recyclable sensor to detect Cu ions. As the Cu ion forms a stable complex with ARS, it causes ARS to dissociate from the MIP nanoparticles, leading to effective fluorescence quenching. The non-separation analytical method based on fluorescence measurement provides a convenient means to study molecular imprinting reactions and the kinetics of molecular recognition using imprinted polymers. The recyclable nanoparticle sensor allows toxic Cu ions to be detected directly in water in the range of 0.1–100 μM with a recovery of 84–95%.
1 Introduction
The molecular imprinting technique provides an effective approach to preparing tailor-made polymer materials with a functional performance similar to antibodies and enzymes.1,2 Over the past years, the configurations of molecularly imprinted polymers (MIPs) have shifted from bulk polymers to nanoparticles,3,4 and the compatibility of MIPs with aqueous solvents has been improved greatly.5,6 These developments, together with advances in post-imprinting modifications,7,8 have enabled MIPs to be applied not only in solid-phase extraction9 and chemical sensing10 but also as substitutes for biological receptors,11 enzyme-like catalysts12 and drug-delivery vehicles.13,14 Fundamental studies on molecular imprinting have contributed to a better understanding of the formation mechanisms of molecular-recognition sites in MIPs, and have provided useful guidance for the design of better-performing MIPs.14 Most of the studies have been based on in silico strategies, electronic structure methods and molecular dynamics simulations to study molecular interactions in pre-polymerization mixtures.15,16 In some cases, the results of computational methods have been validated using experimental analysis of the molecular imprinting system.17–19 Due to the complicated nature of the radical polymerization process, almost all in silico studies have focused on the pre-polymerization mixture, and it is difficult to use computer simulation to study molecular complexes during a real molecular imprinting polymerization process. Except for a few attempts to study the status of a template–functional monomer complex prior to the gelation point, monitoring the whole process of molecular imprinting using an experimental technique has remained a big challenge.20,21In this work, we aim to develop a fluorescence technique that allows the monitoring of template–functional monomer complexation in real time during a molecular imprinting polymerization process. The choice of fluorescence to monitor the molecular complex is based on the feasibility of measurements in both homogeneous solutions and heterogeneous particle suspensions, two situations that correspond to the initial and final stages of molecular imprinting in the precipitation polymerization system.22,23 To enable the direct detection of the optical signal, it is necessary that a template–functional monomer complex emits a unique fluorescence. This requirement can be met if the complexation between the template and the functional monomer is a fluorogenic reaction,24 or if a fluorescent template and a fluorescent functional monomer can establish effective fluorescence resonance energy transfer (FRET).10 In either way, fluorescence emission at a selected wavelength can be used to reveal the status of molecular complexation. For the first proof-of-principle, we selected Alizarin Red S (ARS) as a model template, and 4-vinylphenylboronic acid (VPBA) as the functional monomer to synthesize MIP particles via precipitation polymerization. It is known that ARS can react with boronic acid in an aqueous solution to form a fluorescent adduct,25,26 and that the boronate ester bond can be cleaved easily, either by adjusting the pH or by introducing a competing cis-diol. ARS has been used previously as an optical reporter to investigate molecular conjugation between boronic acids and cis-diols.27,28 Bearing the fluorogenic molecular complexation in mind, we considered that covalent molecular imprinting using ARS and a boronic acid monomer would be a suitable model to demonstrate the feasibility of the real-time monitoring of molecular imprinting reactions. As an anthraquinone dye, ARS has been extensively used in the textile industry. It is extremely resistant to degradation, owing to its fused aromatic structure, and can cause a serious threat to aquatic ecosystems and human health.29 Apart from gaining mechanistic information on the molecular imprinting reaction, imprinting against ARS also provides an affinity adsorbent for this synthetic dye, offering a new approach for the effective removal of ARS from environmental water.
Copper is an important metal that is present in trace amounts in the human body. However, excess copper is toxic. According to the World Health Organization and the Environmental Protection Agency of the United States, the concentration of copper in drinking water must not exceed 1–2 ppm.30,31 To monitor Cu2+ ions in aqueous samples, analytical methods based on metal–organic frameworks, nanochannel membranes and conjugated polymers have been developed.32–35 As ARS is known to form a stable complex with Cu2+,36,37 we envisaged that such complexation may deplete ARS from the MIP particles to quench the characteristic fluorescence. In this manner, the MIP particles can be used as a recyclable sensor to detect Cu2+, a metal ion that must be controlled to be below the ppm level to avoid toxicity to humans.
2 Experimental
2.1 Reagents and instruments
N,N-Methylenebis(acrylamide) (MBA), 4-vinylphenylboronic acid (VPBA), Alizarin Red S (ARS), ammonium persulfate (APS), N,N,N′,N′-tetramethylethylenediamine (TEMED), CuSO4, anthraflavic acid (AFA) and nicotinamide adenine dinucleotide (NADH) were purchased from Sigma-Aldrich (Dorset, UK) and used without further purification. All buffers and solutions were prepared using purified water from a Milli-Q water purification system (Millipore Corp., Bedford, USA). The copper assay kit was purchased from Sigma-Aldrich (Dorset, UK).The hydrodynamic diameters of the particles were measured via dynamic light scattering (DLS) using a temperature-controlled particle-size analyzer (Zetasizer Nano ZS, Malvern Instruments, UK). The functional groups in the polymers were analyzed using a Thermo Fisher Scientific FT-IR instrument (Thermo Fisher Scientific Inc., Waltham, USA). All spectra were collected at room temperature from 16 scans in the 4000–550 cm−1 region with a resolution of 4 cm−1. Fluorescence measurements were performed using a Cary Eclipse Fluorescence Spectrophotometer (Agilent Technologies, USA). All measurements were performed using the following parameters: Ex = 469 nm, Em = 500–750 nm. The voltage of the photomultiplier tube was set to medium, and the speed of scan was set to medium. The slit of the excitation and emission beam was 5 nm. UV-Vis spectrometry was carried out using a Cary 60 UV-vis spectrophotometer (Agilent Technologies, USA).
2.2 Synthesis of molecularly imprinted nanoparticles
To a glass tube, MBA (1.2 mmol, 185 mg) and ARS (0.02 mmol, 7.2 mg) were first dissolved in 8 mL of 20 mM phosphate buffer (pH 8.5). VPBA (0.1 mmol, 15 mg) dissolved in 2 mL ethanol was then added to the solution. The polymerization solution was purged with nitrogen for 10 min at 40 °C before APS (20 mg) and TEMED (25 μL) were added. After another 5 min of purging with nitrogen gas, the tube was sealed and the reaction mixture was stirred at 40 °C for 24 h. After the reaction, the particles were collected by centrifugation, and washed with water and ethanol to remove the unreacted reagents. Subsequently, ARS was removed from the polymer by washing with acetic acid (2 M in water) until the supernatant became colorless, and then with ethanol containing 10% acetic acid (v/v) until the supernatant became colorless. The particles were finally washed with ethanol three times, and dried in a vacuum desiccator. A non-imprinted polymer (NIP) was prepared in the same way but without ARS in the pre-polymerization mixture.2.3 In situ monitoring of the molecular imprinting process
MBA (1.2 mmol, 185 mg) and ARS (0.02 mmol, 7.2 mg) were first dissolved in 8 mL of 20 mM phosphate buffer (pH 8.5). VPBA (0.1 mol, 15 mg) dissolved in 2 mL ethanol was then added to the solution. From this solution, 2 mL was transferred into a cuvette equipped with a magnetic stirrer bar, and purged with nitrogen for 5 min. After the addition of APS (4 mg) and TEMED (5 μL), the solution was purged with nitrogen gas for 5 min and sealed. The cuvette was put into a spectrofluorometer that has a temperature controlling system to maintain the cuvette temperature at 40 °C. The fluorescence spectrum was recorded continuously every 1 min for 180 min.2.4 Binding of ARS by MIP particles
MIP particles were suspended in 20 mM phosphate buffer (pH 8.5) via sonication to give a final concentration of 1 mg mL−1. In a series of 2 mL microcentrifuge tubes, the particle suspension (0.5 mL) was mixed with ARS (0.5 mL) of different concentrations prepared in 20 mM phosphate buffer (pH 8.5). The samples were shaken gently using a rocking table at room temperature for 1 h. After this step the samples were centrifuged. The free ARS in the supernatant was measured using UV-vis spectrometry. For comparison, the NIP particles were used as the control and were tested using the same procedure.2.5 Monitoring the binding and release of ARS
MIP and NIP particle suspensions (0.5 mL, 1 mg mL−1) were transferred to a cuvette equipped with a magnetic stirrer. The cuvette was put into a spectrofluorometer. After adding 0.5 mL of ARS solution (0.2 mM, prepared in 20 mM phosphate buffer, pH 8.5), the fluorescence spectrum of the particle suspension was recorded every 0.5 min for 60 min. After this step, 180 mg of fructose was added to the cuvette, and the fluorescence spectrum was recorded every 1 min for 180 min.2.6 Detection of Cu2+ ions using MIP particles
MIP particles were suspended in 20 mM phosphate buffer (pH 8.5) via sonication to give a final particle concentration of 1 mg mL−1. In a series of 2 mL microcentrifuge tubes, 0.5 mL of the particle suspension was mixed with 0.5 mL of CuSO4 solution. After the samples were shaken gently using a rocking table at room temperature for 2 h, the fluorescence spectra of the samples were recorded.The concentration of Cu2+ in spiked rainwater (collected on March 15, 2021 in Lund, Sweden) and in tap water was determined using the above fluorescence measurement method. For comparison, the concentrations of Cu2+ in the spiked samples were also measured using the commercial copper assay kit.
2.7 Detection of Cu2+ ions using recycled MIP particles
After their first use for the detection of Cu2+, the MIP particles were mixed with 20 mL of 0.5% EDTA to remove the Cu2+. The particles were then washed with water thoroughly and dried in a vacuum desiccator. The MIP particles were re-suspended in 20 mM phosphate buffer (pH 8.5) to measure the capacity of ARS binding. To evaluate the regenerated MIP particles for the detection of Cu2+, the MIP particles (20 mg) were added to 20 mL of 1 mM ARS solution and shaken overnight to load ARS. The particles were washed thoroughly with phosphate buffer (pH 8.5) and dried in a vacuum desiccator before being used to detect Cu2+.3 Results and discussion
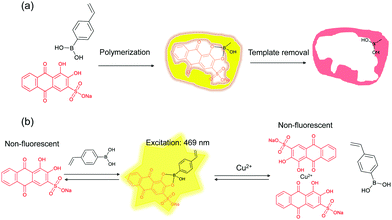
The general principle of molecular imprinting is based on the formation of a template–functional monomer complex using a cross-linking polymerization system.38,39 The imprinting effect mainly depends on the strength of the molecular interaction between the functional monomer and the template.21 Recently, Piletsky and co-workers proposed imprinting as a result of the dynamic interaction of oligomers and protoparticles with molecular template.40 To gain further detailed insight into the mechanism of molecular imprinting, it is essential to have a simple and practical method for monitoring, in real time, the complexation between the template and the functional monomer/oligomer/cross-linked particles. Scheme 1a shows the route for preparing ARS-imprinted polymer particles. VPBA was used as the functional monomer and MBA as the cross-linking monomer. A redox initiator APS/TEMED was used to initiate the polymerization in phosphate buffer containing ethanol. Scheme 1b shows the formation of a fluorescent adduct caused by the template–functional monomer binding, and quenching of the fluorescence caused by the Cu2+ ion due to dissociation of the ARS–boronic acid complex.3.1 Characterization of MIP particles
DLS was used to measure the hydrodynamic diameter of the MIP and NIP particles. DLS measurements were carried out using different particle concentrations. As shown in Fig. 1a and Table S1 (ESI†), the diameter of the MIP particles decreased from 428 nm to 263 nm, and the polydispersity index (PDI) decreased from 0.360 to 0.126 when the particle concentration was changed to 0.2 and 0.02 mg mL−1. For the NIP particles in Fig. 1b, the particle diameter was found to be around 650 nm with a PDI of 0.11. From the SEM images (Fig. S1, ESI†), it was difficult to determine the size of MIP and NIP particles due to serious aggregation.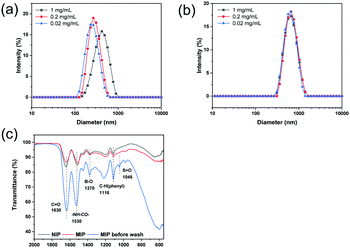 | ||
| Fig. 1 Hydrodynamic particle size of MIP (a) and NIP (b) measured using DLS in deionized water. (c) FT-IR spectra of NIP particles, and MIP particles before and after washing. | ||
In Fig. 1c, the FTIR spectra of the MIP and NIP particles are presented. It is easy to find the characteristic bands corresponding to VPBA and MBA in the polymer samples. The IR band at 1370 cm−1 was assigned to B–O stretching, and the band at 1116 cm−1 (C–H stretching) was caused by the stretching of the benzene ring in VPBA. The characteristic absorbance of the amide group from MBA was found at 1630 cm−1 (C–O stretching) and 1530 cm−1 (–NH–CO– stretching). The above results confirmed that VPBA and MBA have been copolymerized to form the particles. For the MIP particles before washing, an IR band at 1046 cm−1 arising from the S![[double bond, length as m-dash]](https://www.rsc.org/images/entities/char_e001.gif) O group in ARS was observed. This IR band disappeared after the template ARS was removed from the MIP particles.
O group in ARS was observed. This IR band disappeared after the template ARS was removed from the MIP particles.
3.2 Confirmation of molecular imprinting effect
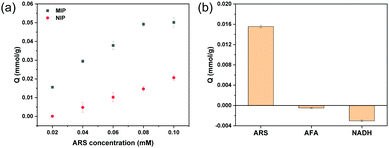
Fig. 2a shows the binding of ARS by MIP and NIP particles measured using different initial ARS concentrations (from 0.02 to 0.1 mM). At all the ARS concentrations, the amount of ARS binding on the MIP particles was higher than on the NIP particles. The maximum capacity of the MIP toward ARS (∼50 μmol g−1) was higher than for the NIP (∼20 μmol g−1). These results indicate that more molecular recognition sites were created in the MIP by involving ARS in the polymerization process. Using AFA as a structural analogue of ARS and NADH as a cis-diol compound, the selectivity of the target binding by the MIP was tested. AFA has a dihydroxyanthraquinone structure and its molecular size is almost the same as ARS. This fact makes AFA a useful reference molecule for evaluating the importance of the cis-diol structure for molecular binding to the imprinted cavities. NADH contains a cis-diol moiety that is similar to ARS but NADH lacks the dihydroxyanthraquinone structure. Using NADH as a reference molecule allows us to study any non-specific binding caused by random boronic acid outside the imprinted cavities. As shown in Fig. 2b, the MIP exhibited no binding for AFA and NADH, indicating that the MIP demonstrates high selectivity for ARS.3.3 Kinetics of ARS binding studied via fluorescence measurements
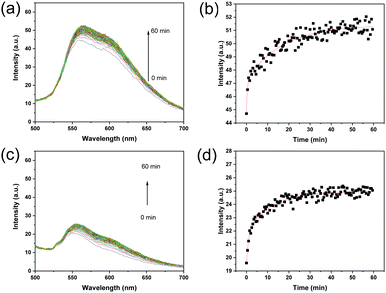
Based on the fact that the fluorescence intensity increases when ARS forms an adduct with boronic acid, we expected that the kinetic recognition of ARS by MIP particles can be studied using a separation-free fluorescence assay. Therefore, the intensity of the fluorescence of the MIP particles after mixing with ARS was measured at different times, and the result was used to calculate the rate of ARS binding. As shown in Fig. 3a, the fluorescence intensity of the MIP particles increased with time, and eventually reached equilibrium after 60 min of incubation with ARS. Fig. 3b shows clearly that the intensity at 560 nm increased with time and reached equilibrium after 60 min. In the initial stage, the amount of ARS bound increased quickly. After 5 min, the binding of ARS by the MIP increased more slowly. As a comparison, the NIP was measured using the same procedure, and the fluorescence emission also increased after the addition of ARS, and reached equilibrium within 60 min (Fig. 3c and d).To study the kinetics of ARS binding with the MIP and NIP, the experimental data in Fig. 3 were fitted using a two-phase exponential association model (eqn (1)):41,42
| I = I0 + aB1(1 − e−kobs1t) + aB2(1 − e−kobs2t) | (1) |
| Polymer | k obs1 (min−1) | B 1 (μmol g−1) | k obs2 (min−1) | B 2 (μmol g−1) | a (g μmol−1) |
|---|---|---|---|---|---|
| MIP | 2.27 | 19.5 | 0.058 | 31.5 | 0.132 |
| NIP | 0.91 | 9.45 | 0.0793 | 11.2 | 0.262 |
In Fig. 3c, the fluorescence signal observed from the NIP at the very beginning was caused by the very fast binding of ARS to the polymer particles. As shown in Fig. S2a (ESI†), before the addition of ARS, the NIP particles themselves were not fluorescent. The nearly instantaneous emission of fluorescence from the NIP particles after the addition of ARS indicates that the surface-exposed boronic acid on the NIP particles reacted with ARS very rapidly (within a few seconds while the sample cuvette was transferred to the fluorometer). For the MIP particles exposed to ARS, the initial fluorescence intensity was actually slightly lower than MIP particles alone (Fig. S2b, ESI†), due to the UV-vis absorption of ARS in the range of 400–600 nm. The background fluorescence of the MIP particles was due to the residual template that has not been completely removed during the particle purification.
3.4 Displacement of ARS from MIP by fructose
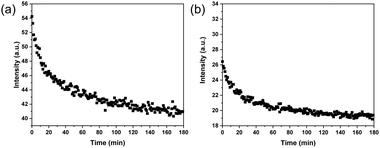
Considering the dynamic nature of the boronate ester bond, it should be possible to release the ARS that has been loaded on the MIP particles by introducing a cis-diol compound, e.g., fructose. When fructose is added, it is able to form a boronate ester bond with boronic acid because fructose contains a similar cis-diol structure to ARS. The formation of the boronic acid–fructose complex causes ARS to dissociate from boronic acid, thereby leading to fluorescence quenching. The displacement of ARS can be monitored by measuring the fluorescence intensity change. In this regard, after the ARS–MIP binding has reached equilibrium, fructose at a high concentration was added to the MIP particle suspension. Fig. 4a shows the fluorescence spectra of the particles after the addition of fructose. It is obvious that the fluorescence intensity decreased with time and eventually reached equilibrium. While the process of ARS binding to the MIP particles took 60 min to reach equilibrium, the displacement of ARS from the MIP by fructose lasted 180 min. When the binding and displacement curves are overlaid, as shown in Fig. S3a (ESI†), it becomes clear that addition of fructose caused the fluorescence intensity to decrease even after the original signal from the MIP particles was reached. The additional ARS released from the MIP particles is due to the residual template that has not been removed during the purification of the initial MIP particles. For the NIP particles, addition of fructose also caused the fluorescence intensity to decrease (Fig. 4b). However, after the original fluorescence intensity was reached, no further signal reduction was observed (Fig. S3b, ESI†).3.5 Monitoring the molecular imprinting process in real time
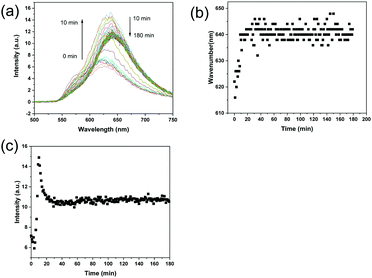
In a previous study, the nucleation and growth of imprinted polymer particles in precipitation polymerization was monitored using DLS.21 The DLS analysis revealed that the nucleation of propranolol-imprinted polymer particles and the formation of imprinted sites occurred in the early stages of the imprinting reaction. In this work, because the fluorescence signals from the ARS–VPBA adduct and the ARS-oligomers containing VPBA can be easily detected, we conceived that it should be possible to monitor in real time the status of the complexation of the template–functional monomer and template–polymer chains during the molecular imprinting process. As shown in Fig. S4 (ESI†), when measured separately in the reaction solvent, MBA, VPBA and ARS themselves did not have a fluorescence emission (excitation at 469 nm). A mixture of VPBA and MBA did not show any fluorescence either. As expected, only the mixture composed of VPBA, MBA and ARS showed a clear fluorescence emission at around 620 nm. This result indicates that the fluorescence emission was caused by the ARS–VPBA adduct, and was not affected by MBA. Interestingly, the emission spectrum of the VPBA–ARS complex (with a maximum emission at 620 nm) was different from the results of MIP particles treated with a low concentration of ARS (Fig. 3a), where the maximum emission occurred at 560 nm. In Fig. 3a, the concentration of ARS was 0.1 mM while the concentration of ARS in Fig. S4 (ESI†) was 2 mM, the same as used in the actual molecular imprinting reaction. To understand the reason for the longer wavelength emission of the VPBA–ARS complex at the higher concentration, we measured the emission spectra of the VPBA–ARS solution after series dilution with the imprinting solvent. As shown in Fig. S5 (ESI†), in the low concentration range, the emission of the VPBA–ARS solution centered around 560 nm and the emission intensity increased with concentration. In the high concentration range, however, the emission band was red-shifted to 620 nm, accopanied by a reduced intensity. The concentration-dependent red shift of the fluorescence most likely resulted from a transition of VPBA–ARS complex from monomer to dimer or aggregate structures.43,44 The fluorescence bands at 560 nm and 620 nm therefore represented the monomer and dimer/aggregate emissions, respectively. The reduction in emission intensity caused by the high concentration was due to the inner filter effect that is well known in fluorescence spectrometry.45,46Fig. 5a shows the change in the fluorescence spectrum of the polymerization mixture after the imprinting reaction started at 40 °C. As shown in Fig. 5b, the maximum emission wavelength increased from 620 nm to 640 nm within the first 20 min of polymerization, suggesting that the boronic acid-bound ARS was located in the imprinted sites increasingly as dimer or aggregate structures. Because of the polycyclic aromatic structure of the VPBA–ARS complex, the formation of stacked dimer or aggregate structures is favored in aqueous solvent, particularly in concentrated solution as used in the imprinting reaction. Template–template aggregation in molecular imprinting has been discussed in previous studies.47,48 The change in fluorescence intensity of the reaction mixture (at 630 nm) is shown in Fig. 5c. In the first 10 min, the fluorescence intensity increased, presumably due to the reduced molecular motion of the boronic acid–ARS complex when the functional monomer was linked to the growing oligomers. After 10 min of polymerization, the fluorescence intensity started to decrease until it became constant. The reduction in fluorescence intensity may be attributed to the scattering of light by the emerging insoluble particles. The variation of the fluorescence wavelength and intensity within the first 20 min of the reaction is in agreement with our previous study,21 confirming that particle nucleation and the formation of molecular binding sites took place in the early stages of the imprinting reaction. For comparison, the polymerization process for NIP was also monitored using the same fluorescence measurements. As expected, the reaction mixture for the NIP did not emit fluorescence during the whole polymerization process (Fig. S6, ESI†).
3.6 Detection of Cu2+ ions using MIP particles as a fluorescent probe
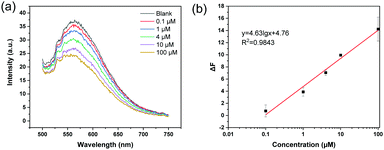
Given that the MIP nanoparticles have imbedded boronic acid groups and a high affinity for ARS, we considered it possible to use the colloidal particles with bound ARS as a fluorescent probe to detect analytical targets in a competitive manner. As a first example, the florescent MIP was used for the detection of Cu2+, since the metal ion is able to form a coordination complex with ARS, leading to the depletion of ARS from the MIP particles and fluorescence quenching. In this way the MIP particles can be used as a recyclable probe in fluorescence assays. Fig. 6 shows the fluorescence quenching caused by different concentrations of Cu2+ (0.1–100 μM) in water. In this experiment, the probe was dispersed in 20 mM phosphate buffer (pH 8.5), and the excitation wavelength was 469 nm. Fig. 6a shows the fluorescence emission spectra obtained by adding different concentrations of Cu2+ to the detection system. The fluorescence intensity gradually decreased when the Cu2+ concentration was increased. Fig. 6b shows a linear correlation between the fluorescence intensity and the logarithm of the Cu2+ concentration in the range of 0.1–100 μM.To confirm that the fluorescence detection can be carried out at a lower pH, the MIP particles were dispersed in 20 mM MES buffer (pH 6.8) to detect Cu2+. As shown in Fig. S7 (ESI†), the change in the fluorescence intensity caused by different concentrations of Cu2+ also exhibited a linear correlation in the semi-logarithmic plot.
3.7 Reusability and selectivity of MIP particles for Cu2+ detection
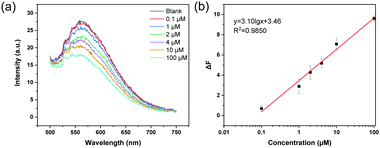
To verify that the MIP particles can be used as recyclable sensor for metal ion detection, the MIP particles that have been used to detect Cu2+ were collected and washed with EDTA solution. The polymer particles obtained were then loaded with ARS and dried to give ARS-loaded MIP particles. In Fig. S8 (ESI†), the fluorescence emission spectra of MIP, MIP after use and treatment with EDTA, and ARS-loaded MIP particles are presented. The fluorescence emission of the EDTA-treated MIP is lower than for MIP, indicating that the residual ARS in the original MIP has been removed. After loading ARS onto the EDTA-treated MIP particles, the fluorescence intensity was restored. This result indicates that the boronic acid group in the MIP particles was intact during the analytical detection of Cu2+. To prove that the ARS-loaded MIP can be reused for detecting Cu2+, the ARS-loaded MIP was dispersed in 20 mM phosphate buffer (pH 8.5) to investigate the fluorescence response to Cu2+. As shown in Fig. 7, using ARS-loaded MIPs as the regenerated fluorescent probe, the metal ions can be measured in the same concentration range as was achieved using the original MIP particles.3.8 Detection of Cu2+ in spiked water samples
In order to evaluate the selectivity of the MIP-based assay, the fluorescence response of MIP nanoparticles to Cu2+, Na+, Mg2+, Fe3+, Ca2+, K+, Ag+ and Zn2+ was investigated. In Fig. S9 (ESI†), the change in the fluorescence intensity of the MIP particle suspension (0.5 mg mL−1) caused by 10 μM of different metal ions in water is presented. It is clear that only Cu2+ exhibited an obvious quenching of the fluorescence. Therefore, the MIP-based fluorescent probe has a satisfactory specificity for the detection of Cu2+ in water.3.9 Detection of Cu2+ in water samples
The reliability of the proposed fluorescence method for detecting Cu2+ in real samples was studied by measuring Cu2+ in tap water and rain water. The analytical results were compared with those obtained using a commercial copper assay kit. As shown in Table 2, the recoveries of Cu2+ in the different samples were in the range of 84.0% to 126%, with a relative standard deviation (RSD) of 0.58% to 3.2%. Using the commercial copper assay kit, a chromogen was utilized to form a colored complex with the copper ions. The commercial assay kit was not able to detect Cu2+ in tap water and rainwater at the 1 μM level. By comparing with the commercial copper assay kit, we conclude that the MIP-based fluorescence assay can be used for the fast detection of Cu2+ in water.| Sample | Cu2+ conc. spiked (μM) | This method | Copper assay kit | ||||
|---|---|---|---|---|---|---|---|
| Detected (μM) | Recovery (%) | RSD (%) | Detected (μM) | Recovery (%) | RSD (%) | ||
| Tap water | 0 | 4.81 | — | 0.9 | 3.43 | — | 0.11 |
| 1 | 5.96 | 101 | 0.58 | 2.67 | — | 1.1 | |
| 10 | 17.6 | 126 | 3.16 | 12.7 | 93.1 | 1.26 | |
| Rainwater | 0 | 0.44 | — | 2.7 | 0.7 | — | 0.9 |
| 1 | 1.29 | 84 | 1.99 | −0.74 | — | 0.65 | |
| 10 | 11.1 | 94.7 | 1.95 | 10.3 | 96.6 | 0.63 | |
3.10 Repetitive adsorption of ARS and detection of Cu2+ with MIP nanoparticles
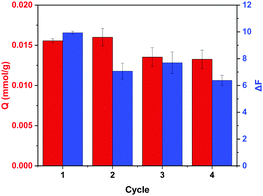
To investigate the use of MIP nanoparticles for the repetitive adsorption of ARS and the detection of Cu2+, the uptake of ARS by regenerated MIP nanoparticles and the detection of Cu2+ in aqueous solution were further studied. In the first cycle, MIP particles were used to bind ARS in water. At the same time, the same MIP particles were exposed to Cu2+ to measure the fluorescence intensity change. The uptake of ARS and the Cu2+-induced fluorescence intensity change were recorded. After the first cycle, the MIP particles that had been exposed to Cu2+ were washed with EDTA solution, and then loaded with ARS before the particles were used to measure the change in the fluorescence intensity caused by Cu2+. The uptake of ARS and the Cu2+-induced fluorescence intensity change were recorded as the results of cycle 2. Fig. 8 shows the results of ARS binding and the Cu2+-induced fluorescence intensity change obtained in the different cycles. It is obvious that ARS binding in cycle 2 was almost the same as in cycle 1, which indicates that the residual ARS in the polymer matrix did not affect the ARS binding at the 0.02 mM concentration level. The change on fluorescence for cycle 1 (ΔF1) caused by Cu2+ was due to the complexation of Cu2+ with the residual ARS in the original MIP, whereas the change in fluorescence for cycle 2 (ΔF2) was caused by the complexation of Cu2+ with the ARS re-loaded in the MIP. As the amount of residual ARS in the original MIP may not be the same as the regenerated and reloaded MIP, the measured ΔF1 and ΔF2 values are different. Nevertheless, the ΔF values measured in cycles 2–4 for the regenerated MIP appeared to be similar. The slight reduction in ARS binding and fluorescence response after the second cycle were most likely caused by the loss of polymer particles during the multiple centrifugation and decantation steps. Generally, the MIP particles prepared in this work displayed satisfactory recyclability and reusability for the adsorption of ARS and the detection of Cu2+.4 Conclusions
In this work, we demonstrated a simple, sensitive, and straightforward method to study the process of molecular imprinting using real-time fluorescence measurements. Using ARS as a model template and VPBA as the functional monomer, we have shown that the template–functional monomer complex plays an important role in realizing the specific molecular recognition of the final imprinted polymer. The molecularly imprinted sites in the model system start to form as soon as 20 min after the start of free radical polymerization. The method of mechanistic study in the present work can be extended to other molecular imprinting reactions. Besides monitoring molecular imprinting reactions, the analytical method also allowed us to study template binding and dissociation in real time, providing a convenient means of understanding the molecular recognition kinetics. The ARS-imprinted polymer can be used as a scavenger to remove ARS directly from water, and as a fluorescent probe to detect Cu2+ without any tedious sample preparation.Author contributions
Xiaoting Xue designed, performed, and validated all the experiments, and wrote the manuscript. Man Zhang and Haiyue Gong provided discussion and feedback. Lei Ye designed and supervised the project, and carried out the project administration and funding acquisition. All authors contributed to discussion of the results and approved the final version of the manuscript.Conflicts of interest
There are no conflicts to declare.Acknowledgements
This work was supported by the Swedish Research Council VR (grant number 2019-04228) and the European Commission (project RECOPHARMA, grant number 778266). Xiaoting Xue thanks the China Scholarship Council (CSC) for a PhD fellowship (award number 201906840122).References
- M. Arabi, A. Ostovan, J. Li, X. Wang, Z. Zhang, J. Choo and L. Chen, Adv. Mater., 2021, 33, 2100543 CrossRef CAS.
- K. Haupt, P. X. Medina Rangel and B. T. S. Bui, Chem. Rev., 2020, 120, 9554–9582 CrossRef CAS PubMed.
- E. V. Piletska and S. A. Piletsky, Langmuir, 2010, 26, 3783–3785 CrossRef CAS PubMed.
- F. Canfarotta, A. Cecchini and S. Piletsky, Molecularly Imprinted Polymers for Analytical Chemistry Applications, The Royal Society of Chemistry, 2018, pp. 1–27 Search PubMed.
- F. Duan, C. Chen, L. Chen, Y. Sun, Y. Wang, Y. Yang, X. Liu and Y. Qin, Ind. Eng. Chem., 2014, 53, 14291–14300 CrossRef CAS.
- W. Ji, M. Zhang, D. Wang, X. Wang, J. Liu and L. Huang, J. Chromatogr. A, 2015, 1425, 88–96 CrossRef CAS.
- M. Zangiabadi and Y. Zhao, Nano Lett., 2020, 20, 5106–5110 CrossRef CAS PubMed.
- T. Takeuchi and H. Sunayama, Chem. Commun., 2018, 54, 6243–6251 RSC.
- F. Lanza and B. Sellergren, Chromatographia, 2001, 53, 599–611 CrossRef CAS.
- Q. Li, T. Kamra and L. Ye, Chem. Commun., 2016, 52, 12237–12240 RSC.
- L. Chen, X. Wang, W. Lu, X. Wu and J. Li, Chem. Soc. Rev., 2016, 45, 2137–2211 RSC.
- G. Wulff and J. Liu, Acc. Chem. Res., 2012, 45, 239–247 CrossRef CAS PubMed.
- L. Ye and K. Mosbach, Chem. Mater., 2008, 20, 859–868 CrossRef CAS.
- H. R. Culver, J. R. Clegg and N. A. Peppas, Acc. Chem. Res., 2017, 50, 170–178 CrossRef CAS.
- I. A. Nicholls, G. D. Olsson, B. C. G. Karlsson, S. Suriyanarayanan and J. G. Wiklander, Molecularly Imprinted Polymers for Analytical Chemistry Applications, The Royal Society of Chemistry, 2018, pp. 197–226 Search PubMed.
- S. Zink, F. A. Moura, P. A. da Silva Autreto, D. S. Galvao and B. Mizaikoff, Phys. Chem. Chem. Phys., 2018, 20, 13145–13152 RSC.
- S. Piletsky, K. Karim, E. Piletska, C. Day, K. Freebairn, C. Legge and A. Turner, Analyst, 2001, 126, 1826–1830 RSC.
- J. Sánchez-González, Á. Peña-Gallego, J. Sanmartn, A. M. Bermejo, P. Bermejo-Barrera and A. Moreda-Piñeiro, Microchem. J., 2019, 147, 813–817 CrossRef.
- W. Dong, M. Yan, M. Zhang, Z. Liu and Y. Li, Anal. Chim. Acta, 2005, 542, 186–192 CrossRef CAS.
- F. Lanza, M. Rüther, A. Hall, C. Dauwe and B. Sellergren, MRS Online Proc. Libr., 2002, 723, 93–103 CAS.
- Y. Long, J. Y. Philip, K. Schillen, F. Liu and L. Ye, J. Mol. Recognit., 2011, 24, 619–630 CrossRef CAS PubMed.
- L. Ye, P. A. Cormack and K. Mosbach, Anal. Commun., 1999, 36, 35–38 RSC.
- K. Yoshimatsu, K. Reimhult, A. Krozer, K. Mosbach, K. Sode and L. Ye, Anal. Chim. Acta, 2007, 584, 112–121 CrossRef CAS PubMed.
- K. M. Ahsan Uddin and L. Ye, J. Appl. Polym, 2013, 128, 1527–1533 CAS.
- G. Springsteen and B. Wang, Chem. Commun., 2001, 1608–1609 RSC.
- Z. Xu, K. M. A. Uddin, T. Kamra, J. Schnadt and L. Ye, ACS Appl. Mater. Interfaces, 2014, 6, 1406–1414 CrossRef CAS.
- H. Gong, W. Liu, M. Carlquist and L. Ye, ChemBioChem, 2019, 20, 2991–2995 CrossRef CAS PubMed.
- H. Zheng, H. Gong, L. Cao, H. Lin and L. Ye, Colloids Surf., B, 2021, 197, 111433 CrossRef CAS PubMed.
- Z. Zhang, H. Chen, W. Wu, W. Pang and G. Yan, Bioresour. Technol., 2019, 293, 122100 CrossRef CAS.
- P. Dalton, Toxicology of the Nose and Upper Airways, CRC Press, 2016, pp. 215–241 Search PubMed.
- Q. Yan, Z.-H. Chen, S.-F. Xue, X.-Y. Han, Z.-Y. Lin, S. Zhang, G. Shi and M. Zhang, Sens. Actuators, B, 2018, 268, 108–114 CrossRef CAS.
- J. Chen, H. Chen, T. Wang, J. Li, J. Wang and X. Lu, Anal. Chem., 2019, 91, 4331–4336 CrossRef CAS PubMed.
- H. Gao, R. Sun, L. He, Z.-J. Qian, C. Zhou, P. Hong, S. Sun, R. Mo and C. Li, ACS Appl. Mater. Interfaces, 2020, 12, 4849–4858 CrossRef CAS.
- T. Wang, N. Zhang, W. Bai and Y. Bao, Polym. Chem., 2020, 11, 3095–3114 RSC.
- Y. L. Pak, Y. Wang and Q. Xu, Coord. Chem. Rev., 2021, 433, 213745 CrossRef CAS.
- Y. Sasaki, T. Minamiki, S. Tokito and T. Minami, Chem. Commun., 2017, 53, 6561–6564 RSC.
- H. Wu and L. Jin, J. Mater. Chem. C, 2016, 4, 3415–3421 RSC.
- G. Wulff, W. Vesper, R. Grobe-Einsler and A. Sarhan, Makromol. Chem., 1977, 178, 2799–2816 CrossRef CAS.
- R. Arshady and K. Mosbach, Makromol. Chem., 1981, 182, 687–692 CrossRef CAS.
- T. Cowen, E. Stefanucci, E. Piletska, G. Marrazza, F. Canfarotta and S. A. Piletsky, Macromolecules, 2020, 53, 1435–1442 CrossRef CAS.
- H. Motulsky and A. Christopoulos, Fitting models to biological data using linear and nonlinear regression: A practical guide to curve fitting, Oxford University Press, San Diego, NY, 2004 Search PubMed.
- G. S. Sittampalam, A. Grossman, K. Brimacombe, M. Arkin, D. Auld, C. P. Austin, J. Baell, B. Bejcek, J. M. Caaveiro, T. D. Chunget al., Assay guidance manual [Internet], Eli Lilly & Company and the National Center for Advancing Translational Sciences, 2004 Search PubMed.
- S. Long, W. Chi, L. Miao, Q. Qiao, X. Liu and Z. Xu, Chin. Chem. Lett., 2019, 30, 601–604 CrossRef CAS.
- A. Córdoba, I. Magario and M. L. Ferreira, J. Mol. Catal. A: Chem., 2012, 355, 44–60 CrossRef.
- J. Kimball, J. Chavez, L. Ceresa, E. Kitchner, Z. Nurekeyev, H. Doan, M. Szabelski, J. Borejdo, I. Gryczynski and Z. Gryczynski, Methods Appl. Fluoresc., 2020, 8, 033002 CrossRef CAS.
- L. Ceresa, J. Kimball, J. Chavez, E. Kitchner, Z. Nurekeyev, H. Doan, J. Borejdo, I. Gryczynski and Z. Gryczynski, Methods Appl. Fluoresc., 2021, 9, 035005 CrossRef CAS.
- B. C. Karlsson, J. OMahony, J. G. Karlsson, H. Bengtsson, L. A. Eriksson and I. A. Nicholls, J. Am. Chem. Soc., 2009, 131, 13297–13304 CrossRef CAS PubMed.
- I. Yungerman and S. Srebnik, Chem. Mater., 2006, 18, 657–663 CrossRef CAS.
Footnotes |
| † Electronic supplementary information (ESI) available: Experimental results of fluorescence measurements, selectivity of fluorescence assay for metal ions. See DOI: 10.1039/d1tb02226a |
| ‡ Present address: Center for Synthesis and Analysis, Department of Chemistry, Lund University, Box 124, Lund 22100, Sweden. |
| This journal is © The Royal Society of Chemistry 2022 |

