 Open Access Article
Capture and electrochemical conversion of CO2 in molten alkali metal borate–carbonate blends†
Lev
Bromberg
a,
Michael P.
Nitzsche
b and
T. Alan
Hatton
 *a
*a
aDepartment of Chemical Engineering, Massachusetts Institute of Technology, 77 Massachusetts Avenue, Cambridge, MA 02139, USA. E-mail: tahatton@mit.edu
bDepartment of Mechanical Engineering, Massachusetts Institute of Technology, 77 Massachusetts Avenue, Cambridge, MA 02139, USA
First published on 30th August 2022
Abstract
A family of blended compositions of molten mixed lithium and sodium borate (Li1.5Na1.5BO3) and eutectic lithium–potassium carbonate (Li1.24K0.76CO3) salts has been introduced as reversible carbon dioxide absorbents and as media for CO2 electrolysis for carbon conversion. Material properties, temperature effects and kinetics of CO2 uptake were examined. Li, Na borate can absorb up to 7.3 mmol g−1 CO2 at 600 °C. The blended borate–carbonate compositions are molten in the 550–600 °C temperature range, with viscosity adjustable to within a 10–1000 Pa s window depending on the borate/carbonate ratio. The blends can withstand cyclic temperature and CO2 pressure swings without significant deterioration of their CO2 uptake capabilities. Addition of eutectic carbonate into mixed Li, Na borate salts lowers overall CO2 uptake due to the lower solubility of CO2 in carbonate. However, addition of the eutectic lowers the temperature of the pressure swing operation and dramatically accelerates the CO2 uptake during the initial stage of the absorption, potentially enabling a faster cycling. Electroreduction of CO2 and carbon deposition on a galvanized steel cathode was more effective with increasing carbonate fraction in the molten alkali borate/carbonate blend. Blended borate/carbonate compositions with 50–60% borate content possessed sufficiently high loading capacity for CO2 and simultaneously enabled maximum carbon product yield and Coulombic efficiency. Most of the recovered carbon product was shown to be in the form of multiwalled carbon nanotube.
Introduction
Efficient capture and conversion of carbon dioxide (CO2) is a key pathway toward achieving carbon neutrality of the carbon-producing processes, which is now an imperative accepted worldwide. Among technological innovations in carbon capture, utilization and storage (CCUS) aiming at global warming relief, electrochemical capture and conversion utilizing molten salts appears to be promising.1–5 The potential for efficient generation of O2− and CO32− anions from CO2 at elevated temperatures and a large operational range for electrochemical oxidation–reduction applications make molten salts an excellent medium for the CCUS processes. Thus far, only metal carbonates and chlorides (and their blends) have been used as molten salt materials with the CO2 solubility acceptable for electrochemical conversion of CO2.1,4–10Our group has advanced molten alkali metal borates such as lithium borate (Li3BO3) and mixed lithium, sodium borates as reversible CO2 sorbents due to their large and temperature-reversible sequestration capacity for CO2 and acid gases, which generally exceeds the capacity of other molten salts.11–19 Thermoreversible reactions of the alkali metal borate glasses with CO2 are well-documented.11–20 The chemisorption of CO2 by alkali metal (M) borate M3BO3 results in the reversible formation of carbonate (M2CO3), metal oxide (M2O)–boron oxide (B2O3) binary compounds, and metaborate (MBO2) as follows.
| 4M3BO3(l) + 3CO2(g) ↔ 3M2CO3(l) + M6B4O9(l) | (1) |
| 4M3BO3(l) + 5CO2(g) ↔ 5M2CO3(l) + M2B4O7(l) | (2) |
| M3BO3(l) + CO2(g) ↔ M2CO3(l) + MBO2(l) | (3) |
| 2M3BO3(l) + 3CO2(g) ↔ 3M2CO3(l) + B2O3(l) | (4) |
Forward chemical reactions of CO2 with metal borates occur primarily in the 400–650 °C temperature range and lead to carbon dioxide absorption and formation of metal carbonate salts. The temperature ranges over which carbonate salt forms depend on the metal utilized. The reverse reactions become favored at temperatures above 500–700 °C and result in metal carbonate decomposition and carbon dioxide release.
In a concurrent study,21 we discovered that the alkali metal carbonates that result from the chemisorption of CO2 by alkali metal borates (reactions (1)–(4)) could subsequently be converted to carbon by electrolysis in a specific temperature range. However, the formation and yield of carbon in the molten borate by CO2 electrolysis are conditional upon saturation of the melt by CO2, the formation of carbonate salts (M2CO3), and dissociation of these salts leading to the formation of carbonate anions, which are necessary for the electrolytic conversion of CO2 to carbon:4–6,10
Formation of carbonate ions:
| M2CO3(molten) ↔ 2M+ + CO32− | (5) |
Four-electron reduction of the carbonate ions to carbon on cathode:
| CO32− + 4e− → C + 3O2− | (6) |
Continuous formation of oxygen on the anode:
| 2O2−-4e− → O2 | (7) |
Although reactions (5) and (6) do occur with sodium, potassium and alkaline earth carbonates,9 the production of carbon in the form of CNTs by electrolysis in metal carbonate melts occurs primarily with Li+ present in the carbonate (Li2CO3) and proceeds together with the formation of oxygen and lithium oxide.
| Li2CO3(liquid) → C(CNT) + Li2O(dissolved) + O2(gas) | (8) |
The formation of lithium oxide (8) is very important for the lithium carbonate recycling, as Li2CO3 is consumed by the electrolysis and needs to be continuously replenished by reaction of excess Li2O (formed electrolysis product) with the CO2 supplied:
| Li2O(dissolved) + CO2(atmospheric, dissolved) → Li2CO3(molten) | (9) |
However, the melting of lithium carbonate necessary for carbonate ion formation (reaction (5)) occurs at temperatures above 723 °C, whereas the decomposition of lithium carbonate and formation of lithium oxide (Li2O) is achieved only at temperatures above 1200 °C. These high temperatures are problematic for proper operation, since the presence of Li2O from lithium carbonate is a condition for CO2 capture, which is necessary for the reversible mode of CO2 capture and release using carbonate molten salts (temperature swing). Without the presence of metal oxides in the molten alkali metal carbonates, the capacity of the molten carbonates for CO2 capture from the environment is low, and therefore, the subsequent electrolytic CO2 conversion to the value-added carbon products is limited in scale and is inefficient. However, the direct addition of Li2O to molten lithium carbonate is restricted, because dissolution of solid Li2O in Li2CO3 only occurs at T > 750 °C. When Li2O is added to Li2CO3 at 750 °C, Li2CO3 is observed to absorb CO2 from air; at 550 °C, Li2CO3 or its mixture with Li2O are present in a solid form and Li2CO3 will desorb CO2 into air by decomposition at that temperature,22 contrary to the intent of enhancing CO2 sorption capacity. Therefore, lithium carbonates per se are inefficient as reversible CO2 sorbents at medium temperatures (below 750 °C) and are commonly replaced by mixed Li, Na, K carbonates as molten salt media in CO2 electrolysis.8,10,24,25
On the other hand, eutectic salt compositions of lithium and sodium and/or lithium and potassium carbonates that possess lower melting temperatures (<750 °C) are well-known.26,27 Electrochemical carbonate ion reduction and carbon formation/deposition reactions from eutectic alkali metal carbonate melts in the 500–750 °C range have been reported to occur on metallic cathodes made of Ni, Pt, W, Ag, Mo, Al, Cu, and steel, as well as glassy carbon electrodes.25 Carbon formation has been reported on steel electrodes in mixed melts such as Li2CO3–Na2CO3 (eutectic mole ratio, 52![[thin space (1/6-em)]](https://www.rsc.org/images/entities/char_2009.gif) :
:![[thin space (1/6-em)]](https://www.rsc.org/images/entities/char_2009.gif) 48) or Li2CO3–K2CO3 blends (molar ratio, 62
48) or Li2CO3–K2CO3 blends (molar ratio, 62![[thin space (1/6-em)]](https://www.rsc.org/images/entities/char_2009.gif) :
:![[thin space (1/6-em)]](https://www.rsc.org/images/entities/char_2009.gif) 38) in the 550–650 °C range.25,28 In the present work, we aimed to design molten salt compositions that could be applied as both (i) reversible CO2 capture absorbents and (ii) media for the electroreduction of that captured CO2 to value-added carbon nanotubes. We surmised that the addition of a eutectic alkali metal carbonate to the alkali metal borates could facilitate electrochemical reduction of CO2 captured by the molten borates, given that both the borate and carbonate salts can melt and form homogeneous blends in the same preferential temperature range of 550–650 °C. Importantly, potentially deleterious autocausticizing and decarbonization reactions of carbonates by alkali metal metaborate and borates are known to occur in the 900–1000 °C range,12,29 but can be averted in the target temperature range.
38) in the 550–650 °C range.25,28 In the present work, we aimed to design molten salt compositions that could be applied as both (i) reversible CO2 capture absorbents and (ii) media for the electroreduction of that captured CO2 to value-added carbon nanotubes. We surmised that the addition of a eutectic alkali metal carbonate to the alkali metal borates could facilitate electrochemical reduction of CO2 captured by the molten borates, given that both the borate and carbonate salts can melt and form homogeneous blends in the same preferential temperature range of 550–650 °C. Importantly, potentially deleterious autocausticizing and decarbonization reactions of carbonates by alkali metal metaborate and borates are known to occur in the 900–1000 °C range,12,29 but can be averted in the target temperature range.
Electrolytic production of carbon nanotubes using molten lithium carbonate compositions can be aided or mediated by the addition of small quantities of metaborates.30,31 Adding lithium metaborate (LiBO2) into molten LiCl–Li2CO3 electrolyte at metaborate concentrations up to 1–2 wt% can thermodynamically change the reaction pathway, accelerating the electrolysis and enabling formation of the CO2-derived products such as CO or CNT at lower cell voltages.30–32
Albeit the mechanisms of the carbon nucleation and growth into CNT and other nanostructured materials in the CO2 electroreduction processes occurring in alkali metal molten carbonates have been subjected to detailed studies.4–10,30,31 blends of alkali metal borates and carbonates have not been studied at large borates concentrations (>10%). Herein, we describe blended alkali metal borate/eutectic carbonate compositions that can be optimized specifically for the use in carbon capture, utilization and storage (CCUS) processes.
Experimental
General methods
Thermal characteristics and sorbent properties of the salts were analyzed by the weight and heat flow variations of the samples inside a thermogravimetric analyzer (TGA, Q50 or Q600, both from TA Instruments, Inc., New Castle, DE) or using a differential scanning calorimeter (DSC, Q600 or Discovery DSC 250, TA Instruments). For DSC measurements, heating and cooling ramp scanrates of 10 °C min−1 were applied in the temperature ranges up to 540 °C (Discovery DSC 250) and up to 1200 °C (Q600); DSC samples were sealed in aluminum pans (Discovery DSC 250) and the measurements were conducted in nitrogen atmosphere. TGA heating ramps were conducted on sample exposure to a flow of either 100% CO2 or N2. Unless specified otherwise, the mass of sample was 5–10 mg; the gas flow rate was 60 mL min−1. To calculate CO2 uptake, the fractional weight change on exposure to CO2 (MW 44.01) was normalized by the sample mass after final pretreatment by N2 to obtain the CO2 loading in mmol CO2 per gram sorbent (QCO2, mmol g−1). Temperature ramps were carried out from 200 to 800 °C at varying heating rates. Capacity was defined as certain CO2 loading after uptake under a CO2 flow.17 XRD patterns were obtained by using a 3rd generation Empyrean multipurpose X-ray diffractometer (Malvern PANalytical) equipped with a Cu radiation source and X-ray generator power of 4 kW (max 60 kV, 100 mA) at room temperature. Studied interval was 2θ = 4 to 70° and angular resolution, 0.026°. XRD scans within the temperature range from ambient to 600 °C were performed in argon or CO2 atmosphere using a PANalytical X'Pert Pro instrument with a 1.8 kW sealed X-ray tube source, a Cu target, and a vertical circle goniometer with a radius of 240 mm.Transmission electron microscopy (TEM) and scanning electron microscopy (SEM) experiments were conducted using a JEOL 2010 Advanced High Performance TEM and JEOL 5910 General Purpose SEM, respectively. Carbonaceous products collected on galvanized steel cathode obtained in the blends’ electrolysis at 550 °C were deposited onto TEM gold-coated grids from their suspensions in isopropyl alcohol followed by drying under vacuum. Elemental analysis was performed in an EPA-certified laboratory using inductively coupled plasma-mass spectrometry.
XPS spectra were measured using a PHI Versaprobe II XPS instrument with a scanning X-ray source and a UV lamp (Physical Electronics, Inc., Chanhassen, MN). Prior to taking XPS spectra on electrode surfaces, the original electrode wire was washed by acetone and water followed by drying; the wire that had been used in electrolysis and withdrawn from the molten salt at 550 °C was equilibrated at ambient temperature and then gently washed by water and dried in air; the same electrode was then cleaned off by immersion in a 1% aqueous solution of nitric acid and sonication for 45 min. Peak assignments were performed using built-in instrument software.
Raman spectra of the purified carbonaceous products of the CO2 electroreduction were measured using a Renishaw inVia Reflex Raman spectrometer (laser excitation wavelength, 532 nm) coupled to a confocal microscope.
ARES-G2 Rheometer with Forced Convection Oven (TA Instruments, Inc.), operating at temperatures up to 600 °C was used with stainless steel parallel plate geometry (40 mm diameter, gap 0.5 mm). Series of single rate viscosity measurements were conducted at 550 or 600 °C at short step times and varying shear rates. Each viscosity datapoint was measured in triplicate.
Salt syntheses
![[thin space (1/6-em)]](https://www.rsc.org/images/entities/char_2009.gif) :
:![[thin space (1/6-em)]](https://www.rsc.org/images/entities/char_2009.gif) 38 mol ratio of lithium and potassium carbonates, nominal composition, abbreviated Li1.24K0.76CO3) was again ground and kept in a sealed container prior to the use.
38 mol ratio of lithium and potassium carbonates, nominal composition, abbreviated Li1.24K0.76CO3) was again ground and kept in a sealed container prior to the use.
| Sample no. | Nominal borate content (mol%) | Borate content corrected (mol%) | Carbonate content corrected (mol%) |
|---|---|---|---|
| 1 | 100 | 100.0 | 0.0 |
| 2 | 75 | 68.9 | 31.1 |
| 3 | 50 | 48.3 | 51.7 |
| 4 | 25 | 21.4 | 78.6 |
| 5 | 0 | 0.0 | 100.0 |
Electrolysis of CO2 in borate/carbonate blend electrolyte
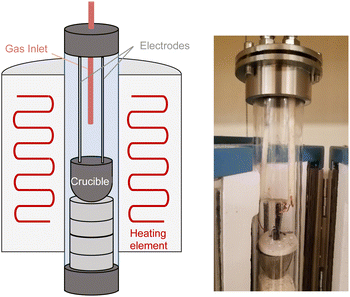
Electrolysis of CO2 was conducted using a home-made temperature-controlled tubular glass reactor equipped with furnace, gas inlet/outlet, stainless steel caps, and insulated electrode lines (Fig. 1). The electrode cables were connected to a computer-controlled BioLogic Model SP-101 potentiostat (Biologic, Seyssinet-Pariset, France).The anode was a nickel crucible composed of 99.5% nickel (nominal volume, 20 mL, Sigma-Aldrich Chemical Co.). A copper coil with a copper wire lead was used as an electrical connector.
The cathode was constructed of hot-dip galvanized steel wire (Fi-Shock WC-14200, G90 coating designation according to ASTM A653; zinc coating layer thickness approximately 18 μm). The cathode was fabricated from a 14 Ga wire made into a disk with area of ca. 2 cm2. Identical cathodes, but made of 316SS stainless steel wire (McMaster-Carr), or 99% nickel rod (Goodfellow), were used in separate series of experiments.
The details of the electrolysis experiments in this work consisted of the steps described in ESI.†
Coulombic efficiency (Ce, %) was calculated as the percent of applied, constant current charge that was converted to carbon during the CO2 electrolysis, determined as:6
| Ce (%) = 100 × Mexp/Mtheor | (10) |
![[thin space (1/6-em)]](https://www.rsc.org/images/entities/char_2009.gif) 485 As mol−1 e− is the Faraday constant, and n = 4 e− mol−1 is the reduction number of tetravalent carbons. The mass of carbon product Mexp was determined from the total mass of purified dried product multiplied by the mass fraction of total carbon in that given product sample measured by elemental analysis. Standard error for Ce was measured to be 9% in a series of independent experiments.
485 As mol−1 e− is the Faraday constant, and n = 4 e− mol−1 is the reduction number of tetravalent carbons. The mass of carbon product Mexp was determined from the total mass of purified dried product multiplied by the mass fraction of total carbon in that given product sample measured by elemental analysis. Standard error for Ce was measured to be 9% in a series of independent experiments.
Results and discussion
Characterization of the molten salt properties
Our choice of the eutectic carbonate (Li1.24K0.76CO3) studied in this paper was predicated on the prior studies demonstrating relatively low melting temperature and concomitant maximum lithium content of that particular carbonate.26,27 High Li content can be conducive to the enhancement of carbon yield during electrolysis. On the other hand, the Li, Na borate utilized throughout (Li1.5Na1.5BO3) was chosen due to the extensive prior optimization work by our group indicating that this particular composition possessed maximum CO2 sorption capacity relative to others while maintaining liquid properties and homogeneity even after reaction with CO2 in the molten state.17Thermal properties of alkali metal borates and their blends with carbonates
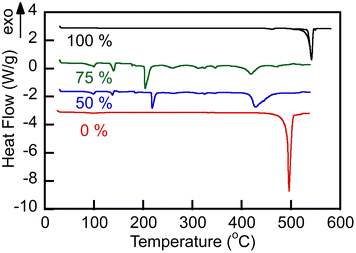
Representative TGA and endothermal DSC thermograms on heating of samples of the studied alkali metal borate and carbonate, and their blends in a nitrogen atmosphere are shown in Fig. 2 and 3, respectively. The lithium-containing samples contained varying fractions of crystalline water. Li, K carbonate lost the majority of that water at T > 130 °C and showed stability until approximately 700 °C, above which the weight loss began due to decomposition. Eutectic Li, K carbonate (Li1.24K0.76CO3) showed no further weight loss during repeated TGA cycling in the range up to 650–700 °C (data not shown).28 In comparison, Li, Na borate (Li1.5Na1.5BO3) appeared to be more hygroscopic than the carbonate and lost crystalline water over several stages, above 100, 230, and 400 °C. In the repeated cooling and heating cycles, the borate showed no signs of weight loss at temperatures up to at least 800 °C. The borate–carbonate blend pre-treated at 600 °C in nitrogen atmosphere lost less than 1% of its weight over a broad range of temperatures (Fig. 2). Hence, the prepared blends showed promise as stable regenerable molten media for repeated temperature cycling operations.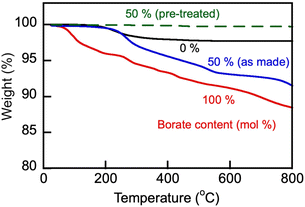 | ||
Fig. 2 TGA heating ramp (10 °C min−1) of as-made carbonate (Li1.24K0.76CO3), borate (Li1.5Na1.5BO3) and as-made and pre-treated blend (1![[thin space (1/6-em)]](https://www.rsc.org/images/entities/char_2009.gif) : :![[thin space (1/6-em)]](https://www.rsc.org/images/entities/char_2009.gif) 1 mol/mol, sample no. 3 in Table 1) in nitrogen atmosphere. The blend sample was pre-treated by its equilibration at 600 °C in N2 atmosphere for 1 h. Numbers stand for nominal initial content of borate (mol%) in the samples. 1 mol/mol, sample no. 3 in Table 1) in nitrogen atmosphere. The blend sample was pre-treated by its equilibration at 600 °C in N2 atmosphere for 1 h. Numbers stand for nominal initial content of borate (mol%) in the samples. | ||
DSC traces showed (Fig. 3) that all studied salt compositions melted at temperatures below 550 °C, demonstrating sharp melting endotherms. Melting of the eutectic carbonate Li1.24K0.76CO3 was centered at 496 °C, in excellent agreement with the previously reported data.26,27 Borate Na1.5Li1.5BO3 melting occurred at 539 °C. The borate–carbonate blends (B/C molar ratios 1![[thin space (1/6-em)]](https://www.rsc.org/images/entities/char_2009.gif) :
:![[thin space (1/6-em)]](https://www.rsc.org/images/entities/char_2009.gif) 1 and 3
1 and 3![[thin space (1/6-em)]](https://www.rsc.org/images/entities/char_2009.gif) :
:![[thin space (1/6-em)]](https://www.rsc.org/images/entities/char_2009.gif) 1), as prepared, contained residual hydrate water and melted above 450 °C. The blends recrystallized on cooling at temperatures below 400 °C (cooling exotherms are not shown in Fig. 3). Melting in nitrogen atmosphere enabled removal of crystalline water. Importantly, all materials studied were observed to be consistently liquid at 550 °C under nitrogen atmosphere or in air.
1), as prepared, contained residual hydrate water and melted above 450 °C. The blends recrystallized on cooling at temperatures below 400 °C (cooling exotherms are not shown in Fig. 3). Melting in nitrogen atmosphere enabled removal of crystalline water. Importantly, all materials studied were observed to be consistently liquid at 550 °C under nitrogen atmosphere or in air.
However, due to the reactivity of the borate with CO2 and its chemical conversion to metaborate while generating alkali metal carbonate, formation of multiple metastable phases upon reaction of the borate component with CO2 was possible.17 We thus examined formation of the crystalline phases, if any, in the borate/carbonate blend upon its uptake of and reaction with CO2 in cooling and subsequent re-melting of the reacted blend (Fig. 4). Reaction was conducted on a platinum pan in 100% CO2 at 550 °C for 3 h and then the reacted blend sample was cooled at 5 °C min−1 to ambient temperature in a CO2 atmosphere and the recrystallized material was placed on a zero-background silicon wafer, where XRD was measured at 25 °C (b) and 550 °C, also in a CO2 atmosphere (c). It was observed that upon reaction of the borate component with CO2 (eqn (3), the reacted blend re-melted and demonstrated the absence of any crystalline phases at 550 °C (Fig. 4(c)). This is important for the heating–cooling cycling (temperature swing operation) of the blends in their utilization as regenerable CO2 sorbents.17
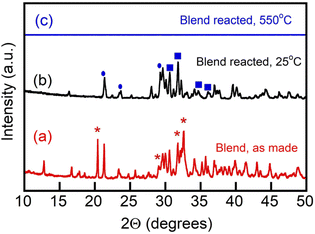 | ||
Fig. 4 Diffraction patterns of a blend of Li, Na borate (Li1.5Na1.5BO3) and Li, K carbonate (Li1.24K0.76CO3) (1![[thin space (1/6-em)]](https://www.rsc.org/images/entities/char_2009.gif) : :![[thin space (1/6-em)]](https://www.rsc.org/images/entities/char_2009.gif) 1 mol/mol), as-made (a), the same blend reacted with CO2 at 550 °C, quenched and measured at 25 °C (b) and the same reacted blend as in (b), but re-melted with XRD measured at 550 °C (c). Asterisks mark peaks matching planes of tetragonal Li and Li, Na tetraborate crystalline phase at 20.4°.33 Ovals mark patterns pertaining to lithium metaborate (LiBO2). Squares designate Li2CO3 and Li, NaCO3 crystal patterns. Crystal pattern references: International Central Securities Depository (ICSD) and JCPDS (Joint Committee on Powder Diffraction Standards) or ICDD (International Centre for Diffraction Data) as follows. ICDD 04-009-3631; ICDD 04-009-6084; ICSD 419673; ICSD 415327; ICSD 65930; ICSD 419673; ICSD 415327; ICSD 16568; ICSD 37060; ICSD 200891. 1 mol/mol), as-made (a), the same blend reacted with CO2 at 550 °C, quenched and measured at 25 °C (b) and the same reacted blend as in (b), but re-melted with XRD measured at 550 °C (c). Asterisks mark peaks matching planes of tetragonal Li and Li, Na tetraborate crystalline phase at 20.4°.33 Ovals mark patterns pertaining to lithium metaborate (LiBO2). Squares designate Li2CO3 and Li, NaCO3 crystal patterns. Crystal pattern references: International Central Securities Depository (ICSD) and JCPDS (Joint Committee on Powder Diffraction Standards) or ICDD (International Centre for Diffraction Data) as follows. ICDD 04-009-3631; ICDD 04-009-6084; ICSD 419673; ICSD 415327; ICSD 65930; ICSD 419673; ICSD 415327; ICSD 16568; ICSD 37060; ICSD 200891. | ||
Viscosity of alkali metal borate/carbonate blends
Alkali (e.g., primarily Li) meta- and tetraborates have been used extensively in a number of applications, primarily as fluxing components for X-ray fluorescence (XRF), atomic emission spectrometry and related analytical techniques.34,35 Molten lithium tetraborate generally possesses a high viscosity and tends to solidify as a glass under small temperature gradients.35–37 The viscosity of molten lithium borates under temperature gradients is determined by the ratio of optically opaque crystalline matrices and amorphous phases, both with the chemical formula of Li2B5O9.35–41 The amorphous motif can have the structural form of a single tetrahedral boron connected to four oxygen atoms. The oxygen atoms are connected to the trigonal boron species to form a ring with the chemical formula of B3O3. In contrast to the alkali metal borates, alkali metal carbonate melts are extremely fluid and the viscosity of the Na2CO3, K2CO3, and Li2CO3 liquids measured by rotational viscometers is on the order of 3–20 mPa s in the 750–1000 °C range and demonstrates Arrhenian behavior.42–44In the present work, we were interested in the behavior of blends of the two distinct classes of alkali metal salts, i.e., borates and carbonates, in their molten state under moderate shear stresses and in the lowest temperature range (550–600 °C), wherein both salts are molten. To the best of our knowledge, no reports on the viscosity of blended borate–carbonate melts is available, albeit the viscosities of individual NaxB1−xOy (x = 0.75) and (Li0.5Na0.5)xB1−xOy (x = 0.75) borates in the molten state at 600 °C have been reported by our group.12
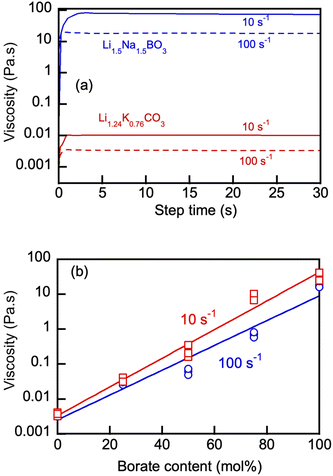
Fig. 5(a) shows representative rotational viscosity measurements of the Li, Na borate (Li1.5Na1.5BO3) and eutectic Li, K carbonate (Li1.24K0.76CO3) at 550 °C at constant shear rates of 10 and 100 s−1. Pronounced shear-thinning behavior of both molten salts was evident in these measurements, with the borate's viscosity being 3 orders of magnitude larger than that of the carbonate at that temperature. The viscosity of Li1.5Na1.5BO3 measured at constant 100 s−1 and 550 and 600 °C was 32 ± 8 (n = 3) and 14 ± 5 Pa s (n = 3), respectively, which corresponded well with the previously reported data on Li, Na borate at 600 °C.12
Variation of the borate content in the blends (Fig. 5(b)) appeared to produce a pronounced effect on the blend viscosity, ranging over 3 orders of magnitude. The results show that eutectic carbonates act as an efficient diluent for the molten alkali metal borates and the blend's viscosity can be adjusted as required for proper handling, pumping, circulation and other operations requiring transport of molten salts at high temperatures, especially in heat transfer and electrolysis applications.
CO2 uptake by alkali metal borates and their blends with carbonates
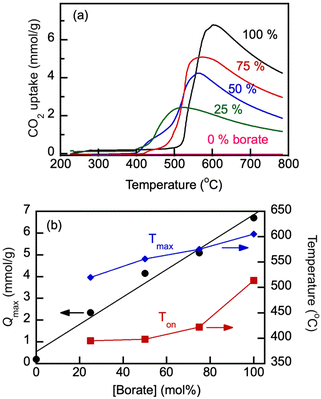
The parameters of CO2 uptake by molten salts were examined with Li, Na borate, Li1.5Na1.5BO3 and its representative blend with the eutectic Li, K carbonate under study, Li1.24K0.76CO3 (Fig. 6). The uptake of CO2 (Q, mmol g−1) during temperature was ramped at a very slow rate of 0.33 °C min−1 under a flow of 100% CO2. Prior to the temperature ramp in CO2, the samples were first purged of water and adsorbed air by exposing them to the N2 flow and ramping the temperature to 600 °C at 5 °C min−1 and then allowing to equilibrate, also under N2 flow, at 200 °C for 1 h. The slow heating rate enabled precise determination of temperature of the CO2 uptake onset (Ton) and the CO2 uptake maximum (Qmax).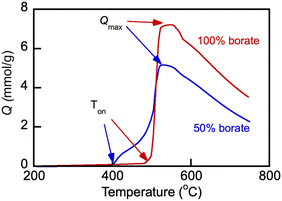 | ||
Fig. 6 CO2 uptake by Li, Na borate (Li1.5Na1.5BO3) and its eutectic Li, K carbonate (Li1.24K0.76CO3) blend (borate/carbonate ratio, 1![[thin space (1/6-em)]](https://www.rsc.org/images/entities/char_2009.gif) : :![[thin space (1/6-em)]](https://www.rsc.org/images/entities/char_2009.gif) 1 mol/mol, sample no. 3 in Table 1) under 60 mL min−1 flow of 100% CO2 at a heating rate of 0.33 °C min−1. The CO2 loading (Q, mmol g−1) was calculated as a sample weight fraction (10 × Wf) gained on the exposure to the CO2 flow, normalized by the molar mass of CO2 (44.01 g mol−1). Arrows show the temperature datapoint at which the CO2 uptake was measured to be at maximum (Qmax); Ton is the temperature of the CO2 uptake onset. Numbers indicate nominal initial borate content. 1 mol/mol, sample no. 3 in Table 1) under 60 mL min−1 flow of 100% CO2 at a heating rate of 0.33 °C min−1. The CO2 loading (Q, mmol g−1) was calculated as a sample weight fraction (10 × Wf) gained on the exposure to the CO2 flow, normalized by the molar mass of CO2 (44.01 g mol−1). Arrows show the temperature datapoint at which the CO2 uptake was measured to be at maximum (Qmax); Ton is the temperature of the CO2 uptake onset. Numbers indicate nominal initial borate content. | ||
The uptake of CO2 by Li, Na borate increased dramatically once the temperature was raised to the onset temperature (Ton) of 492 °C. After the sharp increase of the CO2 uptake at Ton, the uptake rapidly reached maximum load capacity (Qmax, ∼7.1 mmol g−1) at Tmax = 552 °C and then after a short plateau started to decrease at higher temperatures starting at 563 °C. Similar behavior was observed with the borate–carbonate blend. However, the presence of Li1.24K0.76CO3 carbonate in the blend caused a dramatic temperature shift in Ton to 395 °C, and the uptake became two-step, increasing first at >395 °C and then more significantly around 460 °C before a final rapid increase, plateau and subsequent decrease. The shift of the Ton values in the presence of carbonate in the blend is certainly due the existence of the Li, K carbonate crystals left in the blend after melting and recrystallization that preceded the CO2 uptake. All crystals are molten above 530 °C (compare with Fig. 4). The Li, K carbonate crystals melt at temperatures much lower than those of the individual borate Li1.5Na1.5BO3 (compare with Fig. 3); the onset of glass transition and melting and the existence of mobile and liquid phases in the salt enables rapid gas–liquid mass exchange and absorption of CO2 by the melt, which explains the significantly lower Ton in the blend vs. that in pure borate.
Fig. 7 shows the effect of varying borate/carbonate blend composition on the CO2 uptake under a flow of 100% CO2 at a constant heating rate of 5 °C min−1. The Ton scaled with the heating rate (not shown).
As is seen in Fig. 7(b), the addition of eutectic Li1.24K0.76CO3 carbonate to Li1.5Na1.5BO3 borate under study lowered the Qmax of the blend because the carbonate's ability to physisorb CO2 in the studied temperature range is low and does not exceed approximately 0.2 mmol g−1. The Qmax values increased linearly with the overall borate concentration. However, both Ton and Tmax significantly decreased with the carbonate addition, which indicates that the blends can be operated as reversible absorbents at lower temperatures than pure borates, which is beneficial.
CO2 absorption in pressure swing cycling operation
Our group discovered that molten alkali metal borates act as reversible liquid absorbents for CO2 capture in the medium temperature range of 550 to 600 °C, with regenerability over multiple absorption–desorption cycles under both temperature- and pressure-swing operations.12,17 Such behavior of the molten borates in a cyclical absorption–desorption process was ascribed to the “instantaneous” formation of carbonate salts and their subsequent dissociation resulting in carbonate ions being present in the borate without the diffusional transport restrictions imposed by solid product layers characteristic of solid adsorbents.11–19In the present work, we set out to (i) ascertain whether such cycling would be possible with the borate/carbonate blends, and moreover, (ii) establish whether the carbonate salt added to the borate salt prior to any CO2 chemisorption, would change the kinetics of the CO2 upload and desorption.
For the direct comparison, we chose to study a Li, Na borate (Li1.5Na1.5BO3) and eutectic Li, K carbonate (Li1.24K0.76CO3) blend (borate/carbonate ratio, 1![[thin space (1/6-em)]](https://www.rsc.org/images/entities/char_2009.gif) :
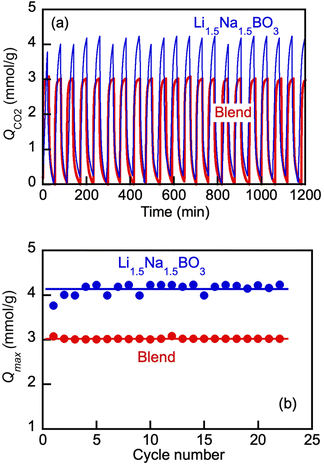
:![[thin space (1/6-em)]](https://www.rsc.org/images/entities/char_2009.gif) 1 mol mol−1) as representative examples. Both the borate and the blend have been shown to be liquid at 550 °C (Fig. 3 and 4), and hence, the pressure swing cycling was performed at that temperature. The results shown in Fig. 8 demonstrate that both the borate salt alone and its blend with eutectic carbonate exhibited reversible uptake-desorption of CO2 in the pressure swing operation, within the span of at least 22 cycles. The results were quantified with Qmax values defined at the end of each sorption cycle (t = 30 min after the instance of the switch to the CO2 flow) (Fig. 8(b)). As is seen, after the initial 3–4 cycles, the Qmax reached constant values of approximately 4.2 and 3.1 mmol g−1 for the borate and the blend, respectively. The lower Qmax values for the blend vs. borate alone are expected (compare with Fig. 7). Importantly, however, the blend did behave as a reversible liquid sorbent. Encouraging by this observation and armed with the knowledge of the dilution effect of the carbonate on the blends’ viscosity (Fig. 5), we proceeded to a comparative study of the kinetics of the CO2 uptake by the borate alone and by the blend in the pressure swing operation.
1 mol mol−1) as representative examples. Both the borate and the blend have been shown to be liquid at 550 °C (Fig. 3 and 4), and hence, the pressure swing cycling was performed at that temperature. The results shown in Fig. 8 demonstrate that both the borate salt alone and its blend with eutectic carbonate exhibited reversible uptake-desorption of CO2 in the pressure swing operation, within the span of at least 22 cycles. The results were quantified with Qmax values defined at the end of each sorption cycle (t = 30 min after the instance of the switch to the CO2 flow) (Fig. 8(b)). As is seen, after the initial 3–4 cycles, the Qmax reached constant values of approximately 4.2 and 3.1 mmol g−1 for the borate and the blend, respectively. The lower Qmax values for the blend vs. borate alone are expected (compare with Fig. 7). Importantly, however, the blend did behave as a reversible liquid sorbent. Encouraging by this observation and armed with the knowledge of the dilution effect of the carbonate on the blends’ viscosity (Fig. 5), we proceeded to a comparative study of the kinetics of the CO2 uptake by the borate alone and by the blend in the pressure swing operation.
Detailed comparison of typical CO2 uptake kinetics in one cycle of the cyclical pressure swing operation shows dramatic differences between the pure borate and the blend kinetics (Fig. 9). Herein, the uptake (Q) is presented via the degree of conversion α = Q/Qmax; wherein Qmax, mmol g−1, is the maximum CO2 loading in the cycle at tcycle = 30 min.
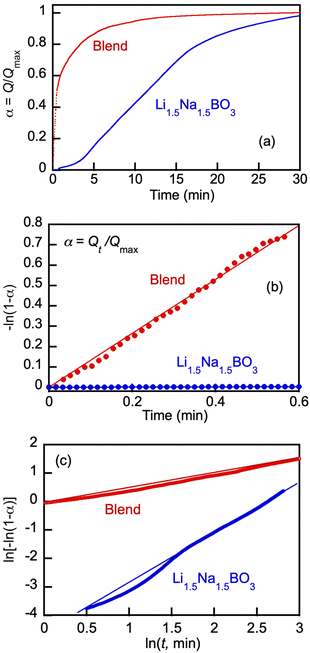 | ||
Fig. 9 Typical CO2 uptake kinetics in one cycle of the cyclical pressure swing operation at 550 °C (a), initial kinetics of CO2 uptake by Li, Na borate (Li1.5Na1.5BO3) and its blend with eutectic Li, K carbonate (Li1.24K0.76CO3) (borate/carbonate ratio, 1![[thin space (1/6-em)]](https://www.rsc.org/images/entities/char_2009.gif) : :![[thin space (1/6-em)]](https://www.rsc.org/images/entities/char_2009.gif) 1 mol/mol) (blend) presented in terms of eqn (11) (b), and variation of CO2 conversion degree by Li, Na borate its blend presented in double logarithmic plot of the Avrami–Erofeyev equation (eqn (12)) for CO2 uptake by over the time period of 0.6 min < t < 15 min (c). The data is expressed via the degree of conversion α = Q/Qmax; wherein Qmax, mmol g−1, is the maximum CO2 loading in the cycle at tcycle = 30 min. Molten salts are Li, Na borate (Li1.5Na1.5BO3) and its blend with eutectic Li, K carbonate (Li1.24K0.76CO3) (borate/carbonate ratio, 1 1 mol/mol) (blend) presented in terms of eqn (11) (b), and variation of CO2 conversion degree by Li, Na borate its blend presented in double logarithmic plot of the Avrami–Erofeyev equation (eqn (12)) for CO2 uptake by over the time period of 0.6 min < t < 15 min (c). The data is expressed via the degree of conversion α = Q/Qmax; wherein Qmax, mmol g−1, is the maximum CO2 loading in the cycle at tcycle = 30 min. Molten salts are Li, Na borate (Li1.5Na1.5BO3) and its blend with eutectic Li, K carbonate (Li1.24K0.76CO3) (borate/carbonate ratio, 1![[thin space (1/6-em)]](https://www.rsc.org/images/entities/char_2009.gif) : :![[thin space (1/6-em)]](https://www.rsc.org/images/entities/char_2009.gif) 1 mol/mol) (blend). Straight lines with R2 > 0.98 goodness-of-fit for the linear regressions (eqn (11)–(13)) are shown. 1 mol/mol) (blend). Straight lines with R2 > 0.98 goodness-of-fit for the linear regressions (eqn (11)–(13)) are shown. | ||
Fig. 9(b) shows dramatic differences in the kinetics of the CO2 uptake between pure borate and its blend with carbonate. The blend absorbed CO2 very rapidly at the very beginning of the cycle, with high degrees of conversion reached within 1–2 min, whereas with the pure Li, Na borate the initial rate of absorption was low, starting to accelerate at t > 0.6 min, which was followed by gradual deceleration of the CO2 uptake at t > 15 min. Analogous results with Li1.5Na1.5BO3 have been previously obtained at 600 °C by our group.12 The S-shaped uptake kinetics (slow induction rate-acceleration-leveling off period) can be explained by the initial lag time required for dissolution of CO2 to accumulate carbonate ions (CO32−) in the viscous molten borate oxides at sufficient levels to exceed the supersaturation threshold for nucleation and growth of crystal nuclei to form solid Li, Na carbonate particles (LiNaCO3). In the molten borate–carbonate blend, the carbonate ions are present prior to the onset of the CO2 uptake and hence, the initial uptake reaches high degrees of conversion.
The overall kinetics of the CO2 uptake by the molten salts with the nucleation and growth of the carbonate crystalline particles, which can eventually form diffusional barriers for further uptake can be qualitatively described by considering the time intervals over which the uptake rate changes separately.12,45,46
The initial CO2 uptake can be described by the pseudo first-order reaction kinetics:12,45
 | (11) |
The kinetics presented in Fig. 9(b) in terms of eqn (11) highlights dramatic differences in the initial uptake rate by the pure borate Li1.5Na1.5BO3 and its blend with carbonate. The blend started absorbing CO2 instantly and reached high degrees of conversion (α > 0.7) at 0.6 min, whereas pure borate showed an induction lag time before starting to uptake CO2. The pseudo-first reaction rate constant in the case of the blend (k1 = 1.4 min−1) was 250–300-fold higher than that with pure borate (k1 ∼ 5 × 10⁻³ min−1).
The changes in the CO2 uptake rate after the initial period (0.6 < t < 15 min) are described by the well-known Avrami–Erofeev nucleation and nuclei-growth model:12,45–48
| −ln(1 − α) = k2·tn; n = p + m | (12) |
Fig. 9(c) shows a logarithmic plot where kinetics of the borate and blend in the 0.6 < t < 15 min period are presented in terms of eqn (12). The rate of the CO2 uptake increased with the borate and significantly slowed down with the blend, probably due to the nucleation and growth of crystals as a result of CO2 reaction with the borate component that is faster in pure Li, Na borate than in the blend when the borate was diluted by carbonate. The k2 estimates from the linear regression fits (Fig. 9(c), R2 > 0.99) for the borate and blend are 1.9 and 0.6, respectively.
The linearity of the plots in Fig. 9(b) (eqn (11) indicates that the uptake rate was controlled by a second order reaction, possibly through the coordination of double alkali-metal ions to stabilize the carbonate ions forming in the molten boron oxide.12
After approximately 15 min, the CO2 uptake by both borate and the blend further slowed down, attributed to the approaching saturation of the boron oxide melt by the formed carbonates at longer times, and high conversion degrees (α > 0.8) observed in the reversible reactions of the carbonate formation and decomposition.
In summary, we have observed that the Li, Na borate and borate/carbonate blends can be applied as reversible molten absorbents of CO2, without a significant deterioration in the absorption (capture) capacity over many cycles of the pressure swing operation. Addition of carbonates to the molten carbonate lowers overall CO2 uptake due to the lower sorption capacity of carbonate at the temperatures studied. However, the addition of eutectic carbonates to the molten Li, Na borate lowers the melt viscosity and enables lowering of the temperature of the pressure swing operation as well as dramatically accelerates the CO2 uptake during the initial stage of the cycle.
Electroreduction of CO2 in molten alkali metal borate/carbonate blends
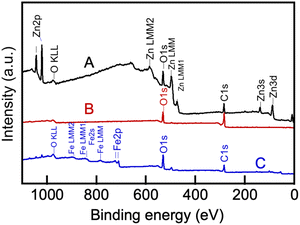
In order to conduct CO2 electrolysis in molten Li, Na borate/Li, K carbonate blends, the choice of the cathode and anode (surfaces from which electrons flow into and from, respectively) is very important. Our concurrent experiments indicated that the molten Li, Na borate can be reliably contained within metallic containers while ceramic crucibles were either damaged by the molten borate or cracked at temperatures of 600 °C.21 Metals, and in particular, nickel, have been used previously as anode materials in CO2 electrolysis in molten alkali metal carbonates.7,49–52 Nickel is readily oxidized in the presence of the molten salt, but the formed nickel oxide layer protects the deeper nickel layers from further oxidation; moreover, nickel oxide is sufficiently conductive that it does not impede the flow of electrons from the anode.53 Therefore, we chose nickel crucibles to serve as anodes. The cathode employed herein consisted of galvanized steel wire. Galvanized steel is an inexpensive material that in our experiments with alkali metal borates, produced carbon in the form of CNTs.21 The zinc layer alloyed with the steel wire via hot-dip processes54 plays a significant role in the CO2 electrolysis in molten alkali metal carbonates.55During electrolysis, the cathode was coated by carbon deposits that could be readily removed mechanically by sonication in acidic aqueous solution, resulting in colloidally stable suspensions. The removed material was dialyzed against excess aqueous solution and lyophilized for further characterization (see Experimental). The processes occurring on the galvanized steel electrode that underwent various changes during the process of CO2 electrolysis and then removed from the melt were elucidated using XPS spectroscopy (Fig. 10). Peaks belonging to zinc (Zn 2p3/2 at 1021 eV, Zn LMM Auger peak centered at 498 eV, etc.) and the Zn–O bond in the ZnO matrix centered at 530 eV (ref. 56) (Fig. 9a) disappeared as the electrode was coated by the carbonaceous material during electrolysis (B) and when that carbonaceous layer was mechanically removed, peaks belonging to the underlying iron of the bare steel layer (Fe 2p3/2 at 711 eV of Fe–O and others), appeared (C). These results clearly show that the zinc coating on the galvanized steel electrode melted at T > 420 °C and then dissolved into the molten salt electrolyte, where it co-nucleated with the forming carbon nuclei, accelerating their aggregation, growth and subsequent assembly into carbonaceous material.7,10,47
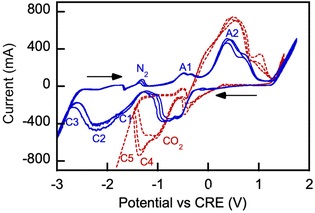
Electrochemical processes occurring during CO2 electrolysis in molten alkali metal carbonates serving as electrolytic media have been studied extensively by cyclic voltammetry (CV).22,23,25 There have been no such reports on CO2 electrolysis in molten borate or borate/carbonate blends, which prompted our interest in such examination. Fig. 11 shows voltammograms obtained in 3 consecutive scans with a representative borate/carbonate blend.
In Fig. 11, CRE denotes carbonate reference electrode (standard potential vs. reference CO2 oxidation reaction is E° = 0 V). In our control experiment conducted under air purge, a systemic −0.131 V shift was observed due to the electrochemical cell parameters and conditions relative to the standard potential  characteristic of the carbonate ion oxidation in molten carbonates:57
| CO32− → CO2 + 0.5O2 + 2e− | (13) |
Reaction (13) is indicated by A1 in Fig. 11. The observed formation of black coating on the anode interior is attributed to the nickel oxidation reaction on the anode-melt interface with the reported standard potential  :58,59
| Ni0 + CO32− → NiO + CO2 + 2e− | (14) |
Reaction (14) is indicated by A2 on the oxidation scan in nitrogen atmosphere in Fig. 15. Lower oxidation currents are observed on the initial scan. Numerous prior studies reported a variety of reduction reactions for nickel compounds (C1) in the presence of neutral gas or carbon dioxide:58–62
| NiO + 2e− → Ni0 + O2−; E° = −1.50 V | (15) |
During the cathodic reduction, at potentials in the −1.2 to −0.7 V range nickel oxide dissolves, forming complexes of nickel and carbonate ions. These complexes are reduced to nickel and carbonate ions; the formed nickel is then oxidized in the following anodic scan, at potentials in the 0.7 to 1.2 V range.60,62
The electrochemical processes occurring with nickel and nickel oxide can be considered side reactions, whereas the reactions of electrodeposition of carbon by CO2 electrolysis are our target product reactions, which will be discussed next. Important deposition potentials of alkali and alkaline earth metals via reactions (16) and carbon through reactions (17) in their own molten carbonate salts are well-known.23,25
Electrochemical deposition of metal:
| 2M2CO3 → 4M + 2CO2 + O2 (M = Li, Na or K) | (16) |
Deposition of carbon via carbonate salt decomposition:
| 3M2CO3 → C + 3M2O + 2CO2 + O2 | (17) |
In our experiments with borate/carbonate blends in a nitrogen atmosphere, carbon was produced by cathodic reduction of the carbonate anions (reaction eqn (6)) formed by dissociation of the molten alkali metal carbonates (indicated as C2 in the −2.3 V range in Fig. 11). Carbon was deposited on a galvanized steel cathode in significant quantities, along with deposition of alkali metals and boron. The processes of deposition are indicated by C3 in Fig. 11.
In the presence of the Li, Na borate in the borate/carbonate blend (Fig. 11), borate anions (BO33−) formed by dissociation of the borate in the molten salt can mediate the CO2 capture and subsequently, lead to enhanced chemisorption:
| BO33− + CO2 ↔ CO32− + BO2− | (18) |
Borate anions also contribute to the metaborate and oxygen anion generation by the molten salt:31
| BO33− ↔ BO2− + O2− | (19) |
Hence, in the presence of the Li, Na borate, the formation of carbonate anions needed for CO2 electroreduction is augmented, which in turn leads to carbon deposition on the cathode at lower cathodic potentials:
| CO32− + 4e− + 3BO2− → C + 2BO33− | (20) |
The temperature of the electrolysis process with the borate/carbonate blends was fixed at 550 °C, at which the blends exhibited maximum CO2 uptake at slow rates of heating (Fig. 6). In all experiments, the molten electrolyte was equilibrated with the CO2 flow prior to the onset of the electrolysis at 550 °C.
The results of the electrolysis conducted at 550 °C in a series of experiments in which the molten salt composition was varied are shown in Fig. 12. The Coulombic efficiency (Ce) results based on the yield of carbon are overlapped with the maximum CO2 uptake values of the corresponding blend compositions at 550 °C (Qmax) measured in TGA experiments. Coulombic efficiency was close to 100% in eutectic Li, K carbonate without the borate added, as expected with galvanized steel cathodes.24,25 The yield of carbon in the initially pure Li, K borate at 550 °C was approximately 18% in the borate alone, but could be improved by the addition of carbonate Li1.24K0.76CO3 to the blend (Fig. 12). On the other hand, at 20% of the borate added into carbonate, the Coulombic efficiency of the carbon production was close to 100% while the CO2 uptake was a lot higher than Qmax in pure Li, Na carbonate and sufficient for the high yield of the carbon product.
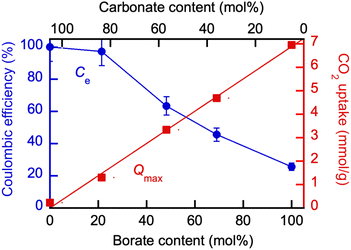 | ||
| Fig. 12 Effect of the molten borate/carbonate blend composition on the Coulombic efficiency (Ce) of the CO2 electrolysis and maximum CO2 uptake (Qmax) at 550 °C. Borate: Li1.5Na1.5B2O3; eutectic Li, K carbonate: Li1.24K0.76CO3. For Qmax determination detail, see legend to Fig. 6. | ||
The opposing Cevs. Qe trends enable performance optimization via the blend composition to trade off the equilibrium CO2 sorption (capture) uptake with the yield of carbonaceous product during CO2 electrolysis as measured by Coulombic efficiency.
Structure of the products of CO2 electrolysis in molten borate/carbonate blends
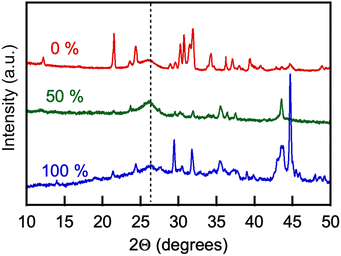
The products of the CO2 electrolysis were recovered and purified (see Experimental). Elemental analysis for carbon content in the products varied significantly from approximately 20 to 98 wt% depending on the extent of product purification by washing; concentrations of lithium, zinc and nickel varied in the 0.2 to 3.5 wt%, 0.01–2 wt%, and 0.1–1.5 wt% ranges, respectively.Fig. 13 shows a general view of the powder XRD pattern of the products of CO2 electrolysis collected on the galvanized steel cathodes. The broad peaks centered at 2Θ = 26–26.2° observed in the XRD patterns of the electrolysis products obtained with either molten Li, Na borate or Li, K borate or their blends were prominent. The (100) crystal peaks are characteristic of multiwall carbon nanotubes and correspond to a d-spacing between graphene sheets (CNT wall layers) of 3.42–3.46 Å.63–65 The XRD patterns of the electrolysis products also featured peaks at 2Θ = 21.3, 30.6, and 31.8°, characteristic of the lithium carbonate admixtures that were not removed from the products in the process of purification.66 XRD pattern peaks at 2Θ = 34.4 and 36.2° were due to the presence of ZnO crystals,67 formed via oxidation of zinc originally present on the galvanized steel cathode surface.68 Finally, peaks that are present in some products at 2Θ = 43.5 and 44.7° are due to the NiO crystal lattice69,70 and Ni electrodeposited onto the product on the cathode from the molten salt solution, respectively. It has been noted previously that zinc and nickel ion admixtures to the molten carbonates mediate the synthesis and contribute to the yield of carbon nanotubes in the process of CO2 electrolysis.7,10
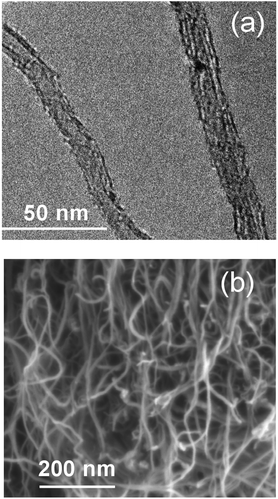
The products of CO2 electrolysis were further visualized by means of transmission and scanning electron microscopy (TEM and SEM, Fig. 14). Images demonstrated multiwalled CNT (MWCNT) obtained in all borate/carbonate compositions at 550 °C. The MWCNT possessed 10–16 graphene layers, with walls approximately 4.5–5 nm thick, and diameters of ∼15.5 nm. Similar MWCNT have been observed previously in the products of CO2 electrolysis conducted in alkali metal carbonates only, without borates.7,10
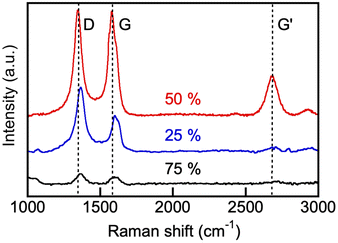
Raman spectra of our electroreduction products (Fig. 15) showed a strong peak at around 1580 cm−1 (G-band, arising from the sp2 carbon stretching of the C–C bond) and an additional band at 1350 cm−1 (D-band caused by the disordered structure of graphene). The presence of the G-band Raman feature is typical of all graphite-like materials, including multiwall CNT.71,72 The presence of the peak at around 2690 cm−1, corresponding to the G′ band, is more specific to small crystallites in CNT. The G-peak of the products prepared in 75 mol% initial borate composition was somewhat broader than the one observed in the spectra of the product obtained in the 1![[thin space (1/6-em)]](https://www.rsc.org/images/entities/char_2009.gif) :
:![[thin space (1/6-em)]](https://www.rsc.org/images/entities/char_2009.gif) 1 borate/carbonate blend (borate content, 50 mol%), and some splitting of the G-peak into two peaks, centered at 1585 cm−1 and 1610 cm−1 (D′-peak) was apparent. This can be explained by the presence of the amorphous carbon impurities on the graphitic layers of the CNT, which were observed by SEM. Overall, Raman spectra (Fig. 15), together with the XRD (Fig. 13) and electron microscopy (Fig. 14), provide unequivocal evidence of the presence of carbon nanotubes in the products of our CO2 electroreduction process.
1 borate/carbonate blend (borate content, 50 mol%), and some splitting of the G-peak into two peaks, centered at 1585 cm−1 and 1610 cm−1 (D′-peak) was apparent. This can be explained by the presence of the amorphous carbon impurities on the graphitic layers of the CNT, which were observed by SEM. Overall, Raman spectra (Fig. 15), together with the XRD (Fig. 13) and electron microscopy (Fig. 14), provide unequivocal evidence of the presence of carbon nanotubes in the products of our CO2 electroreduction process.
Conclusions
A family of blended compositions of molten alkali metal borates and carbonates has been examined as reversible CO2 absorbents as well as media for the CO2 electrolysis for carbon conversion. Salt structure, reactions with CO2 and viscosity were studied. Blended borate(Li1.5Na1.5BO3) and eutectic Li, K carbonate (Li1.24K0.76CO3) compositions are molten in the 550–600 °C (medium) temperature range. These compositions can be applied as reversible molten absorbents of CO2, without a significant deterioration of the capture capacity over many cycles of the pressure swing operation. Addition of carbonates to the molten borate lowers overall CO2 uptake due to the lower sorption capacity of carbonate. However, the addition of eutectic carbonates to the molten Li, Na borate (i) lowers the melt viscosity and enables lowering of the temperature of the pressure swing operation as well as (ii) dramatically accelerates the CO2 uptake at the initial stage of the cycle, potentially enabling a faster cycling. Blended borate/carbonate compositions were found that possess simultaneous maximum loading capacity for CO2 and enable maximum product (multiwall carbon nanotube) yield at medium temperatures (550°).The blended borate/carbonate compositions described herein can find utility in processes involving both carbon capture and CO2 capture/utilization applications. For the reversible capture plant design, the most influential parameters are the cost of CO2 handling (transport and storage), the cost of electricity, and the energy required for the separation.19 For the CCUS processes involving both capture and conversion designs, the cost of electricity is the most important factor. Given that a very large amount of electrical energy is required for this design, it must be supplied by renewable energy.5,73 The high coulombic efficiency (over 90%, Fig. 12) achieved with some of the borate/carbonate blends is also a very influential factor. Our future efforts will focus on the search for the cost-optimum molten salt materials for CCUS in the medium to low temperature ranges.
Conflicts of interest
There are no conflicts to declare.Acknowledgements
Support for this work from Taiheiyo Cement Corporation is gratefully acknowledged. The authors are thankful to Dr Cameron Halliday and Dr Charles Settens for helpful discussions.References
- W. Weng, B. Jiang, Z. Wang and W. Xiao, Sci. Adv., 2020, 6(9), eaay9278, DOI:10.1126/sciadv.aay9278.
- S. Jing, M. Wang and W. Xiao, J. Energy Chem., 2022, 64, 404, DOI:10.1016/j.jechem.2021.05.012.
- W. Weng, L. Tang and W. Xiao, J. Energy Chem., 2019, 28, 128, DOI:10.1016/j.jechem.2018.06.012.
- S. Licht, X. Liu, G. Licht, X. Wang, A. Swesi and Y. Chan, Mater. Today Sustainability, 2019, 6, 100023 CrossRef.
- J. Ren, A. Yu, P. Peng, M. Lefler, F.-F. Li and S. Licht, Acc. Chem. Res., 2019, 52(11), 3177, DOI:10.1021/acs.accounts.9b00405.
- S. Licht , Carbon dioxide to carbon nanotube scale-up, arXiv, 2017, preprint, arXiv:1710.07246.
- J. Ren and S. Licht, Sci. Rep., 2016, 6, 27760 CrossRef CAS PubMed.
- X. Chen, Z. Zhao, J. Qu, B. Zhang, X. Ding, Y. Geng, H. Xie, D. Wang and H. Yin, ACS Sustainable Chem. Eng., 2021, 9, 4167, DOI:10.1021/acssuschemeng.1c00028.
- X. Wang, X. Liu, G. Licht, B. Wang and S. Licht, J. CO2 Util., 2019, 34, 303, DOI:10.1016/j.jcou.2019.07.007.
- J. Johnson, M. Ren, G. Lefler, G. Licht, J. Vicini, X. Liu and S. Licht, Mater. Today Energy, 2017, 5, 230, DOI:10.1016/j.mtener.2017.07.003.
- T. Harada and T. A. Hatton, Carbon dioxide removal using lithium borate, US Patent, 10913658, 2021 Search PubMed.
- T. Harada, C. Halliday, A. Jamal and T. A. Hatton, J. Mater. Chem. A, 2019, 7, 21827, 10.1039/C9TA09122J.
- T. Harada and T. A. Hatton, J. Mater. Chem. A, 2017, 5, 22224, 10.1039/C7TA06167F.
- C. Halliday, N. Ozbek and T. A. Hatton, ACS Appl. Mater. Interfaces, 2020, 12, 51468, DOI:10.1021/acsami.0c14633.
- C. Halliday, T. Harada and T. A. Hatton, Ind. Eng. Chem. Res., 2020, 59, 8937, DOI:10.1021/acs.iecr.0c01140.
- C. Halliday, T. Harada and T. A. Hatton, Environ. Sci. Technol., 2020, 54, 6319, DOI:10.1021/acs.est.0c01671.
- C. Halliday, T. Harada and T. A. Hatton, Chem. Mater., 2019, 32, 348, DOI:10.1021/acs.chemmater.9b03876.
- C. Halliday and T. A. Hatton, Ind. Eng. Chem. Res., 2021, 60(26), 9313, DOI:10.1021/acs.iecr.1c00597.
- C. Halliday and T. A. Hatton, Appl. Energy, 2020, 280, 116016, DOI:10.1016/j.apenergy.2020.116016.
- S. W. Martin, E. I. Cooper and C. A. Angell, J. Am. Ceram. Soc., 1983, 66, c153, DOI:10.1111/j.1151-2916.1983.tb10622.x.
- M. P. Nitzsche, L. Bromberg and T. A. Hatton, Capture and electrochemical conversion of CO2 into carbon nanotubes using molten alkali metal borates, Amer. Chem. Soc. Fall Meeting, Chicago, IL, 08.21.2022.
- J. Ren, J. Lau, M. Lefler and S. Licht, J. Phys. Chem. C, 2015, 119, 23342, DOI:10.1021/acs.jpcc.5b07026.
- H. Yin, X. Mao, D. Tang, W. Xiao, L. Xing, H. Zhu, D. Wang and D. R. Sadoway, Energy Environ. Sci., 2013, 6, 1538–1545, 10.1039/C3EE24132G.
- X. Liu, G. Licht, X. Wang and S. Licht, Catalysts, 2022, 12, 137, DOI:10.3390/catal12020137.
- H. V. Ijije, R. C. Lawrence and G. Z. Chen, RSC Adv., 2014, 4, 35808, 10.1039/C4RA04629C.
- C. Chen, T. Tran, R. Olivares, S. Wright and S. Sun, J. Sol. Energy Eng., 2014, 136(3), 031017, DOI:10.1115/1.4027264 , (7 pages).
- G. J. Janz and M. R. Lorenz, J. Chem. Eng. Data, 1961, 6(3), 321, DOI:10.1021/je00103a001.
- G. Argandoña, M. Aresti, J. M. Blanco, E. Muel and J. Esarte, Appl. Sci., 2021, 11, 7597, DOI:10.3390/app11167597.
- M. Loubser, C. Strydom and H. A. Potgieter, X-Ray Spectrom., 2004, 33, 212, DOI:10.1002/xrs.700.
- X. Wang, X. Liu, G. Licht and S. Licht, Sci. Rep., 2020, 10, 15146, DOI:10.1038/s41598-020-71644-0.
- L. Hu, B. Deng, K. Du, R. Jiang, Y. Dou and D. Wang, iScience, 2020, 23, 101607, DOI:10.1016/j.isci.2020.101607.
- L. Hu, B. Deng, Z. Yang and D. Wang, Electrochem. Commun., 2020, 121, 106864, DOI:10.1016/j.elecom.2020.106864.
- N. Khalizadeh, E. B. Saion, H. Mirabolghasemi, A. H. B. Shaari, M. B. Hashim, M. B. H. Ahmad, N. M. Ali and A. Dehzangi, J. Mater. Res. Technol., 2016, 5, 37, DOI:10.1016/j.jmrt.2015.05.005.
- F. Claisse, Powder Diffr., 2006, 21(2), 181, DOI:10.1154/1.2219872.
- E. Braysher, B. Russell, S. Woods, M. García-Miranda, P. Ivanov and D. Read, J. Radioanal. Nucl. Chem., 2019, 321, 183, DOI:10.1007/s10967-019-06572-z.
- Y. Anzai, K. Terashima and S. Kimura, J. Cryst. Growth, 1993, 134, 235, DOI:10.1016/0022-0248(93)90131-F.
- J. Filipiak, A. Majchrowski and T. Łukasiewicz, Arch. Acoust., 1994, 19, 131 Search PubMed https://acoustics.ippt.pan.pl/index.php/aa/article/view/1067/904 .
- K. Byrappa and K. V. K. Shekar, Phases and crystallization in the system Li2O-B2O3-H2O under hydrothermal conditions, J. Mater. Res., 1993, 8, 864–870, DOI:10.1557/JMR.1993.0864.
- P. J. Bray, S. A. Feller, G. E. Jellison and Y. H. Yun, J. Non-Cryst. Solids, 1980, 39, 93, DOI:10.1016/0022-3093(80)90400-7.
- A. Senyshyn, B. Schwarz, T. Lorenz, V. T. Adamiv, Y. V. Burak, J. Banys, R. Grigalaitis, L. Vasylechko, H. Ehrenberg and H. Fuess, J. Appl. Phys., 2010, 108, 093524, DOI:10.1063/1.3504244.
- B. Chen, U. Werner-Zwanziger, M. L. F. Nascimento, L. Ghussn, E. D. Zanotto and J. W. Zwanziger, J. Phys. Chem. C, 2009, 113, 20725, DOI:10.1021/jp907259e.
- D. Di Genova, C. Cimarelli, K.-U. Hess and D. B. Dingwell, Am. Mineral., 2016, 101, 953, DOI:10.2138/am-2016-5537CCBYNCND.
- S. W. Kim, K. Uematsu, K. Toda and M. Sato, J. Ceram. Soc. Jpn, 2015, 143, 355, DOI:10.2109/jcersj2.123.355.
- G. J. Janz and J. Saegusa, J. Electrochem. Soc., 1963, 110, 452, DOI:10.1149/1.2425785.
- T. Harada, F. Simeon, E. Z. Hamad and T. A. Hatton, Chem. Mater., 2015, 27(6), 1943, DOI:10.1021/cm503295g.
- W. Gao, M. A. Vasiliades, C. M. Damaskinos, M. Zhao, W. Fan, Q. Wang, T. R. Reina and A. M. Efstathiou, Environ. Sci. Technol., 2021, 55(8), 4513, DOI:10.1021/acs.est.0c08731.
- T. J. W. D. Bruijn, W. A. D. Jong and P. J. V. D. Berg, Thermochim. Acta, 1981, 45, 315–325, DOI:10.1016/0040-6031(81)85091-5.
- A. Khawam and D. R. Flanagan, J. Phys. Chem. B, 2006, 110, 17315, DOI:10.1021/jp062746a.
- M. Lefler and C. L. Pint, ACS Cent. Sci., 2016, 2, 162, DOI:10.1021/acscentsci.5b00400.
- J. Ren, F.-F. Li, J. Lau, L. González-Urbina and S. Licht, Nano Lett., 2015, 15, 6142, DOI:10.1021/acs.nanolett.5b02427.
- S. Licht, B. Wang, S. Ghosh, H. Ayub, D. Jiang and J. Ganley, J. Phys. Chem. Lett., 2010, 1, 2363, DOI:10.1021/jz100829s.
- Z. Li, D. Yuan, H. Wu, W. Li and D. Gu, Inorg. Chem. Front., 2018, 5, 208, 10.1039/C7QI00479F.
- V. N. Tare and J. B. Wagner, J. Appl. Phys., 1983, 54, 6459, DOI:10.1063/1.331927.
- S. M. A. Shibli, B. N. Meena and R. Remya, Surf. Coat. Technol., 2015, 262, 210, DOI:10.1016/j.surfcoat.2014.12.054.
- P. Wang, Y. Liu, Z. Li, D. Ji, Z. Qiao, J. Zhang, Q. Jia and H. Wu, J. Electrochem. Soc., 2021, 168, 083501, DOI:10.1149/2.0861910jes.
- F. M. Chang, S. Brahma, J. H. Huang, Z. Z. Wu and K.-Y. Lo, Sci. Rep., 2019, 9, 905, DOI:10.1038/s41598-018-37601-8.
- R. Wartena, J. Winnick and P. H. Pfromm, J. Appl. Electrochem., 2002, 32, 415, DOI:10.1023/A:1016334307899.
- Y. Izaki, Y. Mugikura, T. Watanabe, M. Kawase and J. R. Selman, J. Power Sources, 1998, 75, 236, DOI:10.1016/S0378-7753(98)00117-7.
- M. D. Ingram and G. I. Janz, Electrochim. Acta, 1965, 10, 783, DOI:10.1016/0013-4686(65)80043-3.
- M. S. Yazici and J. R. Selman, J. Electroanal. Chem., 1998, 457, 89, DOI:10.1016/S0022-0728(98)00126-0.
- J. P. T. Vossen, L. Plompand and J. H. W. de Wit, J. Electrochem. Soc., 1994, 141, 3040, DOI:10.1149/1.2059276.
- Q. Li, F. Borup, I. Petrushina and N. Bjerrum, J. Electrochem. Soc., 1999, 146, 2449, DOI:10.1149/1.1391954.
- B. D. Che, B. Q. Nguyen, B. Q. Nguyen, L. T. Nguyên, L. T. Nguyên and N. H. Nguyen, Chem. Cent. J., 2015, 9, 10, DOI:10.1186/s13065-015-0087-2.
- G. Xu, Z.-C. Feng, Z. Popovic, J.-Y. Lin and J. J. Vittal, Adv. Mater., 2001, 13, 264, DOI:10.1002/1521-4095(200102)13:4<264.
- D. N. Futaba, T. Yamada, K. Kobashi, M. Yumura and K. Hata, J. Am. Chem. Soc., 2011, 133, 5716, DOI:10.1021/ja2005994.
- W. Cai, R. Chen, Y. Yang, M. Yi and L. Xiang, Crystals, 2018, 8, 19, DOI:10.3390/cryst8010019.
- JCPDS #79-0206, #36-1451.
- P. Rajasekaran, H. Kannan, S. Das, M. Young and S. Santra, AIMS Environ. Sci., 2016, 3, 439, DOI:10.3934/environsci.2016.3.439.
- S. Rakshit, S. Ghosh, S. Chall, S. S. Mati, S. P. Moulik and S. C. Bhattacharya, RSC Adv., 2013, 3, 19348, 10.1039/C3RA42628A.
- V. D. Jović, V. Maksimović, M. G. Pavlović and K. I. Popov, J. Solid State Electrochem., 2006, 10, 373, DOI:10.1007/s10008-005-0687-1.
- E. F. Antunes, A. O. Lobo, E. J. Corat, V. J. Trava-Airoldi, A. A. Martin and C. Verissimo, Carbon, 2006, 44, 2202, DOI:10.1016/j.carbon.2006.03.003.
- M. S. Dresselhaus, A. Jorio, M. Hofmann, G. Dresselhaus and R. Saito, Nano Lett., 2010, 10, 751, DOI:10.1021/nl904286r.
- S. Licht , arXiv, 2019, preprint, arXiv:1901.07134.
Footnote |
| † Electronic supplementary information (ESI) available. See DOI: https://doi.org/10.1039/d2nr03355k |
| This journal is © The Royal Society of Chemistry 2022 |

