 Open Access Article
Creative Commons Attribution 3.0 Unported Licence
A MnOx–graphitic carbon composite from CO2 for sustainable Li-ion battery anodes†
Giampaolo
Lacarbonara
a,
Sebastiano
Chini
a,
Sander
Ratso
b,
Ivar
Kruusenberg
b and
Catia
Arbizzani
 *a
*a
aAlma Mater Studiorum – University of Bologna, Department of Chemistry “Giacomo Ciamician”, Via F. Selmi 2, 40126 Bologna, Italy. E-mail: catia.arbizzani@unibo.it; Tel: +39 0512099798
bNational Institute of Chemical Physics and Biophysics, Akadeemia Tee 23, 12618 Tallinn, Estonia
First published on 25th July 2022
Abstract
The increasing concentration of CO2 in the atmosphere is the leading cause of the greenhouse gas effect. Carbon capture and storage is an important topic to develop sustainable technologies. Molten salt CO2 capture and electrochemical transformation represent a suitable process to produce various carbon products, such as carbon nanofibers, carbon nanotubes, graphite, and graphene. The employment of graphitic anode materials for Li-ion batteries coming from CO2 capture is ideal for increasing battery sustainability. Moreover, the addition of transition metal oxides represents a suitable strategy for new negative electrodes because conversion reactions lead to high specific capacities. Among them, manganese has gained attention due to its multiple valence states and numerous possible crystalline structures. In the present work, a MnOx–graphitic carbon composite obtained by electrolysis of CO2via molten Li2CO3 is characterized and used to prepare a negative electrode for LIBs with an environmentally sustainable aqueous process.
1. Introduction
The EIA estimates that U.S. energy-related CO2 emissions decreased by 11% in 2020. This decline in emissions was related to the economic contraction resulting from the COVID-19 pandemic. In 2021, the EIA forecasts that energy related CO2 emissions will increase by about 6% from the 2020 level as economic activity increases and leads to increasing energy use.1 Fossil fuel combustion for energy production is the single largest source of greenhouse gas emissions globally, and CO2 is also a side product of many key industries such as cement, steel, and aluminum. Reducing CO2 emissions is one of the most critical challenges of the 21st century. Carbon dioxide sequestration and/or transformation technology is a valuable approach to decrease the CO2 emission to the atmosphere.2 Splitting this molecule into C and O2 transforms a dangerous greenhouse gas into a valuable resource. One proposed method for splitting CO2 is the molten salt CO2 capture and electrochemical transformation (MSCC-ET) method.3,4 Using this method, the CO2 molecule is transformed into solid carbon and gaseous oxygen via a molten salt intermediate with efficiency typically >90%.5 Various carbon products, such as carbon nanofibers (CNFs), carbon nanotubes (CNTs), graphite and graphene, have been successfully prepared in molten salts via the MSCC-ET method.6 Molten Li2CO3 has been proven to be the most effective choice of electrolyte media for CNF production, while the addition of Ni or a Ni-based anode has been noted to be crucial for CNF formation during synthesis.3 Alternatively, carbonaceous materials can be obtained from the electroreduction of dissolved CO2 in carbonates.7 These CO2-derived carbons can be utilized for various purposes, including energy storage devices like Li-ion batteries (LIBs).Currently, mainly two kinds of graphitic materials are used in state-of-the-art LIBs – natural graphite and synthetic graphite.3 The European Union declared natural graphite as a critical raw material. On the other hand, synthetic graphite is mainly produced by the pyrolysis of unsaturated carbon, which is generally derived from petroleum. Heat treatment includes graphitization at elevated temperatures of up to 2500 °C over a longer period, up to several days in some cases.8–11 Even though the anode material produced in this way will lead to higher purity, lower thermal expansion, and overall better battery performance, the relatively high price of synthetic graphite with respect to natural graphite is the downside of that material (20 US$ kg−1vs. 8–11 US$ kg−1), respectively.12 On top of that, synthetic graphite has a rather high environmental footprint due to the long treatments at high temperatures. However, greenhouse gas (GHG) emissions are estimated similar to those involved in the refining and purification steps of natural graphite.11
The possibility of synthesizing graphite from sustainable resources would provide the advantage of being independent of natural graphite resources and expensive and non-environmentally friendly synthetic graphite. The use of graphitic anode materials for Li-ion batteries coming from CO2 transformation is thereby a solution in line with the EU policy of circular economy, where recycled materials are preferable for the continuous exploitation of new resources.
Besides this, researchers pay significant attention to novel graphitic anode materials, as traditional graphite-anodes show a relatively low charge rate which limits the battery power density.13
To overcome this drawback, different types of nanomaterials, including nanocarbons, such as graphite nanoplatelets, graphene, carbon nanofibers, carbon nanotubes, etc. have been investigated as anodes for LIBs.14,15
On top of that, new battery concepts with added transition metal oxides have attracted major attention as anode materials after the first report by Poizot et al.16 Metal oxides in the composition of anode materials can lead to a higher theoretical capacity (>700 mA h g−1) than commercial graphite (372 mA h g−1) because of conversion reactions.17,18 Among the other transition metal oxides, manganese-based oxides have gained significant attention as the multiple valence states of manganese ions and numerous possible crystalline structures can lead to a higher theoretical capacity of up to 1230 mA h g−1.18 In addition to this, manganese oxide may exhibit much lower potential than other metal oxides, which are used to gain higher energy density.19 MnO2 has been included in CNTs and this composite material displayed superior electrochemical performances owing to the pseudocapacitive contribution of MnO2 in charge storage, as well as high conductivity of the N–C layer, and the possibility to adapt the volume changes of MnO during cycling.20 Other composite materials such as sulfides, selenides, and covalent organic frameworks with CNTs have demonstrated the significance of carbon incorporation for the advanced anode materials.17,21,22
Recently, it has been demonstrated that the CO2-derived carbon material can be doped in situ as it is deposited by additives from the electrolyte mixture and/or electrodes. This can create materials from simple metal-decorated nanoparticles to carbon/metal oxide composites and composite carbon nanotubes with specific properties.8,23 Indeed, Zn from the galvanized steel cathode used in the synthesis is known to act as a catalyst for graphitization; however, the underlying steel (as in this case) can be rather unstable in the molten carbonate electrolyte, leading to a high metal content in the carbon product.24–26 Other metals such as Fe are also known to be commonly leached from the electrodes and other metal components of the reactor into the MSCC-ET product in the literature but are either mostly washed out by the HCl treatment or not present in this case.27 Mn is known to be an effective catalyst for the graphitization of carbon materials at high temperatures (>1400 °C) and can graphitize carbon-containing precursors such as lignin even at temperatures as low as 900 °C.27–29 The high concentration and mobility of C in the Li2CO3 electrolyte can further decrease this temperature, leading to the formation of the graphitic carbon layer on top of MnO2.
In the present contribution, the electrolysis of CO2via molten Li2CO3 will be used to prepare a composite material of manganese oxides and graphitic carbon. The galvanized steel cathode is used as the manganese source on which carbon growth occurs. The resulting material will be fully characterized and used to prepare anodes with an environmentally sustainable aqueous process. The electrochemical characterization of the anodes in a conventional organic electrolyte will be presented and discussed.
2 Results and discussion
2.1 Carbon synthesis
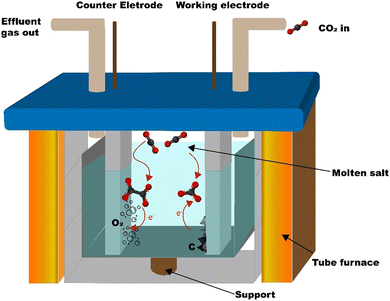
The carbon is synthesized from CO2 using the molten salt CO2 capture and electrochemical transformation (MSCC-ET) method3,30 which Ratso et al. have previously used to synthesize CO2-derived catalyst materials.31–34 The method is based on capturing CO2 into molten carbonate salts, where CO32− is in equilibrium with CO2 in the surrounding atmosphere: CO32− ⇄ CO2 + O2− or CO2 + CO32− ⇄ C2O52−. In turn, CO32− is electrochemically split into carbon and oxygen by a four-electron transfer process: CO32− + 4e− ⇄ C + 3O2−.29,30 Oxygen is produced on the other electrode. By using a nickel–chromium anode and a Zn-steel cathode, it is possible to create nucleation sites onto the cathode, where Ni dissolved in the carbonate salt acts as a growth point for carbon nanofibers and other graphitic carbon structures (reactor scheme in Fig. 1).The average electrical efficiency (i.e. the charge required to deposit the carbonaceous material divided by the charge supplied) for the MSCC-ET synthesis was 86%. The CO2 conversion efficiency, evaluated by the ratio between the mass of the deposited carbon and the theoretical mass of carbon that should have been deposited by the amount of electricity that was used during the synthesis, was ≈100%. Below 900 °C in Li2CO3, no products are formed from CO2 other than solid carbon. The amount of CO2 used for this can be calculated directly from the difference of molar masses; for each molecule of CO2, one atom of solid carbon will be formed (e.g. for 1 g of carbon ∼3.7 g of CO2 is needed). The mass deposited depends on the current efficiency of the specific experiment and the electrode area. For a 5 cm2 cathode, the common amount produced corresponds to 0.7–1.3 g. Heating the reactor for the synthesis required 0.6 kW h of energy, but it is to be noted that, under sufficient insulation, the process has been shown to be exothermic enough to heat itself.35 In this case, such an insulation was neglected out of convenience.
2.2 Physico-chemical characterization of carbons
The scanning electron microscopy (SEM) images of the carbonaceous material are shown in Fig. 2a and the EDS analysis of the selected area is shown in Fig. 2b, with the data reported in Tables S1 and S2 (ESI†). The synthetized material contains Mn and O, other than carbon arising from the galvanized steel cathode used in the MSCC-ET process. Since MnO2 is present even after purification in 5 mol L−1 HCl, it is likely that MnO2 is protected by a graphitic carbon layer impenetrable by liquid solutions. After milling and sieving with 20 μm sieve (C-20) and 50 μm sieve (C-50), the presence of MnOx is evidenced by high annular dark field (HADF) scanning transmission electron microscopy (STEM) images, selected area electron diffractograms (SAEDs), X-ray diffraction (XRD) patterns and X-ray photoelectron spectroscopy (XPS) spectra, demonstrating the embedding of MnOx inside the carbon matrix. | ||
| Fig. 2 SEM images of (a) pristine carbon ground in an agate mortar and (b) EDS analysis of the carbon ground in a mortar. | ||
Indeed, STEM images revealed that MnO2 is embedded in the carbonaceous matrix (Fig. 3a). The selected area diffraction (SAED) pattern (Fig. 3b) reveals the polycrystallinity of MnO2 with a nanocrystal diameter from 10 to 50 nm. The satisfied diffraction condition of the crystal structure of the sample observed in the SAED all corresponds to Mn7.98O16.
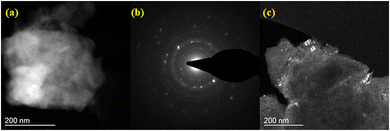 | ||
| Fig. 3 (a) HADF-STEM image of C50 carbon. (b) SAED pattern acquired over an area of 200 nm. (c) HADF-STEM image of the C-50 sample selecting the reflection at d = 0.31 nm in the SAED pattern. | ||
In the present work, after milling the sample, MnO2 is exposed and can contribute to the performance of the cell.36 Carbon/transition metal oxide composites can have increased power performance and cycling behavior due to pseudocapacitive processes, indicating that MnO2 leached from the electrode has a positive effect in this case. However, in the case of undesired phases, further purification of the carbon via treatment in concentrated acids and other oxidizers such as prior to HCl washing to expose the metal/metal oxide particles is possible; however, such harsh treatments also modify the structure of the carbon material itself.37
The XRD patterns of the pristine synthesized carbon and C-50 are shown in Fig. 4a. In the diffractograms, the typical carbon reflections at 26° and 55° are present in addition to several reflections associate with a Mn7.84O16 pattern and other metal impurities in the 40°–45° range. By contrast, the latter are less intense in the pattern of the pristine synthesized carbon before grinding, except that below 20°. This confirms the exposure of MnOx by milling. The X-ray diffraction patterns of manganese oxide materials consist of small signals on a diffuse background due to structural defects. As showed by Julien et al.,36 the particle size and the chemistry of defects lead to the structural differences in the materials. In the material reported, the presence of potassium (Fig. 2d) could influence the reflection positioning and intensity.
Raman spectra in Fig. 4b also confirmed that the synthesized carbonaceous material is graphitic. The characteristic graphite D, G, and 2D bands are present at ca. 1350, 1580, and 2700 cm−1, respectively. Additionally, the Raman spectrum showed reflections that could be attributed to Mn2+ at ca. 700 cm−1.37 The general peculiarity of the vibrational features of MnO2 is their low Raman activity. Generally, the spectrum is characterized by three bands at 500–510, 575–585 and 625–650 cm−1. The two high-wavenumber bands have a higher Raman intensity, while low-frequency bands are not visible in the spectrum reported. The two high-frequency bands at 640 and 580 cm−1 indicate the presence of MnO2 as romachenite.37
The full survey XPS spectrum (Fig. 5a) of C-50 carbon shows the characteristic peaks of C1s, K2p, O1s, and Mn2p at 284 eV, 292.5 eV, 532 eV, and 641.9 eV, respectively. The atomic percentage quantification is reported in Table 1, and the weighted composition is obtained by correcting the band area for the atomic mass. The carbonaceous material shows the great presence of carbon and manganese with oxygen that is involved in the manganese oxide phase and oxygen-functional groups in the carbon phase. Indeed, the carbon phase contains 15% of oxygen functionalities in the structure (Table S3, ESI†).
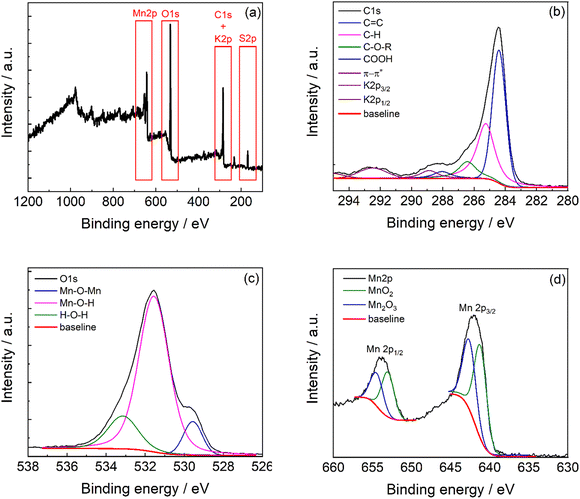 | ||
| Fig. 5 (a) XPS survey spectra of C-50 and high-resolution XPS spectra of the (b) C1s region, (c) O1s region, and (d) Mn2p region. | ||
| Binding energy (eV) | Abundancy (%) | Weighed abundancy (%) | |
|---|---|---|---|
| C | 1s 284.4 | 25.9 | 15.7 |
| K | 2p 292.5 | 1.9 | 3.2 |
| O | 1s 531.5 | 51.7 | 35.7 |
| S | 2p 168.4 | 3.2 | 4.4 |
| Mn | 2p3/2 642.2 | 17.3 | 41.0 |
The XPS high resolution of C1s (Fig. 5b) exhibits contributions of C![[double bond, length as m-dash]](https://www.rsc.org/images/entities/char_e001.gif) C carbon at 284.1 eV, C–H at 284.9 eV, C–O–R at 286.0 eV, and C
C carbon at 284.1 eV, C–H at 284.9 eV, C–O–R at 286.0 eV, and C![[double bond, length as m-dash]](https://www.rsc.org/images/entities/char_e001.gif) O at 288.2 eV.38,39 These signals overlay with the less intense K2p signals. Also, S2p shows the typical 2p3/2/2p1/2 doublet separation of 1.18eV with peaks constrained to a 2/1 area ratio (2p3/2/2p1/2) (Fig. S2, ESI†).40
O at 288.2 eV.38,39 These signals overlay with the less intense K2p signals. Also, S2p shows the typical 2p3/2/2p1/2 doublet separation of 1.18eV with peaks constrained to a 2/1 area ratio (2p3/2/2p1/2) (Fig. S2, ESI†).40
The O1s region (Fig. 5c) presents at least three contributions indicating the Mn–O bonds with a prevalence of Mn–O–H terminals (75% from the integrated deconvolution reported in Table S4, ESI†). This agrees with the presence of a nanocrystalline material with extended boundaries. The Mn2p region (Fig. 5d) shows the two signals related to the spin–orbit coupling (Mn2p3/2 and Mn2p1/2). The manganese bands result from the contribution of the MnO2 phase at 641.3 eV41,42 and Mn2O3 at 642.6 eV41,42 in a 4![[thin space (1/6-em)]](https://www.rsc.org/images/entities/char_2009.gif) :
:![[thin space (1/6-em)]](https://www.rsc.org/images/entities/char_2009.gif) 6 ratio (Table S5, ESI†).
6 ratio (Table S5, ESI†).
Fig. 6 shows the TGA analysis under thermal and thermo-oxidative conditions. These curves are totally different from pure graphitic materials and evidence the presence of metal oxides. The two curves display almost the same behavior up to 200 °C. The sample is stable in Ar up to 500 °C, as expected. Hence, above 600 °C, the mass continues to decrease but, at low rate, with a total mass decrease of 45%. This would mean that 55% of C-50 is constituted by inorganic materials (presumably oxides), in agreement with SAED and XPS analyses. Hence, the residual quantity, 55% of the total mass, agrees with MnOx observed by XPS analysis. The TGA curve in O2 displays a mass decrease occurring by steps, starting at around 250 °C, 400 °C and 750 °C, with a final residue of 45%. This curve is very similar to that of MnO2,43 where the mass decreases up to 400 °C is explained by the removal of the adsorbent and the transformation of MnOx to the other crystalline oxide phases up to the conversion of MnO2 to Mn2O3 above 700 °C with oxygen release. Fig. 6b shows the XRD patterns of the residues from the two TGA analyses in Ar and O2. The patterns display the presence of MnO in the residue after the TGA in an inert atmosphere, and the presence of oxides of Mn(III) and Mn(IV) formed throughout the TGA in oxygen.
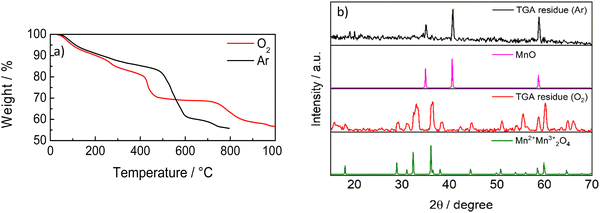 | ||
| Fig. 6 (a) TGA curves of C-50 in Ar and O2 at 10 °C min−1. (b) XRD patterns of the residues from the TGA of Fig. 6a, MnO (reference code 01-075-0626) and Mn3O4 (reference code 01-089-4837). | ||
We can estimate that in the reported samples the content of C is less than 50%, by considering that the decrease below 200 °C could also be due to the adsorbed water and the oxygen-containing functional groups (15% from XPS analysis) and the remaining ash is mainly constituted of metal oxides.
2.3 Electrochemical characterization of carbons
The high inorganic material content could affect the adhesion on Cu current collectors. Indeed, we did not observe any improvement in passing from the coarse C to the more homogeneous C-20 with a SA binder, even by changing the conductive carbon Super C65 with the Super C45, more suitable for aqueous processes. The formation of an agglomerate is evident in all the formulations with the SA binder and could be justified by the presence of manganese cations that could have a mild and unsteady complexing effect on SA.44 With the carbon C and C-20, different formulations have been prepared and reported in Table 2.| # | Carbon % | Binder % | Additive % | Dispersing agent | Formulation type | Current collector | Adhesion | mg cm−2 active |
|---|---|---|---|---|---|---|---|---|
| a The high absolute error is due to the detachment of small portions of the deposit from the current collector. The weight of each electrode, and not the mean value, was considered for the specific capacity evaluation. | ||||||||
| 1 | C 90 | PTFE 5 | Super C65 5 | Ethanol | Solid | None | n.a. | 19.8 ± 0.7; 3.13 ± 0.06 |
| 2 | C 80 | PVDF 10 | Super C65 10 | NMP | Slurry | Cu | Good | 3.6 ± 1.2a |
| 3 | C 87 | SA 3 | Super C65 10 | Water![[thin space (1/6-em)]](https://www.rsc.org/images/entities/char_2009.gif) : :![[thin space (1/6-em)]](https://www.rsc.org/images/entities/char_2009.gif) isopropanol 80 isopropanol 80![[thin space (1/6-em)]](https://www.rsc.org/images/entities/char_2009.gif) : :![[thin space (1/6-em)]](https://www.rsc.org/images/entities/char_2009.gif) 20 20 |
Slurry | Cu | Poor | 2.7 ± 0.5 |
| 4 | C-20 87 | SA 3 | Super C45 10 | Water![[thin space (1/6-em)]](https://www.rsc.org/images/entities/char_2009.gif) : :![[thin space (1/6-em)]](https://www.rsc.org/images/entities/char_2009.gif) isopropanol 80 isopropanol 80![[thin space (1/6-em)]](https://www.rsc.org/images/entities/char_2009.gif) : :![[thin space (1/6-em)]](https://www.rsc.org/images/entities/char_2009.gif) 20 20 |
Slurry | Cu | Poor | 2.9 ± 1.2a |
SEM images of the electrodes with formulations #1 and #4 are shown in Fig. 7. The heterogenicity of the material particles used in electrodes with formulations #1–#3 causes inhomogeneous electrode surfaces that could affect the solid electrolyte interface layer (SEI) formation and cycling. The self-standing electrodes (Fig. 7a and b) seem more compact than those from the slurries #2 and #3 (Fig. 7c–f). The electrode obtained from C-20 (Fig. 7g and h) shows an increased homogeneous composite with numerous cracks. It is also worth noting that, if the fractures are present only on the electrode surface, this could positively affect the electrochemical performance, allowing a better wetting of the electrode.
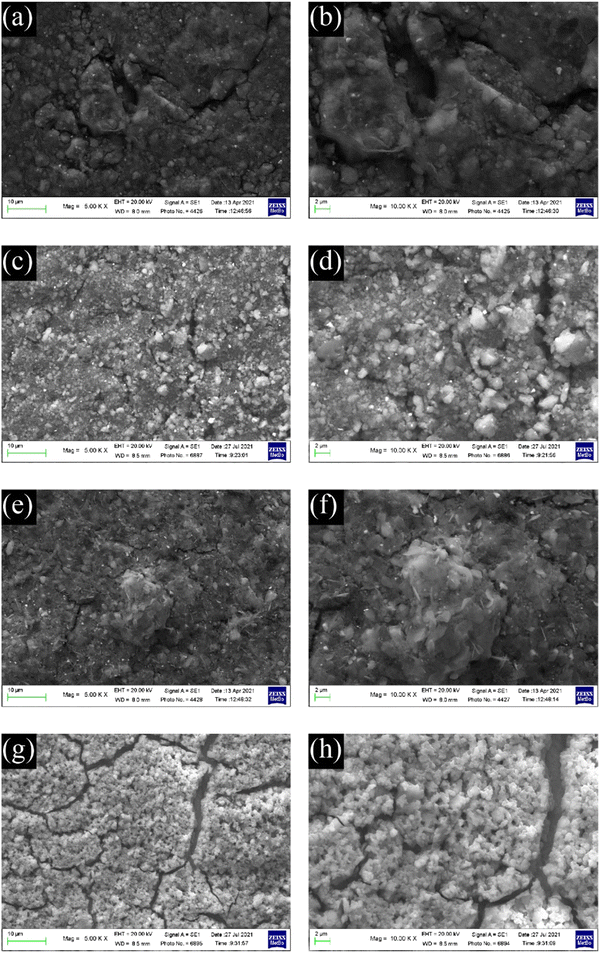 | ||
| Fig. 7 SEM images of electrodes from formulations #1 (a and b), #2 (c and d), #3 (e and f), and #4 (g and h). | ||
Free-standing electrodes (#1) were too resistive, even the thinnest ones. The electrodes with formulations #2, #3 and #4 gave the voltametric response of the first two cycles and is shown in Fig. 8.
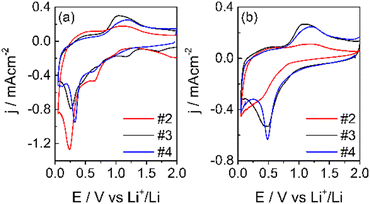 | ||
| Fig. 8 1st CV (a) and 2nd (b) CV at 50 μV s−1 in LP30, WE: carbon electrodes, CE-RE: lithium, separator Whatman: GF/A. | ||
As expected, the shape of the CVs is different from that of pure graphite.45 During the first cycle, in addition to the reduction peak of EC at ca. 0.75 V,46 other reduction processes are present and disappear in the second cycle. The reduction peak is near 0.25 V for both samples, and the oxidation peak is at ca. 1.0 V. These processes are ascribed to the reduction of Mn4+ to Mn(0) and to the oxidation of metallic Mn to Mn2+. The further oxidation of Mn2+ occurs at potentials higher than 2 V.32 In the 2nd CV, the reduction broad peak shifts at ca. 0.5 V and remains constant also for the following cycles, indicating the conversion of the Mn2O3 and MnO2 phases (observed in XPS) to MnO. The reduction of Mn4+ and Mn3+ to Mn2+ occurs during the first reduction process with the formation of Li2O.36,47 In addition, MnO2 can be lithiated and converted to LiMnO2. In this case, part of the irreversible capacity loss of the first cycle can be attributed to the lithium consumption. Also, the conversion reaction of Mn2+/Mn0 leads to the formation of Li2O. Li2O could passivate the electrode, given its not conductive nature, and be responsible for the capacity fade of manganese materials.47 Moreover, the electrode operating potential window was limited to 2V to maintain the Mn2+ oxidation state, which seems the most promising for the negative electrode in LIBs. Indeed, besides the redox processes occurring between 0 and 2.0 V, the specific capacity of MnO is 756 mA h g−1.47
The electrode with the PVDF binder (#2) displays a lower coulombic efficiency than the electrodes with the SA binders (#3 and #4). The higher concentration and more uniform distribution of the carboxylic groups along the SA chains facilitate the Li+ movement and hence, the insertion/deinsertion processes, and can improve the quality of the SEI. For this and other advantageous properties, like the need of lower percentages of the binder in the electrode formulation, it was first proposed as a binder for Si-based anode materials48 and for high voltage cathodes like LiNi0.5Mn1.5O4.49,50
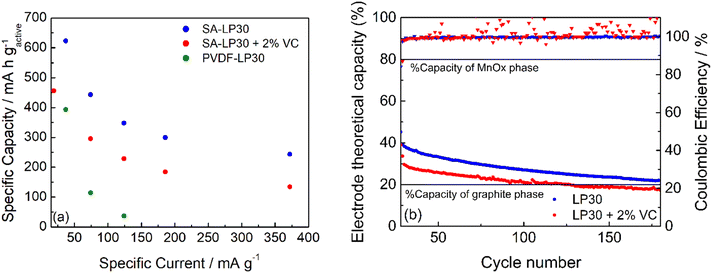
The capacity performance of the formulation #3 with SA was tested in LP30 and LP30 – 2% VC. The rate capability was also compared to that of #2. The currents calculated in the rate capability experiments are based on the mass of the active material (carbon and MnOx).
Fig. 9a and b report the rate capability and stability tests of the formulation #3 (see also Fig. S3a, ESI†). GCD cycles demonstrated that the formulation with PVDF is worse than that with SA, as expected from the low coulombic efficiency evinced from CVs of Fig. 8, although the electrode adhesion to the current collector is better. The electrode #3 tested in LP30 – 2% VC shows a smaller specific capacity at different current regimes. The coulombic efficiency gives scattered values (Fig. 9b), indicating that the formed SEI is quite unstable without significantly affecting the capacity retention. The addition of VC seems not to improve either the capacity performance or the cycle stability. However, the difficulties of obtaining electrodes with a good adhesion may have a role in this evaluation and work in progress to evaluate other current collectors. The stability of #3 electrodes was evaluated after the rate capability test, considering the percentage variation of the electrode theoretical capacity (t.c.) that was obtained from the active material composition from XPS studies (Section S2 in the ESI†). A 31% graphitic carbon (t.c. 372 mA h g−1) contributes to the 20% electrode capacity, while 61% of the manganese oxide phase (considered t.c. 756 mA h g−1) determines the remaining 80%. Upon cycling (Fig. 9b), the electrode capacity approaches asymptotically the theoretical capacity of the graphitic phase. Thus, during cycling, the formation of Li2O leads to an unstable Mn/Mn2+ conversion reaction without affecting the insertion/deinsertion process of graphitic carbon. Also, graphitic carbon seems to exhibit a high capacity approaching the theoretical capacity even if part of the Mn-phase is still electrochemically active.
It has been considered, as the best case for graphite, that the loss of capacity over cycling is mainly due to MnO2, also by considering the high loss of the first cycles. It is not possible to assert that graphite remains unaltered over cycling or its specific capacity near the theoretical one. If the graphite has a lower specific capacity, the results indicate that a higher amount of MnO2 is still working after 200 cycles.
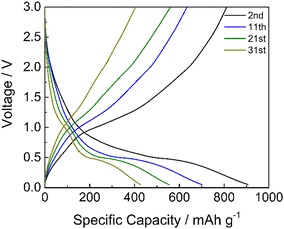
Limiting the specific current to 100 mA g−1, the GDC cycles demonstrated that the cycling stability of manganese oxides improves with a mild cycling protocol and that the inorganic phase is electrochemically active (Fig. 10). The specific capacity is higher if compared to the results reported in Fig. 9a at a similar current. This is because the electrode has not performed the initial cycles at very low current rates as in the rate capability test of Fig. 9a, where the material stability could have been affected by unwanted and/or irreversible processes, as the low coulombic efficiencies of these cycles testify (Fig. S3, ESI†). The discharge voltage plateau is around 0.5 V, and a not well-defined charge voltage plateau appears at around 1.0 V, corresponding to the formation and decomposition of Li2O and metal nanocrystals with a coulombic efficiency of around 92%. Hence, the repeated volume expansion and contraction of the active particle during cycling affects cycling stability. However, these results indicate that the graphite phase displays a high specific capacity and that the inorganic phase is electrochemically active, even if the stability must be optimized.
This indicates that the graphitic carbon obtained from MSCC-ET is quite promising and the control on the MnOx content needs to be investigated deeper to exploit the properties of both active materials. Stabilization of MnOx, reduction of the material with H2 treatment and creation of oxygen vacancies on MnO2 particles or reducing the amount of MnO2 with additional acid treatment could be suitable options.
3 Conclusions
The synthesis of a CO2-derived battery electrode based on a composite of manganese oxides and graphitic carbon via the MSCC-ET method was demonstrated in this work. The carbon material used for the electrode was synthesized in pure Li2CO3 at 770 °C using a NiCr anode and a galvanized steel cathode. The latter leads to a notable concentration (up to 55 wt%) of manganese oxides into the carbon material as nanocrystals embedded in the carbonaceous matrix as coherently demonstrated by chemical–physical characterization studies. The obtained material had been tested as a negative electrode for LIBs with an environmentally sustainable aqueous process. In the first cycles, the electrochemical conversion of manganese is demonstrated as the principal faradic process contributing to the electrode capacity. Varying the specific current, the electrode capacity approaches the graphite theoretical capacity asymptotically, demonstrating the good performance of the graphite phase. At the same time, GCD cycles at 100 mA g−1 show the feasibility of the manganese oxide phase cycling with high specific capacity. The electrochemical properties of the presented material ought to be optimized, mainly in terms of adhesion to the current collector and granulometry of the active material. However, the MSCC-ET process, commonly used for the sustainable synthesis of carbon allotropes, is demonstrated to be a suitable process to obtain nanocrystalline inclusion in the graphitic matrix and pave the way to new methods to produce composite materials. Controlling the amount of MnOx, its crystalline structure and its distribution in the synthesized carbonaceous material is the goal of this new application for the MSCC-ET process to improve anode performance by taking advantage from the presence of a stable, high-capacity inorganic material like MnOx.4 Experimental
4.1. Material synthesis
The carbon is synthesized in an Al2O3 crucible (99%, Xiamen Innovacera Advanced Materials Co., China) filled with Li2CO3 (p.a., Lachner). The crucible was carefully lowered into a 304 stainless steel reactor tube, as shown in Fig. 1. The reactor was then heated to 770 °C and maintained at that temperature for an hour to completely melt the Li2CO3. A 5 cm2 NiCr (80% Ni, 20% Cr, Goodfellow, UK) anode and a galvanized steel (metall24.ee, Estonia) electrode were then inserted into the carbonate melt. CO2 was bubbled through the carbonate melt during the electrolysis process at a flow rate of 0.1 SLPM to minimize the formation of lithium oxide, which might get trapped into the material and affect the performance of the materials in batteries (Li2O is generated during the electrolysis process on the cathode along with the carbon with the four-electron transfer reaction shown before and reacts with CO2 to form lithium carbonate). The oxide tends to be deposited inside of the graphitic carbon structures, making it hard to remove.The current density was increased with steps of 0.05 A cm−2 up to 0.2 A cm−2, with the first two steps taking 5 min and the second two 10 min. This ensures the formation of nickel-based growth nucleation sites on the cathode. After applying 0.2 A cm−2 for 10 min, the current density was increased to 1 A cm−2 and the electrolysis was conducted for 1 h, after which the electrodes were raised out of the carbonate melt. The electrode with the material attached was then cooled down to room temperature and washed with 5 mol L−1 HCl (Merck) to remove the residual Li2CO3 until no bubbling was visible, during which the material detached from the electrode into the acidic solution. The suspension of the material was then vacuum filtered and washed with Milli-Q water until a neutral pH was reached, after which it was dried at 70 °C and weighed.
4.2. Carbon material characterization
The morphology of the carbon material and electrodes was investigated by SEM using a Zeiss EVO 50 microscope equipped with an energy dispersive X-ray analyzer from Oxford INCA Energy 350 system. STEM images were collected using a TEM/STEM FEI TECNAI F20 microscope at 200 keV equipped with an EDS detector in the HADF-STEM mode. The powder was dispersed in isopropanol and sonicated for 10 min. The TEM gold grid was prepared by drop casting (at 60 °C) of the dispersion.Raman spectroscopy analysis was carried out using a microscope RENISHAW Mod INVIA with an argon ion laser (λ = 514 nm, 5 scan, 20 s, resolution 1–2 cm−1, 50×), while thermogravimetric analysis (TGA) was performed using a TA Instrument Q50 with Ar both as purge and sample gases or with 60 mL min−1 Ar as the purge gas and 40 mL min−1 O2 as the sample gas. XRD patterns were collected on carbon powders using an X-ray diffractometer PANalytical X’Pert PRO (Malvern Panalytical, United Kingdom) equipped with an X’Celerator detector (Cu Kα radiation, 40 mA, 40 kV).
XPS studies were performed on CF_P samples using a Specs EnviroESCA instrument equipped with an AlKα excitation source (hν = 1486.7 eV). Survey spectra were collected at an operating pressure of ca. 10–6 mbar in the binding energy (BE) range between 0 and 1460 eV, acquiring data at a pass energy of 100 eV, every 1.0 eV step-1, and at 0.1 s step-1. High resolution scans were collected at a pass energy of 40 eV, 0.1 eV step-1, and at 0.5 s step-1. XPS curves (BE uncertainty = ±0.2 eV) were fitted by means of the Keystone software provided by Specs and applying a Shirley-type background function.51 The shift in terms of binding energy was corrected assigning a value of 284.1/284.4 eV to the C1s peak attributed to the carbon sp2-type.38,52 The atomic percentage (at%) quantification is obtained using the sensitivity factors of integrated peak areas supplied by Specs.
4.3. Electrode preparation
A carbon portion (2 g) was ground in a mortar and then in a planetary mill (Pulverisette 6, Fritsch) with a 14 cm3 WC jar and 10 WC balls (5 mm diam.) for 15 min at 600 rpm and for 45 min at 450 rpm with the addition of a small amount of water (ca. 2 mL) to improve the grinding (C). Scanning electron microscopy images and electron diffraction spectroscopy analysis are reported in Fig. S1 and Table S1 (ESI†). Another portion of carbon (2 g) was ground for 2 hours at 400 rpm in a 70 cm3 agate jar with 13 agate balls (10 mm diam.) and 4 balls (20 mm diam.). The powder was then sieved with 50 and 20 μm sieves. About 60% of C was collected using the 20 μm sieve (C-20) and 30% using the 50 μm sieve (C-50). The latter portion of the material with a particle/agglomerate size between 20 μm and 50 μm was mainly used for physicochemical characterization.Slurries were prepared using polyvinilydene difluoride (PVDF, Kynar HSV 900, Arkema) as the binder soluble in N-methylpyrrolidone (NMP, Sigma-Aldrich). Slurries and solid composites were prepared with sodium alginate (SA, Sigma Aldrich), Teflon suspension (PTFE, Du Pont aqueous dispersion, Teflon™ 60 wt%, density 1.5 g cm−3), Na carboxymethyl cellulose (CMC, Sigma Aldrich, ultra-low viscosity) and styrene–butadiene rubber (SBR, Zeon BM 400b) as the binder soluble in water. SuperC65 and SuperC65 (Imerys) were used as conducting agents. The formulations were C![[thin space (1/6-em)]](https://www.rsc.org/images/entities/char_2009.gif) :
:![[thin space (1/6-em)]](https://www.rsc.org/images/entities/char_2009.gif) PVDF (80
PVDF (80![[thin space (1/6-em)]](https://www.rsc.org/images/entities/char_2009.gif) :
:![[thin space (1/6-em)]](https://www.rsc.org/images/entities/char_2009.gif) 10) for the slurry in NMP, C
10) for the slurry in NMP, C![[thin space (1/6-em)]](https://www.rsc.org/images/entities/char_2009.gif) :
:![[thin space (1/6-em)]](https://www.rsc.org/images/entities/char_2009.gif) SA (87
SA (87![[thin space (1/6-em)]](https://www.rsc.org/images/entities/char_2009.gif) :
:![[thin space (1/6-em)]](https://www.rsc.org/images/entities/char_2009.gif) 3), C
3), C![[thin space (1/6-em)]](https://www.rsc.org/images/entities/char_2009.gif) :
:![[thin space (1/6-em)]](https://www.rsc.org/images/entities/char_2009.gif) CMC
CMC![[thin space (1/6-em)]](https://www.rsc.org/images/entities/char_2009.gif) :
:![[thin space (1/6-em)]](https://www.rsc.org/images/entities/char_2009.gif) SBR (85
SBR (85![[thin space (1/6-em)]](https://www.rsc.org/images/entities/char_2009.gif) :
:![[thin space (1/6-em)]](https://www.rsc.org/images/entities/char_2009.gif) 7
7![[thin space (1/6-em)]](https://www.rsc.org/images/entities/char_2009.gif) :
:![[thin space (1/6-em)]](https://www.rsc.org/images/entities/char_2009.gif) 3), and C
3), and C![[thin space (1/6-em)]](https://www.rsc.org/images/entities/char_2009.gif) :
:![[thin space (1/6-em)]](https://www.rsc.org/images/entities/char_2009.gif) CMC
CMC![[thin space (1/6-em)]](https://www.rsc.org/images/entities/char_2009.gif) :
:![[thin space (1/6-em)]](https://www.rsc.org/images/entities/char_2009.gif) PTFE (85
PTFE (85![[thin space (1/6-em)]](https://www.rsc.org/images/entities/char_2009.gif) :
:![[thin space (1/6-em)]](https://www.rsc.org/images/entities/char_2009.gif) 7
7![[thin space (1/6-em)]](https://www.rsc.org/images/entities/char_2009.gif) :
:![[thin space (1/6-em)]](https://www.rsc.org/images/entities/char_2009.gif) 3) for the slurry in water
3) for the slurry in water![[thin space (1/6-em)]](https://www.rsc.org/images/entities/char_2009.gif) :
:![[thin space (1/6-em)]](https://www.rsc.org/images/entities/char_2009.gif) isopropanol (80
isopropanol (80![[thin space (1/6-em)]](https://www.rsc.org/images/entities/char_2009.gif) :
:![[thin space (1/6-em)]](https://www.rsc.org/images/entities/char_2009.gif) 20) and C
20) and C![[thin space (1/6-em)]](https://www.rsc.org/images/entities/char_2009.gif) :
:![[thin space (1/6-em)]](https://www.rsc.org/images/entities/char_2009.gif) PTFE (90
PTFE (90![[thin space (1/6-em)]](https://www.rsc.org/images/entities/char_2009.gif) :
:![[thin space (1/6-em)]](https://www.rsc.org/images/entities/char_2009.gif) 5) for the free standing electrode. The remaining percentage is carbon additive, as indicated in Table 2. The free-standing electrodes were calendered in order to obtain two different loadings (see Table 2). The slurries were prepared by ball milling carbons in a WC jar with the addition of the binder dissolved in a low amount of water for 90 min at 450 rpm. The slurries were deposited on Cu foil using a Mini Coating Machine (Hohsen Corporation) at 0.3 cm s−1 and dried at RT overnight. Hence, the electrodes were cut (9 mm diameter) and pressed at 2 tons for 2 min. While the adhesion of the slurry with PVDF is good, that of the slurry with SA is poor.
5) for the free standing electrode. The remaining percentage is carbon additive, as indicated in Table 2. The free-standing electrodes were calendered in order to obtain two different loadings (see Table 2). The slurries were prepared by ball milling carbons in a WC jar with the addition of the binder dissolved in a low amount of water for 90 min at 450 rpm. The slurries were deposited on Cu foil using a Mini Coating Machine (Hohsen Corporation) at 0.3 cm s−1 and dried at RT overnight. Hence, the electrodes were cut (9 mm diameter) and pressed at 2 tons for 2 min. While the adhesion of the slurry with PVDF is good, that of the slurry with SA is poor.
4.4. Electrode characterization
The electrochemical characterization of the electrodes was carried out in Swagelok cells (three-electrode mode), with a Whatman GF/A separator and 500 μL of the electrolyte containing EC![[thin space (1/6-em)]](https://www.rsc.org/images/entities/char_2009.gif) :
:![[thin space (1/6-em)]](https://www.rsc.org/images/entities/char_2009.gif) DMC (1
DMC (1![[thin space (1/6-em)]](https://www.rsc.org/images/entities/char_2009.gif) :
:![[thin space (1/6-em)]](https://www.rsc.org/images/entities/char_2009.gif) 1) 1 mol L−1 LiPF6 (LP30, Selectilyte BASF, Germany) and, eventually, vinylene carbonate (VC, 97%, Carbolution Chemicals GmbH). Cyclic voltammetries (CVs) and galvanostatic charge/discharge (GCD) cycles at different specific currents were performed at 30°C in a thermostated oven.
1) 1 mol L−1 LiPF6 (LP30, Selectilyte BASF, Germany) and, eventually, vinylene carbonate (VC, 97%, Carbolution Chemicals GmbH). Cyclic voltammetries (CVs) and galvanostatic charge/discharge (GCD) cycles at different specific currents were performed at 30°C in a thermostated oven.
Conflicts of interest
The authors declare no conflicts of interest.Acknowledgements
This work was financially supported by the Estonian Research Council grant PSG312 and by the EU through the European Regional Development Fund (projects no.: 2014-2020.4.01.16-0041 and 2014-2020.4.01.15-0005, TK134 EQUiTANT) and the European Space Agency. G. L. acknowledges the Department of Excellence program financed by the Minister of Education, University and Research (MIUR, L. 232 del 01/12/2016) for the doctoral scholarship. Prof. V. Di Noto and Dr G. Pagot (University of Padua) are acknowledged for XPS measurements. Dr V. Morandi and Dr A. Migliori (CNR-IMM, Bologna) are acknowledged for STEM measurements and Mr Nicolò Albanelli for XRD measurements.References
- U.S. Energy Information Administration, Short-Term Energy Outlook March 2021, https://www.eia.gov/outlooks/steo/pdf/steo_full.pdf (last visit 20/03/21).
- J. Lau, G. Dey and S. Licht, Thermodynamic assessment of CO2 to carbon nanofiber transformation for carbon sequestration in a combined cycle gas or a coal power plant, Energy Convers. Manage., 2016, 122, 400–410, DOI:10.1016/j.enconman.2016.06.007.
- W. Weng, L. Tang and W. Xiao, Capture and electro-splitting of CO2 in molten salts, J. Energy Chem., 2019, 28, 128–143, DOI:10.1016/j.jechem.2018.06.012.
- R. Jiang, M. Gao, X. Mao and D. Wang, Advancements and potentials of molten salt CO2 capture and electrochemical transformation (MSCC-ET) process, Curr. Opin. Electrochem., 2019, 17, 38–46, DOI:10.1016/j.coelec.2019.04.011.
- A. Yu, G. Ma, J. Ren, P. Peng and F. F. Li, Sustainable Carbons and Fuels: Recent Advances of CO2 Conversion in Molten Salts, ChemSusChem, 2020, 13, 6229–6245, DOI:10.1002/cssc.202002060.
- J. Ge, J. Wang, J. Cheng and S. Jiao, Electrochemical Conversion of CO2 in Molten CaCl2-LiCl-CaO Utilizing a Low-Cost (1-x)CaTiO3-xNi Inert Anode, J. Electrochem. Soc., 2016, 163, E230–E234, DOI:10.1149/2.1361608jes.
- A. Douglas, R. Carter, N. Muralidharan, L. Oakes and C. L. Pint, Carbon, 2017, 16, 572–578, DOI:10.1016/j.carbon.2017.02.032.
- A.-L. Remmel, S. Ratso, G. Divitini, M. Danilson, V. Mikli, M. Uibu, J. Aruväli and I. Kruusenberg, Iron catalyzed growth of crystalline multi-walled carbon nanotubes from ambient carbon dioxide mediated by molten carbonates, ACS Sustain, Chem. Eng., 2021, 10(1), 134–145, DOI:10.1021/ACSSUSCHEMENG.1C05250.
- J. Asenbauer, T. Eisenmann, M. Kuenzel, A. Kazzazi, Z. Chen and D. Bresser, The success story of graphite as a lithium-ion anode material – fundamentals, remaining challenges, and recent developments including silicon (oxide) composites, Sustainable Energy Fuels, 2020, 4, 5387–5416, 10.1039/D0SE00175A.
- Z. Ogumi and H. Wang, Carbon anode materials in Lithium-Ion Batteries - Science and Technologies, ed. M. Yoshio, R. J. Brodd and A. Kozawa, Springer-Verlag, New York, USA, 1st edn, 2009, pp. 49–73 DOI:10.1007/978-0-387-34445-4.
- Environmental and socio-economic challenges in battery supply chains: graphite and lithium, 2020, https://www.oeko.de/fileadmin/oekodoc/Graphite-Lithium-Env-Soc-Eco-Challenges.pdf (last visit on 20th December 2021).
- https://westwaterresources.net/minerals-portfolio/graphite-market/ (last visit on 7th December 2021).
- N. S. Hudak, Nanostructured electrode materials for lithium-ion batteries in Lithium-ion batteries: Advances and Applications, ed. G. Pistoia, Elsevier B. V., Amsterdam, The Netherlands, 2014, pp. 57–82 DOI:10.1016/B978-0-444-59513-3.00004-2.
- I. Lahiri and W. Choi, Carbon nanostructures in lithium ion batteries: past, present, and future, Carbon Nanostructures in Lithium Ion Batteries: Past, Present, and Future, Crit. Rev. Solid State Mater. Sci., 2013, 38, 128–166, DOI:10.1080/10408436.2012.729765.
- S. Goriparti, E. Miele, F. De Angelis, E. Di Fabrizio, R. Proietti Zaccaria and C. Capiglia, Review on recent progress of nanostructured anode materials for Li-ion batteries, J. Power Sources, 2014, 257, 421–443, DOI:10.1016/j.jpowsour.2013.11.103.
- P. Poizot, S. Laruelle, S. Grugeon, L. Dupont and J. Tarascon, Nano-Sized Transition-Metal Oxides as Negative-Electrode Materials for Lithium-Ion Batteries, Nature, 2000, 407, 496, DOI:10.1038/35035045.
- R. Sun, Z. Qin, Z. Li, H. Fan and S. Lu, Binary zinc–cobalt metal–organic framework derived mesoporous ZnCo2O4@NC polyhedron as a high-performance lithium-ion battery anode, Dalton Trans., 2020, 49, 14237–14242, 10.1039/d0dt03132a.
- Y.-C. Tsai, C.-T. Kuo, S.-F. Liu, Y.-T. Lee and T.-R. Yew, Effect of Different Electrolytes on MnO2 Anodes in Lithium-Ion Batteries, J. Phys. Chem. C, 2021, 125, 1221–1233, DOI:10.1021/acs.jpcc.0c09022.
- H. Lai, J. Li, Z. Chen and Z. Huang, Carbon Nanohorns as a High Performance Carrier for MnO2 Anode in Lithium-Ion Batteries, ACS Appl. Mater. Interfaces, 2012, 4, 2325–2328, DOI:10.1021/am300378w.
- D.-S. Liu, D.-H. Liu, B.-H. Hou, Y.-Y. Wang, J.-Z. Guo, Q.-L. Ning and X.-L. Wu, 1D porous MnO@N-doped carbon nanotubes with improved Li storage properties as advanced anode material for lithium-ion batteries, Electrochim. Acta, 2018, 264, 292–300, DOI:10.1016/j.electacta.2018.01.129.
- H. Zhu, Z. Li, F. Xu, Z. Qin, R. Sun, C. Wang, S. Lu, Y. Zhang and H. Fan, Ni3Se4@CoSe2 hetero-nanocrystals encapsulated into CNT-porous carbon interpenetrating frameworks for high-performance sodium ion battery, J. Colloid Interface Sci., 2022, 611, 718–725, DOI:10.1016/j.jcis.2021.11.175.
- X.-X. Luo, W.-H. Li, H.-J. Liang, H.-X. Zhang, K.-D. Du, X.-T. Wang, X.-F. Liu, J.-P. Zhang and X.-L. Wu, Covalent Organic Framework with Highly Accessible Carbonyls and π-Cation Effect for Advanced Potassium-Ion Batteries, Angew. Chem., Int. Ed., 2022, 61, e202117661, DOI:10.1002/anie.202117661.
- X. Wang, F. Sharif, X. Liu, G. Licht, M. Lefler and S. Licht, Magnetic Carbon Nanotubes: Carbide Nucleated Electrochemical Growth of Ferromagnetic CNTs from CO2, J. CO2 Util., 2020, 40, 101218, DOI:10.1016/J.JCOU.2020.101218.
- S. Arcaro, F. A. Berutti, A. K. Alves and C. P. Bergmann, MWCNTs produced by electrolysis of molten carbonate: Characteristics of the cathodic products grown on galvanized steel and nickel chrome electrodes, Appl. Surf. Sci., 2019, 466, 367–374, DOI:10.1016/J.APSUSC.2018.10.055.
- M. Demir, Z. Kahveci, B. Aksoy, N. K. R. Palapati, A. Subramanian, H. T. Cullinan, H. M. El-Kaderi, C. T. Harris and R. B. Gupta, Graphitic Biocarbon from Metal-Catalyzed Hydrothermal Carbonization of Lignin, Ind. Eng. Chem. Res., 2015, 54, 10731–10739, DOI:10.1021/ACS.IECR.5B02614.
- X. Liu, X. Wang, G. Licht and S. Licht, Transformation of the greenhouse gas carbon dioxide to graphene, J. CO2 Util., 2020, 36, 288–294, DOI:10.1016/j.jcou.2019.11.019.
- H. Marsh and A. P. Warburton, Catalysis of graphitisation, J. Appl. Chem., 1970, 20, 133–142, DOI:10.1002/JCTB.5010200409.
- I. Mochida, R. Ohtsubo, K. Takeshita and H. Marsh, Catalytic graphitization of non-graphitizable carbon by chromium and manganese oxides, Carbon, 1980, 18, 117–123, DOI:10.1016/0008-6223(80)90019-6.
- I. Kruusenberg, N. Alexeyeva, K. Tammeveski, J. Kozlova, L. Matisen and V. Sammelselg, et al., Effect of purification of carbon nanotubes on their electrocatalytic properties for oxygen reduction in acid solution, Carbon, 2011, 49, 4031–4039, DOI:10.1016/j.carbon.2011.05.048.
- R. Jiang, M. Gao, X. Mao and D. Wang, Advancements and potentials of molten salt CO2 capture and electrochemical transformation (MSCC-ET) process, Curr. Opin. Electrochem., 2019, 17, 38–46, DOI:10.1016/j.coelec.2019.04.011.
- S. Ratso, P. R. Walke, V. Mikli, J. Ločs, K. Šmits and V. Vītola, et al., CO2 turned into a nitrogen doped carbon catalyst for fuel cells and metal–air battery applications, Green Chem., 2021, 23, 4435–4445, 10.1039/D1GC00659B.
- A. Remmel, S. Ratso, G. Divitini, M. Danilson, V. Mikli and M. Uibu, et al., Nickel and Nitrogen-Doped Bifunctional ORR and HER Electrocatalysts Derived from CO2, ACS Sustainable Chem. Eng., 2022, 10, 134–145, DOI:10.1021/acssuschemeng.1c05250.
- H. V. Ijije, R. C. Lawrence and G. Z. Chen, Carbon electrodeposition in molten salts: Electrode reactions and applications, RSC Adv., 2014, 4, 35808–35817, 10.1039/c4ra04629c.
- L. Hu, Y. Song, S. Jiao, Y. Liu, J. Ge and H. Jiao, et al., Direct Conversion of Greenhouse Gas CO2 into Graphene via Molten Salts Electrolysis, ChemSusChem, 2016, 9, 588–594, DOI:10.1002/cssc.201501591.
- X. Wang, X. Liu, G. Licht, B. Wang and S. Licht, Exploration of Alkali Cation Variation on the Synthesis of Carbon Nanotubes by Electrolysis of CO2 in Molten Carbonates, J. CO2 Util., 2019, 34, 303–312, DOI:10.1016/j.jcou.2019.07.007.
- C. Julien, M. Massot, R. Baddour-Hadjean, S. Franger, S. Bach and J. P. Pereira-Ramos, Raman spectra of birnessite manganese dioxides, Solid State Ionics, 2003, 159, 345–356, DOI:10.1016/S0167-2738(03)00035-3.
- M. Rana, V. Sai Avvaru, N. Boaretto, V. A. de la Peña O'Shea, R. Marcilla and V. Etacheri, et al., High rate hybrid MnO2@CNT fabric anodes for Li ion batteries: properties and a lithium storage mechanism study by in situ synchrotron X-ray scattering, J. Mater. Chem. A, 2019, 7, 26596–26606, 10.1039/c9ta08800h.
- L. Eifert, R. Banerjee, Z. Jusys and R. Zeis, Characterization of Carbon Felt Electrodes for Vanadium Redox Flow Batteries: Impact of Treatment Methods, J. Electrochem. Soc., 2018, 165, A2577–A2586, DOI:10.1149/2.0531811jes.
- V. Di Noto, E. Negro, S. Polizzi, P. Riello and P. Atanassov, Preparation, characterization and single-cell performance of a new class of Pd-carbon nitride electrocatalysts for oxygen reduction reaction in PEMFCs, Appl. Catal., B, 2012, 111–112, 185–199, DOI:10.1016/j.apcatb.2011.09.034.
- H. W. Nesbitt, M. Scaini, H. Hochst, G. M. Bancroft, A. G. Schaufuss and R. Szargan, Synchrotron XPS evidence for Fe2 + -S and Fe3 + -S surface species on pyrite fracture-surfaces, and their 3D electronic states, Am. Mineral., 2000, 85, 850–857, DOI:10.2138/am-2000-5-628.
- M. Oku, K. Kichinosuke and S. Ikeda, X-ray Photoelectron Spectroscopy of Manganese-Oxygen System, J. Electron. Spectros. Relat. Phenomena, 1975, 7, 465–473, DOI:10.1016/0368-2048(75)85010-9.
- V. Di Castro and G. Polzonetti, XPS study of MnO oxidation, J. Electron. Spectrosc. Relat. Phenom., 1989, 48, 117–123, DOI:10.1016/0368-2048(89)80009-X.
- G. Elmacı, A. S. Ertürk, M. Sevim and Ö. Metin, MnO2 nanowires anchored on mesoporous graphitic carbon nitride (MnO2@mpg-C3N4) as a highly efficient electrocatalyst for the oxygen evolution reaction, Int. J. Hydrogen Energy, 2019, 44, 17995–18006, DOI:10.1016/j.ijhydene.2019.05.089.
- Ý. A. Mørch, I. Sandvig, Ø. Olsen, I. Donati, M. Thuen, G. Skjåk-Bræk, O. Haraldseth and C. Brekken, Contrast Media Mol. Imaging, 2012, 7(2), 265–275, DOI:10.1002/cmmi.493.
- C. Shen, G. Hu, L.-Z. Cheong, S. Huang, J.-G. Zhang and D. Wang, Direct Observation of the Growth of Lithium Dendrites on Graphite Anodes by Operando EC-AFM, Small Methods, 2018, 2, 1700298, DOI:10.1002/smtd.201700298.
- G. Lacarbonara, M. Rahmanipour, J. Belcari, L. Lodi, A. Zucchelli and C. Arbizzani, Electrodilatometric analysis under applied force: A powerful tool for electrode investigation, Electrochim. Acta, 2021, 375, 137938, DOI:10.1016/j.electacta.2021.137938.
- X. Fang, X. Lu, X. Guo, Y. Mao, Y.-S. Hu and J. Wang, et al., Electrode reactions of manganese oxides for secondary lithium batteries, Electrochem. Commun., 2010, 12, 1520–1523, DOI:10.1016/j.elecom.2010.08.023.
- I. Kovalenko, B. Zdyrko, A. Magasinski, B. Hertzberg, Z. Milicev and R. Burtovyy, A major constituent of brown algae for use in high-capacity Li-ion batteries, Science, 2011, 334, 6052, DOI:10.1126/science.1209150.
- W.-Y. Chou, Y.-C. Jin, J.-G. Duh, C.-Z. Lu and S.-C. Liao, A facile approach to derive binder protective film on high voltage spinel cathode materials against high temperature degradation, Appl. Surf. Sci., 2015, 355, 1272–1278, DOI:10.1016/j.apsusc.2015.08.046.
- F. Bigoni, F. De Giorgio, F. Soavi and C. Arbizzani, Sodium Alginate: A Water-Processable Binder in High-Voltage Cathode Formulations, J. Electrochem. Soc., 2017, 164, A6171–A6177, DOI:10.1149/2.0281701jes.
- D. A. Shirley, High-resolution X-ray photoemission spectrum of the valence bands of gold, Phys. Rev. B, 1972, 5, 4709–4714, DOI:10.1103/PhysRevB.5.4709.
- G. Daniel, Y. Zhang, S. Lanzalaco, F. Brombin, T. Kosmala and G. Granozzi, et al., Chitosan-Derived Nitrogen-Doped Carbon Electrocatalyst for a Sustainable Upgrade of Oxygen Reduction to Hydrogen Peroxide in UV-Assisted Electro-Fenton Water Treatment, ACS Sustainable Chem. Eng., 2020, 8, 14425–14440, DOI:10.1021/acssuschemeng.0c04294.
Footnote |
| † Electronic supplementary information (ESI) available. See DOI: https://doi.org/10.1039/d2ma00583b |
| This journal is © The Royal Society of Chemistry 2022 |

