Negatively charged ions to probe self-assembled monolayer reorganization driven by interchain interactions
Angelo
Tricase
a,
Angela
Stefanachi
b,
Rosaria Anna
Picca
 a,
Eleonora
Macchia
c,
Alessandro
Favia
de,
Francesco
Leonetti
b,
Gaetano
Scamarcio
ef,
Davide
Blasi
*ad,
Paolo
Bollella
 *a and
Luisa
Torsi
 acd
acd
aDipartimento di Chimica, Università degli Studi di Bari Aldo Moro, 70125 Bari, Italy. E-mail: davide.blasi@uniba.it; paolo.bollella@uniba.it
bDipartimento di Farmacia – Scienze del Farmaco, Università degli Studi di Bari Aldo Moro, 70125 Bari, Italy
cThe Faculty of Science and Engineering, Åbo Akademi University, 20500 Turku, Finland
dCSGI (Centre for Colloid and Surface Science), 70125 Bari, Italy
eDipartimento Interateneo di Fisica “M. Merlin”, Università degli Studi di Bari Aldo Moro, 70125 Bari, Italy
fCNR, Istituto di Fotonica e Nanotecnologie, Sede di Bari, 70125 Bari, Italy
First published on 20th July 2021
Abstract
A combined cyclic voltammetry (CV) and grazing angle attenuated total reflectance (GA-ATR) IR study on the interchain interaction driven reorganization of self-assembled monolayers (SAMs) in an electric field was presented. The study focused on an N-(2-hydroxyethyl)-3-mercaptopropanamide (NMPA) SAM endowed with interchain hydrogen bonding, strongly affected by an external electric field interacting with the dipole moment associated with the hydrogen bonding. Conversely, a 1-hexanethiol SAM was characterized by interchain hydrophobic interaction not affected by the applied field. These features were demonstrated by means of reiterated CV experiments involving an electroactive negatively charged probe, namely Fe(CN)64−, and a Au-SAM serving as a working electrode. The diffusional/interpenetration and kinetics parameters provided the apparent electron transfer rate constant (k0) values. For the NMPA, the interchain rearrangement kinetics was that of an ion-permeable layer that reached, in the electric field, a steady-state configuration after about 50 minutes. The 1-hexanethiol chains’ reorganization exhibited more complex kinetics involving a first phase (ca. 50 minutes) of an ion-permeable phase followed by a sharp decrease in the anodic peak current related to the tightening of the structure, likely due to the interchain hydrophobic interaction, hindering ion diffusion. The change in the SAM structure upon cycling in the electric field was confirmed by the GA-ATR measurements.
Introduction
Self-assembled structures can be potentially used for many applications in the development of devices like biosensors based on different transduction techniques such as electrochemistry, quartz-crystal microbalance (QCM), and surface plasmon resonance (SPR) and field-effect transistors (FETs).1–4Recently, bioelectronic label-free sensors based on an electrolyte-gated organic field-effect transistor (EGOFET) have been proposed as highly sensitive devices that involve an ionic conducting electrolyte as a dielectric which connects the transducing gate electrode with an organic semiconductor-based channel.5 Gate electrodes are usually modified with organic self-assembled structures to efficiently immobilize biorecognition elements (e.g., antibodies, aptamers).6,7 By this means, trillions of biorecognition elements can be immobilized onto a millimetre-sized gate, enabling single-molecule detection.8
Among the organic self-assembled structures, self-assembled monolayers (SAMs) of alkanethiols have been used to modify gold surfaces to achieve the formation of a dense and ordered biolayer through the immobilization of antibodies, enzymes, DNA/RNA, aptamers, whole cells, etc.9–11 In particular, SAMs of alkanethiols on gold surfaces are able to produce a stable and structurally well-defined monolayer with a controllable thickness and desirable functions on the surface (e.g., different exposed functional groups like –COOH, –OH, –NH2, –OCH3, and CH3). These features were reported in several studies.12–14 For instance, Hubbard et al. investigated the electrochemical behaviour and the structure of several quinone derivatives (e.g., quinone moieties conjugated with alkanethiols) deposited on platinum electrodes by using several surface analysis techniques like low energy electron diffraction (LEED) and Auger electron spectroscopy.15 Moreover, the reversibility of the redox reaction analysis was used to make kinetics considerations on the reorganization of the SAM.
Indeed, SAM investigations have been performed using cyclic voltammetry and electrochemical impedance spectroscopy (EIS) to analyse the electron transfer, the ionization of the surface head group, and the ionic permeation of the layer at the interface.16,17 Electrochemical probes (e.g., [Fe(CN)6]3−/4−, [Ru(NH3)6]3+/2+) are usually employed to study the defect sites and interchain reorganization in SAM surfaces induced by electrochemical desorption as well as its effect on the electron transfer process. Moreover, optical techniques also provide useful structural information. Particularly, in situ Fourier-transform IR reflection absorption spectroscopy (FT-IRRAS) measurements have been applied to study the structure and the orientation of SAMs.18 Alternatively, attenuated total reflection (ATR) also provides insights into the chemical composition of the self-assembled structure and possible interchain interactions driving the reorganization process over time.19
This work aims at investigating the interpenetration of negatively charged electroactive ions to probe the interchain reorganization of a SAM endowed with hydrogen bonding, namely an N-(2-hydroxyethyl)-3-mercaptopropanamide (NMPA) SAM in the presence of an external electric field. For the sake of comparison, a 1-hexanethiol SAM, bearing no hydrogen bonding, is studied as well. To this end, cyclic voltammetric measurements of an electroactive negatively charged probe – Fe(CN)64− – at a gold working electrode modified with the elicited SAMs, are performed. The SAMs’ coverages are heterogeneous and multiple defects or pinhole sites are present. The kinetics and the diffusional/interpenetration data of the probing species over time provide key information on the interchain reorganization in the electric field. These results can be of interest in the design of high performance bioelectronic devices, particularly EGOFETs, where the effect of the diffusion of ions on the building of charge double layers, as well as their permeation into SAM modified gate electrodes, plays a key role in the understanding of their working principle.20–22
Materials and methods
Materials
1-Hexanethiol was purchased from Sigma-Aldrich and used without further purification. N-(2-Hydroxyethyl)-3-mercaptopropanamide (NMPA) was prepared starting from 3-mercaptopropionic acid (3MPA) using a wet chemical approach described elsewhere.23 A phosphate buffered saline (PBS, Sigma-Aldrich) (phosphate buffer 10 mM, KCl 2.7 mM, NaCl 137 mM) tablet was dissolved in 200 mL of HPLC water and used upon filtration on a Corning 0.22 μm polyethersulfone membrane. Potassium ferrocyanide (K4[Fe(CN)6]) was purchased from Sigma Aldrich and dissolved in a PBS solution to obtain a 10 mM solution. This solution was diluted in PBS to a ratio of 1![[thin space (1/6-em)]](https://www.rsc.org/images/entities/char_2009.gif) :
:![[thin space (1/6-em)]](https://www.rsc.org/images/entities/char_2009.gif) 10 before the cyclic voltammetry measurement. All solutions were prepared using Milli-Q water (18.2 MΩ cm, Millipore, Bedford, MA, USA).
10 before the cyclic voltammetry measurement. All solutions were prepared using Milli-Q water (18.2 MΩ cm, Millipore, Bedford, MA, USA).
Sample preparation
Gold samples were prepared starting from a Si wafer covered with a thermally grown 300 nm thick SiO2 layer. The substrates were cleaned in an ultrasonic bath in acetone for 10 minutes, then in isopropanol (10 min) and subsequently dried under N2 flux. Afterwards, e-beam evaporation of a 5 nm-thick Ti adhesion layer followed by a 50 nm-thick gold film was performed through a shadow mask. The gold sample, shown in Fig. 1, comprises a 20 mm2 circular pad, which is the sample active area, connected to a 25 mm2 square contact pad through a 500 mm-thick track. Prior to the self-assembled monolayer (SAM) growth on the gold active area, the samples were sonicated for 10 min in heptane, then rinsed with acetone and dried under N2 flux. Afterwards, the samples were immersed in a piranha solution (H2O2![[thin space (1/6-em)]](https://www.rsc.org/images/entities/char_2009.gif) :
:![[thin space (1/6-em)]](https://www.rsc.org/images/entities/char_2009.gif) H2SO4 3
H2SO4 3![[thin space (1/6-em)]](https://www.rsc.org/images/entities/char_2009.gif) :
:![[thin space (1/6-em)]](https://www.rsc.org/images/entities/char_2009.gif) 7 v/v) for 5 min, then in boiling water for 10 min, rinsed with ethanol and dried under N2 flux. Finally, the samples were treated with ozone plasma for 10 min and immediately immersed in 10 mM thiol SAM solution for 20 h in a N2 atmosphere and in the dark. Two different SAMs were used in this work, characterized by different interactions between chains: the NMPA presents an amide in the γ position with respect to the sulphur atom, so SAMs grown using this precursor present diffuse interchain hydrogen bonding,24,25 resulting in the most intense interaction between all the samples. 1-Hexanethiol is a six-carbon alkyl chain and SAMs grown using this precursor are characterized by the weakest chain interaction. Before electrochemical characterization, the samples were rinsed with ethanol to remove possible unbound residues and dried under N2 flux. Before optical characterization, samples were rinsed with HPLC water and dried under N2 flux.
7 v/v) for 5 min, then in boiling water for 10 min, rinsed with ethanol and dried under N2 flux. Finally, the samples were treated with ozone plasma for 10 min and immediately immersed in 10 mM thiol SAM solution for 20 h in a N2 atmosphere and in the dark. Two different SAMs were used in this work, characterized by different interactions between chains: the NMPA presents an amide in the γ position with respect to the sulphur atom, so SAMs grown using this precursor present diffuse interchain hydrogen bonding,24,25 resulting in the most intense interaction between all the samples. 1-Hexanethiol is a six-carbon alkyl chain and SAMs grown using this precursor are characterized by the weakest chain interaction. Before electrochemical characterization, the samples were rinsed with ethanol to remove possible unbound residues and dried under N2 flux. Before optical characterization, samples were rinsed with HPLC water and dried under N2 flux.
Modelling analysis
The equations were discretized by the finite difference method (FDM) and numerically solved using an explicit Euler scheme. The proposed model for cyclic voltammetry outputs was implemented in MATLAB® language. The positive currents in the voltammogram correspond to the oxidation process (anodic current), whereas the negative currents represent the reduction process (cathodic current), according to IUPAC recommendations.Cyclic voltammetry
Cyclic voltammetry (CV) measurements were performed with a CH-1140b potentiostat–galvanostat (CH Instruments, Bee Cave, TX, USA). A conventional three electrode electrochemical cell setup was used for all the experiments, encompassing platinum wire as a counter electrode (CE), a Ag/AgCl (saturated KCl) electrode as a reference electrode (RE) (notably all potential values in the manuscript are reported vs. this reference electrode) and a gold electrode, eventually modified with the two different SAMs (vide supra), as a working electrode (WE). A schematic viewgraph of the electrochemical cell is shown in Fig. 1b. All the measurements were carried out in a 1 mM K4[Fe(CN)6] solution in PBS. The measurements were performed using a potential window ranging from −0.3 to 0.6 V at 100 mV s−1 scan rate. The CVs reported in the paper were extracted from the last scan (4th scan). The starting potential was set at the Open Circuit Potential value, measured at the beginning of the experiment. The sample was left in the cell for a total of 210 min and CV measurements were carried out after 0, 20, 30, 60, 90, 120, and 210 min from the beginning of the experiment. The data were treated using OriginPro 2018.Grazing angle attenuated total reflectance (GA-ATR)
GA-ATR infrared analyses were carried out by using a PerkinElmer Spectrum Two FT-IR spectrometer equipped with an ATR module including a diamond crystal at a fixed 45° incidence angle, as shown in Fig. 1c. Each spectrum was averaged over 64 scans in the range 400–4000 cm−1, at a spectral resolution of 2 cm−1. The presence of a gold layer under the SAM allowed to create a configuration equivalent to the so-called Grazing Angle Attenuated Total Reflectance (GA-ATR).26–28 In principle, considering the penetration depth of the evanescent wave (some μm), a SAM layer should be too thin (1 nm) to be detected by conventional ATR. However, the presence of the metal/SAM interface in the proximity of the ATR crystal results in an increase of the electric field in the SAM layer, enhancing the signals associated with the vibrational transitions.28,29 Each sample was analysed in the circular area for a total of 2 points for each sample.Results and discussion
Evaluation of NMPA surface coverage
To assess the surface coverage of the NMPA SAM on the Au electrode surface, reiterated cyclic voltammograms (CVs) in 0.5 M H2SO4 were obtained in the −0.2 V and +1.7 V range. The data are given in Fig. 2. The working electrode was either bare gold (Fig. 2, black line) or the NMPA SAM modified gold electrode (Fig. 2, red line). The gold electrode shows the well-known broad oxidation wave between +1.1 V and +1.4 V due to the formation of gold oxide. In the reverse scan the sharp cathodic peak (peak current of −95 μA) in the range of +1 V to +0.8 V is the corresponding reduction process. In addition, there is a peak at 0.0 V that can be ascribed either to the presence of active metal atoms at the electrode surface or to the electrocatalytic reduction of oxygen at gold.30 As it is apparent from the figure, a suppression of the gold reduction/oxidation occurs in the presence of the NMPA SAM. A significant decrease in the current associated with the charging of the double layer capacitance is also seen. Indeed, similarly to an alkanethiol, NMPA can act as an impermeable material, hindering water/ion diffusion to the gold surface, hence impairing its electrochemical oxidation. The effective Au electrode surface area was estimated from the gold oxide reduction peak, resulting in a charge underlying the peak of 47.8 μC. This value can be normalized by the theoretical charge density considered for gold oxide reduction (390 μC cm−2), as reported in the literature,31 affording an effective active surface area of 12 mm2. This means that only 60% of the geometrical area (notably 20 mm2) is electrochemically active.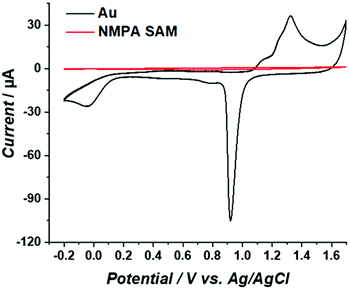 | ||
| Fig. 2 CVs measured for the bare Au (black curve) and the NMPA SAM (red curve) in 0.5 M H2SO4 at a scan rate of 50 mV s−1 and at T = 25 °C. | ||
Considering that this peak totally disappears after the formation of an NMPA SAM, we can assume that this part of the electrode surface is totally covered with the NMPA SAM. Similar results were previously reported in the literature considering other types of SAMs.32–34
Modelling the electroactive ion permeation at the SAM modified electrode surface
To fully comprehend how the negative ions of a redox couple can probe the SAM film, it is relevant to understand the effect of ion penetration into a SAM structure and its possible rearrangements from both theoretical and experimental points of view. In this respect, it is important to consider the equations behind the permeation/diffusion of ions during the electrochemical processes occurring at the modified electrode surface.35 Considering K4[Fe(CN)6] as a model compound A1, it is possible to write the following equations: | (1) |
 | (2) |
 | (3) |
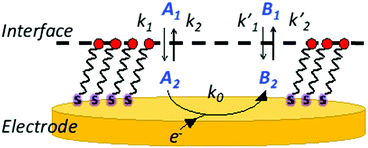 | ||
| Fig. 3 Schematic representation of the partitioning of reactant A and product B at the interface solution/modified electrode. | ||
Both partition equilibria, notably for reactant A and product B in both phases (i = 1, 2), can be analytically described with Fick's law on the diffusion:
 | (4) |
 | (5) |
 | (6) |
 are the equilibrium constants pertaining to the heterogeneous reaction (eqn (1) and (3)).36 On the other hand, the electrochemical reaction occurring at the electrode surface (x = 0) can be analytically described by the Butler–Volmer equation as follows:
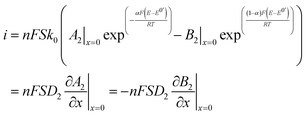 | (7) |
![[thin space (1/6-em)]](https://www.rsc.org/images/entities/char_2009.gif) 485 C mol−1) and S (electroactive surface area) have their usual meanings.37 The last equation describes the variation of the net current passing through a working electrode that depends on the voltage difference between the voltage required for a redox reaction to occur at the electrode surface (oxidation or reduction) and the formal potential (E0′, equilibrium potential or bulk electrolyte potential), defined as the overpotential. The Butler–Volmer equation, as reported above, allows making calculation on the electro-kinetics parameters still considering mass-transfer limitations related not only to the electrode modification but also to the electrochemical process itself. This system of equations provides an overview on the dynamics of permeation/diffusion and electrochemical reaction occurring at a SAM modified electrode.
485 C mol−1) and S (electroactive surface area) have their usual meanings.37 The last equation describes the variation of the net current passing through a working electrode that depends on the voltage difference between the voltage required for a redox reaction to occur at the electrode surface (oxidation or reduction) and the formal potential (E0′, equilibrium potential or bulk electrolyte potential), defined as the overpotential. The Butler–Volmer equation, as reported above, allows making calculation on the electro-kinetics parameters still considering mass-transfer limitations related not only to the electrode modification but also to the electrochemical process itself. This system of equations provides an overview on the dynamics of permeation/diffusion and electrochemical reaction occurring at a SAM modified electrode.
Hence considering the faradaic current measured on the NMPA SAM given in Fig. 2 (red curve), eqn (5)–(7), a given diffusing probe A exchanging one electron (n = 1) and an effective area S = 12 mm2, the heterogeneous electron transfer rate constant (kET) is (0.45 ± 0.05) × 10−3 cm s−1. This is compatible with the kET obtained in the presence of a blocking interface (hindering ion penetration and interchain rearrangements) based on SAM modified electrodes.38
Probing a Au-SAM electrode with a redox active negative ion
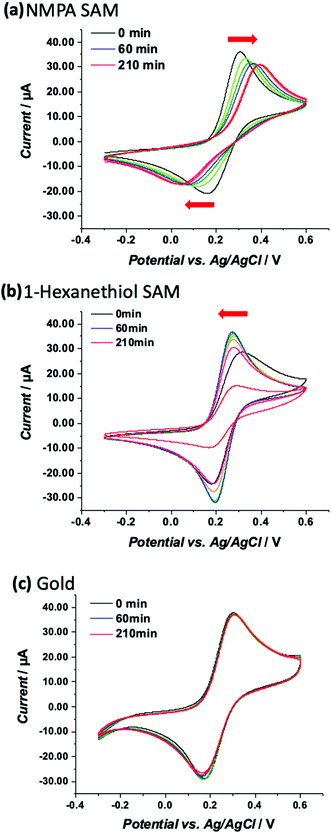
To probe the ion permeation/diffusion in a SAM, a cyclic voltammetry experiment is designed involving a Au working electrode modified with SAMs encompassing different functional groups, namely the already introduced NMPA and the 1-hexanethiol SAM. The main difference is the interchain hydrogen bonding that is present only in the NMPA SAM. The probe is the [Fe(CN)6]4− negatively charged redox probe, discharging (exchanging electrons) at the Au-SAM working electrode. Reiterated cyclic voltammetry curves are measured to assess how the current and voltage peak positions shift over time or equivalently under the application of an external electrical field. As already demonstrated, the electric field between the working and counter electrodes induces a reorganization of the SAM's chains that can be tighten up and create a barrier hindering to a certain extent the diffusion of ions at the electrode surface.39 This is even more true in the presence of amide functional groups that form a hydrogen bond with its associated dipole moment oriented from the oxygen of the amide group in one chain and pointed towards the hydrogen of the amide group of a neighbouring one. Because of the regular assembly of the NMPA-SAM, a H-bonding network likely forms that, thanks to the elicited dipole, better orients in an electric field.The electron transfer (ET) at a SAM modified electrode can occur, following one of three pathways: (1) by a tunnelling process; (2) by permeation of the redox species into the film and ET; and (3) by diffusion of the redox probe inside pinholes or defect sites and ET only at the exposed electrode surface.40,41 Case (1) requires the SAM to be totally homogeneous and defect free, case (2) requires the film to be ion-permeable, while case (3) occurs when the SAM has pinholes or defect sites. To assess the SAM homogeneity and degree of defects, the CV kinetics is studied by acquiring CV curves at different times (0, 20, 30, 60, 90, 120, and 210 minutes) on the NMPA and 1-hexanethiol SAMs as well as on bare gold. Longer times mean longer exposure to an external electric field. The measured CV curves are displayed in Fig. 4a, b and c, respectively. The CVs over time for the NMPA modified gold electrode (notably from 0 to 210 minutes; recorded at 0, 20, 30, 60, 90, 120 and 210 minutes, Fig. 4a) exhibit a clear peak potential shift and a slight current decrease. The cathodic peak is progressively moving towards negative values, while the anodic peak is gradually moving in the opposite direction.
The NMPA SAM, encompassing alkyl chains with –NH groups at half height and –OH groups exposed towards the solution interface, is densely packed and well-organized, acting as an effective electron and ion barrier. In the presence of this monolayer, [Fe(CN)6]4− cannot directly approach the electrode surface, thus decreasing its apparent heterogeneous electron transfer rate. This effect is related to the elicited inter-chain hydrogen bonding between the amide groups positioned at the half height of the chain,24,25,42–45 while terminal –OH groups are mainly involved in randomly-oriented interactions with water molecules. The 1-hexanethiol SAM forms a hydrophobic layer that, however, does not tighten in the external electric field. This SAM was taken into account because of its length that is comparable with NMPA but with no amide functionalities. Here the CVs, reported in Fig. 4b, showed a perfectly reversible or quasi-reversible behaviour over time as the potential difference between the anodic and cathodic peaks did not vary. This might be in contradiction to other reports where the 1-hexanethiol SAM exhibited an irreversible behaviour.46 However, the heterogeneous formation of a 1-hexanethiol SAM as well as the random reorganization mainly affected by the hydrophobic forces might have created some pinholes or defect sites that allowed ferrocyanide ions to diffuse directly at the electrode surface. Besides the kinetic considerations on the ET, it is possible to observe that the faradaic current peaks for both processes (anodic/oxidation and cathodic/reduction) decrease quite significantly over time meaning that the permeation of [Fe(CN)6]4− is hindered by the hydrophobic layer, which is in agreement with other reports. Hence, the kinetics of the ET process occurring at the pinholes predominantly affects the electrode behaviour, while from the ion permeation/diffusion perspective the hydrophobic layer has a predominant effect.
This was further confirmed by the CVs over time for the bare gold electrode. Fig. 4c shows no peak shift in terms of both potential and current values. This effect is certainly ascribed to the absence of electrostatic interactions (no functional groups are present) with the redox probe.
These results can be further analyzed by plotting the faradaic current of the anodic process over time (the cathodic process showed exactly the same trend but with current values in the negative range), as displayed in Fig. 5. The bare gold electrode (black squares) showed no variations over time because there was only the electrochemical process taking place at the electrode with no diffusing barriers. The NMPA SAM modified electrode reached a steady-state level after 50 minutes, corresponding to an effective reorganization (mainly due to the presence of amide groups that drove the reorganization in the electric field) and the exposed uncharged –OH groups that did not hinder the interpenetration of negatively charged ions. Moreover, we compared the results with those of the 1-hexanethiol modified electrode where the pinholes/SAM defects predominantly affected the faradaic current at the beginning of the experiment. Approximately 30–60 minutes later, the SAM chain rearrangement driven by the alkyl-chains’ lipophilic interactions tightened the film structure and the faradaic current remarkably decreased due to the diffusion barrier generated by the interchain rearrangement. To validate our hypothesis, we fitted the experimental data (current vs. time) using a combination between eqn (7) (derived from the Butler–Volmer equation) and eqn (8) (notably, the Nicholson and Shain equation). The equation was further rearranged considering that the electron transfer can slow down due to the diffusional barrier formed by the SAM chains undergoing the reorganization process. All data sets, notably those of the NMPA modified electrode (Fig. 5, red curve), 1-hexanethiol modified electrode (Fig. 5, blue curve) and bare gold electrode (black curve), were fitted, returning a regression factor R2 = 0.99.
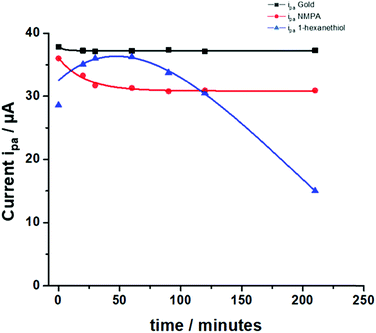 | ||
| Fig. 5 Anodic peak currents measured for the NMPA SAM (red line), 1-hexanethiol SAM (blue line) and bare Au (black line) in 1 mM K4[Fe(CN)6]. Experimental conditions: 10 mM PBS buffer pH 7 containing KCl 2.7 mM and NaCl 137 mM; scan rate 100 mV s−1 and T = 25 °C. The fitting of the experimental points was performed combining eqn (7) and (8), where the electron transfer rate constant (k0) was computed considering the electron transfer reaction occurring at the modified electrodes. | ||
The diffusional data were further supported by the calculation of the heterogeneous electron transfer rate constant (k0) performed at time 0 and after 210 minutes. k0 was calculated using the extended method which merges the Klingler–Kochi and Nicholson–Shain methods for totally irreversible and reversible systems, respectively.47,48 For a one-step quasi-reversible electrochemical reaction in which the kinetic parameter Ψ = k0[πDnvF/(RT)]−1/2 is varied up to 0.1 and ΔEp × n does not exceed 200 mV, the Nicholson and Shain method should be valid considering the working curve Ψ − ΔEp × n followed by a Ψ–v−1/2 plot.49 On the other hand, the Klingler and Kochi method allows the calculation of the ET rate constant k0 for the irreversible system by following the equation reported below:
 | (8) |
 | (9) |
Grazing-angle ATR investigation of NMPA SAM reorganization on a gold electrode
GA-ATR is a very useful tool for studying SAMs grafted onto very high refractive index metal, thanks to the enhancement of the signal described in the Methods section. Moreover, the metal-surface selection rule in IR techniques, where only the component perpendicular to the surface is active,24,50 can be useful in gathering structural information on amide-based SAMs. In fact, the dipole moment of amide groups main IR signals, namely the C![[double bond, length as m-dash]](https://www.rsc.org/images/entities/char_e001.gif) O stretching (amide I) and the N–H bending (amide II), are oriented perpendicularly to each other. Hence, the ratio between these signals can be used to evaluate the chain orientation with respect to the metal surface.24 To investigate the effect of the reiterated CVs in the Fe(CN)6]4−, with its associated bias applied perpendicularly to the metal surface, an NMPA SAM on Au was analysed by GA-ATR IR spectroscopy before (Fig. 6a) and after a CV experiment (Fig. 6b).
O stretching (amide I) and the N–H bending (amide II), are oriented perpendicularly to each other. Hence, the ratio between these signals can be used to evaluate the chain orientation with respect to the metal surface.24 To investigate the effect of the reiterated CVs in the Fe(CN)6]4−, with its associated bias applied perpendicularly to the metal surface, an NMPA SAM on Au was analysed by GA-ATR IR spectroscopy before (Fig. 6a) and after a CV experiment (Fig. 6b).
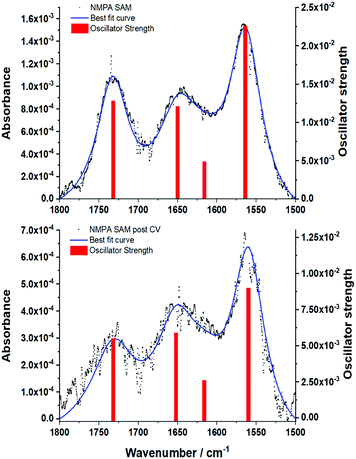 | ||
| Fig. 6 GA-ATR spectra of the (a) NMPA SAM and (b) NMPA SAM after the cyclic voltammetry in Fig. 4a. Both the spectra report the experimental data (black dots), the best fit curve obtained using the model reported in Tricase et al.51 and the oscillator strength related to each peak (red bars). The oscillator strength is related to the intensity of the GA-ATR signal, while its position corresponds to that of the maximum GA-ATR signal. Details about the extraction of the oscillator strength and position were reported in Tricase et al.51 | ||
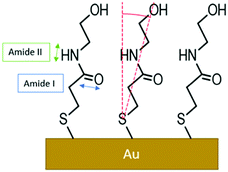
Both spectra present two main peaks associated with the amide I (1650 ± 1 cm−1) and amide II (1570 ± 1 cm−1) signals. A peak centred at 1731 ± 1 cm−1 is attributed to traces of fatty acids on the substrate, residues of the cleaning procedure, which were found in a previous work.51 Moreover, the presence of a fourth peak around 1630–1600 cm−1 was hypothesized, resulting in a shoulder in the amide I peak. The experimental curves were accurately reproduced using a model based on light–matter interaction with a multi-layer structure, including 4 harmonic oscillators. The presence of a harmonic oscillator at 1615 cm−1 confirmed the presence of the fourth peak hypothesized above. To evaluate the changes after the cycling in K4[Fe(CN)6], we used the ratio between the oscillator strengths associated with the amide I and amide II bands, as extracted by the fitting procedure. The amide I/amide II ratio in the spectrum in Fig. 6a is equal to 0.53, whereas in the spectrum in Fig. 6b the value increases to 0.66 (19%), evidencing a clear reorientation of the NMPA chains when an external electric field is applied. In particular, the N–H dipole moment z-component (perpendicular to the gold surface) becomes lower, while the C![[double bond, length as m-dash]](https://www.rsc.org/images/entities/char_e001.gif) O z-component increases (Fig. 7).
O z-component increases (Fig. 7).
Hence, the GA-ATR data clearly prove that the amide groups present in the half-chains play a key role in the interchain NMPA SAM reorganization; specifically, after the application of an external field the chains are bent, forming a larger angle with the normal to the surface. Actually, Kim et al. reported two different phases, characterized by different tilt angles, for an amide-containing alkanethiol SAM deposited on gold{111} from an ethanolic solution. In particular, while at room temperature the two phases coexist; upon increasing the temperature during the SAM formation, or performing thermal annealing, the system assumes a more tilted configuration,45 which is thermodynamically favoured due to the formation of linear hydrogen-bonding networks.52 Hence, the application of an external electrical field can act as the temperature in forcing the SAM into its more stable configuration.
Conclusions
In conclusion, the characterization of two SAMs, namely NMPA and 1-hexanethiol SAMs, was performed by using a combined method based on cyclic voltammetry (CV) and grazing angle attenuated total reflectance (GA-ATR). The NMPA SAM showed a heterogeneous surface coverage of the electroactive surface area considering the presence of SAM defects and pinholes. Upon electric field application over time, NMPA SAM chains exhibited peculiar rearrangement on the electrode surface responsible for the remarkable decrease of the electron transfer rate constant (k0) by two orders of magnitude from (0.3 ± 0.05) × 10−3 cm s−1 to (0.4 ± 0.05) × 10−5 cm s−1. Moreover, this is in agreement with ion diffusion/permeation that achieves a steady-state condition in approximately 30 minutes, when the applied electric field mainly contributes to NMPA interchain rearrangements. This was further elucidated with GA-ATR IR data that unequivocally prove that NMPA SAM chains bend, forming a larger angle with the normal to the surface, upon electric field application. Conversely, the 1-hexanethiol SAM rearrangement was not affected by the applied electric field, showing a remarkable decrease of the anodic peak current (ipa) due to the random reorientation of aliphatic chains that hinder ion diffusion/permeation.This combined investigation method can open different avenues to understand the rearrangement of SAM chains upon the application of an electric field, which is important in the design of high performance bioelectronic devices.
Author contributions
A. T. performed the experimental work and analysed the data. A. S. and F. L. synthesized NMPA. R. A. P. supervised A. T. during the electrochemical experiments. E. M. supervised A. T. during the substrate preparation (gold deposition and SAM preparation). A. F. and G. S. performed the optical measurements, analysed the data and contributed to the present draft. D. B. conceived part of the experimental work, analysed the data and contributed to the present draft. P. B. and L. T. actively wrote the manuscript draft. All the authors have read and approved the final version.Conflicts of interest
The authors declare no conflict of interest.Acknowledgements
PON SISTEMA (MIUR), H2020 – Electronic Smart Systems – SiMBiT: Single molecule bio-electronic smart system array for clinical testing (grant agreement ID: 824946), “PMGB – Sviluppo di piattaforme meccatroniche, genomiche e bioinformatiche per l’oncologia di precisione” – ARS01_01195 – PON “RICERCA E INNOVAZIONE” 2014–2020 projects, Academy of Finland projects #316881, #316883 “Spatiotemporal Control of Cell Functions”, #332106 “ProSiT – Protein Detection at the Single-Molecule Limit with a Self-powered Organic Transistor for HIV early diagnosis”, Biosensori analitici usa-e getta a base di transistori organici auto-alimentati per la rivelazione di biomarcatori proteomici alla singola molecola per la diagnostica decentrata dell’HIV (6CDD3786) Research for Innovation REFIN – Regione Puglia POR PUGLIA FESR-FSE 2014/2020, the European Union, Italian Government, Åbo Akademi University CoE “Bioelectronic activation of cell functions” and CSGI are acknowledged for partial financial support.Notes and references
- A. L. Eckermann, D. J. Feld, J. A. Shaw and T. J. Meade, Coord. Chem. Rev., 2010, 254, 1769–1802 CrossRef CAS.
- M. Tominaga, A. Ohira, Y. Yamaguchi and M. Kunitake, J. Electroanal. Chem., 2004, 566, 323–329 CrossRef CAS.
- K. V. Gobi, K. Matsumoto, K. Toko, H. Ikezaki and N. Miura, Anal. Bioanal. Chem., 2007, 387, 2727–2735 CrossRef CAS.
- S. Casalini, C. A. Bortolotti, F. Leonardi and F. Biscarini, Chem. Soc. Rev., 2017, 46, 40–71 RSC.
- D. Blasi, F. Viola, F. Modena, A. Luukkonen, E. MacChia, R. A. Picca, Z. Gounani, A. Tewari, R. Österbacka, M. Caironi, Z. M. Kovacs Vajna, G. Scamarcio, F. Torricelli and L. Torsi, J. Mater. Chem. C, 2020, 8, 15312–15321 RSC.
- F. Leonardi, A. Tamayo, S. Casalini and M. Mas-Torrent, RSC Adv., 2018, 8, 27509–27515 RSC.
- E. Macchia, K. Manoli, B. Holtzer, C. Di Franco, F. Torricelli, R. A. Picca and L. Torsi, in 2019 IEEE 8th International Workshop on Advances in Sensors and Interfaces (IWASI), 2019, pp. 221–223.
- E. Macchia, K. Manoli, B. Holzer, C. Di Franco, M. Ghittorelli, F. Torricelli, D. Alberga, G. F. Mangiatordi, G. Palazzo, G. Scamarcio and L. Torsi, Nat. Commun., 2018, 9, 3223 CrossRef.
- E. Macchia, A. Tiwari, K. Manoli, B. Holzer, N. Ditaranto, R. A. Picca, N. Cioffi, C. Di Franco, G. Scamarcio, G. Palazzo and L. Torsi, Chem. Mater., 2019, 31, 6476–6483 CrossRef CAS.
- P. Bollella, F. Mazzei, G. Favero, G. Fusco, R. Ludwig, L. Gorton and R. Antiochia, Biosens. Bioelectron., 2017, 88, 196–203 CrossRef CAS PubMed.
- E. Macchia, K. Manoli, C. Di Franco, R. A. Picca, R. Österbacka, G. Palazzo, F. Torricelli, G. Scamarcio and L. Torsi, ACS Sens., 2020, 5, 1822–1830 CrossRef CAS.
- C. D. Bain and G. M. Whitesides, Adv. Mater., 1989, 1, 110–116 CrossRef.
- T. Hamann, L. Kankate, E. Böhler, J. H. Bredehöft, F. M. Zhang, A. Gölzhäuser and P. Swiderek, Langmuir, 2012, 28, 367–376 CrossRef CAS PubMed.
- Y. Arima and H. Iwata, J. Mater. Chem., 2007, 17, 4079–4087 RSC.
- J. Y. Gui, D. A. Stern, D. G. Frank, F. Lu, D. C. Zapien and A. T. Hubbard, Langmuir, 1991, 7, 955–963 CrossRef CAS.
- R. Schweiss, C. Werner and W. Knoll, J. Electroanal. Chem., 2003, 540, 145–151 CrossRef CAS.
- K. Kim and J. Kwak, J. Electroanal. Chem., 2001, 512, 83–91 CrossRef CAS.
- S. Ye, A. Yashiro, Y. Sato and K. Uosaki, J. Chem. Soc., Faraday Trans., 1996, 92, 3813–3821 RSC.
- M. Bieri and T. Bürgi, J. Phys. Chem. B, 2005, 109, 10243–10250 CrossRef CAS PubMed.
- E. Macchia, K. Manoli, C. Di Franco, G. Scamarcio and L. Torsi, Anal. Bioanal. Chem., 2020, 412, 5005–5014 CrossRef CAS.
- R. A. Picca, K. Manoli, E. Macchia, L. Sarcina, C. Di Franco, N. Cioffi, D. Blasi, R. Österbacka, F. Torricelli, G. Scamarcio and L. Torsi, Adv. Funct. Mater., 2020, 30, 1904513 CrossRef CAS.
- E. Macchia, K. Manoli, B. Holzer, C. Di Franco, R. A. Picca, N. Cioffi, G. Scamarcio, G. Palazzo and L. Torsi, Anal. Bioanal. Chem., 2019, 411, 4899–4908 CrossRef CAS.
- D. Blasi, L. Sarcina, A. Tricase, A. Stefanachi, F. Leonetti, D. Alberga, G. F. Mangiatordi, K. Manoli, G. Scamarcio, R. A. Picca and L. Torsi, ACS Omega, 2020, 5, 16762–16771 CrossRef CAS.
- R. S. Clegg and J. E. Hutchison, Langmuir, 1996, 12, 5239–5243 CrossRef CAS.
- O. M. Cabarcos, A. Shaporenko, T. Weidner, S. Uppili, L. S. Dake, M. Zharnikov and D. L. Allara, J. Phys. Chem. C, 2008, 112, 10842–10854 CrossRef CAS.
- D. Allara and J. Stapleton, in Surface science techniques, ed. G. Bracco and B. Holst, Springer, Berlin Heidelberg, 2013, vol. 513, pp. 59–97 Search PubMed.
- S. A. Swanson, R. McClain, K. S. Lovejoy, N. B. Alamdari, J. S. Hamilton and J. C. Scott, Langmuir, 2005, 21, 5034–5039 CrossRef CAS PubMed.
- S. Prati, M. Milosevic, G. Sciutto, I. Bonacini, S. G. Kazarian and R. Mazzeo, Anal. Chim. Acta, 2016, 941, 67–79 CrossRef CAS PubMed.
- T. Lummerstorfer, J. Kattner and H. Hoffmann, Anal. Bioanal. Chem., 2007, 388, 55–64 CrossRef CAS.
- R. F. Carvalhal, R. S. Freire and L. T. Kubota, Electroanalysis, 2005, 17, 1251–1259 CrossRef CAS.
- S. Trasatti and O. A. Petrii, Pure Appl. Chem., 1991, 63, 711–734 CAS.
- H. Shen, J. E. Mark, C. J. Seliskar, H. B. Mark Jr. and W. R. Heineman, J. Solid State Electrochem., 1997, 1, 148–154 CrossRef CAS.
- S. Campuzano, M. Pedrero, C. Montemayor, E. Fatas and J. Pingarrón, J. Electroanal. Chem., 2006, 586, 112–121 CrossRef CAS.
- J. Wang, B. Zeng, C. Fang and X. Zhou, J. Electroanal. Chem., 2000, 484, 88–92 CrossRef CAS.
- C. Cannes, F. Kanoufi and A. J. Bard, Langmuir, 2002, 18, 8134–8141 CrossRef CAS.
- K. Oldham, Adv. Eng. Softw., 2010, 41, 9–12 CrossRef.
- M. Ganser, F. Hildebrand, M. Klinsmann, M. Hanauer, M. Kamlah and R. McMeeking, J. Electrochem. Soc., 2019, 166, H167–H176 CrossRef CAS.
- H. Hagenström, M. J. Esplandiú and D. M. Kolb, Langmuir, 2001, 17, 839–848 CrossRef.
- T. T. Calam and E. C. R. Hasdemir, Acad. Bulg. Sci., 2019, 3, 316–326 Search PubMed.
- M. D. Porter, T. B. Bright, D. L. Allara and C. E. D. Chidsey, J. Am. Chem. Soc., 1987, 109, 3559–3568 CrossRef CAS.
- Y. F. Xing, S. J. O’Shea and S. F. Y. Li, J. Electroanal. Chem., 2003, 542, 7–11 CrossRef CAS.
- T. J. Lenk, V. M. Hallmark, C. L. Hoffmann, J. F. Rabolt, D. G. Castner, C. Erdelen and H. Ringsdorf, Langmuir, 1994, 10, 4610–4617 CrossRef CAS.
- P. A. Lewis, R. K. Smith, K. F. Kelly, L. A. Bumm, S. M. Reed, R. S. Clegg, J. D. Gunderson, J. E. Hutchison and P. S. Weiss, J. Phys. Chem. B, 2001, 105, 10630–10636 CrossRef CAS.
- H. O. Finklea, D. A. Snider and J. Fedyk, Langmuir, 1990, 6, 371–376 CrossRef CAS.
- M. Kim, J. N. Hohman, A. C. Serino and P. S. Weiss, J. Phys. Chem. C, 2010, 114, 19744–19751 CrossRef CAS.
- L. P. Méndez De Leo, E. de la Llave, D. Scherlis and F. J. Williams, J. Chem. Phys., 2013, 138, 114707 CrossRef PubMed.
- A. Eswari and L. Rajendran, Russ. J. Electrochem., 2011, 47, 181–190 CrossRef CAS.
- R. J. Klingler and J. K. Kochi, J. Am. Chem. Soc., 1980, 102, 4790–4798 CrossRef CAS.
- I. Lavagnini, R. Antiochia and F. Magno, Electroanalysis, 2004, 16, 505–506 CrossRef CAS.
- R. S. Clegg and J. E. Hutchison, J. Am. Chem. Soc., 1999, 121, 5319–5327 CrossRef CAS.
- A. Tricase, D. Blasi, A. Favia, A. Stefanachi, F. Leonetti, G. Colafemmina, L. Torsi and G. Scamarcio, Appl. Surf. Sci., 2021, 149883 CrossRef CAS.
- S.-W. Tam-Chang, H. A. Biebuyck, G. M. Whitesides, N. Jeon and R. G. Nuzzo, Langmuir, 1996, 11, 4371–4382 CrossRef.
| This journal is © The Royal Society of Chemistry 2021 |


