 Open Access Article
Electrically driven formation and dynamics of swallow-tail solitons in smectic A liquid crystals†
Yuan
Shen
 and
Ingo
Dierking
 *
*
Department of Physics and Astronomy, School of Natural Sciences, University of Manchester, Oxford Road, Manchester M13 9PL, UK. E-mail: ingo.dierking@manchester.ac.uk
First published on 27th May 2021
Abstract
Electric field driven instabilities of liquid crystals, such as electro-convections, spatiotemporal chaos, backflows, and solitons are of great importance for both fundamental science and practical applications. Here we demonstrate that particle-like multidimensional solitons representing self-localized molecular director deformations can be produced in a smectic A liquid crystal by applying electric fields. These solitons are transformed from focal conic domains with a static structure topologically analogous to parabolic focal conic domains. They lack fore-aft symmetry and move perpendicular to the smectic layers and to the applied electric field direction. During motion, the solitons collide with each other and with colloidal particles and restore their speed and shape after collisions. The rich dynamic behavior and easy control of the solitons make them extremely promising for a broad range of future studies.
Introduction
Solitons are self-sustained spatially localized waves that propagate with constant speeds and shapes. They were firstly observed as water waves in a shallow canal by Russell in 1834,1 but their significance was not widely appreciated until 1965 when the word ‘soliton’ was coined by Zabusky and Kruskal.2 Nowadays, solitons have been investigated in various nonlinear systems such as nonlinear photonics, superfluids, plasma, superconductors, magnetic materials, and liquid crystals (LCs).3,4 A well-known example of a soliton is the Great Red Spot in Jupiter's atmosphere, which is actually a persistent high-pressure region that has been existing for centuries. Despite the ubiquity of solitons, generating multidimensional solitons is still a long-standing challenge due to their poor stabilities.4 Solitons of higher dimensions open the way to the investigations of various new phenomena such as topological states in the form of vortex tori and rings4 and are of practical importance such as the magnetic skyrmions in racetrack memory and spintronic devices.5 It is thus attractive to scientists in different fields to find an efficient way to create stable multidimensional solitons and even control their motions.Liquid crystals (LCs) provide an ideal testbed for investigations of solitons due to their unique physical properties.6,7 LCs are anisotropic fluids that combine the fluidity of isotropic liquids with the long range order of crystalline solids. They are generally characterized by certain symmetries in the preferred orientations of LC molecules, i.e. the director n.8,9 Solitons in LCs have been investigated for decades.7 Early studies were concentrated on the so-called planar or linear solitons, which are actually transition regions or ‘walls’ where n smoothly rotates by π.10,11 Propagating solitary waves were generated in nematics by shearing.12,13 Optical solitons in nematics called nematicons represent self-focused, continuous wave light beams and have received great attention in the last decade due to their promising applications in optical information technology.14 Topological solitons in the form of baby skyrmions, torons, hopfions, etc. can be generated in chiral nematics by applying electric fields or by the use of laser tweezers.15,16 Recently, three dimensional dissipative solitons were produced in nematics with both negative17,18 and positive dielectric anisotropies.19
So far, the investigations of solitons in LCs are mainly restricted to nematic phases with only rarely investigations being carried out on other phases such as fluid smectic phases. A fluid smectic phase is characterized by the existence of a lamellar arrangement of elongated molecules with orientational and one-dimensional positional order. Within each single layer, the molecules are orientated in a specific direction but the centres of mass are distributed isotropically without any further in-layer positional order.20 In broken symmetry states, smectics usually expel deviations from equal-layer spacing in a manner which can be mapped onto the Meissner–Higgs effect,21 leading to remarkable patterns of singular ellipses, hyperbolas, and parabolas known as focal conic domains (FCDs).22 Within each FCDs, the equidistant smectic layers are deformed into shapes of concentric Dupin cyclides that are folded around two conjugated lines, viz., an ellipse and a confocal hyperbola (Fig. S1, ESI†).23 FCDs have appealed to theorists and experimentalists since the early 20th century.24 Their investigations have gone from mere geometric curiosities25,26 to the focus of functional applications such as matrices for self-assembly of soft microsystems,27 lithographic templates28 and micro-lens arrays,29,30 just to name a few. However, so far, FCDs were mostly investigated as static field configurations,31 with only rare studies of their out-of-equilibrium dynamics.22
In this work, multi-dimensional solitons are generated in a smectic A (SmA) phase by applying a low-frequency electric field. The formation of the solitons is intimately related to the FCDs and their static configuration is analogous to the so-called parabolic focal conic domains (PFCDs).32 The soliton is a localized “swallow-tail”-like deformation of smectic layers with a singular defect line located at its focus. At the same time, similar to the dissipative solitons in nematics,19 the solitons in SmA break the fore-aft symmetry and move through a slab of uniformly aligned smectic LC in a direction perpendicular to the smectic layers with a constant speed and do not spread while moving over macroscopic distances hundreds times larger than their size. Both the speed and the direction of the solitons can be controlled by the frequency and amplitude of the electric field. During the motion, the solitons survive collisions with each other, restoring shape and speed. The solitons can also form linear chains that move with constant speeds and can even interact with colloidal particles. Our finding provides a facile method for generating and manipulating multi-dimensional solitons in smectic LCs which is attractive to not only physical and material scientists due to their rich nonlinear dynamic behaviors, but also engineers due to their potential applications such as targeted delivery of optical information and micro-cargo.
Materials and methods
Commercially available smectic liquid crystal 8CB (SYNTHON Chemicals) with a positive anisotropy of dielectric permittivity, Δε = ε‖ − ε⊥ > 0 and a negative anisotropy of electric conductivity, Δσ = σ‖ − σ⊥ < 0 is used as the soliton medium (Fig. S2, ESI†); the subscripts indicate whether the component is measured parallel or perpendicular to the director, n, respectively. The components of dielectric permittivity and conductivity of 8CB are measured at 34.0 °C through an LCR meter E4980A (Agilent) using commercial cells with planar and homeotropic alignment, respectively (Fig. S2, ESI†). The smectic A phase is aligned homogeneously in a commercial cell (AWAT, Poland) whose inner surfaces are covered with transparent indium tin oxide (ITO) layers to act as transparent electrodes and spin-coated with polyimide that is rubbed along the x-axis (Fig. 1(a)) as alignment layer. The cell gap, d, is measured to be 9.5 ± 0.5 μm through the thin film interference method.33 The sample is heated up to a temperature (T) slightly below the nematic–smectic phase transition temperature (T < TN−S ∼ 35 °C) through a hot stage (LTSE350, Linkam) which is controlled by a temperature controller (TP 94, Linkam). A low-frequency AC field (f < 100 Hz), E = (0, 0, E), is applied perpendicular to the substrate plane (parallel to the smectic layers) of the cell to induce the solitons which are observed through a polarizing microscope (Leica OPTIPOL). Images and movies are recorded by a charge-coupled device camera (UI-3360CP-C-HQ, uEye Gigabit Ethernet). For investigation of interactions between solitons and colloidal particles, silica micro-particles with diameters (RP) of 1.5 μm and 3.0 μm are used. A very small amount of micro-particles is firstly placed at the entrance of LC cells and then dragged into the cell by capillary filling of the LC.Results
Electrically driven formation of swallow-tail solitons
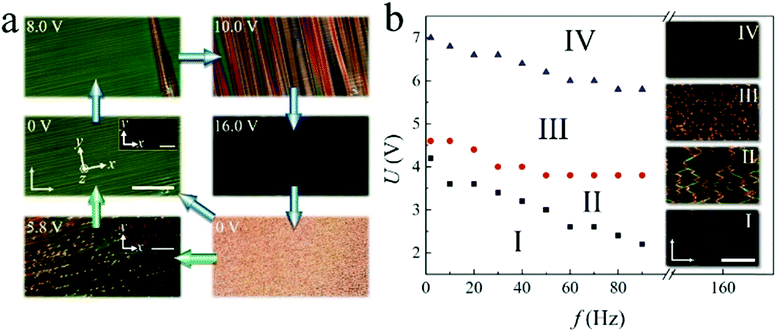
In a homogeneously aligned nematic film with Δε > 0, the competition between the surface anchoring and the dielectric torque on n induced by the electric field often leads to a uniform reversible electro-optic effect, the Freederickz transition, once the applied voltage, U, exceeds a specific threshold, UF. In the fluid smectic phases however, due to the strong divergence of the bend elastic constant k33 as well as the large layer compression modulus B, the amplitude of the distortion of the layer normalwhere λ is the smectic characteristic length, is very small, making the Freederickz transition a “ghost” effect.34 As Fig. 1(a) shows, when U increases to values much larger than UF (UF ∼ 1.2 V for 8CB at 36.0 °C), the homogeneous texture of SmA starts breaking up, with striations nucleating at the ITO edges and surface imperfections, which then gradually travel along the smectic layers (U = 8.0 V). With increasing U, these striations extend throughout the smectic phase and become more numerous, forming a striated texture (U = 10.0 V).35–37 It is assumed that there are actually small regions of homeotropic alignment lying beside the imperfections where the “seeding” starts.38 For further increase of U, the sample turns into a quasi-homeotropic state characterized by the dark optical texture (U = 16.0 V). By directly turning off the voltage, a light scattering state (U = 0 V) is obtained, which was used as an effective way for light controls in other studies.37,39–41 Such a texture is composed of thousands to millions of FCDs and is metastable. It will eventually relax back into a homogeneous state. The relaxation time varies from tens of seconds to several days depending mainly on the temperature of the sample. The higher the temperature (T < TN−S), the shorter the duration. However, if a low frequency field with a mediate voltage (U = 5.8 V) is applied to the scattering state, the FCDs are transformed into dynamic swallow-tail solitons that move perpendicular to the SmA layers with a constant speed (Supplementary Movie 1, ESI†). Fig. 1(b) shows the frequency dependence of voltage thresholds of different states transformed from the soliton state (inset III). By increasing U, the solitons disappear and the sample becomes quasi-homeotropic (inset IV). Gradually decreasing U from the solitons state, the motion of the solitons continuously slows down. Once the solitons stop moving, their structures slowly collapse and spread out, forming a number of PFCDs that are tangled up (inset II). Further decreasing U, most of the PFCDs disappear, leading to the homogeneous state embed with sporadically distributed PFCDs (inset I). It is also noted that the thresholds of different states decrease with increasing frequency, f, which may be attributed to the influence of ions which will be discussed in detail below.
Static structure of swallow-tail solitons
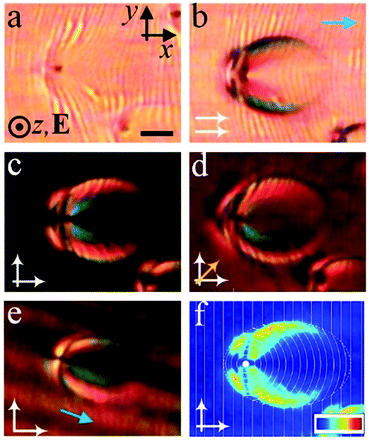
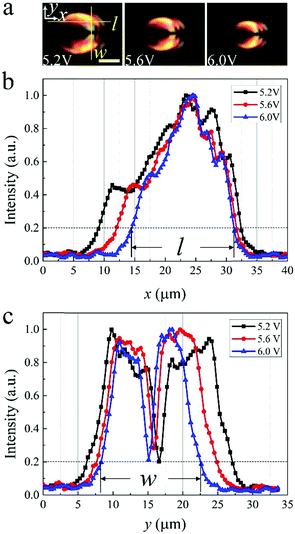
Fig. 2(a)–(e) show the optical textures of a typical swallow-tail-like soliton. It is noted that periodic light and dark stripes are produced at low-frequency voltages (Fig. 2(a) and (b)), which generally align along the y-axis (perpendicular to the alignment direction), but get distorted near and within the solitons. (Fig. 2(e) and (f)). The origin of these stripes are not clear yet. One may suspect these are layer undulations or periodic modulations of the director field induced by the electro-hydrodynamic instabilities. However, to give a specific explanation of the generation of the stripes requires further investigations and is out of the scope of the present study. The soliton shows a swallow-tail like texture under crossed polarizers with a structure analogous to the PFCDs (Fig. 2(f)). The dotted line in Fig. 2(f) represents an elliptical contour which is generated as a result of the localization of the stress. The contour is composed of the loci of the cusps of SmA layers. Outside the soliton, the equidistant layers align homogeneously perpendicular to the molecular alignment direction (x-axis), leading to a dark texture between crossed polarizers (Fig. 2(c)). Inside the soliton, the transmitted light intensity increases (Fig. 2(c)), indicating azimuthal deviations of the director from the alignment. As a result, the SmA layers continuously deform into curves along the y-axis, whose curvature gradually decreases as they toward the vertexes of the ellipse along the x-axis (Fig. 2(f)). The curvature exhibits a maximum at one of the foci of the ellipse, where a singular defect line is located and acts as the core of the soliton. This line is actually a +2π disclination which is topologically analogous to the +1 radial lines of the nematic state. The line can be clearly observed as a black spot in Fig. 2(a) due to light scattering. Around this line, equidistant layers curve into concentric circles and encircle it, forming a cylinder.42 The layers within the soliton are translationally invariant along the z-axis, forming a two-dimensional configuration. However, the soliton can also be distorted into a three-dimensional structure by tuning the electric field. In that case, the singular defect line transforms into a parabola in the x–z plane, which is analogous to the structure of PFCDs43 (Fig. S3, ESI†). At fixed voltage U and frequency f, the solitons preserve their size during motion. By increasing U at fixed f, both the length (l) and width (w) of solitons decrease (Fig. 3). Both l (Fig. 3(b)) and w (Fig. 3(c)) are determined from the image of the soliton taken between crossed polarizers (Fig. 3(a)), measured between the two points where the transmitted light intensity drops to 20% of the maximum.Dynamics of swallow-tail solitons
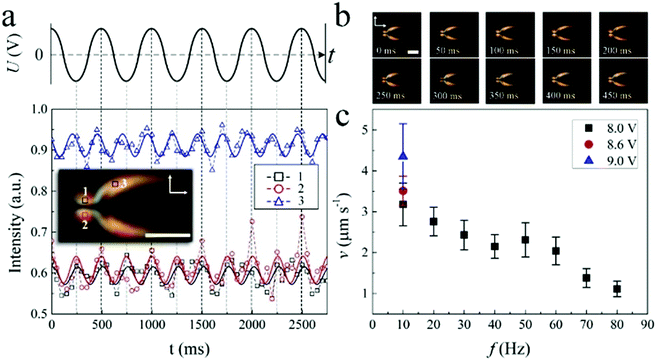
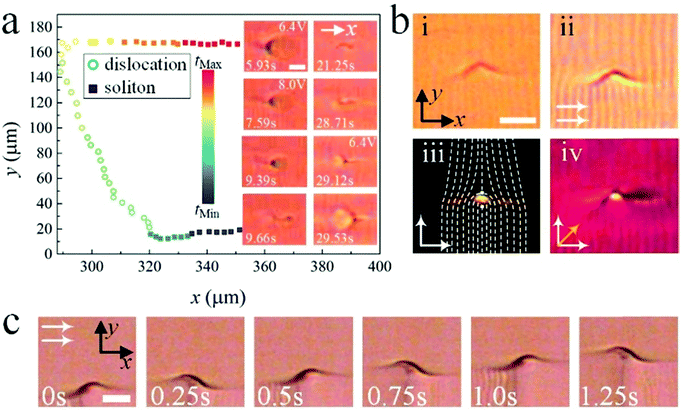
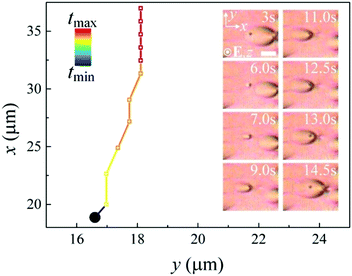
Fig. 4(a) shows the dynamic structure of a swallow-tail soliton. When driven by a low frequency voltage, the director n within the soliton tilts up and down relative to the x–y plane with a polar angle θ, leading to a periodic modulation of light transmission. The frequency of the oscillation of n is twice the frequency of the applied voltage indicating a dielectric effect. This also leads to a periodic shape transformation of the soliton of expansion, contraction and morphing during motion (Fig. 4(b)). It should be noted here that in order to obtain a better intensity variation curve profile, the AC field applied in (a) and (b) is a sinusoidal wave. Except for this point, the remaining investigations throughout the article were carried out with rectangular wave AC fields. Both the applied voltage and frequency control the speed of the solitons uniformly throughout the sample. In Fig. 4(c), it is depicted that the speed of the solitons increases by increasing voltages at a fixed frequency. On the other hand, the speed gradually decreases as the frequency is increased. Such a decrease can be attributed to the motion of ions which depends on the external electric field and will be discussed in detail below.Generally, the solitons move bidirectionally along the alignment direction (x-axis). However, they can also move in the y-axis direction in the form of edge dislocations by tuning the applied voltage. In Fig. 5(a), a soliton firstly moves in the x-axis direction. By increasing U, the soliton gradually shrinks and collapses into an edge dislocation (insets) which then moves along the y-axis. By slowly decreasing U, the edge dislocation transforms into a soliton (insets) again and moves in the x-axis direction (Supplementary Movie 2, ESI†). It should be noted that this is not the case for all solitons, in fact some solitons annihilate during the increase of U while some dislocations never turn back to solitons by decreasing U (Supplementary Movie 3, ESI†). As a result, the motion of the solitons can be actually switched from one spatial dimension to two spatial dimensions just by tuning the applied voltages. Fig. 5(b) shows the static optical textures of an edge dislocation that transforms from a soliton, which is made of a +1/2, −1/2 disclination pair. During the motion, the dislocation oscillates from left to right periodically with the frequency of the applied voltage (Fig. 5(c) and Supplementary Movie 4, ESI†). Such a movement which is perpendicular to the Burgers vector b of the dislocation is called “climb”.44
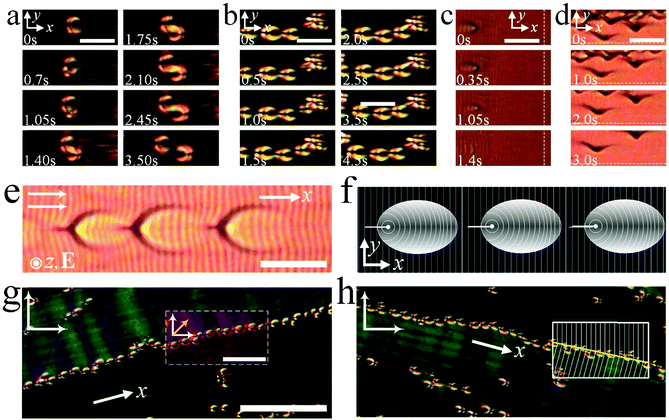
It is observed that sometimes a moving soliton may split into two solitons with the other moving in the opposite direction (Supplementary Movie 5, ESI†). Such a proliferation is also observed in the dynamics of nematic dissipative solitons18 and may be attributed to the nonlinear coupling between the director field n(r) and hydrodynamic flows of ion motions (Fig. 6(a)). The solitons also continuously nucleate with an uncorrelated frequency at irregularities such as surface imperfections which can be clearly visible under the microscope due to the distortion of the director field n(r) around them (Fig. 6(b) and Supplementary Movie 6, ESI†). On the other hand, the solitons disappear once they get close to the edges of the ITO electrodes, which are parallel to the SmA layers (Fig. 6(c) and Supplementary Movie 7, ESI†). In contrast, edge dislocations are generated at the ITO electrodes which are perpendicular to the SmA layers, and move away from the electrodes along the y-axis (Fig. 6(d) and Supplementary Movie 8, ESI†). Furthermore, the solitons may even form linear chains which move at a constant speed (Fig. 6(e), (f) and Supplementary Movie 9, ESI†). This indicates that there may be some long-range attractions between individual solitons due to the deformation of SmA layers, which requires further investigations. At the same time, small-angle discontinuity walls8 are formed due to the abrupt symmetry breaking transition induced by applying the electric field, along which long linear chains of solitons are moving forward (Fig. 6(g), (h) and Supplementary Movie 10, ESI†).
Interactions between swallow-tail solitons and colloidal micro-particles
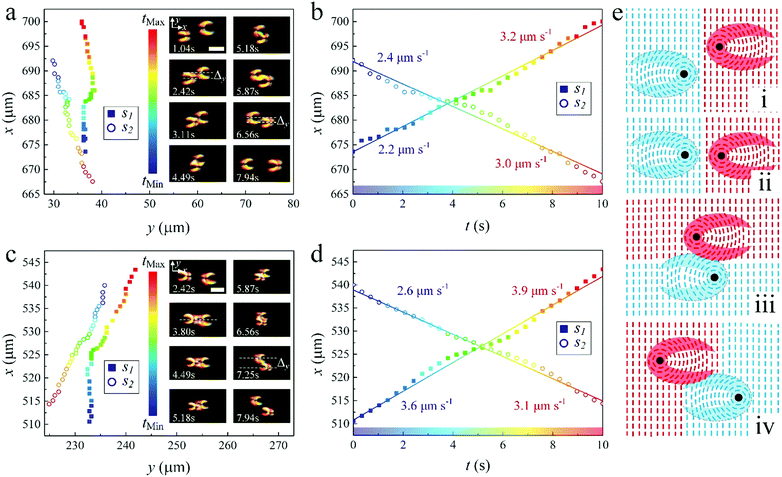
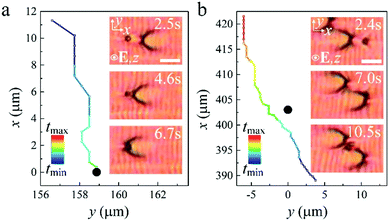
Two swallow-tail solitons moving towards each other can collide during motion. Since the solitons are spatially two-dimensional in the x–y plane, the outcome of the collisions mostly depends on their relative locations in the plane. We define an impact parameter, Δy, which is the distance between the cores of two solitons moving towards each other measured along the y-axis. When the offset, Δy, is much larger than the diameter of the core (singular defect line) of the solitons, Rc (Δy ≫ Rc), the two solitons pass through each other like waves without noticeable perturbations and the offset, Δy, almost keeps constant after the collision (Fig. 7(a), (b) and Supplementary Movie 11, ESI†). This behavior is due to the compatibility of the layer deformations along the y-axis of the two solitons in the overlapping zone (Fig. 7(e)i, iii and iv). On the other hand, solitons that collide head-on, i.e. where Δy ≤ Rc, behave like hard-body particles that they cannot pass through each other directly. They push against each other along the x-axis and repulse each other into opposite directions along the y-axis, and then pass through each other once Δy ≫ Rc. The offset, Δy, greatly increases after the collision (Fig. 7(c) and (d) and Supplementary Movie 12, ESI†). We attribute such a behavior to the repulsive force between the two singular defect lines with the same sign. Fig. 7(e)ii, iii and iv illustrate the process of the head-on collision schematically. In both cases after the collisions, the solitons recover their structures and constant speeds, which may be slightly different from the pre-collision speeds (Fig. 7(a)–(d)).A swallow-tail soliton can also interact with colloidal micro-particles. In Fig. 8(a), a soliton moves towards an immobile micro-particle, and then suddenly sticks to the particle. The soliton cannot move forward any longer and its defect core is trapped by the particle (Supplementary Movie 13, ESI†). However, in Fig. 8(b), when a soliton hits an immobile micro-particle, it is repelled by the particle along the x-axis and pushed away from it in the y-direction, before it can subsequently pass the particle (Supplementary Movie 14, ESI†). This process is very similar to the head-on collision of two solitons described above. The micro-particles can even act as seeds for the nucleation of solitons, from which solitons are generated continuously. This looks similar to the nucleation of solitons at surface imperfections described above, however, the processes of the nucleation in these two cases are quite different. In the first case, an intact soliton is formed and released directly from a surface imperfection (Fig. 6(b) and Supplementary Movie 5, ESI†). In the case of a micro-particle, the deformation of the SmA layers around the particle gradually grows into a soliton. Once the soliton is matured, it moves away from the particle and a new soliton starts growing at the particle (Fig. 9 and Supplementary Movie 15, ESI†).
Discussions
Three dimensional particle-like dissipative solitons were recently discovered in nematic LCs,17–19 which have attracted increasing attention due to their exotic nonlinear dynamic behaviors and their potential applications in microfluidic systems. They preserve their shape during motions over long distances and after collisions, which is very similar to the swallow-tail solitons described here. The solitons in nematics are propagating solitary waves of director deformations and are thus topologically nontrivial and equivalent to the uniform state. In contrast, the swallow-tail solitons are characterized by a layered multi-dimensional structure and contain a singular defect line inside, which is topologically analogous to the structure of PFCDs.The FCDs are actually prototypes of the swallow-tail solitons, from which the solitons are transformed (Fig. 1(a)). In Fig. S4 (ESI†), it is observed that by applying a low-frequency voltage to the scattering state, the fore-aft symmetry of the tightly packed FCDs is broken by fluid flow and they start floating locally and colliding with each other, forming the solitons. Some of the solitons are annihilated during the motion and collisions. Within several seconds, the structure becomes holey and the solitons begin to move bidirectionally perpendicular to the SmA layers with constant speed (Supplementary Movie 16, ESI†). There are several factors that can induce the motion of solitons, which are (1) hydrodynamic flows of ions, (2) backflows produced by the rotational dynamics of the director, and (3) the periodic expanding and contracting of the director structure of the solitons. However, the influence of ions can be suppressed by applying a high-frequency (f = 5 kHz) voltage to the scattering state, which is simultaneously modulated with a lower modulation frequency (fm = 10 Hz). In this case, a periodic array of solitons is obtained (Fig. S5, ESI†). Despite the fact that the director field oscillates with the frequency of the electric field due to the dielectric interaction, as well as the solitons expanding and contracting periodically with the modulation frequency fm, the solitons do not move at all. This implies that the ionic motion plays an important role in the motion of the solitons. Such an assumption can be further evidenced by the frequency dependence of the soliton speed, which decreases with increasing frequency. The solitons move at frequencies lower than 100 Hz. This region can be related to the so-called “conductivity regime” limited from above by the critical frequency fc = τσ−1(ξ2 – 1)1/2 which is used to describe electro-hydrodynamic effects in nematic LCs.8,45 Here τσ = 4πε0ε⊥σ⊥−1 is the space charge relaxation time for a homogeneous cell,20ε0 = 8.85 × 10⁻¹² F m−1 and ξ is a dimensionless parameter depending on the permittivities, conductivities, and the viscosities of the LC system. By applying the experimental data measured at f = 100 Hz and T = 34.0 °C for 8CB (Fig. S2, ESI†), we obtain τσ−1 ∼ 1 kHz. The factor ξ is hard to determine since the viscosities of 8CB are unknown. If we assume that (ξ2 – 1)1/2 is of the order of 1,46 we get fc ∼ 1 kHz. This indicates that the swallow-tail solitons move at frequencies below 100 Hz, corresponding to the conductivity regime in which ions move slowly under an external electric field.
An ideal smectic A phase is characterized by the D∞h symmetry and can be viewed as a two-dimensional fluid in planes that are parallel to the horizontal symmetry plane σh, or as a one-dimensional solid along the infinite rotation axis C∞. As a result, there is an additional potential barrier W for molecules penetrating SmA layers. One typical evidence of the existence of such a barrier is the transport of micro-particles. Those move along the director in nematics,47–49 but move parallel to the layers in smectics,50,51 which indicates the larger diffusion constants within SmA layers. However, in our experiment, the solitons always move perpendicular to the SmA layers. Due to the extremely large compressibility modulus B, the interlayer distance of SmA is almost rigidly fixed. As a result, within the swallow-tail solitons, to minimize the cost of the free energy, the elastic distortion of the SmA layers is in the form of curvature along the y-axis. This leads to a fore-aft symmetry breaking structure, i.e. the solitons are mirror-symmetric about the x-axis and lack mirror-symmetry about the y-axis. Such a symmetry breaking structure enables the solitons to move perpendicular to the SmA layers. Furthermore, the temperature T of our sample is very close to the nematic-smectic phase transition temperature TN–S (in most cases, TN−S – T ≤ 1.0 °C). Since the transition is of very weak first order (close to second order),20 it can be presumed that the layer structure of the SmA phase is not very pronounced and the potential barrier W is relatively small at such a high temperature. This leads to a relatively pronounced permeation flow along the x-axis (normal to the smectic layers). In brief, the fore-aft symmetry breaking structure of the solitons determines the moving direction of the solitons and the relatively large permeation flow drives the solitons move along the x-axis. It is found that the motion of solitons keeps slowing down by decreasing the temperature and eventually stops when TN−S – T ∼ 3.0 °C (Supplementary Movie 17, ESI†). This is because with decreasing temperature, the layer structure becomes more pronounced and the potential barrier W increases, thus leading to the decrease of the permeation flow.
The swallow-tail solitons always move along the alignment direction, which implies that one can control their motion by manipulating the alignment pattern. For instance, the photo-alignment technique is known for its flexibility and high resolution in this respect, which has been broadly applied for realizing various LC devices such as holographic gratings,52,53 terahertz microlenses,54 optical vortex processors,55etc. Various complex two-dimensional motions of solitons can thus be realized by the photo-alignment technique, which can be utilized for realizing targeted delivery of optical information. It is also well known that the regions of molecular misalignment, such as defect cores, are energetically disfavored in LCs. Embedding particles within the cores can replace part of the energetically costly region with the particles, thus reducing the overall energy of the LC system.9,56,57 Due to this property, FCDs have been broadly utilized as lithography templates for the self-assembly of micro-/nano-materials due to the existence of singular defect lines.27,58 In the same way, our solitons can also be used for particle trapping and transport, and realization of various microfluidic applications by combining with the photo-alignment technique.
Conclusions
To conclude, electrically powered multi-dimensional swallow-tail solitons in the form of travelling SmA layer deformations embedded with defect cores are produced in a smectic A liquid crystal. The formation and structure of these solitons are closely related to FCDs and their dynamics are attributed to the electro-hydrodynamic fluid flows induced by ion motions. The easy generation and manipulation of the particle-like solitons and their rich nonlinear dynamic behavior should not only open the door to a broad range of theoretical studies but also pave new avenues for versatile dynamic soliton systems with potential applications in optics and microfluidics.Author contributions
Y. S. conceived and carried out the experimental investigations, analysed the experimental results and wrote the first draft of the manuscript. I. D. supervised the investigations, and contributed through discussions and writing the manuscript.Conflicts of interest
The authors declare no competing interests.Acknowledgements
Y. S. gratefully acknowledges the China Scholarship Council (CSC) for kind support (201806310129).Notes and references
- A. C. Scott, F. Y. F. Chu and D. W. McLaughlin, Proc. IEEE, 1973, 61, 1443–1483 Search PubMed.
- N. J. Zabusky and M. D. Kruskal, Phys. Rev. Lett., 1965, 15, 240–243 Search PubMed.
- T. Dauxois and M. Peyrard, Physics of solitons, Cambridge University Press, 2006 Search PubMed.
- Y. V. Kartashov, G. E. Astrakharchik, B. A. Malomed and L. Torner, Nat. Rev. Phys., 2019, 1, 185–197 Search PubMed.
- X. Yu, Y. Onose, N. Kanazawa, J. Park, J. Han, Y. Matsui, N. Nagaosa and Y. Tokura, Nature, 2010, 465, 901–904 Search PubMed.
- M. Kralj, M. Kralj and S. Kralj, Phys. Status Solidi A, 2021, 2000752 Search PubMed.
- L. Lam and J. Prost, Solitons in liquid crystals, Springer Science & Business Media, 2012 Search PubMed.
- P.-G. De Gennes and J. Prost, The Physics of Liquid Crystals, Oxford University Press, 2nd edn, 1993 Search PubMed.
- Y. Shen and I. Dierking, Appl. Sci., 2019, 9, 2512 Search PubMed.
- W. Helfrich, Phys. Rev. Lett., 1968, 21, 1518–1521 Search PubMed.
- L. Leger, Solid State Commun., 1972, 10, 697–700 Search PubMed.
- Z. Guozhen, Phys. Rev. Lett., 1982, 49, 1332–1335 Search PubMed.
- L. Lei, S. Changqing, S. Juelian, P. M. Lam and H. Yun, Phys. Rev. Lett., 1982, 49, 1335–1338 Search PubMed.
- M. Peccianti and G. Assanto, Phys. Rep., 2012, 516, 147–208 Search PubMed.
- Y. Shen and I. Dierking, Phys. Rev. Appl., 2021, 15, 054023 Search PubMed.
- I. I. Smalyukh, Rep. Prog. Phys., 2020, 83, 106601 Search PubMed.
- B.-X. Li, V. Borshch, R.-L. Xiao, S. Paladugu, T. Turiv, S. V. Shiyanovskii and O. D. Lavrentovich, Nat. Commun., 2018, 9, 2912 Search PubMed.
- Y. Shen and I. Dierking, Commun. Phys., 2020, 3, 1 Search PubMed.
- Y. Shen and I. Dierking, Soft Matter, 2020, 16, 5325 Search PubMed.
- L. M. Blinov, Structure and properties of liquid crystals, Springer Science & Business Media, 2010 Search PubMed.
- P. G. de Gennes, Solid State Commun., 1972, 10, 753–756 Search PubMed.
- D. B. Liarte, M. Bierbaum, M. Zhang, B. D. Leahy, I. Cohen and J. P. Sethna, Phys. Rev. E: Stat., Nonlinear, Soft Matter Phys., 2015, 92, 062511 Search PubMed.
- M. Kleman and O. D. Laverntovich, Soft matter physics: an introduction, Springer Science & Business Media, 2007 Search PubMed.
- G. Friedel and F. Grandjean, Bull. Mineral., 1910, 33, 409–465 Search PubMed.
- Y. Bouligand, J. Phys., 1972, 33, 525–547 Search PubMed.
- J. Fournier and G. Durand, J. Phys. II, 1991, 1, 845–870 Search PubMed.
- D. K. Yoon, M. C. Choi, Y. H. Kim, M. W. Kim, O. D. Lavrentovich and H.-T. Jung, Nat. Mater., 2007, 6, 866 Search PubMed.
- Y. H. Kim, D. K. Yoon, H. S. Jeong and H.-T. Jung, Soft Matter, 2010, 6, 1426–1431 Search PubMed.
- Y. H. Kim, H. S. Jeong, J. H. Kim, E. K. Yoon, D. K. Yoon and H.-T. Jung, J. Mater. Chem., 2010, 20, 6557–6561 Search PubMed.
- Y. H. Kim, J. O. Lee, H. S. Jeong, J. H. Kim, E. K. Yoon, D. K. Yoon, J. B. Yoon and H. T. Jung, Adv. Mater., 2010, 22, 2416–2420 Search PubMed.
- M. Kleman and J. Friedel, Rev. Mod. Phys., 2008, 80, 61 Search PubMed.
- C. S. Rosenblatt, R. Pindak, N. Clark and R. Meyer, J. Phys., 1977, 38, 1105–1115 Search PubMed.
- A. M. Goodman, Appl. Opt., 1978, 17, 2779–2787 Search PubMed.
- A. Rapini, J. Phys., 1972, 33, 237–247 Search PubMed.
- M. Hareng, S. Le Berre and J. Metzger, Appl. Phys. Lett., 1975, 27, 575–576 Search PubMed.
- Z. Li and O. D. Lavrentovich, Phys. Rev. Lett., 1994, 73, 280 Search PubMed.
- A. Jáki and A. Saupe, Mol. Cryst. Liq. Cryst. Sci. Technol., Sect. A, 1992, 222, 101–109 Search PubMed.
- A. Findon, H. Gleeson and J. Lydon, Phys. Rev. E: Stat., Nonlinear, Soft Matter Phys., 2000, 62, 5137 Search PubMed.
- D. Coates, W. Crossland, J. Morrisy and B. Needham, J. Phys. D: Appl. Phys., 1978, 11, 2025 Search PubMed.
- N. Nawa and D. Nuo, Jpn. J. Appl. Phys., 1991, 30, 1038 Search PubMed.
- M. Steers and A. Mircea-Roussel, J. Phys., Colloq., 1976, 37, C3-145–C143-148 Search PubMed.
- D. Demus, Textures of liquid crystals, New York, 1979 Search PubMed.
- S. Asher and P. S. Pershan, J. Phys., 1979, 40, 161–173 Search PubMed.
- P. M. Chaikin, T. C. Lubensky and T. A. Witten, Principles of condensed matter physics, Cambridge University Press, Cambridge, 1995 Search PubMed.
- L. M. Blinov and V. G. Chigrinov, Electrooptic effects in liquid crystal materials, Springer Science & Business Media, 1996 Search PubMed.
- B.-X. Li, R.-L. Xiao, S. Paladugu, S. V. Shiyanovskii and O. D. Lavrentovich, Nat. Commun., 2019, 10, 3749 Search PubMed.
- I. Dierking, G. Biddulph and K. Matthews, Phys. Rev. E: Stat., Nonlinear, Soft Matter Phys., 2006, 73, 011702 Search PubMed.
- O. P. Pishnyak, S. Tang, J. R. Kelly, S. V. Shiyanovskii and O. D. Lavrentovich, Phys. Rev. Lett., 2007, 99, 127802 Search PubMed.
- O. D. Lavrentovich, I. Lazo and O. P. Pishnyak, Nature, 2010, 467, 947 Search PubMed.
- T. Togo, K. Nakayama, M. Ozaki and K. Yoshino, Jpn. J. Appl. Phys., 1997, 36, L1520–L1522 Search PubMed.
- I. Dierking, P. Cass, K. Syres, R. Cresswell and S. Morton, Phys. Rev. E: Stat., Nonlinear, Soft Matter Phys., 2007, 76, 021707 Search PubMed.
- S.-S. Li, Y. Shen, Z.-N. Chang, W.-S. Li, Y.-C. Xu, X.-Y. Fan and L.-J. Chen, Appl. Phys. Lett., 2017, 111, 231109 Search PubMed.
- Y. Shen, Y.-C. Xu, Y.-H. Ge, R.-G. Jiang, X.-Z. Wang, S.-S. Li and L.-J. Chen, Opt. Express, 2018, 26, 1422–1432 Search PubMed.
- Z. Shen, S. Zhou, S. Ge, W. Duan, L. Ma, Y. Lu and W. Hu, Opt. Express, 2019, 27, 8800–8807 Search PubMed.
- P. Chen, L. L. Ma, W. Duan, J. Chen, S. J. Ge, Z. H. Zhu, M. J. Tang, R. Xu, W. Gao and T. Li, Adv. Mater., 2018, 30, 1705865 Search PubMed.
- Y. Shen and I. Dierking, Soft Matter, 2019, 15, 8749 Search PubMed.
- M. Ravnik, G. P. Alexander, J. M. Yeomans and S. Žumer, Proc. Natl. Acad. Sci. U. S. A., 2011, 108, 5188 Search PubMed.
- Y. H. Kim, D. K. Yoon, H. S. Jeong, O. D. Lavrentovich and H.-T. Jung, Adv. Funct. Mater., 2011, 21, 610–627 Search PubMed.
Footnote |
| † Electronic supplementary information (ESI) available. See DOI: 10.1039/d1ma00356a |
| This journal is © The Royal Society of Chemistry 2021 |

