 Open Access Article
Accurate chiral pattern recognition for amines from just a single chemosensor†
Yui
Sasaki
 a,
Soya
Kojima
b,
Vahid
Hamedpour
 a,
Riku
Kubota
 a,
Shin-ya
Takizawa
 c,
Isao
Yoshikawa
 a,
Hirohiko
Houjou
 a,
Yuji
Kubo
 *b and
Tsuyoshi
Minami
 *a
*a
aInstitute of Industrial Science, The University of Tokyo, 4-6-1 Komaba, Meguro-ku, Tokyo, 153-8505, Japan. E-mail: tminami@iis.u-tokyo.ac.jp; Fax: +81-3-5452-6365; Tel: +81-3-5452-6364
bDepartment of Applied Chemistry, Graduate School of Urban Environmental Sciences, Tokyo Metropolitan University, 1-1 Minami-osawa, Hachioji, Tokyo 192-0397, Japan. E-mail: yujik@tmu.ac.jp
cDepartment of Basic Science, Graduate School of Arts and Sciences, The University of Tokyo, 3-8-1 Komaba, Meguro-ku, Tokyo, 153-8902, Japan
First published on 24th February 2020
Abstract
The current work proposes a novel determination method for enantiomeric excess (ee) in (mono- and di-) amines using molecular self-assembly. A pyridine-attached binaphthyl derivative ((R)-1) exhibits fluorescence responses based on imine formation between the aldehyde group of (R)-1 and target chiral amines (i.e. cyclohexane diamine (CHDA), 2-amino-1,2-diphenylethanol (ADPE), 1,2-diphenylethylenediamine (DPDA), 1-amino-2-indanol (AID), and leucinol) in the presence of zinc(II) ions (Zn2+). Because of the multi-optical responses which are derived from the variation of chiral complexes, pattern recognition-based discrimination (i.e. linear discriminant analysis (LDA)) has been achieved for five types of enantiomeric pairs of amines. Possessing such a discrimination capability in combination with data processing (LDA and an artificial neural network) allows accurate determination (prediction error < 1.8%) of the % ee of individual targets such as CHDA which is one of the main components of pharmaceutical drugs. The simple molecular self-assembled system enabled simultaneous multi-chiral discrimination and % ee determination of unknown samples.
Introduction
To date, integration of chemosensors and pattern recognition algorithms has vigorously promoted rapid, accurate and simultaneous sensing of multiple analytes, because finger-print like responses derived from spectral changes in chemosensors can offer valuable information for target discrimination even in complicated environments.1 To generate finger-print like optical responses in a chemosensor array, diverse chemosensors consisting of many types of backbones,2 fluorophores3 and chromophores4 with several optical detection mechanisms such as intramolecular charge transfer (ICT),5 photo-induced electron transfer (PeT),6 and fluorescence resonance energy transfer (FRET)7 are required. Thus, great efforts are necessary to synthesize and integrate a large amount of chemosensors for obtaining a sufficient number of response patterns in a chemosensor array. However, only a few chemosensors have significantly contributed to the discrimination of analytes in practice.8 Therefore, a simple array consisting of a very small number of chemosensors enabling the discrimination of a large number of analytes is desired. In addition, the employment of molecular self-assembly can reduce the synthetic effort for chemosensors.9 Thus, the combination of self-assembled chemosensors and pattern recognition is potentially one of the best methods for chemical sensing.Chiral compounds are challenging target analytes because of the difficulty in design and synthesis of chiral hosts taking complementarity into account.10 In this regard, a number of binaphthyl derivatives possessing axial chirality have been synthesized and applied to the chiral recognition.11 As classical designs of chiral binaphthyl hosts, selective receptors with high structural rigidity have been considerably researched.12 For example, Pu et al. performed chiral discrimination for amino acids based on imine formation of a bisBINOL-based dialdehyde derivative and amino acids.13 A pyridyl linker moiety of the compound with Zn(II) ions (Zn2+) induced a rigid complex, resulting in an OFF–ON type fluorescence response with chiral selectivity. However, chiral chemosensor arrays for qualitative discrimination of multiple analytes and determination of enantiomeric excess (ee) are still at the frontier.14 In this regard, Anzenbacher et al. reported a self-assembled chemosensor array consisting of three types of binaphthyl-based fluorophores, 2-formylphenylboronic acid and target chiral amines.15 The proposed array was fabricated by only mixing these components, and the array offered chiral discrimination based on an ON–OFF fluorescence response pattern derived from spontaneous iminoboronate formation. In addition, Wolf et al. reported biomimicry- and click chemistry-based % ee determination methods for chiral amines using CD spectral changes.16 Here, we propose chiral pattern recognition using a self-assembled system with a single chiral derivative toward simpler % ee determination.
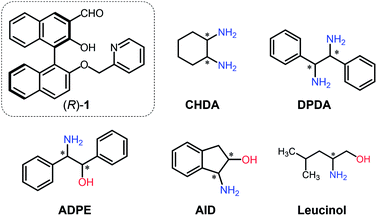
To perform qualitative and quantitative analyses of chiral targets using a single derivative, various optical response patterns should be generated by multiple self-assembled complexes derived from simple components. Toward this end, we designed a very simple binaphthyl derivative (R)-1 for chiral amine discrimination (Fig. 1). The compound (R)-1 possesses aldehyde and pyridyl groups for spontaneous imine formation with chiral amines in the presence of Zn2+. It is known that the BINOL-derived imine compound has binding selectivity for Zn2+ over other transition metal ions.17,18 In our case, Zn2+-coordination would participate in enantioselective binding behavior toward chiral analytes. Notably, the formation of the rigid imine structure in the presence of Zn2+ results in fluorescence enhancement derived from suppressed non-radiative deactivation19 and intramolecular charge transfer (ICT).20 The combination of these effects provides OFF–ON fluorescence responses. In contrast, the removal of Zn2+ from the CHDA-derived complex decreases the fluorescence intensity. Such OFF–ON and ON–OFF responses in the fluorescence intensity and color are the key to determine the % ee with low error by using only a single chemosensor. It is notable that the fluorescence color is analyte amine concentration-dependent; the resultant multi-fluorescence response allows us to develop a simple method for % ee determination in the analyte based on pattern recognition and machine learning. With this intention, we selected cyclohexane diamine (CHDA), 2-amino-1,2-diphenylethanol (ADPE), 1,2-diphenylethylenediamine (DPDA), 1-amino-2-indanol (AID), and leucinol as targets (Fig. 1) because of their importance in drug development. For example, CHDA is present in the backbone of anti-cancer drugs (e.g. Eloxatin)21 and anti-viral drugs (e.g. Tamiflu).22
Results and discussion
Enantiomeric 3-formyl-2,2′-dihydroxy-1,1′-naphthalene (R)-2 was synthesized according to a method previously reported.23 The precursor (R)-2 and 2-(chloromethyl)pyridine hydrochloride were mixed; (R)-1 was then obtained by Williamson ether synthesis at 46% yield (Fig. 2). The product (R)-1 was identified by 1H NMR, 13C NMR, fast atom bombardment-mass spectrometry, and elemental analysis (see the ESI†). Moreover, single crystal X-ray diffraction of (R)-1 revealed that the pyridine unit was regioselectively attached (Fig. 2). The binaphthyl unit exhibited an orthogonal structure and the dihedral angle was estimated to be 92° in the solid state (see the ESI for more details†). | ||
| Fig. 2 Synthetic scheme of (R)-1. The X-ray diffraction structure of (R)-1 is shown at the right side of the scheme. Thermal ellipsoids are scaled to the 50% probability level. The carbon atoms are shown in dark grey, the nitrogen atoms in purple, and the oxygen atoms in red (CCDC 1976941). | ||
Next, we attempted to prepare a self-assembled chiral complex with imine formation between (R)-1 and (1R,2R)-CHDA. (R)-1 and Zn(OAc)2 were first mixed in a 1![[thin space (1/6-em)]](https://www.rsc.org/images/entities/char_2009.gif) :
:![[thin space (1/6-em)]](https://www.rsc.org/images/entities/char_2009.gif) 1 molar ratio, and the mixture was incubated at 25 °C for 1 h. Subsequently, the target amine was injected into the mixture and imine formation proceeded spontaneously under incubation for 24 h. Although we set the incubation time as 24 h, the assay time can be shorter due to the 90% fluorescence response time being within 8 h (Fig. S5† and vide infra). The 1H NMR spectra of (R)-1 and the product are shown in Fig. 3. The proton peak assigned to the aldehyde group was observed at 10.30 ppm, while the peak disappeared and a new peak assignable to the imino group was observed at 8.16 ppm after the incubation. Among changes in the chemical shifts of almost all peaks, AB type signals originating from methylene protons were largely split at 5.42 ppm (J = 15.9 Hz) and 4.45 ppm (J = 15.8 Hz), as shown in Fig. 3B. The splitting is most probably due to the high rigidity and asymmetric environment of the product.19
1 molar ratio, and the mixture was incubated at 25 °C for 1 h. Subsequently, the target amine was injected into the mixture and imine formation proceeded spontaneously under incubation for 24 h. Although we set the incubation time as 24 h, the assay time can be shorter due to the 90% fluorescence response time being within 8 h (Fig. S5† and vide infra). The 1H NMR spectra of (R)-1 and the product are shown in Fig. 3. The proton peak assigned to the aldehyde group was observed at 10.30 ppm, while the peak disappeared and a new peak assignable to the imino group was observed at 8.16 ppm after the incubation. Among changes in the chemical shifts of almost all peaks, AB type signals originating from methylene protons were largely split at 5.42 ppm (J = 15.9 Hz) and 4.45 ppm (J = 15.8 Hz), as shown in Fig. 3B. The splitting is most probably due to the high rigidity and asymmetric environment of the product.19
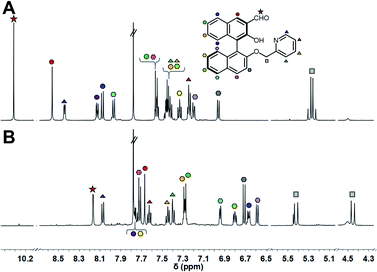 | ||
Fig. 3
1H NMR spectra (500 MHz, CDCl3![[thin space (1/6-em)]](https://www.rsc.org/images/entities/char_2009.gif) : :![[thin space (1/6-em)]](https://www.rsc.org/images/entities/char_2009.gif) MeOD = 1 MeOD = 1![[thin space (1/6-em)]](https://www.rsc.org/images/entities/char_2009.gif) : :![[thin space (1/6-em)]](https://www.rsc.org/images/entities/char_2009.gif) 2, v/v) of (A) (R)-1, (B) the mixture of (R)-1 and (1R,2R)-CHDA with Zn(OAc)2. [(R)-1] = 3 mM, [Zn(OAc)2] = 3 mM, [(1R,2R)-CHDA] = 3 mM. 2, v/v) of (A) (R)-1, (B) the mixture of (R)-1 and (1R,2R)-CHDA with Zn(OAc)2. [(R)-1] = 3 mM, [Zn(OAc)2] = 3 mM, [(1R,2R)-CHDA] = 3 mM. | ||
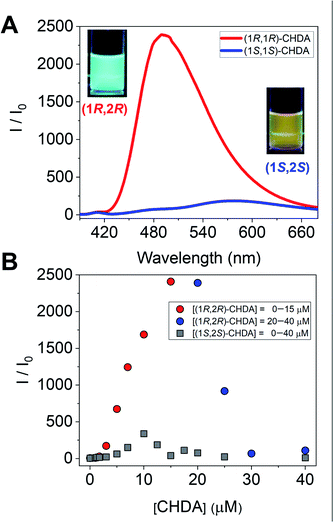
To further investigate imine formation, we performed UV-vis, circular dichroism (CD), and fluorescence spectroscopy. The complexation of (R)-1 and CHDA by spontaneous imine formation in the presence of Zn(OAc)2 accompanied changes in the multi-step optical properties. As an important result, the fluorescence spectra showed the enantioselectivity of Zn(II)-coordinated (R)-1 for the pair of enantiomers of CHDA, with the chiral selectivity (Int(1R,2R)-CHDA/Int(1S,2S)-CHDA) estimated to be 2500 (Fig. 4A). In this regard, the fluorescence intensity and color showed the difference of complementarity between (1R,2R)- and (1S,2S)-CHDA for imine formation. Interestingly, the fluorescence pattern of (R)-1 contains OFF–ON and ON–OFF fluorescence signals depending on the concentration of CHDA (Fig. 4B). The fluorescence changes were related to UV-vis and CD spectral changes (see the ESI†). The variety of optical response patterns could contribute to the fabrication of pattern-recognition based chemical sensing systems even with a single component.
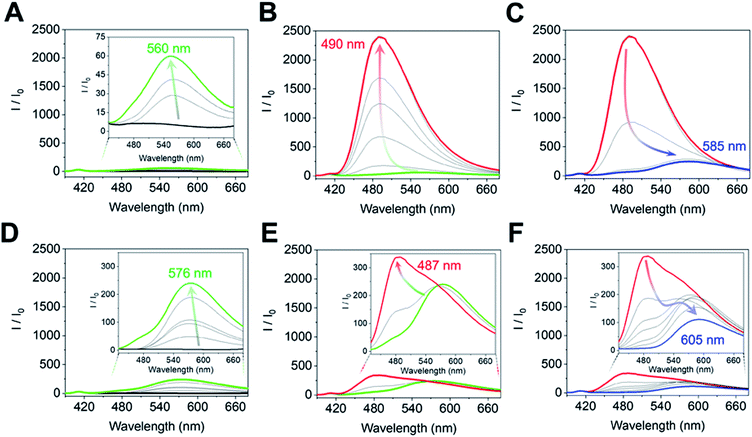
The complex of (R)-1 (10 μM) and Zn(OAc)2 (10 μM) originally showed no fluorescence, and a fluorescence change was not obtained even after the imine formation process in the low concentration range (0 μM ≤ [(1R,2R)-CHDA] ≤1.7 μM) of (1R,2R)-CHDA (Fig. 5A). Subsequently, the fluorescence enhancement accompanied by a blueshift was observed with the gradual increase of (1R,2R)-CHDA concentrations ([(1R,2R)-CHDA] ≤ 20 μM) (Fig. 5B). The OFF–ON signal in the fluorescence with the blue shift was induced by the increase of the rigidity of the complex and change in the ICT character through the process of Schiff's base formation.20 Indeed, 1H NMR confirmed that the imine product possessed high rigidity (vide supra). Here, a fluorescence ON–OFF signal accompanied by a redshift at an excess amount of (1R,2R)-CHDA was observed (Fig. 5C). The optical change may be induced by decreasing the rigidity of the imine structure; an excess amount of (1R,2R)-CHDA could pull the Zn2+ ion out of the imine complex.24 To reveal whether the optical changes are based on the removal of Zn2+ from the CHDA-derived complex, we measured the CHDA-concentration-dependent 1H NMR spectra of the mixture of (R)-1 and (1R,2R)-CHDA in the presence of Zn(OAc)2. The AB type signals assigned to methylene protons at 5.19 ppm (J = 7.8 Hz) (Fig. S4A†) were largely split up to 1 eq. of (1R,2R)-CHDA at 5.42 ppm (J = 15.9 Hz) and 4.45 ppm (J = 15.8 Hz) (Fig. S4A–D†). On the other hand, the largely split methyl protons disappeared with the addition of an excess amount of (1R,2R)-CHDA (Fig. S4E†). Moreover, in Fig. S4E† signals significantly appeared at 8.55 and 8.35 ppm due to the aromatic protons, the spectral pattern being similar to that of (R)-1 as shown in Fig. S4A.† The proton peak assignable to the aldehyde group was not observed in Fig. S4E,† indicating that a chemical species with an imine structure ((R)-1–(1R,2R)-CHDA) might be present in the solution. Given that the addition of an excess amount of (1R,2R)-CHDA caused signal broadening in Fig. S4E,† the excess (1R,2R)-CHDA most probably released Zn2+ from the Zn2+-coordinated (R)-1–(1R,2R)-CHDA complex in a competitive binding mode, which confirms that the ON–OFF change in the fluorescence might stem from the removal of Zn2+.
On the other hand, the fluorescence spectra of (R)-1 with Zn(OAc)2 showed a slight blueshift with the addition of (1S,2S)-CHDA (0 μM ≤ [(1S,2S)-CHDA] ≤ 5 μM) (Fig. 5D). Moreover, the fluorescence intensity was gradually enhanced with a blueshift in the spectra ranging from 0.5 to 1.0 eq. of (1S,2S)-CHDA (Fig. 5E). Furthermore, a fluorescence decrease accompanied by a redshift was observed with an excess amount of (1S,2S)-CHDA, the spectral change of which showed a similar tendency to that of (1R,2R)-CHDA (Fig. 5F). Additionally, the emission quantum yields (φ) of each complex were 20% for (1R,2R)-CHDA and 7% for (1S,2S)-CHDA, respectively. Electrospray ionization mass spectrometry (ESI-MS) also indicates multi-complexation such as imine products with or without Zn2+.
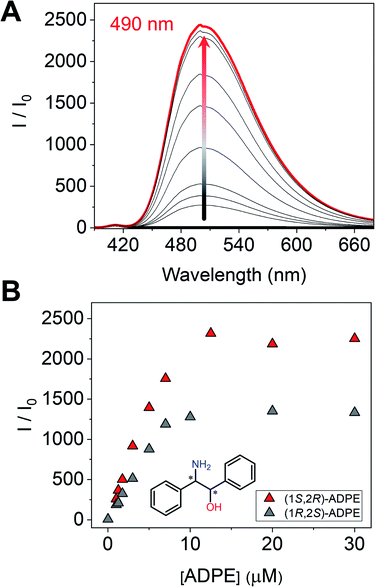
Next, we measured the optical properties for imine formation with a monoamine such as ADPE. As shown in Fig. 6A, the fluorescence intensity was enhanced by the imine formation, and such an optical change was saturated at 1 eq. of (1S,2R)-ADPE. In the case of (1S,2R)-ADPE, removal of the Zn2+ ion from the (1S,2R)-ADPE derived complex did not occur unlike in CHDA. This is most probably due to the difference in the Lewis acidity between alcohol amine and diamine. In addition, the (1R,2S)-ADPE derived complex showed a relatively weaker OFF–ON fluorescence response than (1S,2R)-ADPE, which could be due to poor complementarity for (R)-1 (Fig. 6B).
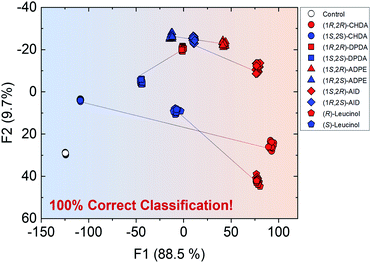
Overall, the self-assembled system was able to generate various optical responses to the difference in chirality as well as types of amine derivatives even though only one binaphthyl derivative (R)-1 was used. Hence, the simple system has the potential for simultaneous chiral discrimination and accurate % ee determination for multiple analytes. We set up a fluorescent multi-recognition system based on the proposed simple chiral self-assembly for qualitative and quantitative analysis of five types of enantiomeric pairs of representative amines. For the simultaneous classification of target amines, linear discriminant analysis (LDA)25 was employed. LDA enables the reduction of the dimensionality of the dataset derived from multi-fluorescence patterns including wavelengths and fluorescence intensities for each target amine and classifies the multivariate data. To evaluate the level of classification accuracy, a leave-one-out cross-validation protocol (i.e. the Jackknife method) was used. Moreover, twenty-four repetitions were conducted for each amine in all assays to assess the reproducibility of the fluorescence responses. Student's t-test was also applied to exclude four outlier data-points (of twenty-four repetitions) for decreasing the error. In the LDA results, eleven clusters (control and ten types of chiral amines) were completely discriminated with 100% correct classification (Fig. 7). Remarkably, the classification indicates a difference in the fluorescence responses for chirality, resulting in the grouping of blue (left side) and red clusters (right side). In particular, the distance between (1R,2R)- and (1S,2S)-CHDA was far more than that between others, since the characteristics of (1R,2R)- and (1S,2S)-CHDA complexes, such as the fluorescence properties, were completely different from each other. In this assay, we successfully performed the simultaneous discrimination of enantiomers in amines by using a single binaphthyl derivative in the presence of Zn(OAc)2.
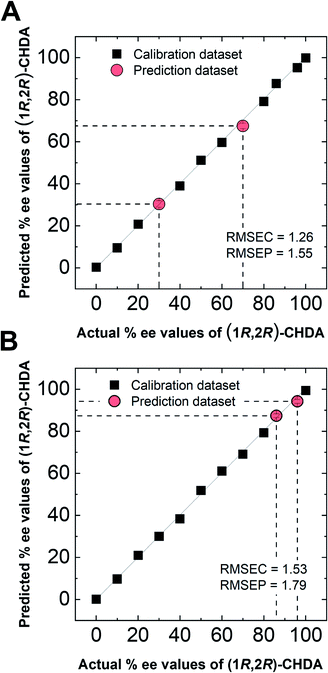
In semi-quantitative analysis, simultaneous discrimination of the chirality and concentration of CHDA was conducted by using LDA (see the ESI†). The LDA plots show classified clusters of (1R,2R)-CHDA (1 to 30 μM) (circle), (1S,2S)-CHDA (1 to 30 μM) (square), and a control. All tight clusters contain twenty repetitions. 100% correct classification was achieved with chirality and concentration-dependent distances. Indeed, the position of clusters stemmed from the fluorescence responses including the complicated response to CHDA. We further attempted % ee discrimination of (1R,2R)-CHDA (0% ee to 100% ee) at 10 μM. As a result of LDA (Fig. 8), all the clusters were discriminated with 100% correct accuracy. Obviously, the position of these clusters showed linearity, meaning that the proposed simple system can determine the % ee. Finally, we demonstrated the % ee determination of (1R,2R)-CHDA in combination with an artificial neural network (ANN)26,27 for the prediction of an unknown % ee. In general, for discrimination and/or prediction of target concentrations in complicated mixtures, many types of chemosensors with various characteristics (e.g. backbone structures, fluorophores and chromophores) are necessary to prepare cross-reactive response patterns. Given the great efforts in the development of conventional chemosensor arrays, the molecular self-assembly of a single binaphthyl derivative would be a ground-breaking concept toward simple % ee determination. Thus, we decided to predict unknown % ee by using only a single binaphthyl derivative combined with an ANN. The ANN algorithm is one of the most popular multivariate techniques because it can be used for regression, classification and clustering purposes. The ANN mimics the action of a biological network of neurons, and integration with backpropagation (BP)28 improves the training of feedforward neural networks for supervised learning. Therefore, this ANN-BP was utilized during the regression process. The ANN is a very powerful algorithm to obtain a calibration linear line for targets even though the inset data are complicated because of responses in mixtures or real samples. Hence, the combination of our simple molecular self-assembled system and the ANN model enables highly accurate analysis such as for the determination of the % ee. In this prediction, two types of % ee determination at the (a) large scale (30% ee and 70% ee) and (b) narrow scale (86% ee and 96% ee) were conducted. On the calibration lines, the predicted plots were correctly distributed with low errors (<1.8%) in both the tests (Fig. 9). The multi-detection system composed of a single binaphthyl derivative indicates the possibility of determining the % ee in unknown samples. The results suggest that the proposed model would have the potential for use in practical situations such as drug screening.
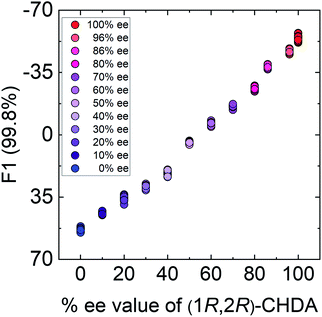 | ||
| Fig. 8 Results of the semi-quantitative assay based on LDA for the determination of % ee in (1R,2R)-CHDA. Twenty repetitions were conducted for each % ee. | ||
Conclusions
We synthesized a novel fluorescent binaphthyl derivative (R)-1 for the determination of % ee in amines based on the imine type molecular self-assembled system. The derivative (R)-1 spontaneously reacted with target amines such as CHDA, ADPE, DPDA, AID, and leucinol in the presence of Zn(OAc)2, resulting in various optical changes. Remarkably, the proposed chiral imine formation offered many types of complexes based on the difference in analyte structures and concentrations, and the chiral complexes showed multiple optical responses including spectral shifts and intensity changes even with a single binaphthyl derivative. The self-assembled system contributes to discrimination of not only chirality but also similar amine structures including mono- and di-amines. For a high throughput and accurate classification of enantiomers and the number of amines, we demonstrated qualitative analysis of five types of enantiomeric amine pairs by using LDA. The LDA classification results indicate the ability to discriminate a slight difference in structures. Finally, the determination of % ee in the amines was conducted in combination with the ANN for the accurate prediction of unknown % ee. The prediction was successful at both large (30% ee and 70% ee) and narrow (86% ee and 96% ee) scales. Although the prediction was carried out for a single analyte, quantitative % ee determination of mixtures considering amine exchange reactions29 could be performed using machine learning algorithms.6b,9f We successfully performed discrimination of ten types of analytes and prediction of % ee using only one binaphthyl derivative. Thus, we believe that our strategy can open up a new avenue for easy-to-use and accurate chiral pattern recognition from just a single chemosensor.Conflicts of interest
There are no conflicts to declare.Acknowledgements
TM thanks the Japan Society for the Promotion of Science (JSPS), Grant-in-Aid for Young Scientists (A), No. 17H04882. YK also thanks the JSPS, Grant-in-Aid for Scientific Research (B), No. 19H02704. YS also thanks the JSPS, Research Fellow for Young Scientists (DC1), No. 18J21190. A part of this work (X-ray single crystallographic analysis) was carried out at the Research Hub for Advanced Nano Characterization, The University of Tokyo.References
- For reviews, see: (a) K. J. Albert, N. S. Lewis, C. L. Schauer, G. A. Sotzing, S. E. Stitzel, T. P. Vaid and D. R. Walt, Chem. Rev., 2000, 100, 2595 CrossRef CAS PubMed; (b) J. J. Lavigne and E. V. Anslyn, Angew. Chem., Int. Ed., 2001, 40, 3118 CrossRef CAS; (c) P. Anzenbacher Jr, P. Lubal, P. Buček, M. A. Palacios and M. E. Kozelkova, Chem. Soc. Rev., 2010, 39, 3954 RSC; (d) K. Saha, S. S. Agasti, C. Kim, X. Li and V. M. Rotello, Chem. Soc. Rev., 2012, 112, 2739 CrossRef CAS PubMed; (e) Z. Li, J. R. Askim and K. S. Suslick, Chem. Rev., 2019, 119, 231 CrossRef CAS PubMed. For examples, see: (f) T. Minami, N. A. Esipenko, A. Akdeniz, B. Zhang, L. Isaacs and P. Anzenbacher Jr, J. Am. Chem. Soc., 2013, 135, 15238 CrossRef CAS PubMed; (g) S. Rana, S. G. Elci, R. Mout, A. K. Singla, M. Yazdani, M. Bender, A. Bajaj, K. Saha, U.-H. F. Bunz, F. R. Jirik and V. M. Rotello, J. Am. Chem. Soc., 2016, 138, 4522 CrossRef CAS PubMed; (h) Y. Liu, J. Lee, L. Perez, A. D. Gill, R. J. Hooley and W. Zhong, J. Am. Chem. Soc., 2018, 140, 13869 CrossRef CAS PubMed; (i) M. A. Beatty, A. J. Selinger, Y. Li and F. Hof, J. Am. Chem. Soc., 2019, 141, 16763 CrossRef CAS PubMed.
- (a) C.-C. You, O. R. Miranda, B. Gider, P. S. Ghosh, I.-B. Kim, B. Erdogan, S. A. Krovi, U. H. F. Bunz and V. M. Rotello, Nat. Nanotechnol., 2007, 2, 318 CrossRef CAS PubMed; (b) Z. Wang, M. A. Palacios and P. Anzenbacher Jr, Anal. Chem., 2008, 80, 7451 CrossRef CAS PubMed; (c) G. Sener, L. Uzun and A. Denizli, ACS Appl. Mater. Interfaces, 2014, 6, 18395 CrossRef CAS PubMed; (d) A. M. Mallet, A. B. Davis, D. R. Davis, J. Panella, K. J. Wallace and M. Bonizzoni, Chem. Commun., 2015, 51, 16948 RSC.
- (a) H. Kwon, W. Jiang and E. T. Kool, Chem. Sci., 2015, 6, 2575 RSC; (b) J. Han, B. Wang, M. Bender, K. Seehafer and U. H. F. Bunz, ACS Appl. Mater. Interfaces, 2016, 8, 20415 CrossRef CAS PubMed.
- (a) N. A. Rakow and K. S. Suslick, Nature, 2000, 406, 710 CrossRef CAS PubMed; (b) A. Buryak and K. Severin, J. Am. Chem. Soc., 2005, 127, 3700 CrossRef CAS PubMed; (c) K. Chulvi, P. Gaviña, A. M. Costero, S. Gil, M. Parra, R. Gotor, S. Royo, R. Martínez-Máñez, F. Sancenón and J.-L. Vivancos, Chem. Commun., 2012, 48, 10105 RSC.
- (a) J. N. Wilson and U. H. F. Bunz, J. Am. Chem. Soc., 2005, 127, 4124 CrossRef CAS PubMed; (b) W. Xu, C. Ren, C. L. Teoh, J. Peng, S. H. Gadre, H.-W. Rhee, C.-L. K. Lee and Y.-T. Chang, Anal. Chem., 2014, 86, 8763 CrossRef CAS PubMed; (c) Y.-C. Cai, C. Li and Q.-H. Song, ACS Sens., 2017, 2, 834 CrossRef CAS PubMed.
- (a) M. E. Germain and M. J. Knapp, J. Am. Chem. Soc., 2008, 130, 5422 CrossRef CAS PubMed; (b) Y. Sasaki, É. Leclerc, V. Hamedpour, R. Kubota, S. Takizawa, Y. Sakai and T. Minami, Anal. Chem., 2019, 91, 15570 CrossRef CAS PubMed.
- (a) S. Kiyonaka, K. Sada, I. Yoshimura, S. Shinkai, N. Kato and I. Hamachi, Nat. Mater., 2004, 3, 58 CrossRef CAS PubMed; (b) Q. Yan, X.-Y. Ding, Z.-H. Chen, S.-F. Xue, X.-Y. Han, Z.-Y. Lin, M. Yang, G. Shi and M. Zhang, Anal. Chem., 2018, 90, 10536 CrossRef CAS PubMed.
- Y. Liu, T. Minami, R. Nishiyabu, Z. Wang and P. Anzenbacher Jr, J. Am. Chem. Soc., 2013, 135, 7705 CrossRef CAS PubMed.
- (a) B. T. Nguyen and E. V. Anslyn, Coord. Chem., 2006, 250, 3118 CrossRef CAS. For examples, see; (b) Y. Kubo, T. Ishida, A. Kobayashi and T. D. James, J. Mater. Chem., 2005, 15, 2889 RSC; (c) H. Miyaji and J. L. Sessler, Angew. Chem., Int. Ed., 2001, 40, 154 CrossRef CAS; (d) P. Metola, E. V. Anslyn, T. D. James and S. D. Bull, Chem. Sci., 2012, 3, 156 RSC; (e) Y. Sasaki, T. Minamiki, S. Tokito and T. Minami, Chem. Commun., 2017, 53, 6561 RSC; (f) V. Hamedpour, Y. Sasaki, Z. Zhang, R. Kubota and T. Minami, Anal. Chem., 2019, 91, 13627 CrossRef CAS PubMed.
- For reviews, see: (a) X. X. Zhang, J. S. Bradshaw and R. M. Izatt, Chem. Rev., 1997, 97, 3313 CrossRef CAS PubMed; (b) C. Moberg, Angew. Chem., Int. Ed., 1998, 37, 248 CrossRef CAS; (c) A. Kumar, S.-S. Sun and A. J. Lees, Coord. Chem. Rev., 2008, 252, 922 CrossRef CAS; (d) H.-J. Schneider and A. K. Yatsimirsky, Chem. Soc. Rev., 2008, 37, 263 RSC; (e) K. Staszak, K. Wieszczycka, V. Marturano and B. Tylkowski, Coord. Chem. Rev., 2019, 397, 76 CrossRef CAS. For examples, see: (f) J.-S. Zhao, Y.-B. Ruan, R. Zhou and Y.-B. Jiang, Chem. Sci., 2011, 2, 937 RSC; (g) O. Kotova, S. Blasco, B. Twamley, J. O'Brien, R. D. Peacock, J. A. Kitchen, M. Martínez-Calvo and T. Gunnlaugsson, Chem. Sci., 2015, 6, 457 RSC; (h) R. Puglisi, F. P. Ballistreri, C. M. A. Gangemi, R. M. Toscano, G. A. Tomaselli, A. Pappalardo and G. T. Sfrazzetto, New J. Chem., 2017, 41, 911 RSC; (i) L.-E. Guo, Y. Hong, S.-Y. Zhang, M. Zhang, X.-S. Yan, J.-L. Cao, Z. Li, T. D. James and Y.-B. Jiang, J. Org. Chem., 2018, 83, 15128 CrossRef CAS PubMed.
- For reviews, see: (a) D. J. Cram and J. M. Cram, Acc. Chem. Res., 1978, 11, 8 CrossRef CAS; (b) J. H. Hartley, T. D. James and C. J. Ward, J. Chem. Soc., Perkin Trans. 1, 2000, 3155 RSC; (c) L. Pu, Acc. Chem. Res., 2012, 45, 150 CrossRef CAS PubMed; (d) A. Shockravi, A. Javadi and E. Abouzari-Lotf, RSC Adv., 2013, 3, 6717 RSC; (e) X. Zhang, J. Yin and J. Yoon, Chem. Rev., 2014, 114, 4918 CrossRef CAS PubMed. For examples, see: (f) K. W. Bentley, Y. G. Nam, J. M. Murphy and C. Wolf, J. Am. Chem. Soc., 2013, 135, 18052 CrossRef CAS PubMed; (g) Z. Huang, S. Yu, K. Wen, X. Yu and L. Pu, Chem. Sci., 2014, 5, 3457 RSC; (h) X. Zhang, C. Wang, P. Wang, J. Du, G. Zhang and L. Pu, Chem. Sci., 2016, 7, 3614 RSC; (i) J. Y. C. Lim, I. Marques, V. Félix and P. D. Beer, Chem. Commun., 2018, 54, 10851 RSC; (j) X. Xu, L. Qu, J. Song, D. Wu, X. Zhou and H. Xiang, Chem. Commun., 2019, 55, 9873 RSC.
- (a) T. D. James, K. R. A. S. Sandanayake and S. Shinkai, Nature, 1995, 374, 345 CrossRef CAS; (b) Y. Kubo, S. Maeda, S. Tokita and M. Kubo, Nature, 1996, 382, 522 CrossRef CAS.
- Y.-Y. Zhu, X.-D. Wu, S.-X. Gu and L. Pu, J. Am. Chem. Soc., 2019, 141, 175 CrossRef CAS PubMed.
- (a) H. H. Jo, C.-Y. Lin and E. V. Anslyn, Acc. Chem. Res., 2014, 47, 2212 CrossRef CAS PubMed. For examples, see: (b) S. Nieto, J. M. Dragna and E. V. Anslyn, Chem.–Eur. J., 2010, 16, 227 CrossRef CAS PubMed; (c) S. Yu, W. Plunkett, M. Kim and L. Pu, J. Am. Chem. Soc., 2012, 134, 20282 CrossRef CAS PubMed; (d) N. T. Greene and K. D. Shimizu, J. Am. Chem. Soc., 2005, 127, 5695 CrossRef CAS PubMed; (e) A. Akdeniz, T. Minami, S. Watanabe, M. Yokoyama, T. Ema and P. Anzenbacher Jr, Chem. Sci., 2016, 7, 2016 RSC; (f) F. Y. Thanzeel, A. Sripada and C. Wolf, J. Am. Chem. Soc., 2019, 141, 16382 CrossRef PubMed.
- E. G. Shcherbakova, T. Minami, V. Brega, T. D. James and P. Anzenbacher Jr, Angew. Chem., Int. Ed., 2015, 54, 7130 CrossRef CAS PubMed.
- (a) S. L. Pilicer, P. R. Bakhshi, K. W. Bentley and C. Wolf, J. Am. Chem. Soc., 2017, 139, 1758 CrossRef CAS PubMed; (b) F. Y. Thanzeel and C. Wolf, Angew. Chem., Int. Ed., 2017, 56, 7276 CrossRef CAS PubMed; (c) F. Y. Thanzeel, K. Balaraman and C. Wolf, Nat. Commun., 2018, 9, 5323 CrossRef CAS PubMed.
- S. Wang, G. Men, L. Zhao, Q. Hou and S. Jiang, Sens. Actuators, B, 2010, 145, 826 CrossRef CAS.
- F. Wang, J. H. Moon, R. Nandhakumar, B. Kang, D. Kim, K. M. Kim, J. Y. Lee and J. Yoon, Chem. Commun., 2013, 49, 7228 RSC.
- M. E. Shirbhate, R. Nandhakumar, Y. Kim, S.-J. Kim, S. K. Kim and K. M. Kim, Eur. J. Org. Chem., 2018, 4959 CrossRef CAS.
- K. Komatsu, Y. Urano, H. Kojima and T. Nagano, J. Am. Chem. Soc., 2007, 129, 13447 CrossRef CAS PubMed.
- D. Höfer, M. Galanski and B. K. Keppler, Eur. J. Inorg. Chem., 2017, 2347 CrossRef.
- S. Zhu, S. Yu, Y. Wang and D. Ma, Angew. Chem., Int. Ed., 2010, 49, 4656 CrossRef CAS PubMed.
- Y.-W. Wang, S.-B. Liu, W.-J. Ling and Y. Peng, Chem. Commun., 2016, 52, 827 RSC.
- M. N. Chaur, D. Collado and J.-M. Lehn, Chem.–Eur. J., 2011, 17, 248 CrossRef CAS PubMed.
- R. G. Brereton, Applied Chemometrics for Scientists, Wiley-VCH, Chichester, 2007 Search PubMed.
- (a) A. M. Zain, H. Haron, S. N. Qasem and S. Sharif, Appl. Math. Model., 2012, 36, 1477 CrossRef; (b) M. Jalali-Heravi, M. Arrastia and F. A. Gomez, Anal. Chem., 2015, 87, 3544 CrossRef CAS PubMed.
- (a) S. C. McCleskey, P. N. Floriano, S. L. Wiskur, E. V. Anslyn and J. T. McDevitt, Tetrahedron, 2003, 59, 10089 CrossRef CAS; (b) L. Zhu, S. H. Shabbir and E. V. Anslyn, Chem.–Eur. J., 2007, 13, 99 CrossRef CAS PubMed.
- F. Lussier, V. Thibault, B. Charron, G. Q. Wallace and J.-F. Masson, Trends Anal. Chem., 2020, 7, 115796 CrossRef.
- M. Ciaccia and S. Di Stefano, Org. Biomol. Chem., 2015, 13, 646 RSC.
Footnote |
| † Electronic supplementary information (ESI) available: Fluorescence, UV-Vis and CD titration spectra, quantum yield, emission lifetime, ESI-MS analysis results, experimental details of microarrays, and canonical score plots. CCDC 1976941. For ESI and crystallographic data in CIF or other electronic format see DOI: 10.1039/d0sc00194e |
| This journal is © The Royal Society of Chemistry 2020 |

