Continuous manufacturing of silver nanoparticles between 5 and 80 nm with rapid online optical size and shape evaluation†
Bruno
Pinho
and
Laura
Torrente-Murciano
 *
*
Department of Chemical Engineering and Biotechnology, University of Cambridge, Philippa Fawcett Drive, CB3 0AS, Cambridge, UK. E-mail: lt416@cam.ac.uk
First published on 6th December 2019
Abstract
The physical and chemical properties of metal nanoparticles are strongly dependent on their size and shape. In this work, we present a flexible manufacturing approach for the synthesis of spherical silver nanoparticles with tuneable sizes between 5 to 80 nm. This unique size flexibility is enabled by rapid online characterisation coupling spectroscopy and a mathematical Mie theory-based algorithm for size and shape evaluation. While it is conventionally believed that narrow size distributions require a fast nucleation step, herein, we demonstrate that fast and controllable growth is also required. To achieve this, a combination of chemical and engineering approaches is presented to limit thermodynamically driven size focus, coalescence and secondary nucleation. We show that an optimum reducing agent to silver precursor to seeds ratio and pH range need to be maintained throughout the growth stage. Such demanding conditions can be achieved by accurate control of the feed points and fluid dynamics across a series of microfluidic helical reactors leading to low mixing times. In this way, particle sizes with narrow size distributions and spherical shapes can be easily tuned by just varying the reducing agent-to-precursor concentration in the growth stage in an approach directly applicable to other metal nanoparticles.
I. Introduction
Metal nanoparticles have a unique set of optical, electrical and magnetic properties that drives a wide range of applications in the fields of medicine,1–4 chemistry,5 agriculture6 and biology7–9 to name a few. The final properties required for each application strongly depends on the particle size, distribution,10–12 composition,13–15 surface modification (i.e. ligands, surfactants, and coordinating solvents)16,17 and morphology (i.e. crystal structure and shape).18 Thereby, the ability to fine-tune the colloidal properties of nanoparticles via wet synthesis19 have attracted attention over the past decades as a way of developing a manufacturing technology.20,21 As a result, a vast number of capping ligands,12,22,23 surfactants24,25 and reducing agents26,27 have triggered the development of a large number of protocols both in batch and in continuous systems.28–34 Regularly, these protocols rely on a presence of ligands and/or high molecular weight reducing agents (e.g. tannic acid), which adds an obstructive layer to the nanoparticle surface, being difficult to displace without disturbing the colloidal properties. Despite potential interferences in the final application,12 they facilitate the synthesis of particles with narrow size distributions.35,36 Silver nanoparticles are particularly interesting due to their thermal/physical/optical properties,37,38 low price (∼1/90 of the price of gold),39 and applications, such as nanotoxicology,40 catalysis12,41 and plasmonic devices.42 The looked-for size ranges from a few nanometres to 100 nm depending on the application. To produce small-sized particles (up to 10 nm), a strong reducing agent is required to trigger rapid nucleation (e.g., sodium borohydride, NaBH4).19,40 However, to grow particles over a wide range, a mild reducing agent is desired (e.g. as trisodium citrate, Na3C6H5O7).40 Two synthesis routes promote controllable growth by the sequential additions of silver ions, being one discrete (stepwise growth)35,43 and another continuous (dropwise growth).40 As an example of a stepwise synthesis, Neus G. Bastús et al.35 synthesized monodisperse spherical silver nanoparticles (standard deviation of 10%) with sizes ranging from 10 to 200 nm. This synthesis involved the reduction of silver nitrate in a batch reactor by a complex formed by trisodium citrate and tannic acid acting as both reducing and stabilising agent by attaching to the silver surface.44 Shekhar Agnihotri et al.40 applied a dropwise approach with steps with adjusted concentrations of silver nitrate, sodium borohydride, and citrate, producing particles from 5 to 100 nm. Nonetheless, both approaches were carried out in batches, requiring a large number of additions (more than 10) to achieve particle sizes of 100 nm, meticulous preparation and/or post-synthesis purification. Besides, these dropwise methods normally present batch to batch variability and they are difficult to scale-up to continuous unsupervised manufacturing.The literature is scarce for the continuous synthesis of nanoparticles with size tunability over a wide range. Recently, J. B. Deshpande et al.45 synthesized silver nanoparticles using a CSTR (continuous stirred tank reactor) at pH 7.8, using AgNO3 and trisodium citrate (Na3C6H5O7). Their synthesis strategy leads to high throughput production of particles but did not provide tight control over growth, producing broad particle size distributions with average sizes ranging from ∼65 to 120 nm.
Despite the technology advancements, the controllable continuous synthesis of monodisperse particles from 5 to 80 nm is still a challenge. We have recently developed a novel approach for the continuous synthesis of small particles (<5 nm) in the absence of organic ligands19 by using helical reactor for the promotion of Dean vortexes within the laminar flow (Reynolds <50) enabling the synthesis of small particles with narrow size distributions. We have also demonstrated the separation of the nucleation and growth-stages by rapid changes in chemical (e.g. reducing agents) and physical (e.g. temperatures) environments using microfluidic reactors connected in series.46 Despite the promising results, this approach fails on the synthesis of NPs above 10 nm with narrow distribution due to the presence of secondary nucleation.
Taking advantage of the modular nature and hydrodynamic control of microfluidic reactors, this work presents a single step-up for the synthesis of silver particles with tuneable sizes between 5 to 80 nm. We show a distributed feed strategy along the continuous reactor to carefully control the growth rate supported by a novel online rapid (milliseconds time analysis) optical size and shape evaluation. This was possible through the development of a MATLAB mathematical algorithm to convert UV-vis spectra into particle size distribution based on Mie theory, enabling the assessment of the nanoparticle spherical quality (“spherical degree”). Success is only possible thanks to the simultaneous development of the synthetic understanding, reactor design and fast online characterisation to inspect time-resolved nanoparticle population in a flow stream.
II. Materials and methods
Silver nitrate solution (AgNO3, 0.1 M), and sodium hydroxide solution (NaOH, 0.1 M) were purchased from Fisher Scientific. Trisodium citrate dihydrate (Na3C6H5O7, ≥99%, FG), citric acid (C6H8O7), bovine serum albumin (BSA), nitric acid (HNO3, 65%) and sodium borohydride solution (NaBH4, 12 wt% in NaOH 14 M) were purchased from Sigma-Aldrich. Ultra-pure water was obtained from a Merck Milli-Q IQ 7005 water purification system (18.2 MΩ cm resistivity). All chemicals were used without further purification. All the solutions were freshly prepared at the beginning of each experiment. The mixture of trisodium citrate and citric acid was defined as just citrate. The concentrations for flow synthesis are defined as “concentrations before mixing” unless otherwise stated.Continuous synthesis of silver nanoparticles
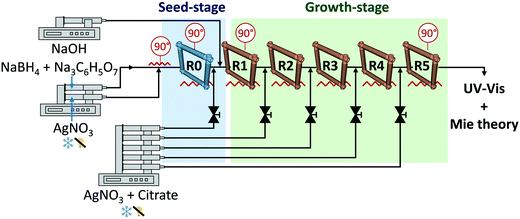
The synthesis of Ag nanoparticles was carried out inflow using microreactors connected in series as depicted in Fig. 1. In a typical synthesis of particles >10 nm, the nucleation step took place at 90 °C in the first reactor (R0, seed reactor) by mixing 62.5 μL min−1 of 3 μM NaBH4 and 20 μM Na3C6H5O7 and 62.5 μL min−1 of 1 μM AgNO3 in a T shape microchannel (ETFE, 0.02 inches through-hole, IDEX Health & Science LLC) using programmable syringe pumps from Chemyx (Fusion 200, accuracy ±0.35%). The temperature was controlled using two types of aluminium heating modules, one for the T-mixer and another for the reactor. Special care should be paid to avoid the degradation of the solutions and thus, the silver solution was kept under darkness and the NaBH4 and Na3C6H5O7 in ice-cold to avoid the hydrolysis of NaBH4. The silver solution was introduced perpendicular to the continuous flow. Growth took place at 90 °C in reactors R1 to R5 connected in series. At the entrance of each growth reactor, 25 μL min−1 of an aqueous solution of AgNO3, Na3C6H5O7 and C6H8O7 was added with citrate/AgNO3 concentrations range from 3.5/1 mM to 14/4 mM using T shape microchannels, similar to the one in the seed-stage, and a rack syringe pump. The reaction pH was adjusted in the growth-stage by adding 25 μL min−1 of a 60 mM aqueous NaOH solution (unless otherwise specified; pHIN ∼ 12) at the entrance of R1. All the reactors (R0 to R5) were 3 m long PFA tubing (perfluoroalkoxy, IDEX Health & Science LLC) with an outer and inner diameter of 1/16 and 0.03 inches, respectively. The tubing was coiled on an inverted flow helical 3D-printed frame (Fig. 1) (made with a FormLabs Form 1+ stereolithographic printer) with a helix and pitch diameter of 1 cm and 1/π cm, respectively. The outlet of the system was introduced into an ice-cold vial to reduce Brownian motion and, consequently, reduce agglomeration. These flow conditions have a Re between 15 and 23, and De between 4 and 6. The formation of silver oxide was avoided during the preparation of the stock solutions. A cleaning protocol was carried out at the beginning of each experimental day using nitric acid, water, silicone oil and NaOH solutions.In a typical synthesis of particles between 5 to 10 nm, the system consisted on a seed (R0) and a single growth reactor (R1).46 The nucleation step was carried out in the seed reactor (R0), by mixing 125 μL min−1 of 0.05 mM AgNO3 with 0.025 mM NaBH4 and 0.35 mM Na3C6H5O7 at 60 °C. This seed-stage produces particles of 5.1 ± 1.1 nm (∼6.6 × 10¹² particles per mL). In the growth reactor (R1), Na3C6H5O7 and AgNO3 were pumped at 25 μL min−1, and the temperature was set at 90 °C. The final particle size can be fine-tuned by changing the Na3C6H5O7 to AgNO3 ratio (6.2 to 9.3 nm using 3.5/0.5 to 14/2 mM/mM, respectively).46 No NaOH was required to correct the pH.
Characterisation of silver nanoparticles
Silver nanoparticles were characterised by transmission electron microscopy (TEM, FEI Tecnai 20), dynamic light scattering (DLS, Malvern Zetasizer Nano S90) and ultraviolet-visible spectroscopy (Agilent Cary 60), using a flow cell. Specimens for TEM analysis were prepared by mixing 0.3 g ml−1 of the BSA protein with the silver nanoparticle solution in a 1/1 v/v ratio to avoid their agglomeration during sample preparation.19 The solution was kept at 5 °C for at least 2 hours before preparing the TEM grid. The TEM images were analysed using the image processing software, ImageJ. Ultraviolet-visible spectroscopy measurements were performed on an Agilent Cary 60 UV-vis spectrophotometer in the 300 to 800 nm wavelength range with a resolution of 1 nm. For the DLS analysis, only particles above 10 nm were considered (intensity-based). Particles were analysed without any intermediate purification or separation steps.III. Mathematical algorithm for online nanoparticle size and shape evaluation
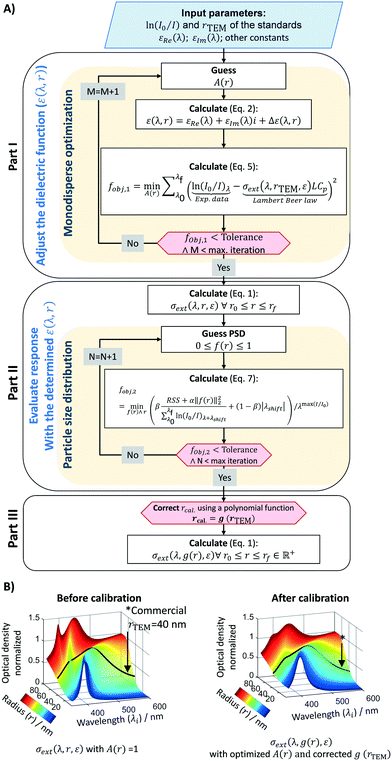
UV-vis spectroscopy is a widely used analytical technique to characterise the optical extinction of plasmonic metal nanoparticles due to its close dependence on particle size and size distribution (PSD).47,48 There are unique prospects and superiority over other characterization techniques (DLS, TEM and ICP-MS) due to its millisecond detection, non-disturbance, precision and wide applicability range.49 In addition, it can be easily connected (online) to the outlet of flow reactors, allowing quick characterisation of colloidal nanoparticles. However, despite its wide application, UV-vis spectroscopy does not provide a direct measurement of particle size distribution and shape. A simple peak position correlation to the particle size is not reliable as it does not account/report: i) peak shape, ii) peak shift due to changes in the chemical environment, iii) presence of bimodal distributions, and iv) non-sphericity. To provide this information, in this work we have developed a mathematical algorithm based on the Maxwell's equations. Mie theory can accurately predict light scattering and absorption cross-sections for monodisperse spherical particles from a few nanometers up to several thousands of micrometers.47,50,51 This novel approach enables a fast (i.e. millisecond) inspection of particle size, distribution and quality for spherical nanoparticles. This algorithm can be used as a screening tool but it has the potential to be used as exploration tool.The algorithm is depicted in Fig. 2 and it consists of three parts. The first part corrects the Mie theory optical extinction (e.g. size of the particles) by adjusting the dielectric function assuming a mono-size distribution. The second part defines an objective function to account for particle size distribution. The third part establishes a protocol to assure that the optical size-dependent response follows the experimental standards (correlation of UV-vis spectra and TEM microscopy obtained during calibration). Similar approaches for the first and second parts have been previously used with success for gold and silver from ∼5 to ∼10 nm.47,52 The third part is a novel approach to account for the overall complexity of the colloidal system and the lack of reliable dielectric models,53 mainly due to changes in the chemical environment by the presence of a multitude of species (e.g. citrate and NaBH4) and uncertainties on the complex metal-dielectric function. This algorithm is made openly available to the community in the University of Cambridge open data repository. The key input parameters considered in the algorithm are: 1) spectral wavelengths analysed from 390 to 600 nm with 1 nm resolution, 2) particle size evaluation (radius) from 2 to 80 nm with 0.26 nm resolution, 3) Johnson and Christy dielectric function,54 4) Daimon and Masumura water refraction index wavelength dependency.55 A constrained local minimization approach based on the simplex search method by Lagarias et al.56 was adopted to speed up the algorithm performance, taking about 36 seconds on an i5-350U 1.70GHz computer.
Part I – estimation of optical extinction based on mono-size spherical dispersion
The first part of the algorithm is set to correct the Mie theory spectral response by fitting a size-dependent polynomial function, A(r). This function acts on the complex metal-dielectric function (free electrons, intraband transition) by adding a size-dependent contribution, giving a more representative signature of the extinction response by Mie theory (σext or Qext).50,53 As it is a fitted empirical function, it can account for some uncertainties on the complex dielectric constants (εRe and εIm), and other factors affecting the surface plasmon resonance (SPR) (position and width), such as chemical interface dumping (CID) promoted by molecules bonded to the metal surface. This adjustment is key when covering a large set of particle size ranges, from a radius of 5 to 100 nm. If a short range of particle sizes are evaluated, the calibration of A(r) is straightforward, and a simple regression between the particle size obtained by Mie and TEM is adequate.19,47 By extending the Mie theory to a broad range of particle sizes, the calibration strategy changes to account for all the size intrinsic effects. Here A(r) is determined assuming that the commercial samples are monosized. For this, the Mie theory model is used based on the multipole expansion of the electric and magnetic fields of the nanoparticle suspension. The cross-section extinction response (σext = Qext πr2 [m2]) for a spherical particle with r radius depends on the metal-dielectric function and the surrounding dielectric environment (i.e., chemical environment), and it can be expressed as: | (1) |
| ε(λ, r) = εRe(λ) + εIm(λ)i + Δε(λ, r) | (2) |
 | (3) |
| Γ(r) = Γ∞ + A(r)vF/r | (4) |
The experimental data [ln(I0/I)λ] is fitted by the cross-section extinction response from the Mie theory [σext(λ, r, ε)] through an objective function. On its classical and simplest form, the least-square method can be defined for a monodisperse spherical sample as:
 | (5) |
Part II – definition of an objective function to account for particle size distribution
The objective function fobj,1 does not account for particle size distribution (PSD) and resonance shifts by changes in the chemical environment. To account these, the following equations were derived (refer to the ESI† for more details). | (6) |
 | (7) |
| λshift = λmax(I/I0) − λmax(Calculated) | (8) |
Part III – determination of the particle size by correction of optical responses
Spectral responses (frequency and size dependency) for metal colloids are strongly dependent on the chemical environments (e.g. presence of a multitude of species such as citrate and NaBH4) and the uncertainties on the complex metal-dielectric function. Typical dielectric corrections account for the contribution of the free (e.g. Drude–Sommerfeld) and bound electrons.50,53The ideal way of determining A(r) is by directly solving the fobj,2 with a set of commercial standards, using their PSD (mean and standard deviation) as an input. Unfortunately, this methodology is computationally intense and thus, a trade-off between computational time and accuracy was selected, and A(r) was calculated in part I assuming the standards were mono-size particles. Since the correct dielectric function does represent the whole particle size distribution (PSD), a linear regression between the calculated and the real PSD (TEM-based) is created [rcal = g(rTEM)]. The result obtained is used to correct the final Mie theory response, in a form of σext(λ, g(r), ε) to finally calculate the actual particle size and distribution.
Validation of the Mie theory-based algorithm – optical size distribution evaluation
To validate the Mie theory-based algorithm, the UV-vis spectra of a range of commercial standards were used to estimate their particle size and distribution. The results were compared to the actual values determined by TEM microscopy as shown in Table 1. The calculated radius and PSD present a relative deviation of 6.9% and 50.4%, respectively. While the calculated particle sizes are accurate and reliable, the PSD is underestimated, due to the trade-off between computational time and accuracy in the calibration process and/or the choice of the optimization method (local minimum to reduce running time). This high deviation on the particle size distribution is due to a mathematical inverse problem, which is stated as an ill-posed problem (Fredholm integral equation of first kind). This means that a system does not have a unique solution, but a multitude of solutions. Narrow the number of solutions can be achieved by a regularization parameter. Herein, we used a classical Tikhonov methodology coupled with a local minimum optimization algorithm. However, one should notice that the commercial standards normally present very narrow size distributions (<15–20%), where small deviations in the estimated PSD (i.e. 1.0 nm instead to 0.8 nm) lead to large deviations (i.e. 22.5%).| Sample supplier | TEM | Calculated using algorithm | Deviations | |||
|---|---|---|---|---|---|---|
| Average radius (nm) | Radius std (nm) | Average radius (nm) | Radius std (nm) | Average radius relative deviation (%) | Radius std relative deviation (%) | |
| Sample (A) was synthesised according to literature.46 (B) are samples from Nanocomposix and (C) from BBi. | ||||||
| A | 4.1 | 0.8 | 4.9 | 1.0 | 19.5 | 22.5 |
| B | 5.0 | 1.0 | 5.0 | 1.2 | 1.1 | 21.7 |
| C | 11.0 | 2.5 | 12.7 | 1.0 | 15.3 | 59.2 |
| B | 14.5 | 1.5 | 13.5 | 0.9 | 7.2 | 36.9 |
| B | 20.5 | 1.5 | 21.5 | 1.0 | 5.0 | 31.4 |
| C | 27.3 | 3.4 | 24.8 | 1.3 | 9.3 | 61.1 |
| B | 36.5 | 4.0 | 35.9 | 1.4 | 1.5 | 66.0 |
| C | 37.9 | 5.6 | 40.5 | 1.4 | 6.6 | 75.1 |
| B | 39.5 | 3.5 | 38.4 | 1.3 | 2.9 | 62.9 |
| B | 47.5 | 4.5 | 47.9 | 1.5 | 0.7 | 67.2 |
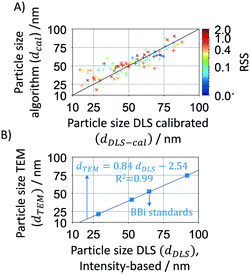
The mathematical algorithm was further validated using a large set of samples (>100) synthesised in flow reactors during this study. The samples were analysed by DLS (intensity-based) after dilution and without any further purification and/or separation. As the DLS usually overestimates the particle size, its value was corrected using a TEM-DLS correlation of commercial standards from BBi (see Fig. 3A where dDLS is shown as a function of dTEM). Calibrated DLS particle sizes show a good agreement with the Mie theory calculated particle sizes as shown in Fig. 3B. It is worth noting that DLS has a considerably higher relative deviation (∼18.7%) compared to the Mie theory calculated size deviation of 6.9% (Table 1).
Optical nanoparticle shape evaluation – spherical degree
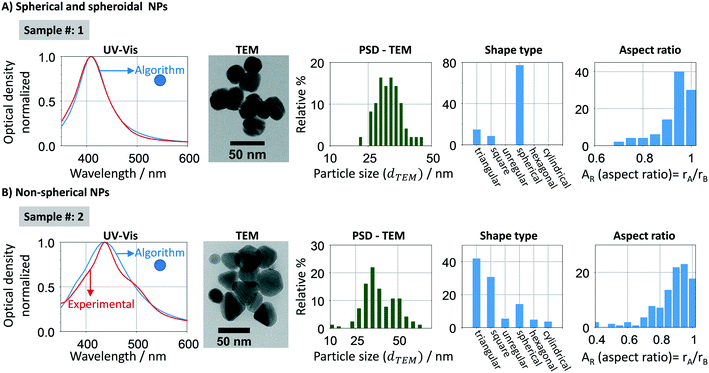
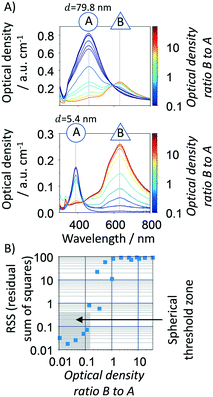
Mie theory cannot predict the optical response of non-spherical particles, such as spheroids, cylinders, rods, prisms and disks. Fig. 4 (and S1†) shows a characteristic UV-vis spectra, size distribution, shape and aspect ratio sample [(AR) defined as the ratio between the shortest (rA) and the highest radius (rB)] of spherical and non-spherical nanoparticles respectively. In the spherical samples (Fig. 4A), there is a good agreement between experimental and calculated (using the developed algorithm) spectral signatures (width and resonance position). However, when analysing a sample with a majority of non-spherical particles (Fig. 4B), there is a clear difference between both spectral signatures. In this case, the experimental absorption spectrum is non-Gaussian, being composed by at least two absorption bands, blue- and red-shifted. Other methodologies/tools can be used to account for non-spherical shapes using finite element approaches, such as discrete dipole approximation (DDA) and boundary element method (BEM). In this work, we use this property of the Mie theory to add shape evaluation capabilities to Mie theory through our new methodology. In this context, spherical particles are stated as a group of quasi-spherical particles with the underlying symmetries of face centre cubic (fcc) lattice.In this sense, several statistical parameters were considered to evaluate the “spherical degree” of the silver nanoparticles by comparing the experimental spectra of five citrate-based synthesized samples with spherical and non-spherical particles against the spherical standards, including RSS (residual sum of squares) (eqn (6)), the objective function in the algorithm (eqn (7)), FWHM of the UV-vis spectra (full width at half maximum), skewnessExp./skewnessMie and kurtosisExp./kurtosisMie (refer to ESI† for further details). We found that the RSS is the most suitable parameter as “spherical degree” (refer to Fig. S2†) because it better delimits the region between a sample with spherical and non-spherical particles. To define the RSS threshold region, individual samples with spherical (5.4 and 79.8 nm, ∼yellow/red colloidal) and non-spherical (majority of triangular prisms, blue colloidal) particles were mixed at different optical density ratios, Fig. 5A. There is a clear difference between the spectral shape and peak location for spheres and triangular prisms NPs. Silver spherical NPs show a blue-shift quasi-Gaussian peak (∼389 to 460 nm−1), however triangular prisms NPs show a red-shift non-Gaussian peak (∼630 nm−1). Using different spherical/non-spherical mixtures, a RSS threshold to ≤0.4 (grey zone in Fig. 5B) is determined which represents a spherical to triangular optical ratios up to 0.15. In order words, a blue-shifted spectrum with 1 a.u. cm−1 can have up to 0.15 a.u. cm−1 of non-spherical particles. If a higher spherical content is required, the value of RSS threshold can be decreased. In summary, a spherical degree is determined for the accurate use of the Mie theory-based algorithm where particles with a RSS ≤0.4 are considered spherical/spheroidal. This zone depends on the algorithm properties, such as spectral resolution, wavelength range, particle size range analysed, etc. and thus, it should be reconsidered if different equipment or experimental protocol is used.
IV. Synthesis of silver nanoparticles with tuneable sizes
Silver nanoparticles with tuneable sizes between 10 and 80 nm were synthesised using a series of microfluidic reactors connected in series as shown in Fig. 1 where the outlet nanoparticles where optically characterised to evaluate the size, size distribution and shape using the developed Mie-theory algorithm. It is important highlight that based on its principle, the algorithm is also able to detect any phenomena affecting the spectral response of the particles, not only growth but also aggregation or dissolution. Microreaction technology enables precise control over the hydrodynamics in the system as we have recently demonstrated by the use of inverted flow helical reactors to promote the formation of Dean vortexes under laminar regime. The presence of Dean vortexes improves the radial mixing and narrow residence time distribution, both leading to narrow particle size distribution and minimum agglomeration even in the absence of steric capping ligands.19 Electronic stabilisation by citrate anions is used to avoid the agglomeration of the particles. However, such stabilisation does not limit particle growth by steric effects. To control growth nanoparticles, an optimised reactor configuration with Re ≈ 23 and De ≈ 6 (at the end of last reactor) was used.To achieve narrow size distributions, careful control of the nucleation and growth stages is essential which can be exceptionally achieved by rapid changes in the chemical environment of the different reactors connected in series.59 In this case, a seed-mediated growth method was used for the synthesis of the silver particles where nucleation takes place in the first reactor (seed stage, R0, Fig. 1) followed by controlled growth in reactors (growth stage, R1 to R5, Fig. 1), depending on the desired size of the particles. The resulting nanoparticles were optically characterised online to evaluate the size, size distribution and shape using the developed Mie-theory algorithm.
The nucleation step is carried out using a strong reducing agent (NaBH4) to trigger rapid nucleation which leads to small particles (∼5 nm) and narrow particle size distribution (<20%). A relatively long residence time (∼8 min) is used to ensure full conversion of the silver ions as well as full degradation of the NaBH4.19 Both conditions are essential to avoid secondary nucleation in the consecutive growth reactors. Particle agglomeration is kept at a minimum by the presence of citrate (20 μM) to electrostatically stabilise the particles. Once that the seeds are formed, controllable growth takes place in reactors R1 to R5 (Fig. 1) by adding silver ions at the entrance of each growth reactor. A mild reducing agent (citrate) is also added to promote the autocatalytic reduction of silver ions and limit secondary nucleation to a minimum.35,60,61 The sequential addition of silver precursor and reducing agent enables a controllable and slow growth in a reliable and versatile way. Similarly to the seed-stage, a relatively long residence time (∼8 min) is used to ensure full conversion of the silver ions in each of the growth reactors.
Effect of Ag seed-to-growth solution ratio
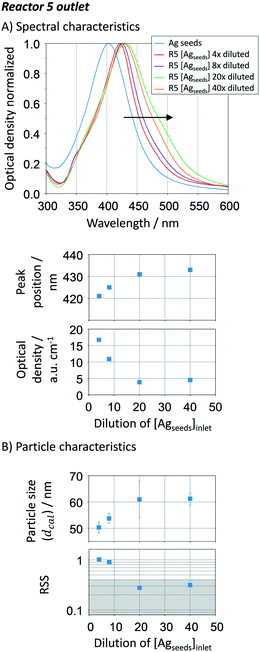
Seed-mediated growth relies on the autocatalytic reduction of metal salts in the metal nanocrystal surface.46 The activation energy barrier is much lower in this process when comparing to spontaneous nucleation.62 Defining the seed concentration is key to control growth and consequently the resulting size. Depending on the seed concentration, two different growth mechanisms (diffusion- or kinetic-controlled) can dominate this stage,63 the former believed to lead to relatively narrow size distribution.61To optimise the initial seed to silver precursor concentration added in the growth-stage (Fig. 1), a seed concentration of ∼2 × 10¹⁰ particles per mL with an estimated size of 34 ± 7 nm and RSS of 0.16 was systematically varied after the seed reactor (R0) by dilution. The dilution degree was defined as in the volumetric form. In the growth stage (R1 to R5), the sequential additions contained a AgNO3/citrate ratio of 3 mM/14 mM.
Increasing the Ag seed dilution from 4 to 40 (i.e. decreasing the Ag seed concentration) leads to a red-shift of the UV-vis spectra of the resulting silver NPs after reactor R5, at the same time that the optical density decreases (Fig. 6A). The plasmon resonance shift (421 nm to 433 nm) is characteristic of a gradual increase in particle size, which is confirmed by the Mie theory-based algorithm (Fig. 6B), ∼50 to ∼60 nm. To increase particle size beyond 60 nm, a considerably higher amount of silver precursor in the growth stage is needed. Peak location and optical density indicate that when increasing the seed dilution, a lower number of particles with higher particle sizes are being formed. This is an expected result as the total number of seeds decreases, leading to a subsequent decrease of the solid surface area. The slowdown is beneficial towards particle growth as it adds more control over the kinetics, being closer to a diffusion-controlled regime. The particle size distribution, represented by the error bars in Fig. 6B, does not seem to be affected by the Ag seed-to-growth solution ratio within the studied range. On the other hand, the RSS value decreases as the dilution factor increases, ranging from 1 to 0.31 (Fig. 6B), which suggests that the Ag seed concentration plays a crucial role not only on particle size but also on the shape. To guaranty spherical particles with a narrow size distribution, an optimum Ag seed to Ag growth concentration of ∼5 × 10⁸ NP mL−1 (in this particular case requiring a dilution factor of 40) is determined which corresponds to ∼1.8 × 10⁻⁶ m2 Ag per mL.
Effect of number of growth reactors
In order to synthesise monodispersed particles and control the growth stage, the effect of the number of reactors was evaluated. Keeping the metal ions concentration during the growth stage63,64 below the critical supersaturation and far above the solubility level is of the utmost importance to limit secondary nucleation and thermodynamically driven size focusing, respectively, which are responsible for particle polydispersity.61,65 In other words, it is possible to growth particles in a kinetic regime (surface reduction). In batch synthesis, these optimal conditions are achieved by a dropwise addition or stepwise method which potentially leads to concentration profiles across the reactors. In our study, we overcome this issue by distributing the feed at the inlet of several growth reactors (R1 to R5). To control a size focus growth rate, it is necessary to have a fine balance between the number, concentration and flow rate of the additions of silver ions and reducing agent.A single addition (i.e. no further additions in the growth reactors) shows that particles only grow in R1 (up to 34 nm) and its size, size distribution and optical density (∼1.4 a.u. cm−1) does not change by increasing the residence time (e.g. increasing number of reactors from R1 to R5 without additional additions, Fig. 7B red symbols). Only after R3 (∼24 min), the intra-particle thermodynamically driven size focusing starts to slightly impact the particle size. Such size focusing phenomena can be easily reduced by adding Ag+ content at the entrance of R2. If the concentration of AgNO3 is increased in the single addition, the solution stability is compromised due to the precipitation of silver oxide, leading to uncontrollable growth as well as secondary nucleation according. When performing continuous additions (R1 to R5), the absorption spectra show a clear shift towards higher wavelengths, Fig. 7A. This spectra behaviour is characteristic from a gradual increase in the particle size, which is confirmed by our Mie theory-based algorithm (Fig. 7B), going from ∼28 nm to ∼50 nm. For all the results analysed, a high spherical degree is observed (RSS ≤ 0.4). A closer look to the particle size distributions reveals that the particle cubic radius increases linearly as a function of residence time [![[r with combining macron]](https://www.rsc.org/images/entities/i_char_0072_0304.gif) 3 −
3 − ![[r with combining macron]](https://www.rsc.org/images/entities/i_char_0072_0304.gif) 03 = Kτ, where K is the volumetric growth rate (nm3 min−1),
03 = Kτ, where K is the volumetric growth rate (nm3 min−1), ![[r with combining macron]](https://www.rsc.org/images/entities/i_char_0072_0304.gif) 0 is the initial average particle radius, and τ is the residence time as
0 is the initial average particle radius, and τ is the residence time as  ]. The linear regression between changes in size and residence time is characteristic of diffusion-controlled growth.66 This key observation indicates high control over the particle growth with a single growth rate across all the reactors (R1 to R5), K = 427.68 ± 11.34 nm3 min−1. The quality of the linear regression is unexpectedly high, which excludes particle growth governed by stochastic collisions and the presence of secondary nucleation. The particle growth seems to be mostly governed by size focus, where the ion reduction happens at the surface of the silver precipitates (in a kinetic regime). Nevertheless, since this is a continuous process, thermodynamically driven size focusing may be present as the ion concentration decreases inside each growth reactor. To suppress it, an infinite number of reactors/additions are necessary (e.g. mimicking the dropwise methodology).
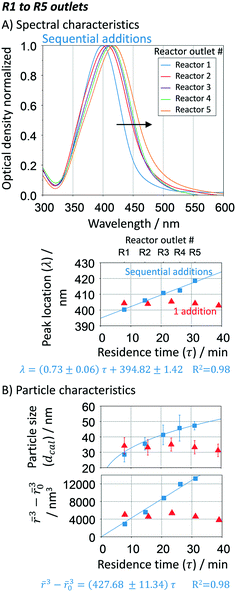 | ||
| Fig. 7 Effect of the number of growth reactors. A. UV-vis spectra and peak location at the outlet of each reactor; B. particle size distribution (average and standard deviation) calculated using Mie theory-based algorithm and regression of the particle cubic radius as a function of the residence time. Conditions: nucleation reactor → 90 °C, 3 μM NaBH4, 20 μM Na3C6H5O7 and 1 μM AgNO3, total flow rate: 125 μL min−1, residence time: 10.9 min. Growth reactors → refer to Fig. 6. Single addition → only 1 addition of AgNO3/citrate (3 mM/14 mM) at R1 instead of 5. | ||
These results demonstrate that continuous synthesis in microfluidics coupled with the sequential addition of precursors can provide exquisite control over the growth of spherical nanoparticles due to their low diffusion time. This unique approach enables a particle growth up to ∼50 nm with just 5 reactors (34 min residence time) without user intervention. However, it is important to note that the growth rate is highly sensitive to external factors such as degradation of the stock solutions, solution preparation, pH variations, fouling in the reactor, flow fluctuations, etc.
Effect of pH in the growth reactors
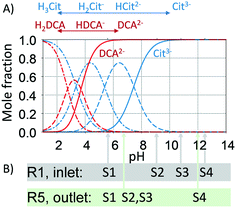
The pH is known to impact the growth of the silver seeds67,68 as it affects not only the Ag+ reduction rate but also the speciation of citrate69 and silver species. In addition, the presence of different citrate (Cit) and dicarboxylic acid (DCA) species formed as a by-product of the decarboxylation of citrate during the silver reduction:| Cit3− ⇌ H+ + 2e− + DCA2− + CO2 |
To study the pH effect on continuous particle growth, a feed of NaOH was added at the entrance of the first growth reactor, R1 (Fig. 1) to vary the initial pH (pHIN at the inlet of R1) from 5.6 to 12.5 (sample S1 to S4). Further acidic conditions (pH < 5) were not tested as they would lead to the dissolution of silver nanoparticles. The rest of the growth conditions were kept constant with 25 μL min−1 sequential additions of AgNO3 to citrate ratio of 3 mM/14 mM in each growth reactor. It is important to note that the seed reactor is kept at pH ∼ 7, since speciation is not relevant when NaBH4 is used as a reducing agent.
Fig. 8A shows the optical response at the outlet of R5 as a function of the inlet pH (pHIN). As the pHIN decreases, the absorbance peak becomes broader, non-Gaussian, its location shifts towards lower wavelengths and the optical density greatly decreases. Variations in optical density confirm changes in the Ag+ reduction rate. Regarding the other peak characteristics, the Mie theory-based algorithm suggests that these variations have a small impact on the average particle size, ranging from ∼40 to ∼50 nm (Fig. 8B). However, higher standard deviations and RSS (above the threshold of 0.4) are obtained in all cases except when pHIN is ∼12, indicating the formation of non-spherical particles. Although the reduction rate is slower when pHIN < 12 (confirmed by lower optical density), it cannot explain (by itself) the broader size distributions and the differences in RSS values. There are two plausible explanations for this behaviour. The first one is linked to the presence of secondary nucleation due to the accumulation of silver ions between reactors, which might lead to hyper saturation. However, secondary nucleation by itself cannot explain the presence of much broader absorption peaks (at the calculated sizes) when compared to pH ∼ 12.5. This is because it will lead to low growth and lower particle sizes. Thermodynamically driven size focusing is not likely to be present since the ion concentration is at the vicinity of the supersaturation critical level,65 where it can be neglected. The second explanation is related to the speciation of citrate and dicarboxylic acid (DCA),70 detailed in Fig. 9.
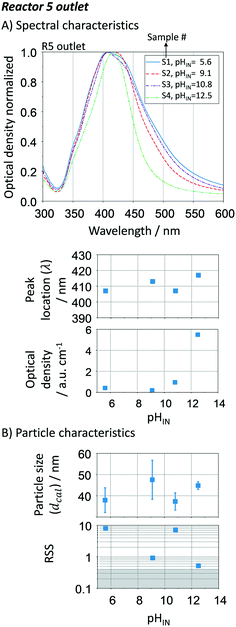 | ||
| Fig. 8 Effect of initial pH (pHIN) in the growth-stage. A. UV-vis spectra, spectral peak location and optical density at the outlet of R5; B. particle size distribution (average and standard deviation) and spherical degree (RSS). Conditions: nucleation reactor → refer to Fig. 7. 5 growth reactors → same as Fig. 6 and 7 except for changes in the pHIN. | ||
In the pHIN ranging from 5.6 to 10.8, the dicarboxylic acid is completely hydrolysed to DCA2− while a mixture of H2Cit− and HCit2− are present. For pHIN ∼ 12, the resulting nanoparticles have a considerably narrower absorption peak (almost Gaussian) due to the presence of completely hydrolysed DCA2− and Cit3− species. These results demonstrate that the presence of H2Cit− and/or HCit2− seems to play a role in the non-spherical shape of the resulting silver nanoparticles, likely by selectively binding to the silver nanoparticles leading to anisotropic growth.43,71 Besides, Cit3− species present at pH > 10.8 (i.e. S4) has a considerably higher reducing potential, leading to a faster reduction of the silver ions during the growth-stage, translated in a narrow size distribution due to homogeneous growth. It is important to note that small changes in the initial pH (even below 0.1) can lead to big changes in the speciation of the citrate species. During the continuous synthesis these species can have detrimental effects on the reproducibility of the synthesis if not carefully controlled.
The optimum pH value > 10.8 in the growth-stage is not in agreement with previously reported studies in batch with dropwise/stepwise addition of NaOH, where an optimum pH value is between 7.7 and 10.5 was determined.40,72 It is important to note that our approach at high pH produces large spherical particles with (RSS close to 0.4), high particle concentration (high optical density) and low residence time (∼34 min). The differences can potentially be related to inefficient mixing in batch reactors which can lead to localised pH and concentration gradients. This gets worse when the ion reduction rate increases as the mixing time remains high. In contrast, the present microfluidic device enables unique control over the fluid mechanics and mass transfer. This is due to its inherent laminar flow regime, presence of Dean vortexes,19,73 low mixing time,30 and high mass transfer.73 The mixing time is  ∼3 ms, where x is the channel width and D the diffusion coefficient, which for AgNO3 in water is 1.54 cm2 s−1.74
Effect of citrate/AgNO3 ratio in the additions in the growth-stage
The citrate/AgNO3 concentration ratio in the sequential additions (inlet, R1 to R5) has a strong effect on the final size, distribution and shape of the resulting silver nanoparticles. Its impact was evaluated by varying the citrate/AgNO3 ratio between 3.5/14 mM and 0.1/4 mM, respectively, while keeping constant the remaining conditions. Fig. 10A shows the spectral response of the nanoparticles at the outlet of R5. Increasing the citrate to AgNO3 ratio leads to a decrease in the absorption peak wavelength, which is translated into an expected decrease in particle size (Fig. 10B). Interestingly, there is a clear trend between growth and reducing-to-precursor concentration. If citrate to AgNO3 ratio is above ∼40, size focusing is expected to dominate particle growth as the Ag+ concentration is far from the vicinity of the supersaturation concentration (here set as 0.1 mM of AgNO3). The growth is minimum leading to small particle sizes, large size distributions (represented by the error bars in Fig. 10B), and large RSS values. The RSS confirms that such uncontrollable system is accompanied by the formation of non-spherical particles. Anisotropic structures are known to be formed when the citrate concentration is high.72 On the other end, when the citrate to AgNO3 ratio is below 0.8, it is expected to have the formation of large lumps by the coalescence of destabilized particles due to the poor electrostatic stabilisation under these conditions. Therefore, this range was not tested. Within these two limits, changing the citrate to AgNO3 ratio between 0.8 and 40, provides a smart approach to tune up the particle size from 40 to 80 nm with narrow size distributions and high spherical degree. As previously discussed, keeping the Ag+ concentration within a certain range by sequential additions, focusing growth mechanism dominates over size focusing, even if the Ag+ concentration decreases along the reactor. For smaller particle sizes, one should decrease the number of growth reactors as shown above (i.e. collect the resulting nanoparticles in R1 instead of R5).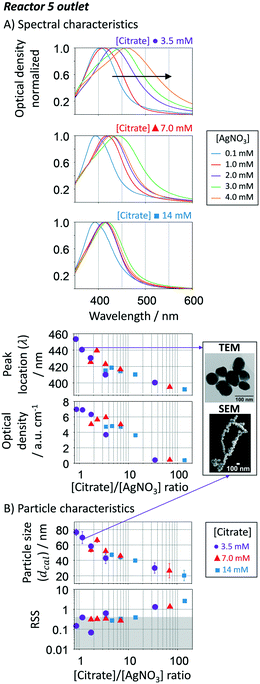 | ||
| Fig. 10 Effect of the [citrate]/[AgNO3] ratio of the sequential additions in the growth-stage. A. UV-vis spectra, peak location and optical density of particles in R5. B. Calculated average particle size and spherical degree (RSS) using the Mie theory-based algorithm. For smaller particle sizes, the number of growth reactors should be reduced. Conditions: nucleation reactor → refer to Fig. 7. 5 growth reactors → same as Fig. 6 and 7 except for changes in the citrate/AgNO3 ratio. | ||
V. Conclusions
In this work, we demonstrate the continuous synthesis of silver nanoparticles with tuneable sizes between 5 and 80 nm (biggest range demonstrated to date), narrow size distribution and high spherical degree. This flexible manufacturing technology allows not only the separation of nucleation and growth, but also an exquisite growth control by maintaining the concentration range in a number of reactors connected in series. Online size and shape evaluation facilitates systematic parametric studies through the development of a mathematical algorithm based on the Mie model solution of the Maxwell's equations. In this way, we demonstrate that size tunability can be easily achieved by changing the number of reactors and the citrate to silver precursor ratio added in the growth-stage, between 0.8 and 40. To ensure spherical shapes and narrow size distribution, the Ag seed to Ag growth surface area should be ∼1.8 × 10⁻⁶ m2 Ag per mL and the growth should take place at pH levels above 10.8. This approach provides a unique control and understanding of particle growth in continuous, mostly thanks to the online optical evaluation of size and shape, which can apply to the synthesis of other metal nanoparticles.Abbreviation list
| A(r) | Empirical polynomial function to adjust the metal-dielectric function |
| a L* and bL* | Mie coefficients in term of the spherical Riccati–Bessel functions |
| c | Speed of light |
| C p | Total number of particles per volume of solution |
| CSTR | Continuous stirred tank reactor |
| d | Particle size expressed in diameter |
| De | Dean dimensionless number |
| DLS | Dynamic light scattering |
| e | Electronvolt to Joules conversion |
| g(r) | Polynomial function to fit calculated and TEM particle radius |
| ħ | Reduced Planck's constant |
| ICP-MS | Inductively coupled plasma mass spectrometry |
| (I0/I)λ | Experimental extinction response of monochromatic light at wavelength |
| k | Wave vector |
| K | Growth rate |
| L | Optical length |
| L* | Multipolar order |
| N p | Total number of particles |
| Optical density | Spectral absorbance divided by the optical length (L) |
| PSD | Particle size distribution |
| Q | Volumetric flow rate |
| Q ext | Extinction efficiency |
| r | Particle radius |
| R# | Reactor number # |
| Re | Reynolds dimensionless number |
| RSS | Residual sum of squares, here also defined as spherical quality degree |
| SEM | Scanning electron microscope |
| SPR | Surface plasmon resonance |
| TEM | Transmission electron microscopy |
| V | Reactor volume |
| v F | Fermi velocity |
| Γ ∞ | Bulk metal value frequency |
| Γ(r) | Size dependent relaxation frequency |
| ε m | Real refraction index of the surrounding medium |
| ε Re and εIm | Metal-dielectric constants (real and imaginary) |
| λ | Evaluated wavelength |
| λ shift | Peak location difference between the experimental and calculated data |
| τ | Residence time |
| ω | Bulk angular frequency |
| ω p | Resonance frequency |
Conflicts of interest
There are no conflicts to declare.Acknowledgements
The authors greatly acknowledge the financial support from UK Engineering and Physical Science and Research Council (grant number EP/L020443/2).References
- S. Prabhu and E. K. Poulose, Int. Nano Lett., 2012, 2, 32 CrossRef.
- J. S. Kim, E. Kuk, K. N. Yu, J.-H. Kim, S. J. Park, H. J. Lee, S. H. Kim, Y. K. Park, Y. H. Park, C.-Y. Hwang, Y.-K. Kim, Y.-S. Lee, D. H. Jeong and M.-H. Cho, Nanomed.: Nanotechnol., Biol. Med., 2007, 3, 95–101 CrossRef CAS PubMed.
- T. Neuberger, B. Schöpf, H. Hofmann, M. Hofmann and B. von Rechenberg, J. Magn. Magn. Mater., 2005, 293, 483–496 CrossRef CAS.
- L. Zhang, F. Gu, J. Chan, A. Wang, R. Langer and O. Farokhzad, Clin. Pharmacol. Ther., 2008, 83, 761–769 CrossRef CAS PubMed.
- D. V. Talapin and E. V. Shevchenko, Chem. Rev., 2016, 116, 10343–10345 CrossRef CAS PubMed.
- R. Prasad, A. Bhattacharyya and Q. D. Nguyen, Front. Microbiol., 2017, 8, 1014 CrossRef PubMed.
- O. V. Salata, J. Nanobiotechnol., 2004, 2, 3 CrossRef PubMed.
- D. M. Kendziora, I. Ahmed and L. Fruk, RSC Adv., 2014, 4, 17980–17985 RSC.
- W.-T. Liu, J. Biosci. Bioeng., 2006, 102, 1–7 CrossRef CAS PubMed.
- A. Moisala, A. G. Nasibulin and E. I. Kauppinen, J. Phys.: Condens. Matter, 2003, 15, S3011–S3035 CrossRef CAS.
- K. An and G. A. Somorjai, ChemCatChem, 2012, 4, 1512–1524 CrossRef CAS.
- C. Dong, C. Lian, S. Hu, Z. Deng, J. Gong, M. Li, H. Liu, M. Xing and J. Zhang, Nat. Commun., 2018, 9, 1252 CrossRef PubMed.
- A. Zaleska-Medynska, M. Marchelek, M. Diak and E. Grabowska, Adv. Colloid Interface Sci., 2016, 229, 80–107 CrossRef CAS PubMed.
- X. Wang, Y. Zhu, A. Vasileff, Y. Jiao, S. Chen, L. Song, B. Zheng, Y. Zheng and S.-Z. Qiao, ACS Energy Lett., 2018, 3, 1198–1204 CrossRef CAS.
- G. Sharma, A. Kumar, S. Sharma, M. Naushad, R. Prakash Dwivedi, Z. A. Alothman and G. T. Mola, J. King Saud Univ., Sci., 2019, 31, 257–269 CrossRef.
- I. J. Bruce and T. Sen, Langmuir, 2005, 21, 7029–7035 CrossRef CAS PubMed.
- A. K. Gupta and M. Gupta, Biomaterials, 2005, 26, 3995–4021 CrossRef CAS PubMed.
- X. S. Shen, G. Z. Wang, X. Hong and W. Zhu, Phys. Chem. Chem. Phys., 2009, 11, 7450–7454 RSC.
- K.-J. Wu, G. M. De Varine Bohan and L. Torrente-Murciano, React. Chem. Eng., 2017, 2, 116–128 RSC.
- P. K. Jain, X. Huang, I. H. El-Sayed and M. A. El-Sayed, Plasmonics, 2007, 2, 107–118 CrossRef CAS.
- S. Chen, R. Yuan, Y. Chai and F. Hu, Microchim. Acta, 2013, 180, 15–32 CrossRef CAS.
- S. Chandran, V. Ravichandran, S. Chandran, J. Chemmanda and B. Chandarshekar, J. Appl. Res. Technol., 2016, 14, 319–324 CrossRef.
- M. Chastellain, A. Petri and H. Hofmann, J. Colloid Interface Sci., 2004, 278, 353–360 CrossRef CAS PubMed.
- M. Grzelczak, J. Pérez-Juste, P. Mulvaney and L. M. Liz-Marzán, Chem. Soc. Rev., 2008, 37, 1783–1791 RSC.
- N. R. Jana, L. Gearheart and C. J. Murphy, Adv. Mater., 2001, 13, 1389–1393 CrossRef CAS.
- S. Panigrahi, S. Kundu, S. Ghosh, S. Nath and T. Pal, J. Nanopart. Res., 2004, 6, 411–414 CrossRef CAS.
- S. Iravani, Green Chem., 2011, 13, 2638–2650 RSC.
- E. Shahbazali, V. Hessel, T. Noël and Q. Wang, Nanotechnol. Rev., 2014, 3, 65 CAS.
- V. Sebastian Cabeza, S. Kuhn, A. A. Kulkarni and K. F. Jensen, Langmuir, 2012, 28, 7007–7013 CrossRef CAS PubMed.
- S. Marre, Y. Roig and C. Aymonier, J. Supercrit. Fluids, 2012, 66, 251–264 CrossRef CAS.
- M. S. Bakshi, Cryst. Growth Des., 2016, 16, 1104–1133 CrossRef CAS.
- D. Li, C. Wang, D. Tripkovic, S. Sun, N. M. Markovic and V. R. Stamenkovic, ACS Catal., 2012, 2, 1358–1362 CrossRef CAS.
- J. Xiao and L. Qi, Nanoscale, 2011, 3, 1383–1396 RSC.
- J. Boleininger, A. Kurz, V. Reuss and C. Sönnichsen, Phys. Chem. Chem. Phys., 2006, 8, 3824–3827 RSC.
- N. G. Bastús, F. Merkoçi, J. Piella and V. Puntes, Chem. Mater., 2014, 26, 2836–2846 CrossRef.
- Y. Yu, Q. Zhang, X. Lu and J. Y. Lee, J. Phys. Chem. C, 2010, 114, 11119–11126 CrossRef CAS.
- D. Cambié, C. Bottecchia, N. J. W. Straathof, V. Hessel and T. Noël, Chem. Rev., 2016, 116, 10276–10341 CrossRef PubMed.
- K. L. Kelly, E. Coronado, L. L. Zhao and G. C. Schatz, J. Phys. Chem. B, 2003, 107, 668–677 CrossRef CAS.
- K. Schweikert, J. Bank. Financ., 2018, 88, 44–51 CrossRef.
- S. Agnihotri, S. Mukherji and S. Mukherji, RSC Adv., 2014, 4, 3974–3983 RSC.
- U. Aslam, S. Chavez and S. Linic, Nat. Nanotechnol., 2017, 12, 1000 CrossRef CAS PubMed.
- J. J. Baumberg, J. Aizpurua, M. H. Mikkelsen and D. R. Smith, Nat. Mater., 2019, 18, 668–678 CrossRef CAS PubMed.
- X. Dong, X. Ji, H. Wu, L. Zhao, J. Li and W. Yang, J. Phys. Chem. C, 2009, 113, 6573–6576 CrossRef CAS.
- K. Ranoszek-Soliwoda, E. Tomaszewska, E. Socha, P. Krzyczmonik, A. Ignaczak, P. Orlowski, M. Krzyzowska, G. Celichowski and J. Grobelny, J. Nanopart. Res., 2017, 19, 273 CrossRef PubMed.
- J. B. Deshpande and A. A. Kulkarni, Chem. Eng. Technol., 2018, 41, 157–167 CrossRef CAS.
- K.-J. Wu and L. Torrente-Murciano, React. Chem. Eng., 2018, 3, 267–276 RSC.
- V. Amendola and M. Meneghetti, J. Phys. Chem. C, 2009, 113, 4277–4285 CrossRef CAS.
- D. K. Bhui, H. Bar, P. Sarkar, G. P. Sahoo, S. P. De and A. Misra, J. Mol. Liq., 2009, 145, 33–37 CrossRef CAS.
- M. van Dijk, A. Tchebotareva, M. Orrit, M. Lippitz, S. Berciaud, D. Lasne, L. Cognet and B. Lounis, Phys. Chem. Chem. Phys., 2006, 8, 3486–3495 RSC.
- L. J. M. Herrera, D. M. Arboleda, D. C. Schinca and L. B. Scaffardi, J. Appl. Phys., 2014, 116, 233105 CrossRef.
- K. Kolwas and A. Derkachova, J. Quant. Spectrosc. Radiat. Transfer, 2013, 114, 45–55 CrossRef CAS.
- P. K. Jain, K. S. Lee, I. H. El-Sayed and M. A. El-Sayed, J. Phys. Chem. B, 2006, 110, 7238–7248 CrossRef CAS PubMed.
- A. Derkachova, K. Kolwas and I. Demchenko, Plasmonics, 2016, 11, 941–951 CrossRef CAS PubMed.
- P. B. Johnson and R. W. Christy, Phys. Rev. B: Solid State, 1972, 6, 4370–4379 CrossRef CAS.
- M. Daimon and A. Masumura, Appl. Opt., 2007, 46, 3811–3820 CrossRef PubMed.
- J. C. Lagarias, J. A. Reeds, M. H. Wright and P. E. Wright, SIAM J. Optim., 1998, 9, 112–147 CrossRef.
- E. Stefan Kooij and B. Poelsema, Phys. Chem. Chem. Phys., 2006, 8, 3349–3357 RSC.
- L. Wang, X. Sun and J. Xing, J. Mod. Opt., 2012, 59, 1829–1840 CrossRef.
- K. J. Wu, Y. H. Gao and L. Torrente-Murciano, Faraday Discuss., 2018, 208, 427–441 RSC.
- T. M. Rahman and V. E. Rebrov, Processes, 2014, 2, 466–493 CrossRef.
- R. Zong, X. Wang, S. Shi and Y. Zhu, Phys. Chem. Chem. Phys., 2014, 16, 4236–4241 RSC.
- X. C. Jiang, C. Y. Chen, W. M. Chen and A. B. Yu, Langmuir, 2010, 26, 4400–4408 CrossRef CAS PubMed.
- N. T. K. Thanh, N. Maclean and S. Mahiddine, Chem. Rev., 2014, 114, 7610–7630 CrossRef CAS PubMed.
- V. K. LaMer and R. H. Dinegar, J. Am. Chem. Soc., 1950, 72, 4847–4854 CrossRef CAS.
- E. C. Vreeland, J. Watt, G. B. Schober, B. G. Hance, M. J. Austin, A. D. Price, B. D. Fellows, T. C. Monson, N. S. Hudak, L. Maldonado-Camargo, A. C. Bohorquez, C. Rinaldi and D. L. Huber, Chem. Mater., 2015, 27, 6059–6066 CrossRef CAS.
- I. M. Lifshitz and V. V. Slyozov, J. Phys. Chem. Solids, 1961, 19, 35–50 CrossRef.
- M. Darroudi, M. B. Ahmad, A. H. Abdullah, N. A. Ibrahim and K. Shameli, Int. J. Mol. Sci., 2010, 11, 3898–3905 CrossRef CAS.
- M. K. Alqadi, O. A. Abo Noqtah, F. Y. Alzoubi, J. Alzouby and K. Aljarrah, Mater. Sci.-Pol., 2014, 32, 107–111 CrossRef CAS.
- J. Liu, C. Dai and Y. Hu, Environ. Res., 2018, 161, 49–60 CrossRef CAS PubMed.
- Y. Gao and L. Torrente-Murciano, Nanoscale, 2019 Search PubMed (under review).
- Z. Chen, J. W. Chang, C. Balasanthiran, S. T. Milner and R. M. Rioux, J. Am. Chem. Soc., 2019, 141, 4328–4337 CrossRef CAS PubMed.
- X. Dong, X. Ji, J. Jing, M. Li, J. Li and W. Yang, J. Phys. Chem. C, 2010, 114, 2070–2074 CrossRef CAS.
- J. H. Xu, J. Tan, S. W. Li and G. S. Luo, Chem. Eng. J., 2008, 141, 242–249 CrossRef CAS.
- Z. Koczorowski, J. Electroanal. Chem. Interfacial Electrochem., 1981, 125, 225–229 CrossRef CAS.
Footnote |
| † Electronic supplementary information (ESI) available. See DOI: 10.1039/c9re00452a |
| This journal is © The Royal Society of Chemistry 2020 |

