 Open Access Article
Optical absorption properties of metal–organic frameworks: solid state versus molecular perspective†
Maria
Fumanal
 *a,
Clémence
Corminboeuf
 a,
Berend
Smit
 b and
Ivano
Tavernelli
 c
c
aLaboratory for Computational Molecular Design, Institute of Chemical Sciences and Engineering, EPFL, CH-1015 Lausanne, Switzerland. E-mail: maria.fumanal@epfl.ch
bLaboratory of Molecular Simulation, Institut des Sciences et Ingénierie Chimiques, Valais, EPFL, Rue de l’Industrie 17, CH-1951, Sion, Switzerland
cIBM Research Zurich, Säumerstrasse 4, 8803 Rüschlikon, Switzerland
First published on 18th August 2020
Abstract
The vast chemical space of metal and ligand combinations in Transition Metal Complexes (TMCs) gives rise to a rich variety of electronic excited states with local and non-local character such as intra-ligand (IL), metal-centered (MC), metal-to-ligand (MLCT) or ligand-to-metal charge-transfer (LMCT) states. Those features are equally found in metal organic frameworks (MOFs), defined as modular materials built from metal-nodes connected through organic-ligands. Because of the electronic and structural complexity of MOFs, the computational description of their excited states is a formidable challenge for which two different approaches have been usually followed: the solid state and the molecular perspective. The first consists in analysing the frontier electronic bands and crystal orbitals of the electronic ground state (GS) in periodic boundary conditions, while the latter points to an accurate computation of the excited states in representative clusters at the molecular level. Herein, we apply both approaches to evaluate the optical absorption properties of three experimentally reported Ti(IV) mononuclear MOFs with in silico metal substitutions with Zn(II), Cd(II), Fe(II), Ru(II) and Zr(IV) ions, thus covering d10, d6 and d0 electronic configurations of 1st and 2nd row TMCs in MOFs. Our analysis captures the main electronic features attributed to these systems while we discuss the main advantages and drawbacks of both approximations.
Introduction
Transition metal complexes (TMCs) have great relevance in several optoelectronic applications due to their diverse photochemical and photophysical properties.1 These range from medical applications such as photodynamic therapy2 and biological imaging,3 to energy-related technologies such as dye-sensitized solar cells4 and photocatalysis.5 TMCs are especially attractive for optoelectronic applications because they can easily combine light absorption in the visible with efficient electron-transfer (ET) or charge-transfer (CT) processes.6 These characteristics make them ideal photosensitizers that can operate in different environments such as surfaces, solution, proteins or crystalline materials. In this context, Metal–Organic Frameworks (MOFs) encompass all the capabilities of TMCs embedded in a crystalline, flexible and usually porous structure.7 By definition, MOFs are modular materials consisting in metal nodes connected through organic ligands forming an, in principle, infinite metal–organic network. Because of their inherent chemical tunability, hundreds of thousands of MOFs have been reported as a result of combining different metals, ligands and topologies.8 Their intrinsic porosity makes them ideal for gas storage9 and heterogeneous catalysis,10 while recent interest has also emerged into developing their sensing11 and photocatalytic potential.12The photophysical and photochemical properties of TMCs and MOFs stem from the diverse electronic states that can emerge upon light excitation, from metal-centered (MC) and intra-ligand (IL) emissive states, to those states promoting long-lived CT, namely metal-to-ligand MLCT or ligand-to-metal LMCT states.13 Their ability to generate local or CT excited states will determine their potential for a particular application, which will ultimately depend on the different metal, ligand and structural components. In this context, the computational characterization of the optoelectronic properties of MOFs is crucial to understand and predict their behavior. Computing MOFs has all the challenges attributed to TMCs, with the additional complexity of addressing the periodic environment of a crystalline material. So far, two main strategies have been used to perform quantum-chemistry studies of MOFs. On the one hand, solid state computations under periodic boundary conditions can be performed with Density Functional Theory (DFT) by applying the Bloch's theorem to the Kohn–Sham (KS) equations.14 In this way, the electrons are expressed as a periodic function directly dependent on the lattice periodicity. Alternatively, electronic properties of solids can also be computed employing the many-body Green's function approach (GW). The key quantity in GW is the electronic self-energy, the analogous of the exchange potential in DFT. In conjunction with the Bethe–Salpeter equation, GW-BSE allows to account for excitonic electron–hole interaction effects and accurately evaluate excited states energies.15 These computations are impractical to study MOFs because of their inherent porosity and large unit cell volume, which would imply an extremely high computational cost. For that reason, qualitative predictions from the ground state (GS) DFT electronic structure are usually performed.16 On the other hand, the computation of excited states of isolated molecules can be easily obtained from DFT and its Time-Dependent extension within the Linear-Response formalism (LR-TDDFT).17–19 Therefore, it is common to use representative molecular clusters built from the periodic structure of the MOF to address their optical absorption properties.20,21
The aforementioned solid state and molecular perspectives provide complementary insights into the optical and electronic properties of MOFs.22,23 The solid-state perspective provides a rigorous representation of the atomistic structure including periodic boundary conditions, and the molecular perspective allows to accurately compute the excited state properties within a plethora of available quantum chemistry methods.
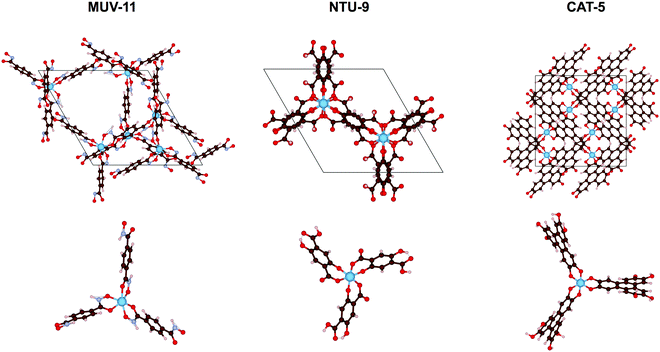
In this work, we evaluate the optical absorption properties of three experimentally reported MOFs, MUV-11,24 NTU-9,25 and CAT-5,26 using both the solid state and molecular approaches. These MOF materials consist in mononuclear Ti(IV) nodes with pseudo-octahedral coordination to benzene-1,4-dihydroxamate, 2,5-dihydroxyterephthalate, or triphenylene-2,3,6,7,10,11-hexakis(olate) ligands, respectively (see Fig. 1). Ti(IV)-MOFs have been shown to be very promising as photocatalysts because of their high optical response and excellent photoredox properties.27 However, their synthesis remains challenging for two reasons: (i) their charge valence (+4) makes them highly reactive resulting in too strong Ti–ligand bonds and thus preventing the formation of crystalline products, and (ii) they suffer from severe hydrolysis making them unstable in water.28 Therefore, other metal alternative have been explored.29 To encompass the diversity of other metal–ligand combinations, we have performed in silico metal substitutions of Ti(IV) by Zn(II), Cd(II), Fe(II), Ru(II), and Zr(IV) ions. These calculations allow us to compare the optical absorption properties of d10, d6, and d0 electronic configurations of 1st and 2nd row TMCs in MOFs. To do so, we examine the GS properties of the crystal structures in periodic boundary conditions, analyze the low-energy absorption spectra of their representative TMCs and ultimately discuss the conclusions extracted from both analysis as well as the main advantages and drawbacks of both approximations.
Methods
Solid state
Geometry optimization of the crystal coordinates and cell parameters of all MOFs was performed under periodic boundary conditions with DFT at PBE30 level including D3BJ dispersion correction31 using the CP2K program version 6.1.32 In all computations the Goedecker–Teter–Hutter pseudopotentials33 are used with a density cutoff of 450 Ry, DZVP-MOLOPT basis set for non-metal atoms and TZVP-MOLOPT basis set for the metal atoms.34 The optimized cell parameters are collected and compared to the experimental values of the Ti(IV)-MOF crystals in Table S1 (ESI†). Energy computations at the PBE0 level35 were performed upon the PBE-D3BJ optimized structures. To reduce the computational cost, the Auxiliary Density Matrix Method (ADMM)36 was used considering the pFIT3 auxiliary basis set for non-metal atoms (3 Gaussian exponents per valence orbital, includes polarization d-functions), and the cFIT11 for the metal atoms (contracted, 4 s, 3 p, and 3 d shells and 1 f shell in total). The Ti(IV)- and Zr(IV)-MUV-11 and NTU-9 MOFs are neutral structures. Metal substitution with Zn(II), Cd(II), Fe(II), and Ru(II) ions leads to non-neutral structures where the total charge is neutralized by a charge background that does not affect the charges and forces. Ti(IV)-CAT5 includes two DMA counterions not resolved in the crystal structure, thus leading to a charged structure. The same strategy than for the charged M(II)-MUV-11 and M(II)-NTU-9 structures was applied. All crystals were considered in its GS closed shell singlet. Fe(II) ions were also considered in their quintuplet (high spin, HS) state labelled as Fe(HS)-MOF structures. Unrestricted KS (UKS) was used for the HS structures where the total spin state of the unit cell is an open shell singlet (S = 0).Molecular compounds
The combination of benzene-1,4-dihydroxamate, 2,5-dihydroxyterephthalate or triphenylene-2,3,6,7,10,11-hexakis(olate) ligands coordinated to Zn(II), Cd(II), Fe(II), Ru(II), Ti(IV) and Zr(IV) metal ions lead to a total of 18 TMCs initial structures. Geometry optimization of the molecular coordinates was performed at the PBE and PBE0 level including D3BJ correction, as well as with the ωB97X-D37 functional using def2-SVP38 basis set in all cases. UKS was used to compute the Fe(II) TMCs in their HS state (S = 2). Frequency computations were performed to the stationary points to ensure that the geometries correspond to a minimum. Linear Response Time-dependent DFT (LR-TDDFT) computations were done with PBE0 functional at the PBE-D3BJ and PBE0-D3BJ optimized geometries, as well as with ωB97X-D at the ωB97X-D optimized geometries, using the def2-SVP basis set in all cases. All computations were performed with Gaussian09.39 In order to quantitatively characterize the excited states, a fragment decomposition analysis is performed as implemented in the TheoDORE package.40Results
Structural analysis
One of the main structural features in TMCs is the metal–ligand distance. The latter strongly depends on the metal ion in terms of its atomic mass and oxidation state (and spin state), as well as on the electronegativity of the ligand atoms, as for instance carbon, oxygen or nitrogen. As mentioned in the introduction, the MOFs considered here, MUV-11, NTU-9, and CAT-5, display six metal–oxygen (M–O) coordination bonds in an octahedral-like environment (see Fig. 1). The optimization of the MOF unit cells with Zn(II), Cd(II), Fe(II), Ru(II), Ti(IV), and Zr(IV) ions lead to the average M–O distances collected in Fig. 2a. In all cases the substitution of the 1st row metal by the 2nd row analogous results in an increase of the M–O distances in agreement with a larger ionic radii. Exceptionally, Fe(HS)-MOFs show larger average M–O distances than Ru-MOFs. This is a direct consequence of the promotion of two of the Fe(II) t2g electrons to the eg unoccupied orbitals (t42ge2g configuration) in its octahedral coordination. Predicting the relative stability between the LS and HS configurations of Fe(II) compounds is an extremely difficult task for which multiconfigurational methods such as CASSCF/CASPT241 or DMRG42 including static correlation effects would be preferable. In general, generalized gradient approximation (GGA) functionals tend to systematically overstabilize the LS while hybrid functionals artificially favor the HS state.43 In this case, oxygen-based ligands are weak ligands according to crystal field theory and in combination with Fe(II) would result in ground HS states at the molecular level.44 However, the subtle stability between the LS and HS states can be significantly affected at the solid state, for which it becomes even more difficult to assess the spin states stabilities.45 In the following, we address both the LS and HS states of the Fe(II) ions in order to encompass both possible situations in MOF structures.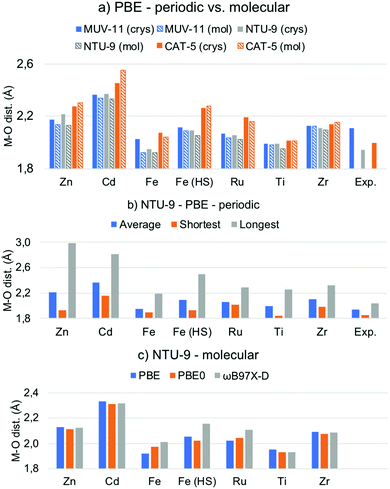 | ||
| Fig. 2 (a) Average metal–oxygen (M–O) distances in Å of the PBE-D3BJ optimized MOF crystals (crys) and molecular TMCs (mol). (b) Average, shortest and longest M–O distances of the PBE-D3BJ optimized NTU-9 MOF. (c) Average M–O distances of NTU-9 TMCs optimized with PBE-D3BJ, PBE0-D3BJ and ωB97X-D. Raw data is given in Tables S2 and S3 (ESI†). | ||
By comparing the results of the d10, d6, and d0 systems in Fig. 2a, it can be seen that the Zn/Cd M–O distances are significantly larger (>2.1/2.3 Å) than that of Fe/Ru and Ti/Zr systems. The bond enlargement of the M–O distances results in all cases in an increase of the optimized unit cell volume (Table S1, ESI†). Remarkably, the M–O distances systematically increase as MUV-11 < NTU-9 < CAT-5 in Zn/Cd MOFs, while they become the shortest for NTU-9 in the case of Fe/Ru and Ti/Zr. This difference arises from important distortions suffered by the pseudo-octahedral environment in Zn/Cd-NTU-9 MOF crystals, which show M–O distances ranging from 1.9 to 3.0 Å (Fig. 2b and Fig. S1, ESI†). These distortions result from the instability of this structure enforced to accommodate a d10 electronic configuration. In contrast, the optimized metal–oxygen distances of Ti-NTU-9 and Ti-CAT-5 structures are in very good agreement with the experimental values. In the case of Ti-MUV-11, the optimized structure shows an significant reduction of the Ti(IV)–oxygen distances (Fig. 2a). This difference may originate from thermal effects associated with the experimental structure as well as with the presence of solvent, which is completely removed in computational studies. From the computational point of view, it is of key importance to have access to reliable optimized geometries that can serve for electronic structure analysis.
The same structural analysis performed for the optimized TMCs is shown in Fig. 2a for comparison. Overall, the PBE-D3BJ optimization of the TMCs and MOFs lead to the same conclusions in terms of the optimal distances, namely all 2nd-row M–O distances are larger than 1st-row analogous (except for Fe(HS)) and they follow Zn/Cd > Ti/Zr > Fe/Ru trend. However, some differences are shown. First, the NTU-9 compound displays the shortest M–O average distance for the Zn/Cd TMCs, and second, a significant shortening of the average M–O distance is shown with respect to the crystalline phase in Zn-NTU-9, Fe-MUV-11 while it becomes larger for Zn-CAT-5 and Cd-CAT-5. These discrepancies between the molecular and solid-state geometries indicate that the structural restrictions within the crystalline MOF have an important effect in defining the optimal metal–ligand bond distances and ultimately, may affect the study of their optical properties. In that case, the optimization under periodic boundary conditions is required to ensure an appropriate representation of the molecular structure.
Within the molecular perspective, we can however perform geometry optimizations considering more accurate methods such as hybrid and range-corrected functionals. While most GGA functionals are shown to be robust to reproduce geometries of transition metal complexes,46 they have inherent difficulties to properly capture electron–electron correlation effects and suffer from an important self-interaction error. Hybrid functionals partially mitigate these errors by incorporating a fraction of exact exchange energy, which usually results in smaller standard deviations and more accurate geometries.47 With this aim, we reoptimized the structures of the TMCs with PBE0 and ωB97X-D functionals and compared the M–O distances (Fig. 2c and Fig. S2, ESI†). Very similar values are obtained in all cases except for Fe/Ru TMCs, for which the optimized metal–oxygen distances systematically increase as PBE > PBE0 > ωB97X-D, or PBE0 > PBE > ωB97X-D in the case of Fe(HS)-NTU-9. The use of an adequate reference geometry to evaluate excited state properties has been shown to be relatively important for some functionals, especially if local and charge transfer (CT) excitations compete.48 Altogether, we show that both, the solid-state conditions and the functional used are important features to consider when evaluating the atomistic structure of MOFs in terms of the optimized M–O distances. In the following, we show how these structural differences may affect the predicted optoelectronic properties.
Band gap analysis
In semiconducting materials, the optical absorption energy is usually associated with the electronic band gap. However, it is still important to distinguish between the electronic band gap and the optical gap associated with the lowest absorption energy.49 The former corresponds to an excitation energy in which the electron–hole interaction is not taken into account, while the latter corresponds to the lowest neutral excitation of the system including excitonic effects. These excitonic effects are usually small in non-molecular bulk materials and thus, the band gap is a good approximation to the lowest optical absorption energy. In clear contrast, MOF are molecular-like systems in which local states and excitonic effects have been shown to be important.50,51 Unfortunately, excited state computations in solids are computationally expensive and thus estimations from the electronic band gap are needed. Large effort has been done in order to compute accurate band gaps for solids from DFT computations.52 While GGA functionals systematically underestimate the electronic band gap, hybrid functionals such as PBE0 have been shown to significantly improve the predicted values.53 In Fig. 3a are shown the PBE0 band gap values obtained for the MOF crystals computed at the PBE-D3BJ optimized structures. The values cover a range about 3 eV from 1.2 eV in Fe(HS)-MUV-11 and Fe(HS)-NTU-9 to 4.2 eV in the case of Zn-CAT-5, Cd-CAT-5 and Zr-CAT-5. These values may significantly overestimate the lowest absorption energy given that they do not include the stabilization energy associated with the electron–hole interaction in the excited state. For instance, Ti-MUV-11 and Ti-NTU-9 were reported to absorb at 2.0124 and 1.7225 eV respectively, while the PBE0 band gap values are 2.48 and 2.87 eV, respectively. This difference can be attributed to the absence of excitonic effects, whose magnitude will depend on the method and the (de)localize nature of the excitation. From the band gap values obtained, MUV-11 and NTU-9 MOFs are shown to be promising light harvesting systems depending on the metal while CAT-5 will absorb above the limit of the UV-vis spectrum. This is in agreement with the optical properties reported in their original publication when synthesized with Ti(IV).24–26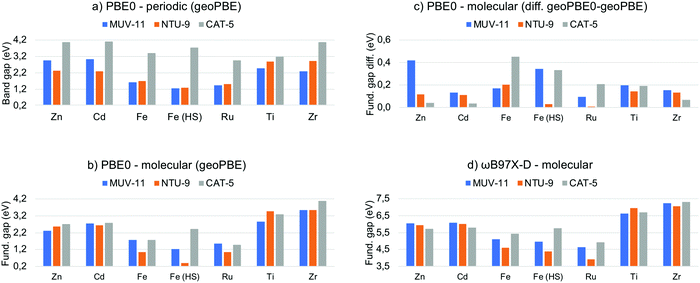 | ||
| Fig. 3 (a) PBE0 band gap given in eV computed for the MOF periodic crystals at their optimized PBE-D3BJ geometry and (b) fundamental gap for the molecular compounds. (c) Fundamental gap difference between the PBE0 values at the PBE0-D3BJ and PBE-D3BJ geometries of the TMCs. (d) Fundamental gap values computed for the TMCs at the ωB97X-D level. Raw data in Tables S4 and S5 (ESI†). | ||
Evaluation of the electronic “band” gap can be equally performed for the MOF representative TMCs. However, this analysis is not common at the molecular level for two reasons. First, considering only the HOMO–LUMO orbital pair is known to be insufficient to properly represent optical transitions54 and second, a more accurate analysis based on LR-TDDFT methodology is always possible. Ideally, the HOMO–LUMO gap can be associated with the fundamental gap when following the KS analogue of Koopman's theorem in HF theory. That is, it equals the difference between the first ionization potential (IP) and the first electron affinity (EA) energies.55 Herein, we thus refer as fundamental gap for the HOMO–LUMO orbital energy difference in finite systems, while restrict ourselves to band gap in solids. We have collected in Fig. 3b the PBE0 fundamental gap obtained at the PBE-D3BJ geometries of the TMCs to directly compare with the MOF band gap values. It can be seen that the fundamental gap of the Zn/Cd and Ti/Zr TMCs mainly depend on the metal ion while the difference between the three ligands in MUV-11, NTU-9 and CAT-5 is rather small. The values range from 2.2 eV for Zn/Cd-TMCs, to values around 3.2 eV for Ti/Zr-TMCs. In the case of Fe/Ru-TMCs, the fundamental gap is more dependent on the ligand. There are clear differences between the later values and band gap results obtained at the solid-state level (Fig. 3a) In particular, M-CAT-5 MOFs show large band gaps (>3 eV) in all cases except Ti/Zr in the solid phase. In contrast, M-MUV-11 and M-NTU-9 band gaps are modulated by the dn configuration in the crystal, being M-MUV-11 band gap larger than M-NTU-9 band gap for Zn/Cd-MOFs, almost equal for Fe/Ru-MOFs, and smaller for Ti/Zr-MOFs, while follows a different trend when isolated. This indicates that the electronic configuration of the metal, the ligand and the crystal packing are crucial in determining the band gap in solid MOFs.
As discussed in the previous section, the adequacy of the PBE-D3BJ optimized geometries to evaluate optical properties can be questioned and one of the main advantages of the molecular perspective is the availability of more accurate quantum chemistry methods. In this context, we reevaluated the PBE0 fundamental gap of the TMCs at the PBE-D3BJ optimized geometries to determine the impact of the geometry change. The energy shift when considering PBE0-D3BJ geometries ranges from 0.1 to 0.5 eV as shown in Fig. 3c. This shift in the frontier orbital energies is by no means negligible in some cases and should be considered when evaluating band gaps in periodic boundary conditions at PBE-D3BJ solid state geometries. Unfortunately, PBE0-D3BJ cell optimizations of large cell systems such as MOF cannot be performed routinely and thus empirical estimations from the experimental data are the best option to assess the accuracy of the computations.56
While hybrid functionals such as PBE0 significantly ameliorate the main drawbacks of local exchange functionals by the inclusion of HF exchange, they are still not be able to accurately predict the fundamental gap compared to experimental results.57 This failure is a direct consequence of using only a fraction of exact exchange, which does not account properly for the 1/r dependence of the electron–hole interaction. To address this problem, range-separated density functionals are a well-balanced alternative. In this class of functionals the coulomb potential is split into a long-range (LR) exact exchange and a short-range (SR) local potential term, thus providing of additional flexibility to guarantee the correct description of the asymptotic potential.57 Among several approximations, ωB97X-D functional has been shown to outperform in the computation of atomic fundamental gaps over conventional hybrid functionals.57 The fundamental gap of the TMCs obtained at ωB97X-D level are shown in Fig. 3d. Remarkably, the values are significantly larger (3.5–7.5 eV) than that obtained with PBE0. Those can clearly not be associated with the optical absorption properties of the system, which highlights the importance of distinguishing between fundamental gap and optical gap, which is discussed in the next section.
Optical absorption spectra
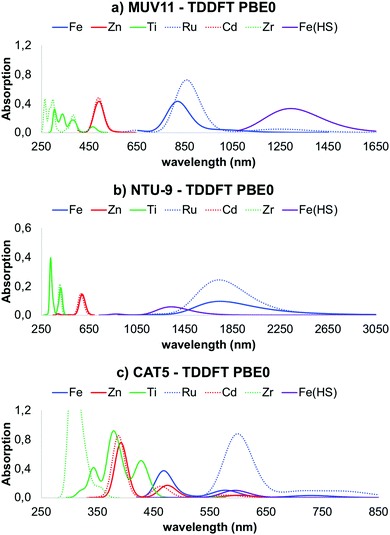
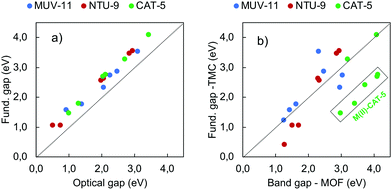
Explicit computation of the optical absorption spectra gives access not only to the excited state energies but also to their relative intensity. The latter provides important information about the allowance of a certain electronic transition as well as about the presence of low-lying dark states. In Fig. 4 are shown the optical absorption spectra of MUV-11, NTU-9 and CAT-5 TMCs, computed with PBE0. Comparison between the PBE0 spectra obtained at the PBE-D3BJ and PBE0-D3BJ optimized geometries is given in Fig. S3–S5 (ESI†). They show in all cases a systematic shift towards higher energies, however the shape and relative position of the peaks is equivalent. Following the band gap trend in Fig. 3b, the position of the lowest absorption peak follows the trend Fe/Ru < Zn/Cd < Ti/Zr. In particular, Ru-TMCs show the lowest energy absorption peaks followed by Fe-TMCs at slightly higher energies. Zn- and Cd-TMCs show very similar absorption peaks for MUV-11, NTU-9 and CAT-5, while Ti- and Zr-TMCs have similar spectra for NTU-9 but they differ in the case of MUV-11 and CAT-5, where Ti-TMCs display their lowest peak at lower energies. Overall, all the conclusions extracted from the fundamental gap analysis of the TMCs in the previous section are well captured in their optical absorption spectra except for Fe(HS)-TMCs, for which the lowest excitations correspond to dark transitions as discussed below. For the sake of comparison, the correlation between the fundamental gap and the optical gap (defined as the energy of the lowest absorption peak) is shown in Fig. 5a. This correlation is rather linear (R2 = 0.98) showing a systematic shift of 0.44 eV, which can be ascribed to the exciton binding energy as evaluated by PBE0. Similar results have been reported in diverse databases of MOFs, supporting the use of band gap estimations to predict the optical absorption.51,58 Within this approximation, it is thus possible to evaluate solid-state effects, which can significantly alter the conclusions extracted at the molecular level. In Fig. 5b it is shown the correlation between the band gap values computed for the periodic MOF (Fig. 3a) and its representative TMC (Fig. 3b), both obtained with PBE0 at the PBE-D3BJ optimized geometries. In this comparison we assume that the error committed in the TMC geometry when using PBE-D3BJ would be of the same magnitude at the solid-state level. Although there are differences between the molecular fundamental gap and the solid-state band gap, most values follow a linear trend. Exceptionally, the M(II)-CAT-5 TMCs show large but systematic deviations from their MOF counterparts while Ti(IV)- and Zr(IV)-CAT-5 TMC/MOF gaps coincide. This discrepancy originates in the loss of symmetry of the LUMO of the CAT-5 ligand in the M-CAT-5 TMC as a consequence of the truncation of the metal–ligand connectivity. The truncation does not affect the gap for Ti(IV) and Zr(IV) because their LUMO mainly correspond to the empty d-orbitals (Fig. S6, ESI†). Altogether, our analysis points to the importance of addressing the optoelectronic properties of these systems at the crystalline phase. However, estimations of the MOF band gap can be performed considering isolated TMCs in most cases, which would significantly reduce the computational cost in, for instance, large-scale data-base computational screening.As mentioned in the previous section, conventional hybrid functionals such as PBE0 are not able to fully recover the 1/r dependence of the electron–hole interaction, and thus may have difficulties to accurately predict the appropriate ordering between local and non-local charge transfer (CT) states. To address this question, we recomputed the optical absorption spectra of the TMCs with ωB97X-D, which are shown in Fig. S7 (ESI†). All spectra are systematically blue-shifted with respect to the PBE0 results, however the same conclusions in terms of the relative position of the different peaks remains.
Excited state analysis
In TMCs and MOFs, the character of the low-lying excited states in terms of the local or charge transfer (CT) character is one of the most important descriptors to determine their potential for a given application. While local excitations such as intraligand (IL) and metal-centered (MC) transitions are associated with either short and intense emission or non-radiative decay,59 CT states such as metal-to-ligand (MLCT) or ligand-to-metal (LMCT) states are used to promote long-lived excitations required for charge injection and redox activity.60 To identify these states in MOFs, it is common to compute the Projected Density of States (PDOS) of the periodic structure and characterize the Valence Band Maximum (VBM) and Conduction Band Minimum (CBM) as mainly metal-based, ligand-based or mixed, and then estimate the character of the lowest excited states considering VBM-to-CBM transitions. This information is complemented by the characterization of the Highest Occupied Crystal Orbital (HOCO) and the Lowest Unoccupied Crystal Orbital (LUCO) which can be directly associated with the VBM and CBM, respectively. In Fig. S8–S13 (ESI†) we have collected the PDOS and the crystal orbitals computed for the MOF crystals at the PBE0 level. From the results obtained, each case can be categorized as having a MLCT, LMCT or IL low-lying VBM-to-CBM transition. In Fig. 6 we show the PDOS of one representative case of each. It can be seen that the major contribution to the VBM in Fe-MUV-11 corresponds to the Fe ions, while the CBM is mainly characterized by the orbitals of the carbon atoms of the ligand, both in the LS and HS state of Fe(II). This PDOS pattern suggests that the lowest excitation will correspond to a Fe-to-ligand transition. In contrast, the VBM in Ti-CAT-5 is localized in the ligand while the character of the CBM is mainly centered in the Ti ions indicating that a ligand-to-Ti excitation is the lowest in energy. Finally, both the VBM and CBM in Zn-NTU-9 show major contributions in the carbon and oxygen atoms leading to a low-lying IL transition. The assignment of the VBM and CBM peaks as well as the predicted character of the lowest excitations can be also analyzed based on the HOCO and LUCO. However, this analysis may lead to erroneous conclusions with respect to the locality of the excitation when pseudo-degenerate orbitals appear localized in different units.58 For instance, the HOCO and LUCO of Zn-NTU-9 shown in Fig. S12 (ESI†) are localized in different ligands of the unit cell, which would erroneously indicate that the lowest HOCO-to-LUCO transition promotes ligand-to-ligand CT (LLCT). This is an example of the limitations of the crystal orbital analysis to the excited state properties in molecular-like materials such as MOFs and thus, must be performed very carefully.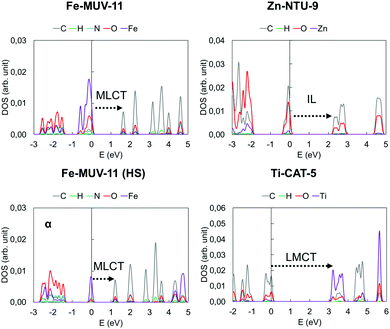 | ||
| Fig. 6 Projected density of states of the Fe-MUV-11, Zn-NTU-9 and Ti-CAT-5 crystal structures computed with PBE0 at the PBE-D3BJ minima. The character of the low-lying excitation is indicated. | ||
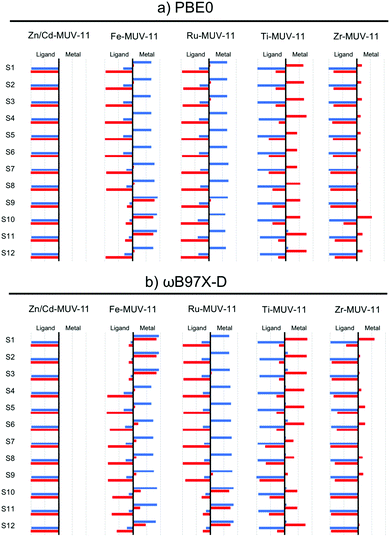
While the interpretation of the excited state character in MOFs is usually performed on the basis of the PDOS, this analysis can be performed exhaustively in TMCs from the charge transfer numbers extracted from the transition density matrix.13 To do so, the latter is partitioned among the different fragments of interest of the molecular system (in this case the metal and the ligands) and the electron and hole densities of the excited state are analyzed with respect to the fragments considered.40 In Fig. 7 and Fig. S14 and S15 (ESI†) we show the electron and hole contributions to the 12 lowest vertical excited states of the studied TMCs obtained from the LR-TDDFT computations performed at PBE0 and ωB97X-D level. In the case of Zn- and Cd-TMCs the lowest states correspond in all cases to pure IL states in which the electron and the hole are fully localized on the ligands. In contrast, the lowest states of Fe- and Ru-TMCs computed with PBE0 (Fig. 7a and Fig. S14, ESI†) show in most cases a hole mainly localized in the metal and an electron mainly localized in the ligand, characteristic of MLCT states. An exception is Fe-CAT-5 for which S1–S3 states show major MC contributions (Fig. S14, ESI†). Finally, Ti-TMCs display LMCT transitions (Fig. S15, ESI†), while Zr-TMCs show low-lying IL states (with minor LMCT contributions in Zr-MUV-11). Altogether, the same fingerprints in terms of excited state character are shown at PBE0 level from the GS analysis of the PDOS of the MOF and the electron–hole densities of the excited states computed for the TMCs.
The characterization of the low-lying excited states with ωB97X-D functional (Fig. 7b) leads to the same conclusions extracted at the PBE0 level for Zn/Cd- and Ti/Zr-TMCs, but differs in the case of Fe/Ru-TMCs. In particular, the lowest excitations in Fe-MUV-11, Fe-NTU-9 and Ru-CAT-5 correspond to MLCT transitions when evaluated with PBE0, while these are mainly attributed to MC with ωB97X-D. In addition, the low-lying MLCT transitions in Fe-CAT-5 (S4–S9 states) are shifted to higher energies when computed with ωB97X-D, while the local IL excitations are stabilized (Fig. S14, ESI†). The difficulties of global hybrid PBE0 to properly balance local and CT states are thus only critical when those competing states are close in energy, as in the case of Fe- (and eventually Ru-) systems. These low-lying MC states in Fe- and Ru-TMCs correspond to dark states in which the oscillator strength is negligible and thus, do not correspond to optically active excitations to consider in the absorption spectrum. Even though these dark states do not take part in optical absorption, they can play a crucial role in the excited state relaxation process leading to either non-radiative decay or ligand dissociation pathways.61,62
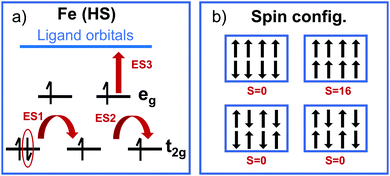
Specially challenging is the characterization of excited states in open shell TMCs with, for instance, Fe(II) ions in its HS state. In particular, GS convergence problems can arise from the pseudo-degeneracy of the three t2g-like orbitals, which must accommodate four electrons following a t42ge2g-like configuration. This electronic configuration can lead to three quasi-degenerate HS states given that any of the three t2g-like orbitals can be doubly occupied. The degeneracy becomes critical for highly octahedral structures, however a distorted pseudo-octahedral environment might alleviate this problem by splitting the t2g orbital energies. In principle, only multi-configurational wave function methods are able to properly describe the complex nature of the S = 2 state of Fe(II), however in practice these methods are not available for periodic systems as MOFs. Thus, analysis based on approximations from DFT are usually performed. For Fe(HS)-MUV-11, NTU-9 and CAT-5 TMCs, the energy splitting of the pseudo-degenerate states obtained with LR-TDDFT is 0.1–0.3 eV (Table 1). These states correspond to the GS and the first two excited states ES1 and ES2, while the following excited state ES3 is higher in energy (about 1 eV) and originates from MLCT excitations as represented in Fig. 8a. The energy splitting values are smaller for CAT-5 and NTU-9 and slightly larger for MUV-11. This trend is in agreement with the octahedral distortion of the GS minima based on the Fe–oxygen distances, which shows differences of up to 0.11 Å for MUV-11 while only up to 0.01 Å in CAT-5. Note that to quantitatively evaluate the distortion of the minima from the ideal octahedral geometry, both distances and angles should be considered.63
| MUV-11 | NTU-9 | CAT-5 | |
|---|---|---|---|
| Excited state energies | |||
| ES1 | 0.33 (0.26) | 0.12 (0.13) | 0.23 (0.15) |
| ES2 | 0.37 (0.33) | 0.14 (0.15) | 0.23 (0.16) |
| ES3 | 0.95 (1.15) | 0.85 (0.92) | 0.86 (0.79) |
| Fe–O distances | |||
| MAX | 2.19 | 2.03 | 2.31 |
| MIN | 2.08 | 2.01 | 2.30 |
An additional challenge when dealing with open shell metal ions in MOFs arises from the different spin configurations that may coexist in the periodic structure represented by the MOF unit cell. The different spin configurations originate from the ferromagnetic and antiferromagnetic Fe(S = 2)–Fe(S = 2) interactions in the MOF crystal as shown in Fig. 8b. These interactions are usually weak for monovalent MOFs with large Fe–Fe distances such as MUV-11, NTU-9 and CAT-5, however they may become important for polynuclear metal-nodes and thus, highly accurate computations are required.64 Still, the interaction between spatially separated metal-nodes will be weak and at high-enough temperatures, the system will behave paramagnetic and any low-energy spin configuration is valid.65 In such conditions, a computational analysis at a single optimized geometry is preferred for non-magnetic unit cells (S = 0) to avoid artifacts from large magnetization effects. Altogether, both the pseudo-degeneracy of the t2g-like orbitals within each Fe(HS), and the pseudo-degeneracy of several magnetic configurations in the unit cell, result in a large number of low-lying (dark) states in the crystal that would make difficult the characterization of the optically active excitations by means of LR-TDDFT computations in periodic boundary conditions. For this reason, molecular models based on TMCs analogous are still needed and provide important insights into the optical properties of MOFs.
Conclusions
The understanding and prediction of the optical absorption properties of MOFs can be computationally addressed from a solid-state and/or a molecular perspective. The solid-state perspective consists in optimizing the unit cell of the MOF in periodic boundary conditions and characterizing the low-energy excitations in terms of band gap and PDOS analysis. In the molecular perspective representative TMCs are considered isolated for which the excited states can be computed with appropriate functionals within the LR-TDDFT framework. Herein, we apply both strategies to three experimentally reported Ti(IV)-MOFs, MUV-11, NTU-9, and CAT-5, with in silico metal substitutions with Zn(II), Cd(II), Fe(II), Ru(II), and Zr(IV), aiming at comparing the excited states fingerprints of d10, d6, and d0 electronic configurations of 1st and 2nd row TMCs in MOFs. Our results highlight the importance of evaluating the MOF band gap in solid-state conditions to fully account for the geometrical restrictions and intermolecular interactions in the crystal. However, estimations of the MOF band gap can be performed considering isolated TMCs in those cases in which the periodicity in the crystal does not significantly affect the shape of the main orbitals involved in the lowest transition. We discuss the difference between the optical gap and the fundamental gap, which is crucial when assessing the optoelectronic properties of TMCs, and we show that the band gap and PDOS analysis in MOFs revels the same optical absorption trends in terms of excited state energies and character than the ones predicted for their analogous TMCs from LR-TDDFT and fragment decomposition analysis. In particular, Zn/Cd-systems are mainly characterized by low-lying IL excitations in both approximations. Similarly, Zr-systems display mainly IL transitions, while Ti-analogous show optically active LMCT excitations as a consequence of the lower energy of the unoccupied d0 orbitals. Remarkably, Zr-systems may also promote low-lying LMCT when combined with certain ligands as shown for Zr-MUV-11 TMC and Zr-CAT-5 MOF. Finally, Fe- and Ru-systems with d6 configuration exhibit low-lying MLCT absorption bands competing with dark MC states. The latter are not relevant for optical absorption but may be crucial to assess the excited state relaxation process. To ensure a balanced treatment of MLCT and MC states, a range-separated functional such as ωB97X-D is required. Altogether, both the solid state and molecular perspective nicely complement each other in providing a good description and understanding of the optical absorption properties in MOFs. The first allows for an appropriate representation of the periodic structure and the characterization of the groups involved in the interband transitions, while the latter enables an accurate computation of the excited states including excitonic effects for the metal–ligand constituents in isolated conditions.Conflicts of interest
There are no conflicts to declare.Acknowledgements
This work has been supported by EPFL and the National Centre of Competence in Research (NCCR) Materials Revolution: Computational Design and Discovery of Novel Materials (MARVEL) of the Swiss National Science Foundation (SNSF). Computations were performed at the EPFL clusters and at the Swiss National Supercomputing Centre (CSCS) under project ID s1005. All the dataset files are available on the Materials Cloud Archive at https://archive.materialscloud.org/.Notes and references
- W. C. H. Choy, W. K. Chan and Y. Yuan, Adv. Mater., 2014, 26, 5368 CrossRef CAS PubMed.
- L. K. McKenzie, H. E. Bryant and J. A. Weinstein, Coord. Chem. Rev., 2019, 379, 2–29 CrossRef CAS.
- Q. Zhao, C. Huang and F. Li, Chem. Soc. Rev., 2011, 40, 2508–2524 RSC.
- C. A. Bignozzia, R. Argazzi, R. Boaretto, E. Busatto, S. Carli, F. Ronconi and S. Caramori, Coord. Chem. Rev., 2013, 257, 1472–1492 CrossRef.
- J. Huo, Y.-B. Zhang, W.-Y. Zou, X. Hu, Q. Deng and D. Chen, Catal. Sci. Technol., 2019, 9, 2716–2727 RSC.
- L. De Cola and P. Belser, Coord. Chem. Rev., 1998, 177, 301–346 CrossRef CAS.
- H.-C. Zhou, J. R. Long and O. M. Yaghi, Chem. Rev., 2012, 112, 673–674 CrossRef CAS PubMed.
- P. Z. Moghadam, A. Li, A. B. Wiggin, A. Tao, A. G. P. Maloney, P. A. Wood, S. C. Ward and D. Fairen-Jimenez, Chem. Mater., 2017, 29, 2618–2625 CrossRef CAS.
- J. A. Mason, J. Oktawiec, M. K. Taylor, M. R. Hudson, J. Rodriguez, J. E. Bachman, M. I. Gonzalez, A. Cervellino, A. Guagliardi, C. M. Brown, P. L. Llewellyn and N. Masciocchi, Nature, 2015, 527, 357–361 CrossRef CAS PubMed.
- J. Liu, L. Chen, H. Cui, J. Zhang, L. Zhang and C.-Y. Su, Chem. Soc. Rev., 2014, 43, 6011–6061 RSC.
- W. P. Lustig, S. Mukherjee, N. D. Rudd, A. V. Desai, J. Li and S. K. Ghosh, Chem. Soc. Rev., 2017, 46, 3242–3285 RSC.
- Y. Li, H. Xu, S. Ouyang and J. Ye, Phys. Chem. Chem. Phys., 2016, 18, 7563–7572 RSC.
- S. Mai, F. Plasser, J. Dorna, M. Fumanal, C. Daniel and L. González, Coord. Chem. Rev., 2018, 361, 74–97 CrossRef CAS.
- P. Kratzer and J. Neugebauer, Front. Chem., 2019, 7, 106 CrossRef CAS PubMed.
- G. Onida, L. Reining and A. Rubio, Rev. Mod. Phys., 2002, 74, 601–659 CrossRef CAS.
- X.-P. Wu, L. Gagliardi and D. G. Truhlar, J. Am. Chem. Soc., 2018, 140, 7904–7912 CrossRef CAS PubMed.
- E. Runge and E. K. U. Gross, Phys. Rev. Lett., 1984, 52, 997 CrossRef CAS.
- M. Petersilka, U. J. Grossmann and E. K. U. Gross, Phys. Rev. Lett., 1996, 76, 1212 CrossRef CAS PubMed.
- M. E. Casida and M. Huix-Rotlant, Annu. Rev. Phys. Chem., 2012, 63, 287–323 CrossRef CAS PubMed.
- M. Ji, X. Lan, Z. Han, C. Hao and J. Qiu, Inorg. Chem., 2012, 51, 12389–12394 CrossRef CAS PubMed.
- L. Wilbraham, F.-X. Coudert and I. Ciofini, Phys. Chem. Chem. Phys., 2016, 18, 25176–25182 RSC.
- A. Ortega-Guerrero, M. Fumanal, G. Capano, I. Tavernelli and B. Smit, Chem. Mater., 2020, 32, 4194–4204 CrossRef CAS.
- O. Brea, A. Luna, C. Díaz and I. Corral, ChemPhysChem, 2018, 19, 1349–1357 CrossRef PubMed.
- N. M. Padial, J. Castells-Gil, N. Almora-Barrios, M. Romero-Angel, I. da Silva, M. Barawi, A. García-Sańchez, V. A. de la Peña O’Shea and C. Martí-Gastaldo, J. Am. Chem. Soc., 2019, 141, 13124–13133 CrossRef CAS PubMed.
- J. Gao, J. Miao, P.-Z. Li, W. Y. Teng, L. Yang, Y. Zhao, B. Liu and Q. Zhang, Chem. Commun., 2014, 50, 3786–3788 RSC.
- N. T. Nguyen, H. Furukawa, F. Gańdara, C. A. Trickett, H. Jeong, K. E. Cordova and O. M. Yaghi, J. Am. Chem. Soc., 2015, 137, 15394–15397 CrossRef CAS PubMed.
- C. Li, H. Xu, J. Gao, W. Du, L. Shangguan, X. Zhang, R.-B. Lin, H. Wu, W. Zhou, X. Liu, J. Yao and B. Chen, J. Mater. Chem. A, 2019, 7, 11928–11933 RSC.
- L. Zou, D. Feng, T.-F. Liu, Y.-P. Chen, S. Yuan, K. Wang, X. Wang, S. Fordhama and H.-C. Zhou, Chem. Sci., 2016, 7, 1063–1069 RSC.
- M. A. Syzgantseva, C. P. Ireland, F. M. Ebrahim, B. Smit and O. A. Syzgantseva, J. Am. Chem. Soc., 2019, 141, 6271–6278 CrossRef CAS PubMed.
- J. P. Perdew, K. Burke and M. Ernzerhof, Phys. Rev. Lett., 1996, 77, 3865 CrossRef CAS PubMed.
- S. Grimme, J. Antony, S. Ehrlich and H. Krieg, J. Chem. Phys., 2010, 132, 154104 CrossRef PubMed.
- J. Hutter, M. Iannuzzi, F. Schiffmann and J. Vande Vondele, Wiley Interdiscip. Rev.: Comput. Mol. Sci., 2014, 4, 15–25 CAS.
- S. Goedecker, M. Teter and J. Hutter, Phys. Rev. B: Condens. Matter Mater. Phys., 1996, 54, 1703 CrossRef CAS PubMed.
- J. VandeVondele and J. Hutter, J. Chem. Phys., 2007, 127, 114105 CrossRef PubMed.
- M. Ernzerhof and G. E. Scuseria, J. Chem. Phys., 1999, 110, 5029–5036 CrossRef CAS.
- M. Guidon, J. Hutter and J. Vande Vondele, J. Chem. Theory Comput., 2010, 6, 2348–2364 CrossRef CAS PubMed.
- J.-D. Chai and M. Head-Gordon, Phys. Chem. Chem. Phys., 2008, 10, 6615–6620 RSC.
- F. Weigend and R. Ahlrichs, Phys. Chem. Chem. Phys., 2005, 7, 3297–3305 RSC.
- M. J. Frisch, G. W. Trucks, H. B. Schlegel, G. E. Scuseria, M. A. Robb, J. R. Cheeseman, G. Scalmani, V. Barone, B. Mennucci, G. A. Petersson, H. Nakatsuji, M. Caricato, X. Li, H. P. Hratchian, A. F. Izmaylov, J. Bloino, G. Zheng, J. L. Sonnenberg, M. Hada, M. Ehara, K. Toyota, R. Fukuda, J. Hasegawa, M. Ishida, T. Nakajima, Y. Honda, O. Kitao, H. Nakai, T. Vreven, J. A. Montgomery Jr, J. E. Peralta, F. Ogliaro, M. Bearpark, J. J. Heyd, E. Brothers, K. N. Kudin, V. N. Staroverov, T. Keith, R. Kobayashi, J. Normand, K. Raghavachari, A. Rendell, J. C. Burant, S. S. Iyengar, J. Tomasi, M. Cossi, N. Rega, J. M. Millam, M. Klene, J. E. Knox, J. B. Cross, V. Bakken, C. Adamo, J. Jaramillo, R. Gomperts, R. E. Stratmann, O. Yazyev, A. J. Austin, R. Cammi, C. Pomelli, J. W. Ochterski, R. L. Martin, K. Morokuma, V. G. Zakrzewski, G. A. Voth, P. Salvador, J. J. Dannenberg, S. Dapprich, A. D. Daniels, O. Farkas, J. B. Foresman, J. V. Ortiz, J. Cioslowski and D. J. Fox, Gaussian 09, Revision D.01, Gaussian, Inc., Wallingford CT, 2013 Search PubMed.
- F. Plasser, TheoDORE: A package for theoretical density, orbital relaxation, and exciton analysis, 2017, http://theodore-qc.sourceforge.net Search PubMed.
- S. Vela, M. Fumanal, J. Ribas-Arino and V. Robert, J. Comput. Chem., 2016, 37, 947–953 CrossRef CAS PubMed.
- M. Roemelt and D. A. Pantazis, Adv. Theory Simul., 2019, 2, 1800201 CrossRef.
- D. N. Bowman and E. Jakubikova, Inorg. Chem., 2012, 51, 6011–6019 CrossRef CAS PubMed.
- K. Pierloot and S. J. Vancoillie, J. Chem. Phys., 2006, 125, 124303 CrossRef PubMed.
- S. Vela, M. Fumanal, J. Cirera and J. Ribas-Arino, Phys. Chem. Chem. Phys., 2020, 22, 4938–4945 RSC.
- M. Bühl and H. Kabrede, J. Chem. Theory Comput., 2006, 2, 1282 CrossRef PubMed.
- Y. Minenkov, Å. Singstad, G. Occhipinti and V. R. Jensen, Dalton Trans., 2012, 41, 5526–5541 RSC.
- A. Batlogg and M. Fumanal, J. Comput. Chem., 2019, 40, 2377–2390 CrossRef CAS PubMed.
- A. C. Ullrich and Z.-h. Yang, Top. Curr. Chem., 2016, 368, 185–218 CrossRef PubMed.
- M. Fumanal, G. Capano, S. Barthel, B. Smit and I. Tavernelli, J. Mater. Chem. A, 2020, 8, 4473–4482 RSC.
- J. Wiktor, I. Reshetnyak, M. Strach, M. Scarongella, R. Buonsanti and A. Pasquarello, J. Phys. Chem. Lett., 2018, 9, 5698–5703 CrossRef CAS PubMed.
- J. P. Perdew, W. Yang, K. Burke, Z. Yang, E. K. U. Gross, M. Scheffler, G. E. Scuseria, T. M. Henderson, I. Y. Zhang, A. Ruzsinszky, H. Peng, J. Sun, E. Trushin and A. Görling, Proc. Natl. Acad. Sci. U. S. A., 2017, 114, 2801–2806 CrossRef CAS PubMed.
- A. Drew and M. Head-Gordon, J. Am. Chem. Soc., 2004, 126, 4007–4016 CrossRef PubMed.
- J.-L. Bredas, Chem. Mater., 2017, 29, 477–478 CrossRef CAS.
- L. Kronik, T. Stein, S. Refaely-Abramson and R. Baer, J. Chem. Theory Comput., 2012, 8, 1515–1531 CrossRef CAS PubMed.
- A. Morales-Garcia, R. Valero and F. Illas, J. Phys. Chem. C, 2017, 121, 18862–18866 CrossRef CAS.
- A. Fabrizio, B. Meyer and C. Corminboeuf, J. Chem. Phys., 2020, 152, 154103 CrossRef CAS PubMed.
- M. Fumanal, A. Ortega-Guerrero, K. M. Jablonka, B. Smit and I. Tavernelli, Adv. Funct. Mater., 2020 DOI:10.1002/adfm.202003792.
- M. D. Allendorf, C. A. Bauer, R. K. Bhaktaa and R. J. T. Houk, Chem. Soc. Rev., 2009, 38, 1330–1352 RSC.
- J. Twilton, C. C. Le, P. Zhang, M. H. Shaw, R. W. Evans and D. W. C. MacMillan, Nat. Rev. Chem., 2017, 1, 0052 CrossRef CAS.
- A. Soupart, F. Alary, J.-L. Heully, P. I. P. Elliott and I. M. Dixon, Inorg. Chem., 2018, 57, 3192 CrossRef CAS PubMed.
- S. Arroliga-Rocha and D. Escudero, Inorg. Chem., 2018, 57, 12106 CrossRef CAS PubMed.
- S. Alvarez, Chem. Rev., 2015, 115, 13447–13483 CrossRef CAS PubMed.
- E. Ruiz, in Principles and Applications of Density Functional Theory in Inorganic Chemistry II, ed. N. Kaltsoyannis and J. E. McGrady, Springer Berlin Heidelberg, Berlin, Heidelberg, 2004, pp. 71–102 Search PubMed.
- S. Vela and H. Paulsen, Inorg. Chem., 2018, 57(15), 9478–9488 CrossRef CAS PubMed.
Footnote |
| † Electronic supplementary information (ESI) available. See DOI: 10.1039/d0cp03899g |
| This journal is © the Owner Societies 2020 |

