 Open Access Article
Naphthalene crystal shape prediction from molecular dynamics simulations†
Zoran
Bjelobrk
 a,
Pablo M.
Piaggi
bc,
Thilo
Weber
a,
Tarak
Karmakar
cd,
Marco
Mazzotti
a,
Pablo M.
Piaggi
bc,
Thilo
Weber
a,
Tarak
Karmakar
cd,
Marco
Mazzotti
 *a and
Michele
Parrinello
 *cd
*cd
aInstitute of Process Engineering, ETH Zürich, CH-8092, Switzerland. E-mail: marco.mazzotti@ipe.mavt.ethz.ch
bTheory and Simulation of Materials (THEOS), École Polytechnique Fédérale de Lausanne, CH-1015 Lausanne, Switzerland
cFacoltà di Informatica, Istituto di Scienze Computationali, Università della Svizzera italiana, via Giuseppe Buffi 13, CH-6900 Lugano, Switzerland
dDepartment of Chemistry and Applied Biosciences, ETH Zürich, c/o USI Campus, via Giuseppe Buffi 13, CH-6900 Lugano, Switzerland. E-mail: michele.parrinello@phys.chem.ethz.ch
First published on 30th April 2019
Abstract
We used molecular dynamics simulations to predict the steady state crystal shape of naphthalene grown from ethanol solution. The simulations were performed at constant supersaturation by utilizing a recently proposed algorithm [Perego et al., J. Chem. Phys., 2015, 142, 144113]. To bring the crystal growth within the timescale of a molecular dynamics simulation we applied well-tempered metadynamics with a spatially constrained collective variable, which focuses the sampling on the growing layer. We estimated that the resulting steady state crystal shape corresponds to a rhombic prism, which is in line with experiments. Further, we observed that at the investigated supersaturations, the {00![[1 with combining macron]](https://www.rsc.org/images/entities/char_0031_0304.gif) } face grows in a two step two dimensional nucleation mechanism while the considerably faster growing faces {1
} face grows in a two step two dimensional nucleation mechanism while the considerably faster growing faces {1![[1 with combining macron]](https://www.rsc.org/images/entities/char_0031_0304.gif) 0} and {20
0} and {20![[1 with combining macron]](https://www.rsc.org/images/entities/char_0031_0304.gif) } grow new layers with a one step two dimensional nucleation mechanism.
} grow new layers with a one step two dimensional nucleation mechanism.
1 Introduction
Controlling the crystal shape of organic molecules is crucial for process optimization in a wide range of industries, in particular in the pharmaceutical industry. Active pharmaceutical ingredients (APIs) are commonly produced as crystal powders purified by crystallization from solution in stirred suspension crystallizers. The resulting crystal shape affects among other properties the filterability, tabletability, and bio-availability of the drug product. Hence, control of the crystal shape is crucial in the manufacturing of pharmaceutical compounds.1,2 Experimental methods aimed at determining the crystal shape are often expensive and cumbersome. For this reason optimizing the crystallization conditions to obtain the desired crystal shape can be a laborious trial-and-error endeavor. Obtaining insight into the growth process at the molecular level would be useful to make a rational choice for the crystallization conditions.Molecular dynamics (MD) simulations have recently emerged as a useful tool to obtain atomistic insight into crystal growth.3–10 In particular, the work of Salvalaglio et al.11 showed the usefulness of MD simulations for the paradigmatic case of urea. In that work, the growth rate was calculated and the growth mechanisms, rough growth or two dimensional (2D) nucleation, were identified from simulations in which the crystal surface of interest was exposed to a supersaturated solution. Afterwards, the crystal shape was predicted based on the relative growth rates of the different crystal faces.12
The present work is dedicated to the study of naphthalene crystal growth in ethanol solution under different supersaturations.13,14 After urea, naphthalene is a step further towards the simulation of systems as complex as real life APIs.
The study of crystal growth of naphthalene using MD simulations presents at least two major challenges. First, the growth rates of the slowest growing crystal faces of naphthalene are so small, that growth of new layers is not observable within the timescale of a standard MD simulation (∼1 μs). To overcome the simulation time limitation we employ well-tempered metadynamics15 (WTMetaD), which is a well established enhanced sampling method for the study of rare events.
Secondly, the strong finite size effects hamper direct comparison with experiments. For instance, typical experiments are performed at approximately constant supersaturation while standard MD simulations are unable to maintain such conditions.8,11 The finite size effects are addressed using the constant chemical potential molecular dynamics (CμMD) method developed by Perego et al.,16 which maintains a constant supersaturation in the region adjacent to the crystal. With this simulation setup, relative growth rates of faces growing in the 2D nucleation regime can be obtained as a function of supersaturation.
2 Methods
2.1 Chemical potential control
In this section, we briefly summarize the CμMD method.16 The main features of this method are schematically depicted in Fig. 1: the system has periodic boundary conditions in all directions and is segmented along the z-axis into one reservoir, two control regions, as well as transition regions which surround the crystal slab. The slab is oriented such that the face of interest is exposed to the solution along the z-axis.The method works as follows: two forces, FμL and FμR, are introduced in order to control the flux of molecules between the reservoir and the left and right control regions, respectively. Each force acts along the z-axis at a distance DF from the crystal surface position zS, namely at positions −zF and zF, where zF = zS + DF. The functional forms of the forces are
| FμL(t,z) = k(CCR,L(t) − C0,L)Gω(z, −zF) | (1) |
| FμR(t,z) = k(CCR,R(t) − C0,R)Gω(z, −zF), | (2) |
 | (3) |
The idea behind the method is that depending on the concentration in the control regions at time t, Fμ will accelerate the molecules towards or away from the control regions. In this way, the concentration in the control regions can be kept constant. Further details on the CμMD method and the parameter optimization used in this work are reported in ref. 16.
2.2 Metadynamics
The crystal growth rate depends on the growing crystallographic plane and the solution supersaturation. In the case of naphthalene, even at high supersaturations, the growth of certain faces takes place in timescales much longer than those that can be afforded using standard MD simulations. A variety of different enhanced sampling techniques exist which can be applied to bring the growth event within the timescale of the simulation, like umbrella sampling,17 adaptive biasing force,18 or crystal-adiabatic free energy dynamics,19 to name a few. Here, we shall use WTMetaD. In this approach, a bias potential V(s,t) that evolves in time is constructed as a function of a small number of collective variables (CVs) s, which are functions of the atomic coordinates. The objective of V(s,t) is to discourage frequently visited configurations and aid the system to surmount free energy barriers. V(s,t) is defined as a sum of Gaussian functions of height W and width σ. V(s,t) converges asymptotically to20 | (4) |
2.3 Surface layer crystallinity
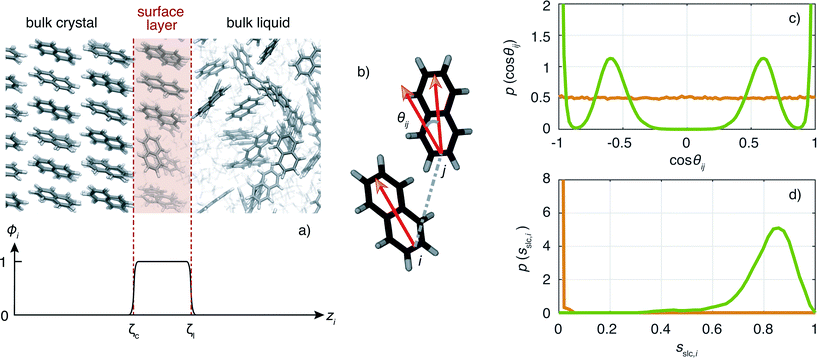
An important ingredient of WTMetaD is the choice of CVs. The CVs are typically non-linear functions of the atomic coordinates and describe the progress (state) of the process under study. In the case of crystallization, a reasonable choice is to use as CV the number of crystalline molecules in the growing layer. This CV would enhance both the growth and the dissolution of a single layer on the surface of the seed crystal. Here, we shall use a simple yet effective modification of the CV described in ref. 8 to localize the CV to the growing surface layer.The CV should be able to account for the fact that molecules have a different environment in solution and in the crystal.22 Molecules in solution are characterized by a small coordination number and almost random relative orientation of the neighbors. On the other hand, molecules in the crystal have higher coordination numbers and are aligned with respect to their neighbors. With this in mind, we define the surface layer crystallinity of solute molecule i as
| sslc,i = ϕiρiΘi, | (5) |
The CV sslc,i needs to be continuous and differentiable. Function ϕi is defined for each solute molecule i to have a non-zero value if solute molecule i is located within the surface layer. Defining the z-axis as perpendicular to the crystal surface, ϕi takes the form
 | (6) |
![[1 with combining macron]](https://www.rsc.org/images/entities/char_0031_0304.gif) } face of naphthalene in which the surface layer is shaded in red. The ϕi as a function of zi for this configuration is shown below.
} face of naphthalene in which the surface layer is shaded in red. The ϕi as a function of zi for this configuration is shown below.
The local density ρi is defined with the following rational switching function
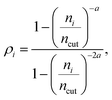 | (7) |
 | (8) |
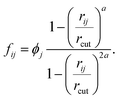 | (9) |
Function ϕj, which was introduced in eqn (6), provides non-zero values only for neighboring molecules j within the surface layer. The distance between the molecule pair is given by rij and rcut is the cutoff for the calculation of the coordination number.
Now we turn to describe the part of sslc,i that characterizes the local order. The orientation in space of each molecule is characterized by a vector l. In the case of naphthalene, l is defined along the long axis of the molecule, see Fig. 2b. The relative orientation between solute molecules i and j is characterized through an angle θij defined as cos![[thin space (1/6-em)]](https://www.rsc.org/images/entities/char_2009.gif) θij = lilj/(|li∥lj|). In Fig. 2c we show the probability density function of cos
θij = lilj/(|li∥lj|). In Fig. 2c we show the probability density function of cos![[thin space (1/6-em)]](https://www.rsc.org/images/entities/char_2009.gif) θij for neighbors ij inside the cutoff rcut both for the liquid and the crystalline phase of naphthalene. The histogram shows four well defined peaks, each peak corresponding to one of the reference angles
θij for neighbors ij inside the cutoff rcut both for the liquid and the crystalline phase of naphthalene. The histogram shows four well defined peaks, each peak corresponding to one of the reference angles  present in the crystal. We can now define the local order in eqn (5) as
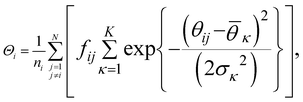 | (10) |
 . K denotes the total number of reference angles occurring in the crystal. The purpose of fij in eqn (10) is to restrict the summation on j only to the neighbors within rcut. Also, dividing by ni normalizes Θi in the interval [0, 1]. Values of Θi close to 1 correspond to an environment where neighbors are aligned according to the reference angles
  , while values of Θi close to 0 characterize environments with random orientations relative to their neighbors.
The combined effect of ϕi, ρi, and Θi leads to a crystallinity measure sslc,i that takes into account both density and order around the molecule i within the surface layer. Taking the sum over all N solute molecules of the system leads to the surface layer crystallinity
 | (11) |
2.4 Biased collective variable
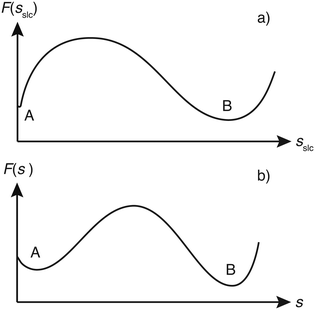
Although sslc could have been used to construct the WTMetaD bias potential, we found it beneficial to use a slightly different CV. This is due to the fact that the two minima in the FES corresponding to the fully dissolved layer (A) and fully grown layer (B) have rather different widths (see the illustrative scheme in Fig. 3a). In particular basin A is rather narrow and close to the boundary of the CV. The first feature requires the use of very narrow Gaussians. These narrow Gaussians are totally unnecessary in the filling of basin B and thus convergence is slowed down. On the other hand, the closeness of basin A to the boundary creates artificial effects.23,24In order to solve these problems, we could have used the variable Gaussian width approach of Branduardi et al.25 Here instead we prefer to use a much simpler fixup. We use as CV not directly sslc but the power law modification
| s = sχslc, | (12) |
The parameters used for sslc, s, and WTMetaD are tabulated in the ESI.†
2.5 Force fields
The general AMBER force field (GAFF)26,27 was used for naphthalene and ethanol. Both types of molecules have a fully atomistic description. For naphthalene, the relaxed structure and the restrained electrostatic potential (RESP) charges28 were calculated with Gaussian 09 (ref. 29) using the density functional theory structural optimization routine performed at the B3LYP/6-31G(d,p) level. The partial charges of the naphthalene atoms were fitted to the RESP charges. The lengths of the bonds involving hydrogen have been fixed at the equilibrium value. Details on the force field parameters of naphthalene and the force field validation can be found in the ESI.†30–32 Force field parameters of ethanol were taken from van der Spoel et al.332.6 Simulation runs
All simulations were performed with Gromacs 2016.5 (ref. 35–39) patched with a private version of Plumed 2.5.40 The temperature was set to 280 K in line with the experiments reported in ref. 13 and was kept constant with the velocity rescaling thermostat.41 Periodic boundary conditions were used. The particle mesh Ewald approach42 was employed for the long-range electrostatic interactions, and the LINCS algorithm38,43 was used to constrain the bonds involving hydrogens. The non-bonded cutoff for the van der Waals and electrostatic interactions was set to 1 nm.For each of the three crystal faces, two concentrations of C = 1.2 nm−3 and C = 1.5 nm−3 were considered, which correspond to supersaturations of approximately S ≈ 0.5 and S ≈ 0.9 (see ESI† for details). The simulation boxes contained around 1300 molecules. The equilibration procedure44 to obtain the initial configuration is reported in the ESI.† To compute the free energy barrier, simulation runs of 1 μs each were performed using WTMetaD with s. Application of the CμMD algorithm ensured the constancy of the chosen concentration. Simulation box visualizations of the three faces, {00![[1 with combining macron]](https://www.rsc.org/images/entities/char_0031_0304.gif) }, {1
}, {1![[1 with combining macron]](https://www.rsc.org/images/entities/char_0031_0304.gif) 0}, and {20
0}, and {20![[1 with combining macron]](https://www.rsc.org/images/entities/char_0031_0304.gif) }, are shown in Fig. 4. To keep the enhanced sampling protocol simple, only the right surface was biased at supersaturated conditions. The left control region concentration was kept approximately at solubility to prevent either growth or dissolution of the left crystal surface.
}, are shown in Fig. 4. To keep the enhanced sampling protocol simple, only the right surface was biased at supersaturated conditions. The left control region concentration was kept approximately at solubility to prevent either growth or dissolution of the left crystal surface.
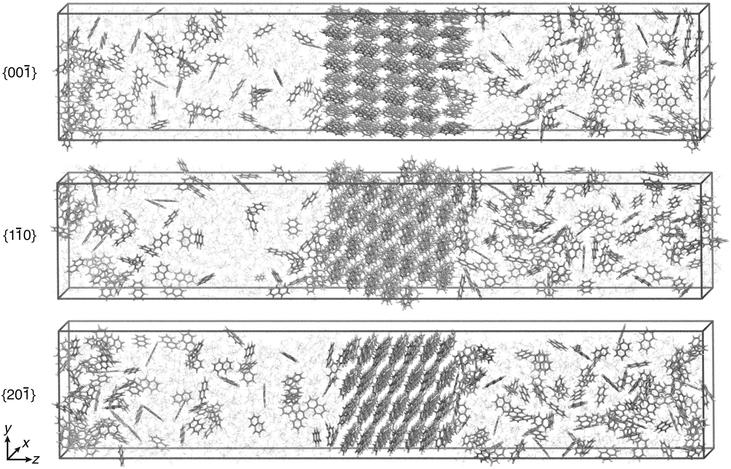 | ||
Fig. 4 Simulation box visualization of the biased simulation setups for the three faces, {00![[1 with combining macron]](https://www.rsc.org/images/entities/char_0031_0304.gif) }, {1 }, {1![[1 with combining macron]](https://www.rsc.org/images/entities/char_0031_0304.gif) 0}, and {20 0}, and {20![[1 with combining macron]](https://www.rsc.org/images/entities/char_0031_0304.gif) }. Ethanol molecules are shown in faded colors. The visual molecular dynamics (VMD) software was used to visualize the trajectories and prepare the images.34 }. Ethanol molecules are shown in faded colors. The visual molecular dynamics (VMD) software was used to visualize the trajectories and prepare the images.34 | ||
During the course of the simulation, the crystal slab can experience a small random displacement. This can affect the determination of the position of the growing layer. To avoid this, the position of the center of mass of the two inner crystal layers was constrained using a harmonic potential. Further details can be found in the ESI.†
3 Results
3.1 Steady state crystal shapes
The goal of this work is to predict the steady state crystal shape of naphthalene grown from an ethanol solution. The first step in this direction is to calculate the free energy barrier, , for the growth of each face.11 We shall calculate
  from the WTMetaD simulations.
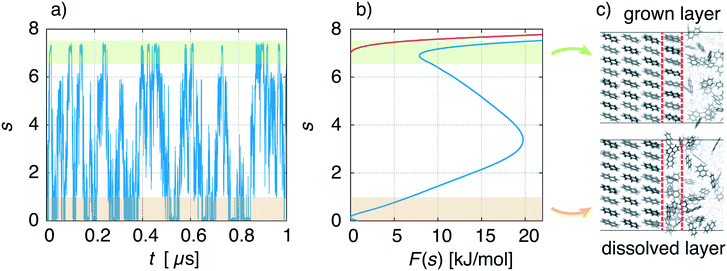
We describe a typical simulation taking as example the face {00![[1 with combining macron]](https://www.rsc.org/images/entities/char_0031_0304.gif) } at concentration C = 1.5 nm−3. In Fig. 5a, we show the time evolution of the CV used in WTMetaD, namely s. During the simulation the system explores configurations in which the crystal layer is grown and dissolved. This should be compared to a standard MD simulation in which the system would remain for a much longer time in the dissolved state. From the simulation, the FES can be calculated using eqn (4) and is shown in Fig. 5b (blue curve). As expected, F(s) shows two minima that correspond to the grown and dissolved states. To improve sampling a wall potential was imposed to prevent the growth of the full layer. The wall potential is shown as a red curve in Fig. 5b (see ESI† for details). Representative simulation box snapshots for the two minima are shown in Fig. 5c.
} at concentration C = 1.5 nm−3. In Fig. 5a, we show the time evolution of the CV used in WTMetaD, namely s. During the simulation the system explores configurations in which the crystal layer is grown and dissolved. This should be compared to a standard MD simulation in which the system would remain for a much longer time in the dissolved state. From the simulation, the FES can be calculated using eqn (4) and is shown in Fig. 5b (blue curve). As expected, F(s) shows two minima that correspond to the grown and dissolved states. To improve sampling a wall potential was imposed to prevent the growth of the full layer. The wall potential is shown as a red curve in Fig. 5b (see ESI† for details). Representative simulation box snapshots for the two minima are shown in Fig. 5c.
Although F(s) exhibits a free energy barrier, we decided to calculate the height of the barrier using a CV with a clear physical interpretation. For this reason, we reweighted21 our results to calculate the FES as a function of sslc, which approximates the number of crystalline molecules in the growing layer. In Fig. 6, we show F(sslc) for all simulations, and the corresponding values of the  are summarized in Table 1. For both concentrations,
  is substantially larger than
  and
and  . Furthermore,
  is less sensitive to changes in concentration than
  and ΔF{20
![[1 with combining macron]](https://www.rsc.org/images/entities/char_0031_0304.gif) }. For face {00
}. For face {00![[1 with combining macron]](https://www.rsc.org/images/entities/char_0031_0304.gif) }, the free energy barriers differ between the two concentrations by ∼2.4 kJ mol−1, while for faces {11
}, the free energy barriers differ between the two concentrations by ∼2.4 kJ mol−1, while for faces {11![[0 with combining macron]](https://www.rsc.org/images/entities/char_0030_0304.gif) } and {20
} and {20![[1 with combining macron]](https://www.rsc.org/images/entities/char_0031_0304.gif) } the free energy barriers differ by ∼5.0 kJ mol−1.
} the free energy barriers differ by ∼5.0 kJ mol−1.
 | ||
| Fig. 6 Free energy, F(sslc), in dependence of crystallinity of the crystal surface, sslc. Green denotes the concentration at C = 1.2 nm−3, and purple denotes the concentration at C = 1.5 nm−3. | ||
It is important to note, that the sampled  are strongly affected by the finite size effects.8 In a small system, such as the one used in this work, the periodic boundary conditions of the simulation box induce an artificial stabilization of the emerging 2D nucleus on the surface of the crystal. This leads to an underestimation of the critical 2D nucleus size and as a consequence an underestimation of
  . It is however possible to obtain trends which are consistent with experiments as shown in the following. Also one has to point out that here we are interested in the relative behaviors and we expect that finite size effects cancel out approximately.
Now since we have the free energy barriers, we can compute the relative growth rates for each face and concentration. For the subsequent analysis we shall assume that all faces grow at the chosen supersaturations in the 2D nucleation regime. The perpendicular growth rate of a face {hkl} growing by 2D nucleation can be written as13,45
 | (13) |
 | (14) |
According to Chernov,12,47 the crystal morphology in a typical crystallization environment is determined by the crystal growth kinetics. The ratio of the perpendicular distances of faces {hkl} and {h′k′l′} from the center of mass of the crystal, H{hkl} and H{h′k′l′}, is proportional to the ratio of the growth rates of the two faces, v{hkl} and v{h′k′l′}
 | (15) |
With the ratios H{hkl}/H{h′k′l′}, the steady state crystal shape can be estimated for each supersaturation by solving a system of plane equations in the Cartesian coordinates.48
For both concentrations, the predicted crystal shape is a wafer-thin rhombic prism, as shown in Fig. 7 for C = 1.2 nm−3. The blue colored large surface corresponds to the slow growing {00![[1 with combining macron]](https://www.rsc.org/images/entities/char_0031_0304.gif) } face, while the red colored thin surfaces correspond to the fast growing {1
} face, while the red colored thin surfaces correspond to the fast growing {1![[1 with combining macron]](https://www.rsc.org/images/entities/char_0031_0304.gif) 0} face. The very fast growing {20
0} face. The very fast growing {20![[1 with combining macron]](https://www.rsc.org/images/entities/char_0031_0304.gif) } face is not present in the resulting steady state crystal shapes.
} face is not present in the resulting steady state crystal shapes.
 | ||
Fig. 7 Steady state crystal shape obtained from simulation at C = 1.2 nm−3. The blue colored large surface corresponds to face {00![[1 with combining macron]](https://www.rsc.org/images/entities/char_0031_0304.gif) } and the red colored thin surfaces correspond to face {1 } and the red colored thin surfaces correspond to face {1![[1 with combining macron]](https://www.rsc.org/images/entities/char_0031_0304.gif) 0}. 0}. | ||
The activation energy barrier changes more rapidly with supersaturation for face {1![[1 with combining macron]](https://www.rsc.org/images/entities/char_0031_0304.gif) 0} than for face {00
0} than for face {00![[1 with combining macron]](https://www.rsc.org/images/entities/char_0031_0304.gif) }. Consequently, the ratio H{1
}. Consequently, the ratio H{1![[1 with combining macron]](https://www.rsc.org/images/entities/char_0031_0304.gif) 0}/H{00
0}/H{00![[1 with combining macron]](https://www.rsc.org/images/entities/char_0031_0304.gif) } is about three times larger for C = 1.5 nm−3 than for C = 1.2 nm−3. Therefore the rhombic prism is about three times thinner for this higher concentration.
} is about three times larger for C = 1.5 nm−3 than for C = 1.2 nm−3. Therefore the rhombic prism is about three times thinner for this higher concentration.
The experimental steady state crystal shape at high supersaturation reported by Lovette et al. in ref. 13 shows a wafer-thin rhombic prism. Only faces {00![[1 with combining macron]](https://www.rsc.org/images/entities/char_0031_0304.gif) } and {1
} and {1![[1 with combining macron]](https://www.rsc.org/images/entities/char_0031_0304.gif) 0} are present and face {1
0} are present and face {1![[1 with combining macron]](https://www.rsc.org/images/entities/char_0031_0304.gif) 0} grows much faster in comparison to face {00
0} grows much faster in comparison to face {00![[1 with combining macron]](https://www.rsc.org/images/entities/char_0031_0304.gif) }. These trends are captured well by the simulation result at C = 1.2 nm−3.
}. These trends are captured well by the simulation result at C = 1.2 nm−3.
3.2 Growth mechanisms
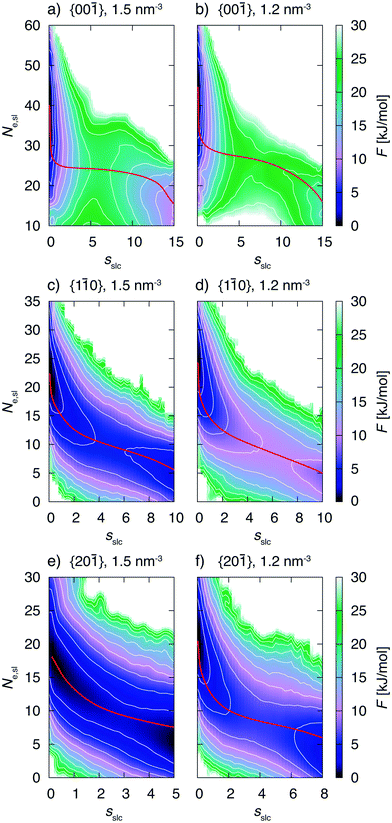
The biased simulations also allow to gain insight into the details of the growth mechanism. One should keep in mind that the simulations were performed with small surface areas exhibiting finite size effects. However, here again we are interested into trends which are expected to be the same for larger system sizes. Fig. 8 shows the free energy surface, F, as a function of the CV sslc, that approximates the number of crystalline naphthalene molecules in the surface layer, and CV Ne,sl, i.e. the number of ethanol molecules residing in the surface layer.We shall focus on the growth mechanism of face {00![[1 with combining macron]](https://www.rsc.org/images/entities/char_0031_0304.gif) } first (see for instance Fig. 8a). The dissolved free energy minimum is strongly oriented along the Ne,sl axis. Therefore the system will experience fluctuations in the number of ethanol molecules in the surface before starting to form a crystalline 2D nucleus. Of course, the number of naphthalene molecules in the surface is anticorrelated to the number of naphthalene molecules in the same region. Indeed, we observe in the simulation trajectories that an amorphous agglomerate of naphthalene molecules appears before the onset of crystallinity. Only at a subsequent stage the system surmounts the barrier in the sslc axis thus forming a crystalline 2D cluster that grows spontaneously.
} first (see for instance Fig. 8a). The dissolved free energy minimum is strongly oriented along the Ne,sl axis. Therefore the system will experience fluctuations in the number of ethanol molecules in the surface before starting to form a crystalline 2D nucleus. Of course, the number of naphthalene molecules in the surface is anticorrelated to the number of naphthalene molecules in the same region. Indeed, we observe in the simulation trajectories that an amorphous agglomerate of naphthalene molecules appears before the onset of crystallinity. Only at a subsequent stage the system surmounts the barrier in the sslc axis thus forming a crystalline 2D cluster that grows spontaneously.
From these observations we conclude that this face grows through a two step mechanism. The first step is characterized by the formation of an amorphous agglomerate of naphthalene molecules while during the second step the molecules order into the crystalline lattice. This mechanism can be observed for both concentrations, see Fig. 8a and b. The minimum free energy path for the transformation is presented in red in the FES and is compatible with the description given above. The nudged elastic band method49 was used for the calculation of the minimum free energy paths.
Now we turn to describe faces {1![[1 with combining macron]](https://www.rsc.org/images/entities/char_0031_0304.gif) 0} and {20
0} and {20![[1 with combining macron]](https://www.rsc.org/images/entities/char_0031_0304.gif) } that exhibit a growth mechanism different from the one of face {00
} that exhibit a growth mechanism different from the one of face {00![[1 with combining macron]](https://www.rsc.org/images/entities/char_0031_0304.gif) }. We analyze in particular Fig. 8c. In this case the decrease in the number of ethanol molecules in the surface occurs concomitantly with the increase in the number of crystalline naphthalene molecules. This is confirmed by the atomistic trajectories in which we also observe that as soon as naphthalene molecules reach the surface, they simultaneously tend to orient according to the crystal lattice. This description is compatible with a one step mechanism different from the scenario in face {00
}. We analyze in particular Fig. 8c. In this case the decrease in the number of ethanol molecules in the surface occurs concomitantly with the increase in the number of crystalline naphthalene molecules. This is confirmed by the atomistic trajectories in which we also observe that as soon as naphthalene molecules reach the surface, they simultaneously tend to orient according to the crystal lattice. This description is compatible with a one step mechanism different from the scenario in face {00![[1 with combining macron]](https://www.rsc.org/images/entities/char_0031_0304.gif) }. From the minimum free energy paths presented in red in Fig. 8 the two different growth mechanisms can be clearly distinguished.
}. From the minimum free energy paths presented in red in Fig. 8 the two different growth mechanisms can be clearly distinguished.
4 Conclusions
In this work, we have used molecular dynamics to predict the steady state crystal shape of naphthalene grown from ethanol solution at two different supersaturations. We calculated the free energy barriers for the growth of faces {00![[1 with combining macron]](https://www.rsc.org/images/entities/char_0031_0304.gif) }, {1
}, {1![[1 with combining macron]](https://www.rsc.org/images/entities/char_0031_0304.gif) 0}, and {20
0}, and {20![[1 with combining macron]](https://www.rsc.org/images/entities/char_0031_0304.gif) } using well-tempered metadynamics. In order to mimic the experimental conditions the simulations were performed at constant supersaturation using the CμMD algorithm.16 From the free energy barriers we could estimate the relative growth rates and with them we predicted the steady state crystal shape. The resulting crystal shape is a wafer-thin rhombic prism, where only the {00
} using well-tempered metadynamics. In order to mimic the experimental conditions the simulations were performed at constant supersaturation using the CμMD algorithm.16 From the free energy barriers we could estimate the relative growth rates and with them we predicted the steady state crystal shape. The resulting crystal shape is a wafer-thin rhombic prism, where only the {00![[1 with combining macron]](https://www.rsc.org/images/entities/char_0031_0304.gif) } and {1
} and {1![[1 with combining macron]](https://www.rsc.org/images/entities/char_0031_0304.gif) 0} faces are present and the former face grows considerably slower. These predictions are in line with experiments.
0} faces are present and the former face grows considerably slower. These predictions are in line with experiments.
We identified two different growth mechanisms. For the {00![[1 with combining macron]](https://www.rsc.org/images/entities/char_0031_0304.gif) } face, a two step nucleation was observed in which an amorphous agglomerate of naphthalene molecules has to form before the molecules arrange into the crystalline lattice. For the {1
} face, a two step nucleation was observed in which an amorphous agglomerate of naphthalene molecules has to form before the molecules arrange into the crystalline lattice. For the {1![[1 with combining macron]](https://www.rsc.org/images/entities/char_0031_0304.gif) 0} and {20
0} and {20![[1 with combining macron]](https://www.rsc.org/images/entities/char_0031_0304.gif) } faces the growth occurs with a concerted agglomeration and orientation of naphthalene molecules in the crystalline 2D nucleus.
} faces the growth occurs with a concerted agglomeration and orientation of naphthalene molecules in the crystalline 2D nucleus.
The framework developed to enhance the growth of a single naphthalene crystal layer under constant supersaturation can be adapted to study the growth of more complicated organic molecules like APIs.
Conflicts of interest
There are no conflicts to declare.Acknowledgements
Z. B. and M. M. are thankful for the financial support provided by Novartis Pharma AG, Lichtstrasse 35, 4056 Basel, Switzerland. P. M. P., T. K. and M. P. acknowledge support from the NCCR MARVEL funded by the Swiss National Science Foundation and from European Union Grant No. ERC-2014-AdG-670227/VARMET. Z. B. would like to thank Matteo Salvalaglio, Dan Mendels, Claudio Perego, and Riccardo Capelli for valuable discussions. Z. B. thanks GiovanniMaria Piccini for supplying the code used to calculate the minimum free energy paths presented in Fig. 8. The computational resources were provided by ETH Zürich and the Swiss Center for Scientific Computing at the Euler Cluster.References
- D. Winn and M. F. Doherty, AIChE J., 2000, 46, 1348–1367 CrossRef CAS.
- J. Li, C. J. Tilbury, S. H. Kim and M. F. Doherty, Prog. Mater. Sci., 2016, 82, 1–38 CrossRef CAS.
- X. Y. Llu, E. S. Boekt, W. J. Brlels and P. Bennema, Nature, 1995, 374, 342–345 CrossRef.
- D. Winn and M. F. Doherty, Chem. Eng. Sci., 2002, 57, 1805–1813 CrossRef CAS.
- S. Piana and J. D. Gale, J. Am. Chem. Soc., 2005, 127, 1975–1982 CrossRef CAS PubMed.
- S. Piana, F. Jones and J. D. Gale, J. Am. Chem. Soc., 2006, 128, 13568–13574 CrossRef CAS PubMed.
- J. Chen and B. L. Trout, Cryst. Growth Des., 2010, 10, 4379–4388 CrossRef CAS.
- M. Salvalaglio, T. Vetter, F. Giberti, M. Mazzotti and M. Parrinello, J. Am. Chem. Soc., 2012, 134, 17221–17233 CrossRef CAS PubMed.
- T. Karmakar, P. M. Piaggi, C. Perego and M. Parrinello, J. Chem. Theory Comput., 2018, 14, 2678–2683 CrossRef CAS PubMed.
- D. Han, T. Karmakar, Z. Bjelobrk, J. Gong and M. Parrinello, Chem. Eng. Sci., 2019 DOI:10.1016/j.ces.2018.10.022.
- M. Salvalaglio, T. Vetter, M. Mazzotti and M. Parrinello, Angew. Chem., Int. Ed., 2013, 52, 13369–13372 CrossRef CAS PubMed.
- A. A. Chernov, Sov. Phys. Crystallogr., 1962, 7, 728–730 Search PubMed.
- M. A. Lovette and M. F. Doherty, Cryst. Growth Des., 2012, 12, 656–669 CrossRef CAS.
- R. F. P. Grimbergen, M. F. Reedijk, H. Meekes and P. Bennema, J. Phys. Chem. B, 1998, 102, 2646–2653 CrossRef CAS.
- A. Barducci, G. Bussi and M. Parrinello, Phys. Rev. Lett., 2008, 100, 020603 CrossRef PubMed.
- C. Perego, M. Salvalaglio and M. Parrinello, J. Chem. Phys., 2015, 142, 144113 CrossRef CAS PubMed.
- G. M. Torrie and J. P. Valleau, J. Comput. Phys., 1977, 23, 187–199 CrossRef.
- E. Darve and A. Pohorille, J. Chem. Phys., 2001, 115, 9169 CrossRef CAS.
- E. Schneider, L. Vogt and M. E. Tuckerman, Acta Crystallogr., Sect. B: Struct. Sci., Cryst. Eng. Mater., 2016, 72, 542–550 CrossRef CAS PubMed.
- O. Valsson, P. Tiwary and M. Parrinello, Annu. Rev. Phys. Chem., 2016, 67, 159–184 CrossRef CAS PubMed.
- P. Tiwary and M. Parrinello, J. Phys. Chem. B, 2015, 119, 736–742 CrossRef CAS PubMed.
- E. E. Santiso and B. L. Trout, J. Chem. Phys., 2011, 134, 064109 CrossRef PubMed.
- C. Micheletti, A. Laio and M. Parrinello, Phys. Rev. Lett., 2004, 92, 170601 CrossRef PubMed.
- Y. Crespo, F. Marinelli, F. Pietrucci and A. Laio, Phys. Rev. E: Stat., Nonlinear, Soft Matter Phys., 2010, 81, 055701 CrossRef PubMed.
- D. Branduardi, G. Bussi and M. Parrinello, J. Chem. Theory Comput., 2012, 8, 2247–2254 CrossRef CAS PubMed.
- J. Wang, R. M. Wolf, J. W. Caldwell, P. A. Kollman and D. A. Case, J. Comput. Chem., 2004, 25, 1157–1174 CrossRef CAS PubMed.
- J. Wang, W. Wang, P. A. Kollman and D. A. Case, J. Mol. Graphics Modell., 2006, 25, 247–260 CrossRef CAS PubMed.
- C. I. Bayly, P. Cieplak, W. Cornell and P. A. Kollman, J. Phys. Chem., 1993, 97, 10269–10280 CrossRef CAS.
- M. J. Frisch, G. W. Trucks, H. B. Schlegel, G. E. Scuseria, M. A. Robb, J. R. Cheeseman, G. Scalmani, V. Barone, B. Mennucci, G. A. Petersson, H. Nakatsuji, M. Caricato, X. Li, H. P. Hratchian, A. F. Izmaylov, J. Bloino, G. Zheng, J. L. Sonnenberg, M. Hada, M. Ehara, K. Toyota, R. Fukuda, J. Hasegawa, M. Ishida, T. Nakajima, Y. Honda, O. Kitao, H. Nakai, T. Vreven, J. A. Montgomery, J. E. Peralta, F. Ogliaro, M. Bearpark, J. J. Heyd, E. Brothers, K. N. Kudin, V. N. Staroverov, R. Kobayashi, J. Normand, K. Raghavachari, A. Rendell, J. C. Burant, S. S. Iyengar, J. Tomasi, M. Cossi, N. Rega, J. M. Millam, M. Klene, J. E. Knox, J. B. Cross, V. Bakken, C. Adamo, J. Jaramillo, R. Gomperts, R. E. Stratmann, O. Yazyev, A. J. Austin, R. Cammi, C. Pomelli, J. W. Ochterski, R. L. Martin, K. Morokuma, V. G. Zakrzewski, G. A. Voth, P. Salvador, J. J. Dannenberg, S. Dapprich, A. D. Daniels, O. Farkas, J. B. Foresman, J. V. Ortiz, J. Cioslowski and D. J. Fox, Gaussian 09, Revision B.01, 2009 Search PubMed.
- A. W. Sousa da Silva and W. F. Vranken, BMC Res. Notes, 2012, 5, 367 CrossRef PubMed.
- D. W. J. Cruickshank, Acta Crystallogr., 1957, 10, 504–508 CrossRef CAS.
- D. H. Andrews, G. Lynn and J. Johnston, J. Am. Chem. Soc., 1926, 48, 1274–1287 CrossRef CAS.
- D. van der Spoel, P. J. van Maaren and C. Caleman, Bioinformatics, 2012, 28, 752–753 CrossRef CAS PubMed.
- W. Humphrey, A. Dalke and K. Schulten, J. Mol. Graphics, 1996, 14, 33–38 CrossRef CAS PubMed.
- H. J. C. Berendsen, D. van der Spoel and R. van Drunen, Comput. Phys. Commun., 1995, 91, 43–56 CrossRef CAS.
- E. Lindahl, B. Hess and D. van der Spoel, J. Mol. Model., 2001, 7, 306–317 CrossRef CAS.
- D. van der Spoel, E. Lindahl, B. Hess, G. Groenhof, A. E. Mark and H. J. C. Berendsen, J. Comput. Chem., 2005, 26, 1701–1718 CrossRef CAS PubMed.
- B. Hess, C. Kutzner, D. van der Spoel and E. Lindahl, J. Chem. Theory Comput., 2008, 4, 435–447 CrossRef CAS PubMed.
- M. J. Abraham, T. Murtola, R. Schulz, S. Pall, J. C. Smith, B. Hess and E. Lindahl, SoftwareX, 2015, 1–2, 19–25 CrossRef.
- G. A. Tribello, M. Bonomi, D. Branduardi, C. Camilloni and G. Bussi, Comput. Phys. Commun., 2014, 182, 604–613 CrossRef.
- G. Bussi, T. Zykova-Timan and M. Parrinello, J. Chem. Phys., 2009, 130, 074101 CrossRef PubMed.
- T. Darden, D. York and L. Pedersen, J. Chem. Phys., 1993, 98, 10089–10092 CrossRef CAS.
- B. Hess, J. Chem. Theory Comput., 2008, 4, 116–122 CrossRef CAS PubMed.
- M. Parrinello and A. Rahman, J. Appl. Phys., 1981, 52, 7182–7190 CrossRef CAS.
- X.-Y. Liu and P. Bennema, Phys. Rev. B: Condens. Matter Mater. Phys., 1996, 53, 2314–2325 CrossRef CAS.
- S. Arrhenius, Z. Phys. Chem., 1889, 4, 226–248 Search PubMed.
- M. A. Lovette, A. R. Browning, D. W. Griffin, J. P. Sizemore, R. C. Snyder and M. F. Doherty, Ind. Eng. Chem. Res., 2008, 47, 9812–9833 CrossRef CAS.
- Y. Zhang, J. P. Sizemore and M. F. Doherty, AIChE J., 2006, 52, 1906–1915 CrossRef CAS.
- G. Henkelman and H. Jonsson, J. Chem. Phys., 2000, 113, 9978–9985 CrossRef CAS.
Footnote |
| † Electronic supplementary information (ESI) available. See DOI: 10.1039/c9ce00380k |
| This journal is © The Royal Society of Chemistry 2019 |


