 Open Access Article
Creative Commons Attribution 3.0 Unported Licence
Rheology of cubic particles suspended in a Newtonian fluid†
Colin D.
Cwalina
,
Kelsey J.
Harrison
and
Norman J.
Wagner
*
Department of Chemical and Biomolecular Engineering, Center for Molecular Engineering and Thermodynamics, University of Delaware, Newark, DE 19716, USA. E-mail: wagnernj@udel.edu
First published on 18th April 2016
Abstract
Many real-world industrial processes involve non-spherical particles suspended in a fluid medium. Knowledge of the flow behavior of these suspensions is essential for optimizing their transport properties and designing processing equipment. In the present work, we explore and report on the rheology of concentrated suspensions of cubic-shaped colloidal particles under steady and dynamic shear flow. These suspensions exhibit a rich non-Newtonian rheology that includes shear thickening and normal stress differences at high shear stresses. Scalings are proposed to connect the material properties of these suspensions of cubic particle to those measured for suspensions of spherical particles. Negative first normal stress differences indicate that lubrication hydrodynamic forces dominate the stress in the shear-thickened state. Accounting for the increased lubrication hydrodynamic interactions between the flat surfaces of the cubic particles allows for a quantitative comparison of the deviatoric stress in the shear-thickened state to that of spherical particles. New semi-empirical models for the viscosity and normal stress difference coefficients are presented for the shear-thickened state. The results of this study indicate that cubic particles offer new and unique opportunities to formulate colloidal dispersions for field-responsive materials.
1. Introduction
The viscosity of suspensions at low particle concentrations can be expressed as an expansion in the particle volume fraction as:1| ηr = 1 + kEϕ + kHϕ2 + higher order terms | (1) |
Brownian motion within a hard-sphere dispersion leads to a rich non-Newtonian rheology that includes shear thickening at high shear stresses.7,8 The onset of shear thickening in these suspensions is well-established to be a stress-controlled phenomenon.9–11 Shear thickening is a direct consequence of the flow-induced microstructure12–15 that results in large lubrication stresses between particles. For Brownian hard-sphere dispersions, in the limit of large Péclet (Pe) number, the theory of Brady and Morris16 predicts the emergence of a shear-thickened state. Such a state was confirmed to exist by the experiments of Cwalina and Wagner,8 and the viscosity of the shear-thickened state was modeled using the Eilers equation with a maximum particle volume fraction of ϕmax = 0.54. Indeed, Cwalina and Wagner8 demonstrated that the semi-empirical model of Morris and Boulay17 quantitatively captured the scaling of the deviatoric stress in the shear-thickened state by modeling it as that of a non-Brownian suspension comprised of ‘hydroclusters’, which are stress-induced density fluctuations driven by lubrication hydrodynamic interactions. Simulations by Morris and co-workers have demonstrated that the introduction of particle inertia18,19 and interparticle friction in addition to lubrication hydrodynamics can enhance the shear thickening response.20
While the hard-sphere suspension has historically received much theoretical, experimental, and computational attention, many suspensions used in industrial applications consist of non-spherical particles such as fibers, disks, spheroids, etc. For a review of the rheology of these suspensions containing non-spherical particles, see Mewis and Wagner.21 Recently, there has been a significant advance in the ability to synthesize cubic particles with a variety of surface chemistries.22–40 This emerging class of particles contains facets as well as sharp edges and corners. These shape features alter the fluid velocity and pressure fields around the particle, and as such, should directly affect the measured rheology.
While the rheology of suspensions of anisotropic particles has been of significant technological and scientific interest (see, for example Egres and Wagner,41 and for an overview, see Chapter 5 of Mewis and Wagner21), the flow behavior of suspensions of cubic particles has only recently begun to be investigated. Simulations and experiments by Mallavajula et al.42 examined the fluid flow around a cubic particle and the resulting suspension rheology in the dilute limit. The authors calculated an Einstein coefficient of 3.1, which is larger than the value of 2.5 for hard-spheres. The authors confirmed this result experimentally using dispersions of Fe3O4 nanocubes (kE = 3.1 ± 0.2) and the Einstein coefficient was shown to be independent of the particle size and size distribution. Audus et al.43 employed three different computational methods and obtained very similar results. Vickers and co-workers44 measured the steady shear rheology of a limited number of concentrated suspensions consisting of near monodisperse Co3O4 nanocubes. Shear thinning and shear thickening were observed at low and high Pe numbers, respectively. Finally, recent experimental work by Royer et al.45 on suspensions of ‘superballs’, which are cube-like distortions of spheres, yielded a value of 2.54 for the Einstein coefficient, demonstrating that rounding of the edges and corners can lead to an Einstein coefficient only marginally higher than that for hard-spheres. At higher packing fractions, these superballs also exhibited shear thickening under steady shear. However, as we will demonstrate here, the lack of truly flat surfaces for superballs leads to a rheological response more akin to spherical particle suspensions.
The objective of the present work is to expand our understanding of the rheology of suspensions containing cubic particles, particularly at higher volume fractions where shear thickening is evident. Suspensions of industrially produced cubic particles are formulated and characterized. Measurements were made under steady and oscillatory shear, along with the first measurements of the normal stress differences in the shear-thickened state for suspensions of cubic particles. The material properties of these suspensions of cubic particles in a Newtonian fluid are compared to those of suspensions of spherical particles, with emphasis on the apparent high shear plateau and shear-thickened state.8 Importantly, the sensitivity of the suspension rheology to particle shape is explored by contrasting the results of the present study with those of a recent investigation by Royer et al.45 of superball suspensions.
2. Experimental section
Materials
Cubic aluminosilicate zeolite particles (Advera® 401) were obtained from PQ Corporation (Philadelphia, PA) and suspended in a Newtonian fluid (ηf = 0.05 Pa s at 25 °C) of polyethylene glycol [average molecular weight = 200] (PEG-200) from Sigma-Aldrich (Allentown, PA). The SEM image in Fig. 1 reveals the nature of the particle shape, which includes facets and edges. The particles are polydisperse, with an edge length (l) distribution reported by the manufacturer to be: l10 = 1.3 μm, l50 = 3.0 μm, l90 = 5.8 μm.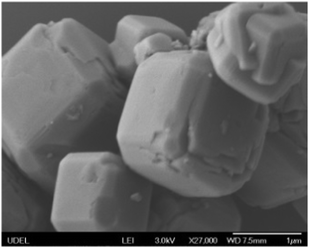 | ||
| Fig. 1 SEM image of cubic aluminosilicate zeolite particles used in this study. The scale bar in the lower right is 1 μm. | ||
There are numerous approaches used in the literature to determine the particle volume fraction in suspension.46 In the present work, we measured the particle skeletal density in suspension through densitometry using an Anton Paar Densitometer DMA 4500 M. For ideal mixing, the suspension density is related to the particle mass fraction, Xparticle, as:
 | (2) |
 vs. Xparticle will be linear, and the particle skeletal density in suspension can be extracted from the slope. We report the measured suspension density for several dilute particle concentrations in Fig. 2. From this data, we measured the particle skeletal density to be 2.16 g cm−3. All suspensions were prepared gravimetrically from a concentrated mother suspension, also prepared gravimetrically, by dilution with the suspending fluid. Reported volume fractions were calculated from the measured mass fractions and particle density in suspension.
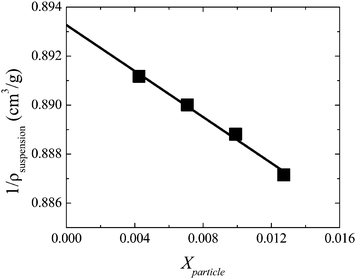 | ||
| Fig. 2 Reciprocal suspension density as a function of the particle mass fraction for several dilute suspensions of cubic particles. | ||
Rheological characterization
Stress-controlled rheometry was performed using an AR-2000 Rheometer from TA Instruments (New Castle, DE) with a 40 mm 2° cone and plate tooling at 25 °C. An additional set of normal force measurements were obtained for a select number of suspensions using a 40 mm 2° cone and plate and a 40 mm parallel plate on a Discovery Hybrid Rheometer (DHR-3) from TA Instruments. The Force Rebalance Transducer of the DHR-3 provides a normal force sensitivity of 0.005 N and a normal force resolution of 0.5 mN. The effect of inertia on the normal force measurements was accounted for using the correction of Turian.47 Validation of this correction for the suspensions considered in this work can be found in the ESI.† In this work we follow methods documented in a recent study of measuring normal forces using a combination of cone and plate and parallel plate rheometry.8 The largest particle Reynolds number encountered during measurement was on the order of 10−3, thus meeting the criterion for Stokes flow.3. Results and discussion
Dilute and semi-dilute suspensions
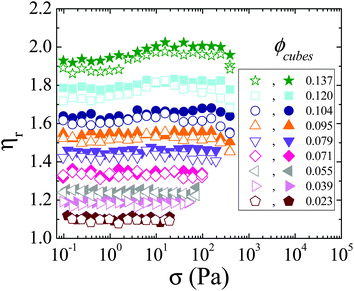
The steady shear viscosity curves for volume fractions ranging from 0.023 to 0.137 are shown in Fig. 3. At the lowest concentrations, the measurements are almost entirely reversible and the steady shear viscosity is nearly Newtonian over a range of shear stresses that spans several orders of magnitude. As the particle concentration increases, a very small but consistent hysteresis is observed. For a given volume fraction, the magnitude of the relative viscosity is taken to be the average value measured across the range of shear stresses probed in both the ascending and descending directions.Eqn (1) can be rearranged into the follow form:
 | (3) |
 versus ϕ, kE and kH can be extracted from the y-intercept and slope, respectively. The values of kE and kH for these cubic particle suspensions are regressed from Fig. 4 to be 3.5 ± 0.3 and 23.7 ± 3.0, respectively. The suspension relative viscosity is also plotted in Fig. 4 as a function of the volume fraction. Beyond a volume fraction of about 0.025, the inclusion of the order ϕ2 term is necessary to capture the concentration dependence of the viscosity. The value of the Einstein coefficient measured for the suspensions in this study is above that for hard-sphere suspensions (2.5) and slightly larger than that predicted for perfect hard cubes (3.1). The value of the Huggins coefficient for the cubic particle suspensions is significantly larger than that for hard-sphere suspensions with (6.0) and without (5.0) Brownian motion. At the present time, there is no theory for the value of the Huggins coefficient for cubic particles with which to compare. However, the higher value of kH can be anticipated as the particles at not index-matched such that moderate attractive dispersion forces are expected.
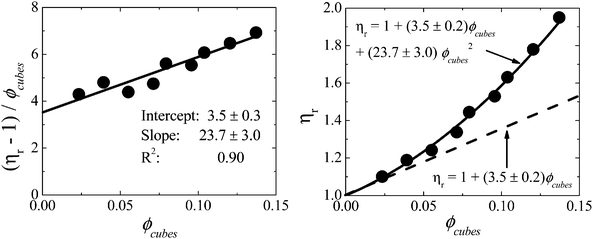 | ||
| Fig. 4 (Left) Data analyzed according to eqn (3) with values of kE and kH extracted from the y-intercept and slope, respectively. (Right) Concentration dependence of the suspension viscosity in the dilute and semi-dilute concentration regimes. The dashed line contains the isolated particle contribution to the suspension viscosity and the solid line contains the additional ϕ2 dependence outside the dilute regime. | ||
Concentrated suspensions
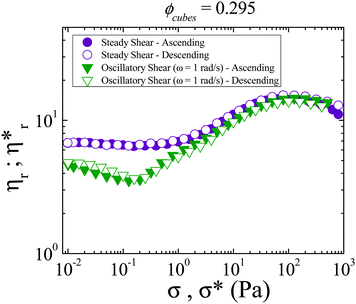
The rich rheology of a more concentrated ϕcubes = 0.295 suspension is displayed in Fig. 5. The rheology at this particular volume fraction will be discussed as an illustrative example with a larger data library including a range of concentrations to be discussed later. The qualitative features of the rheology at this particular volume fraction are characteristic of the behavior of the other concentrated suspensions. Under steady shear, the viscosity is essentially Newtonian up until an applied shear stress of about σ = 1 Pa, with shear thickening evident at larger shear stresses. Note that a characteristic stress from Brownian motion, σB, can be defined as , which is of order 10−4 and thus, all rheological measurements are at a comparatively high relative stress or Péclet number. The viscosity reaches a maximum value in a plateau regime around σ = 100 Pa. This constant viscosity plateau is characteristic of the shear-thickened state predicted from theory6,16 and observed experimentally by Cwalina and Wagner8 for dispersions of spherical colloids in a Newtonian fluid. While there is currently no theory that predicts the existence of a shear-thickened state for suspensions of cubic particles in a Newtonian fluid, the empirical observations here suggest that indeed a shear-thickened state exists for this class of suspensions. The shear-thickened state is followed by a shear thinning regime at even higher stresses. The weak shear thinning behavior is characteristic of suspensions of anisotropic mineral particles41 and has been successfully described by elastohydrodynamic theory48 (see the ESI†).
In contrast to the steady shear viscosity, at low shear stress-amplitudes, the complex viscosity shows thinning followed by dynamic shear thickening evident at larger shear stress-amplitudes. The magnitude of the complex viscosity in the low stress regime (before the onset of shear thickening) is below that of the steady shear viscosity at comparable applied shear stresses and shear stress-amplitudes. This behavior is qualitatively similar to that reported previously for suspensions of spherical particles under oscillatory flow.49–59 McMullan and Wagner60 demonstrated through microstructure measurements that this decrease in the viscosity is the result of particle ordering facilitated by the oscillatory nature of the flow. It is not unreasonable to postulate that the decrease in the viscosity under oscillatory flow observed for these cubic particle suspensions is also due to particle ordering, although measurements of the microstructure under flow will be needed to confirm this. At large shear stresses and shear-stress amplitudes, the complex viscosity and steady shear viscosity are nearly coincident.
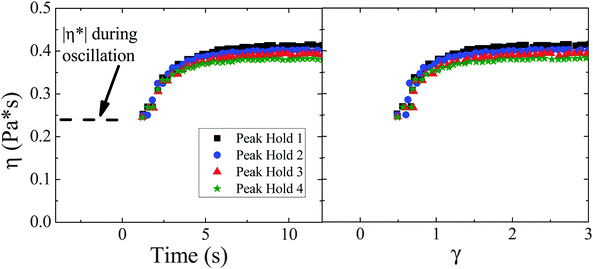
The transient flow behavior of these suspensions was investigated further in a series of steady shear creep experiments on the ϕcubes = 0.295 suspension. In the first set of experiments, the flow was switched repeatedly between a steady shear creep experiment at σ = 0.1 Pa and an oscillatory peak hold at σ* = 0.1 Pa and ω = 1 rad s−1. In Fig. 6, after 300 seconds of oscillation, a steady shear creep experiment at σ = 0.1 was imposed (time = 0). From measurements on a Newtonian standard (see the ESI†) of a comparable viscosity, it was found that measurements of the viscosity under 0.66 seconds after imposition of the steady shear stress were affected by instrument artifacts. Thus, only measurements of the viscosity after 0.66 seconds from the imposition of the steady shear creep experiment are shown for four replicate experiments. As seen from Fig. 6, the viscosity reaches steady state on a relatively short timescale corresponding to 2 strain units. This suggests the increase in viscosity upon switching from oscillatory to steady shear is due to an ‘order-to-disorder’ transition as studied previously for spherical particle suspensions by Hoffman.61
These steady shear creep experiments are contrasted with the experiments depicted in Fig. 7, where the imposition of the steady shear stress of σ = 0.1 Pa (again at time = 0) was performed after the sample was left on the rheometer overnight to allow for particle sedimentation. This experiment was performed in both a cone and plate (40 mm, 2°, 62 μm truncation gap) and parallel plate (40 mm, 500 μm gap) tooling. As seen from Fig. 7, the magnitude of the viscosity immediately after the imposition of steady shear is significantly below that of the previous experiment where the steady shear creep experiment was imposed after 300 s of oscillation. In the steady shear creep experiments at σ = 0.1 Pa after sedimentation, the viscosity never recovers its steady state value after 48 hours. Considering that the Shields number  , where Δρ is the density mismatch between particles and solvent, g is the gravitation constant, and D is the characteristic particle length scale, at this shear stress is of order 1, it is likely that the relatively equal competition between viscous and buoyant forces hinders any viscous resuspension.62,63 It is interesting to note the difference in the measured viscosity using a cone and plate tooling, which contains significant noise, and the parallel plate tooling, which has little variation in its value over a significant duration of time. The noise in the cone and plate data is anticipated to result from the fact that the local particle volume fraction under the truncated cone apex is higher than that outside of this region. In the parallel plate geometry, an even layer of sediment exists across the entire tooling and the particle volume fraction is uniform across the sample. Regardless of the tool geometry, the viscosity during the steady shear creep experiments after sedimentation is obviously below that measured after a small amplitude oscillation is performed for a relatively short duration of time (Fig. 6). Ultimately, this combined set of steady shear creep experiments after different initial conditions provides strong evidence that the decrease in the viscosity observed under oscillatory shear is a material property and not a result of any particle sedimentation.
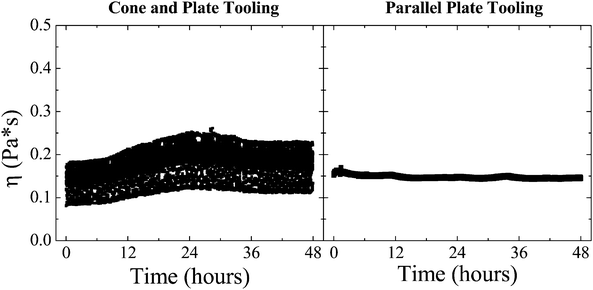 | ||
| Fig. 7 Viscosity measured for a ϕcubes = 0.295 suspension during a steady shear creep experiment at σ = 0.1 Pa following overnight sedimentation performed in cone and plate (left) and parallel plate (right) geometries. For comparison, the magnitude of the steady shear viscosity before sedimentation is given in Fig. 6. | ||
The steady shear viscosity and complex viscosity measured at ω = 1 rad s−1 as a function of the shear stress and shear stress-amplitude, respectively, are shown in Fig. 8 for a wide range of particle volume fractions. Above a critical value of the shear stress, the suspensions exhibit reversible shear thickening that becomes more pronounced with increasing volume fraction. Shear thickening in concentrated colloidal dispersions of spherical particles is well-known to be a stress-controlled phenomenon,9–11 and the results here indicate that shear thickening in these suspensions of cubic particles is likewise stress-controlled.
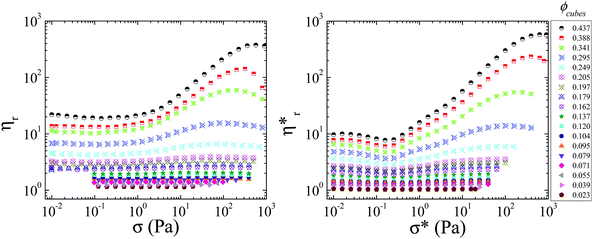 | ||
| Fig. 8 Steady shear viscosity as a function of the applied shear stress (left) and complex viscosity measured at 1 rad s−1 as a function of the applied shear stress-amplitude (right). All measurements were reversible, but only sweeps in the ascending direction are shown (see Fig. 5 for a demonstration of the reversibility). | ||
As witnessed in Fig. 5 for the ϕcubes = 0.295 suspension, the magnitude of the complex viscosity and steady shear viscosity differ in the low shear regime. To gain a possible mechanistic insight into this behavior, the divergence of the complex viscosity and steady shear viscosity was studied as a function of the cubic particle volume fraction. Under steady shear, the viscosity is essentially Newtonian prior to shear thickening. However, under oscillatory shear, there is noticeable thinning of the complex viscosity prior to the onset of dynamic shear thickening. As such, for the sake of consistency, the steady and dynamic “low shear” viscosity will be taken as the value of the viscosity at the onset of steady or dynamic shear thickening (i.e., at the critical shear stress or critical shear stress-amplitude). The steady and dynamic low shear viscosity is plotted as a function of the cubic particle concentration in Fig. 9.
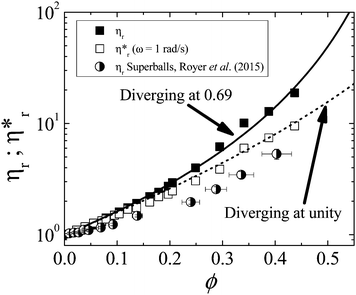 | ||
| Fig. 9 Low shear steady (closed) and complex (open) viscosity as a function of the volume fraction of cubic particles. The solid and dotted lines are fits to the steady shear viscosity and complex viscosity, respectively, using a modified Eilers equation with an adjustable power law exponent. The half-filled circles mark the low shear viscosity under steady shear for suspension of superballs as measured by Royer et al.45 | ||
A plethora of semi-empirical models exist for correlating the viscosity data for suspensions of spheres in Newtonian fluids. For a recent review see Faroughi and Huber.64 A common feature of many of these models is a power law divergence on approach to maximum packing with an exponent of −2. As we are probing the response of these suspensions at shear stresses well above the characteristic stress from Brownian motion, the viscosity is expected to be dominated by hydrodynamic interactions.65 The hydrodynamic theory of Brady66 predicts a divergence with a power law exponent of exactly −2 for the low shear viscosity of suspensions of spherical particles; however, we are unaware of any rigorous models suitable for cubic particles. Consequently, a broad range of models for suspensions of spheres were explored; however, none produced a satisfactory fit to the viscosity data for these cubic particles. To obtain a higher quality fit, the value of the power law exponent was permitted to be an additional adjustable parameter. The best fit to the data was obtained with a modified Eilers equation:
 | (4) |
Under steady shear, the viscosity diverges at a maximum packing fraction of 0.69 ± 0.01. This value of ϕmax is slightly above random close packing for monodisperse spheres, ϕRCP,spheres = 0.64, and below random close packing for monodisperse cubes, ϕRCP,cubes = 0.78.67 Given that the cubes are polydisperse and that ϕmax generally rises with increasing polydispersity, the value of ϕmax obtained for the suspensions of cubic particles suggests that, under steady shear, the cubes carve out an effective volume that corresponds to an equivalent sphere. This could be expected from the rotation and tumbling of the cubes in the flow, although future studies will be needed to investigate cubic particle motion under steady shear. That the divergence of the suspension viscosity under steady shear is slightly above that for random close packing of spheres could possibly be attributed to particle polydispersity and shape imperfections.
Under oscillatory flow, the low shear viscosity is found to diverge at a maximum packing fraction very close to unity, ϕmax = 0.99 ± 0.02. Some caution is in order as the extrapolation to obtain the maximum packing fraction will depend on the model used and the last data point fit to the model is fairly removed from the predicted volume fraction of the divergence. Nonetheless, this observation provides additional support for the ordering hypothesis under small amplitude oscillatory shear postulated previously. This suggests the cubes are aligned into ordered structures resembling layers of close-packed cubes. Given that these particles are polydisperse and have shape imperfections, it is not anticipated that these particles could form a space-filling structure and the actual maximum packing fraction is likely to be less than unity. Nevertheless, the propensity to order into layers would not be unexpected based on the previous work with spherical particle suspensions,60 which also show a tendency to order under large amplitude oscillatory flow. Measurements of the microstructure will be needed to confirm this behavior, but the results here suggest it may be possible to form tightly packed structures under oscillatory flow using cubic particles, which could have broad far-reaching applications.
Also included for comparison in Fig. 9 are the recent measurements of Royer et al.45 for suspensions of ‘superballs’. Such particles are intermediate between spheres and cubes with a three-dimensional shape in (x, y, z) space described by the equation:
| xm + ym + zm = am | (5) |
A similar analysis of the viscosity in the shear-thickened state was performed. The viscosity in the shear-thickened state was taken to be the maximum value attained before the onset of any shear thinning at the highest stresses. These values are plotted as a function of the particle volume fraction in Fig. 10. The viscosity in the shear-thickened state is almost identical regardless of whether the flow is steady or dynamic, with some deviations evident at the highest packing fractions. This suggests a similar microstructure in the shear thickened state regardless of the degree of order present at lower shear stresses. The magnitude of the viscosity in the shear-thickened state for the cubic particle suspensions lies significantly above the measurements of Cwalina and Wagner8 for suspensions of spheres, which is shown by the model line that accurately describes this data. This difference increases at higher packing fractions. For example, at ϕ = 0.40, the shear-thickened state viscosity for the cubic particle suspensions is an order of magnitude larger than that for suspensions of spherical particles. This finding is of significant practical interest as it suggests the magnitude of the viscosity in the shear-thickened state can be engineered and controlled through not just the packing fraction, but also the particle shape.
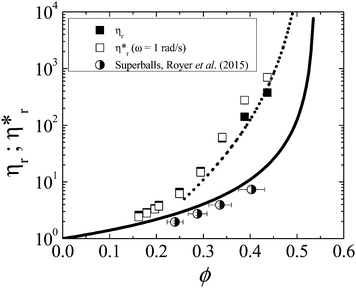 | ||
| Fig. 10 Steady shear viscosity (filled symbols) and complex viscosity (open symbols) measured in the shear-thickened state for suspensions of cubic particles. The solid line is the model fit to the measured viscosity of the shear-thickened state for suspensions of spherical particles from Cwalina and Wagner.8 The dashed line is the predicted value of the viscosity in the shear-thickened state for suspensions of cubic particles where the lubrication squeeze flow is modified from spheres to cubes (eqn (12)). The half-filled circles are the viscosity in the shear-thickened state measured by Royer et al.45 for suspensions of superballs. | ||
For a possible explanation of the differing concentration dependence of the viscosity in the shear-thickened state between suspensions of cubes and spheres, we consider the lubrication squeeze flow between two spherical particles and two cubic particles with equivalent radii/half-lengths as illustrated in Fig. 11.
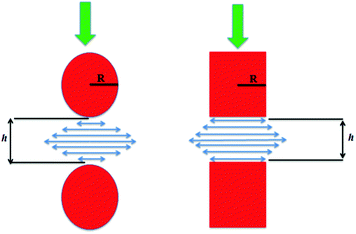 | ||
| Fig. 11 Lubrication squeeze flow between two spherical particles (left) and two cubic particles (right) with an identical characteristic half-width, R. | ||
For particles with an identical characteristic half-width, R, moving along their lines of center at a relative velocity, V, in a Newtonian fluid of viscosity, ηf, the lubrication force between the spherical and cubic particles is given, respectively, as:68,69
 | (6) |
 | (7) |
 | (8) |
 | (9) |
 | (10) |
 , such that:
 | (11) |
 | (12) |
Fig. 10 also contains data of the shear-thickened state viscosity for suspensions of superballs from Royer et al.45 Clearly, the viscosity in the shear-thickened state for the superballs suspensions is less than that of the cubic particle suspensions in this study. It can been seen that the measurements of the shear-thickened viscosity for the superballs lie closer to the model prediction for suspensions of spherical particles.8 This is not entirely surprising given that the shape exponent of the superballs is close to that of spheres. These results demonstrate that the magnitude of the suspension viscosity in the shear-thickened state is very sensitive to particle shape—slight rounding of the facets can lead to a significant reduction of the shear-thickened viscosity that is more closely described using a model for spherical particle suspensions.
The shear-thickened state of these cubic particle suspensions is also characterized by measurable normal stress differences as seen in Fig. 12. Similarly to Stokesian Dynamics simulation predictions71 and experimental measurements8 of dispersions of spherical colloids suspended in a Newtonian fluid, both the first and second normal stress differences, N1 and N2, respectively, are measured to be negative in sign in the shear-thickened state. Furthermore, both normal stress differences are the same order of magnitude. However, in contrast to the measurements of suspensions of spherical colloids, the magnitude of the second normal stress difference is slightly less than the first normal stress difference at a given volume fraction for a particular shear rate or shear stress in the shear-thickened state for the suspensions of cubic particles. In suspensions of spherical colloids, the normal stress differences at high shear rates arise as a consequence of anisotropy in the microstructure coupled to lubrication hydrodynamic interactions between particles.15 The measured negative normal stress differences in these suspensions of cubic particles support the hypothesis that lubrication hydrodynamic interactions between particles at high shear rates drive the observed shear thickening in this class of suspensions.
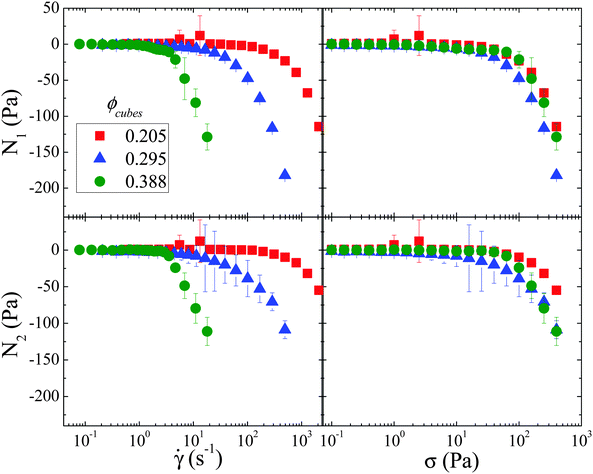 | ||
| Fig. 12 First (top) and second (bottom) normal stress difference as a function of the shear rate (left) and shear stress (right) for selected volume fractions. | ||
When plotted as a function of the shear rate on linear axes in Fig. 13, the normal stress differences scale linearly with the shear rate in the shear-thickened state. This finding is similar to the scaling of the normal stress differences in the shear-thickened state predicted16 and measured8 for suspensions of spherical colloids in Newtonian fluids where hydrodynamic interactions form the dominant contribution to the stress. This linear scaling of the normal stress differences means the first and second normal stress difference coefficients for suspensions, ϒ1 and ϒ2, respectively, can be defined as follows:
 | (13) |
 | (14) |
 | ||
| Fig. 13 First (filled symbols) and second (open symbols) normal stress differences in the shear-thickened state plotted as a function of the shear rate on linear axes. | ||
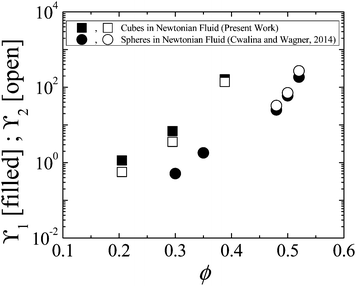 | ||
| Fig. 14 First (filled symbols) and second (open symbols) normal stress difference coefficients for suspensions in the shear-thickened state as a function of the particle volume for the suspensions of cubic particles in a Newtonian fluid considered in the present work (squares) and those measured previously for spherical colloids in a Newtonian fluid by Cwalina and Wagner.8 Error bars are smaller than data points. | ||
From Fig. 14, it is evident that, as a function of particle volume fraction, the normal stress difference coefficients for the suspensions of cubic particles in a Newtonian fluid lie above those for dispersions of spherical colloids in a Newtonian fluid. At ϕ ≈ 0.30, there is an order of magnitude difference between the normal stress difference coefficients, which grows to nearly two orders of magnitude at ϕ ≈ 0.40.
For dispersions of spherical colloids, Cwalina and Wagner8 demonstrated that the semi-empirical model of Morris and Boulay17 captured the scaling of the normal stress difference coefficients in the shear-thickened state as a function of the proximity to maximum packing, ϕ/ϕmax:
 | (15) |
 | (16) |
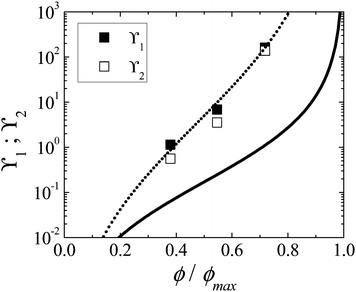 | ||
| Fig. 15 First (closed symbols) and second (open symbols) normal stress difference coefficients for suspensions of cubic particles in the shear-thickened state as a function of the proximity to maximum packing. The solid line is a semi-empirical model of the first normal stress difference coefficient for dispersions of spherical colloids in the shear-thickened state from Morris and Boulay17 with the model prefactor coefficient reported by Cwalina and Wagner8 (eqn (15)). The dashed line is the model fit to the first normal stress difference coefficient data for suspensions of cubic particles using the modified lubrication form (eqn (16)). The model fits of the second normal stress difference coefficient data for suspensions of spheres and cubes are not shown as they both differ from their respective first normal stress difference coefficient models only by small values of the prefactor constants. | ||
We close the discussion by placing the present work within the context of shear thickening in suspensions at low particle Reynolds number. Continuous shear thickening in colloidal dispersions has been shown to be a consequence of shear-induced concentration fluctuations driven by the divergence of lubrication hydrodynamic interactions. This mechanism, termed ‘hydroclustering’, is supported by rheo-optical measurements,12,72 neutron scattering experiments,13–15,73–75 Stokesian Dynamics simulations,71,76,77 Dissipative Particle Dynamics simulations,48 stress jump techniques,78 and direct confocal microscopy.79 An important signature of this mechanism is a negative first normal stress difference in the shear-thickened state, which has been confirmed and quantified for dispersions of colloidal spheres.8,15 Conversely, granular flows under confinement exhibit shear thickening resulting from frictional contacts due to frustrated dilatancy. This has been observed experimentally for suspensions of non-Brownian particles80 and modeled by simulations.20,81 For suspensions, importantly, the frictional contribution is only significant for systems with strong lubrication hydrodynamic interactions, high packing fractions, and large friction coefficients. As frictional contacts are not symmetric with respect to the direction of the normal force acting between particles, they naturally lead to a positive first normal stress difference, in stark contrast to the behavior dominated by lubrication hydrodynamics. Given the particle morphology shown in Fig. 1 for our cubic particles, and the lack of any stabilizing surfactant or polymer on the aluminosilicate surface, one might anticipate that these particles would be exceptionally ‘rough’ and that concentrated suspensions of these cubes would show evidence of particle roughness leading to a positive contribution to the first normal stress difference. In contrast, we find that the normal stress differences are even more negative than for dispersions of spherical particles. Furthermore, we can quantitatively account for the differences in the material functions as compared to dispersions of spherical particles by accounting for the enhanced lubrication stresses acting between the flat surfaces of cubic particles. Thus, despite the significant roughness of these aluminosilicate cubic particles and lack of surface modifications, there is no evidence of particle friction contributing to the rheology. Additional research into the novel rheological properties of suspensions of cubic particles is warranted to determine how they flow starting from an even more glassy state.82
4. Conclusions
This work expands our understanding of the flow behavior of suspensions of cubic particles in a Newtonian fluid at low particle Reynolds number by reporting the steady and dynamic shear viscosity and steady first and second normal stress difference coefficients over a broad range of particle concentrations and applied stresses. At low concentrations, the Einstein coefficient is found to be slightly larger than predictions for perfect cubes, and the Huggins coefficient, for which there is no theory at present, is large enough to suggest the existence of weak interactions, consistent with expectations.At higher concentrations, pseudo-Newtonian rheology is observed at the lowest shear stresses probed, which are above the characteristic stress for Brownian motion. Importantly, the volume fraction dependence of the low shear viscosity is observed to diverge with a maximum packing fraction closer to that expected for spherical particles, but with a stronger power law dependence. The magnitude of the low shear viscosity is smaller under oscillatory shear than steady shear, and shear thinning is evident under oscillatory flow. Comparison with literature reports for spherical particle dispersions indicates that this behavior is indicative of particle ordering. This is further supported by modeling of the volume fraction dependence of suspension viscosity, which indicates that oscillatory shear flow orders particles, such that they can fill space.
At high shear stresses, these concentrated suspensions exhibit strong shear thickening, both under steady and oscillatory shear flow. The magnitude of the viscosity in the shear-thickened was found to be well-described by a modification to an existing model for suspensions of spheres that takes into account the stronger lubrication forces between flat cubic particle surfaces compared to the curved surfaces inherent to spherical particles. Furthermore, negative normal stress differences are measured in the shear-thickened state, but in contrast to spherical particle suspensions, the magnitude of the second normal stress difference is found to be slightly less than that of the first normal difference. The normal stress difference coefficients are also well-modeled when the stronger lubrication forces between facets of cubic particles are accounted for. These observations strongly support lubrication hydrodynamics and hydrocluster formation as the mechanism of shear thickening in these suspensions of cubic particles. These measurements and the semi-empirical models for the material properties in the shear-thickened state provide novel responses for use in technologies that utilize the field-responsive nature of shear thickening fluids.83,84 The rheological measurements and analysis also motivate a need to measure the microstructure in these cubic particle suspensions to connect the suspension stress to the flow-induced microstructure under both steady and dynamic shear flow.
Acknowledgements
This work was supported by a NASA EPSCoR Grant (NNX11AQ28A) and a Delaware Space Grant Graduate Fellowship (NNX10AN63H). PQ Corporation is acknowledged for providing the cubic aluminosilicate zeolite particles.References
- A. T. J. M. Woutersen and C. G. Dekruif, J. Rheol., 1993, 37, 681–693 CrossRef CAS.
- A. Einstein, Ann. Phys., 1911, 339, 591–592 CrossRef.
- W. B. Russel, J. Chem. Soc., Faraday Trans. 2, 1984, 80, 31–41 RSC.
- G. K. Batchelor and J. T. Green, J. Fluid Mech., 1972, 56, 401–427 CrossRef.
- N. J. Wagner and A. T. J. M. Woutersen, J. Fluid Mech., 1994, 278, 267–287 CrossRef CAS.
- J. Bergenholtz, J. F. Brady and M. Vicic, J. Fluid Mech., 2002, 456, 239–275 CrossRef CAS.
- H. Laun, R. Bung and F. Schmidt, J. Rheol., 1991, 35, 999–1034 CrossRef CAS.
- C. D. Cwalina and N. J. Wagner, J. Rheol., 2014, 58, 949–967 CrossRef CAS.
- J. Bender and N. J. Wagner, J. Rheol., 1996, 40, 899–916 CrossRef CAS.
- B. J. Maranzano and N. J. Wagner, J. Rheol., 2001, 45, 1205–1222 CrossRef CAS.
- S. S. Shenoy and N. J. Wagner, Rheol. Acta, 2005, 44, 360–371 CrossRef CAS.
- J. W. Bender and N. J. Wagner, J. Colloid Interface Sci., 1995, 172, 171–184 CrossRef CAS.
- B. J. Maranzano and N. J. Wagner, J. Chem. Phys., 2002, 117, 10291–10302 CrossRef CAS.
- D. P. Kalman and N. J. Wagner, Rheol. Acta, 2009, 48, 897–908 CrossRef CAS.
- A. K. Gurnon and N. J. Wagner, J. Fluid Mech., 2015, 769, 242–276 CrossRef CAS.
- J. F. Brady and J. F. Morris, J. Fluid Mech., 1997, 348, 103–139 CrossRef CAS.
- J. F. Morris and F. Boulay, J. Rheol., 1999, 43, 1213–1237 CrossRef CAS.
- P. M. Kulkarni and J. F. Morris, Phys. Fluids, 2008, 20, 040602 CrossRef.
- H. Haddadi and J. F. Morris, J. Fluid Mech., 2014, 749, 431–459 CrossRef CAS.
- R. Mari, R. Seto, J. F. Morris and M. M. Denn, J. Rheol., 2014, 58, 1693–1724 CrossRef CAS.
- J. Mewis and N. J. Wagner, Colloidal suspension rheology, Cambridge University Press, 2011 Search PubMed.
- D. B. Yu and V. W. W. Yam, J. Am. Chem. Soc., 2004, 126, 13200–13201 CrossRef CAS PubMed.
- Y. G. Sun and Y. N. Xia, Science, 2002, 298, 2176–2179 CrossRef CAS PubMed.
- B. Wiley, Y. G. Sun, B. Mayers and Y. N. Xia, Chem. – Eur. J., 2005, 11, 454–463 CrossRef CAS PubMed.
- Q. A. Zhang, W. Y. Li, C. Moran, J. Zeng, J. Y. Chen, L. P. Wen and Y. N. Xia, J. Am. Chem. Soc., 2010, 132, 11372–11378 CrossRef CAS PubMed.
- J. J. Teo, Y. Chang and H. C. Zeng, Langmuir, 2006, 22, 7369–7377 CrossRef CAS PubMed.
- C. H. Kuo, C. H. Chen and M. H. Huang, Adv. Funct. Mater., 2007, 17, 3773–3780 CrossRef CAS.
- H. J. Yang, S. Y. He, H. L. Chen and H. Y. Tuan, Chem. Mater., 2014, 26, 1785–1793 CrossRef CAS.
- K. P. Johansson, A. P. Marchetti and G. L. Mclendon, J. Phys. Chem., 1992, 96, 2873–2879 CrossRef CAS.
- C. K. Chiu, Y. J. Choi and T. J. M. Luo, Cryst. Growth Des., 2012, 12, 4727–4732 CAS.
- F. Dumestre, B. Chaudret, C. Amiens, P. Renaud and P. Fejes, Science, 2004, 303, 821–823 CrossRef CAS PubMed.
- T. Sugimoto and K. Sakata, J. Colloid Interface Sci., 1992, 152, 587–590 CrossRef CAS.
- T. Sugimoto, K. Sakata and A. Muramatsu, J. Colloid Interface Sci., 1993, 159, 372–382 CrossRef CAS.
- R. D. Batten, F. H. Stillinger and S. Torquato, Phys. Rev. E: Stat., Nonlinear, Soft Matter Phys., 2010, 81, 061105 CrossRef PubMed.
- M. Chen, J. Kim, J. P. Liu, H. Y. Fan and S. H. Sun, J. Am. Chem. Soc., 2006, 128, 7132–7133 CrossRef CAS PubMed.
- K. P. Rice, A. E. Saunders and M. P. Stoykovich, J. Am. Chem. Soc., 2013, 135, 6669–6676 CrossRef CAS PubMed.
- C. Wang, H. Daimon, Y. Lee, J. Kim and S. Sun, J. Am. Chem. Soc., 2007, 129, 6974–6975 CrossRef CAS PubMed.
- G. Singh, H. Chan, A. Baskin, E. Gelman, N. Repnin, P. Kral and R. Klajn, Science, 2014, 345, 1149–1153 CrossRef CAS PubMed.
- D. Kim, N. Lee, M. Park, B. H. Kim, K. An and T. Hyeon, J. Am. Chem. Soc., 2009, 131, 454–455 CrossRef CAS PubMed.
- L. Rossi, S. Sacanna, W. T. M. Irvine, P. M. Chaikin, D. J. Pine and A. P. Philipse, Soft Matter, 2011, 7, 4139–4142 RSC.
- R. G. Egres and N. J. Wagner, J. Rheol., 2005, 49, 719–746 CrossRef CAS.
- R. K. Mallavajula, D. L. Koch and L. A. Archer, Phys. Rev. E: Stat., Nonlinear, Soft Matter Phys., 2013, 88, 052302 CrossRef PubMed.
- D. J. Audus, A. M. Hassan, E. J. Garboczic and J. F. Douglas, Soft Matter, 2015, 11, 3360–3366 RSC.
- D. Vickers, L. A. Archer and T. Floyd-Smith, Colloids Surf., A, 2009, 348, 39–44 CrossRef CAS.
- J. R. Royer, G. L. Burton, D. L. Blair and S. D. Hudson, Soft Matter, 2015, 11, 5656–5665 RSC.
- W. C. K. Poon, E. R. Weeks and C. P. Royall, Soft Matter, 2012, 8, 21–30 RSC.
- R. M. Turian, Ind. Eng. Chem. Fundam., 1972, 11, 361–368 CAS.
- S. Jamali, A. Boromand, N. Wagner and J. Maia, J. Rheol., 2015, 59, 1377–1395 CrossRef CAS.
- B. J. Ackerson, J. Rheol., 1990, 34, 553–590 CrossRef.
- Y. D. Yan, J. K. G. Dhont, C. Smits and H. N. W. Lekkerkerker, Physica A, 1994, 202, 68–80 CrossRef CAS.
- D. E. Angelescu, J. H. Waller, R. A. Register and P. M. Chaikin, Adv. Mater., 2005, 17, 1878–1881 CrossRef CAS.
- N. A. M. Verhaegh, J. S. Vanduijneveldt, A. Vanblaaderen and H. N. W. Lekkerkerker, J. Chem. Phys., 1995, 102, 1416–1421 CrossRef CAS.
- R. J. Butera, M. S. Wolfe, J. Bender and N. J. Wagner, Phys. Rev. Lett., 1996, 77, 2117–2120 CrossRef CAS PubMed.
- C. Dux and H. Versmold, Phys. Rev. Lett., 1997, 78, 1811–1814 CrossRef CAS.
- G. Petekidis, P. N. Pusey, A. Moussaid, S. Egelhaaf and W. C. K. Poon, Phys. A, 2002, 306, 334–342 CrossRef CAS.
- G. Arya, J. Rottler, A. Z. Panagiotopoulos, D. J. Srolovitz and P. M. Chaikin, Langmuir, 2005, 21, 11518–11527 CrossRef CAS PubMed.
- J. Vermant and M. J. Solomon, J. Phys.: Condens. Matter, 2005, 17, R187–R216 CrossRef CAS.
- M. W. Wu, R. A. Register and P. M. Chaikin, Phys. Rev. E: Stat., Nonlinear, Soft Matter Phys., 2006, 74, 040801 CrossRef PubMed.
- N. Koumakis, A. B. Schofield and G. Petekidis, Soft Matter, 2008, 4, 2008–2018 RSC.
- J. M. McMullan and N. J. Wagner, J. Rheol., 2009, 53, 575–588 CrossRef CAS.
- R. L. Hoffman, Trans. Soc. Rheol., 1972, 16, 155–173 CrossRef CAS.
- D. Leighton and A. Acrivos, Chem. Eng. Sci., 1986, 41, 1377–1384 CrossRef CAS.
- F. Gadalamaria and A. Acrivos, J. Rheol., 1980, 24, 799–814 CrossRef CAS.
- S. A. Faroughi and C. Huber, Rheol. Acta, 2015, 54, 85–108 CrossRef CAS.
- W. B. Russel, N. J. Wagner and J. Mewis, J. Rheol., 2013, 57, 1555–1567 CrossRef CAS.
- J. F. Brady, J. Chem. Phys., 1993, 99, 567–581 CrossRef CAS.
- S. X. Li, J. Zhao, P. Lu and Y. Xie, Chin. Sci. Bull., 2010, 55, 114–119 CrossRef.
- E. Guazzelli and J. F. Morris, A Physical Introduction to Suspension Dynamics, Cambridge University Press, New York, 2012 Search PubMed.
- W. M. Deen, Analysis of Transport Phenomena, Oxford University Press, New York, 2nd edn, 2012 Search PubMed.
- W. H. Boersma, J. Laven and H. N. Stein, AIChE J., 1990, 36, 321–332 CrossRef CAS.
- D. R. Foss and J. F. Brady, J. Fluid Mech., 2000, 407, 167–200 CrossRef CAS.
- P. Dhaene, J. Mewis and G. G. Fuller, J. Colloid Interface Sci., 1993, 156, 350–358 CrossRef CAS.
- H. M. Laun, R. Bung, S. Hess, W. Loose, O. Hess, K. Hahn, E. Hadicke, R. Hingmann, F. Schmidt and P. Lindner, J. Rheol., 1992, 36, 743–787 CrossRef CAS.
- M. C. Newstein, H. Wang, N. P. Balsara, A. A. Lefebvre, Y. Shnidman, H. Watanabe, K. Osaki, T. Shikata, H. Niwa and Y. Morishima, J. Chem. Phys., 1999, 111, 4827–4838 CrossRef CAS.
- Y. S. Lee and N. J. Wagner, Ind. Eng. Chem. Res., 2006, 45, 7015–7024 CrossRef CAS.
- J. R. Melrose and R. C. Ball, J. Rheol., 2004, 48, 937–960 CrossRef CAS.
- J. R. Melrose and R. C. Ball, J. Rheol., 2004, 48, 961–978 CrossRef CAS.
- V. T. O'Brien and M. E. Mackay, Langmuir, 2000, 16, 7931–7938 CrossRef.
- X. Cheng, J. H. McCoy, J. N. Israelachvili and I. Cohen, Science, 2011, 333, 1276–1279 CrossRef CAS PubMed.
- E. Brown and H. M. Jaeger, J. Rheol., 2012, 56, 875–923 CrossRef CAS.
- R. Mari, R. Seto, J. F. Morris and M. M. Denn, Proc. Natl. Acad. Sci. U. S. A., 2015, 112, 15326–15330 CrossRef CAS PubMed.
- M. Wang and J. F. Brady, Phys. Rev. Lett., 2015, 115, 158301 CrossRef PubMed.
- P. T. Nenno and E. D. Wetzel, Proc. SPIE, 2014, 9057, 90573H, DOI:10.1117/12.2059833.
- C. D. Cwalina, R. D. Dombrowksi, C. J. McCutchen, E. L. Christiansen and N. J. Wagner, Procedia Eng., 2015, 103, 97–104 CrossRef CAS.
Footnote |
| † Electronic supplementary information (ESI) available: Additional information about normal stress measurements, elastohydrodynamic scalings, and time dependent shear creep measurements are presented. See DOI: 10.1039/c6sm00205f |
| This journal is © The Royal Society of Chemistry 2016 |

