DOI:
10.1039/C5RA24254A
(Paper)
RSC Adv., 2016,
6, 18641-18653
Regulation of acidogenic metabolism towards enhanced short chain fatty acid biosynthesis from waste: metagenomic profiling
Received
16th November 2015
, Accepted 11th January 2016
First published on 14th January 2016
Abstract
Short chain carboxylic (volatile fatty) acid (VFA) production in mixed microbiomes is majorly limited by the prevalence of methanogenic bacteria and the availability of substrate from waste to the biocatalyst during the fermentation process. To enhance the VFA production from food waste, the present study evaluates a strategy for selective enrichment of the biocatalyst by exposing it to acid-shock, followed by operation under alkaline conditions (pH 10). A comprehensive system based analysis was carried out during the bio-based platform chemical synthesis from waste, in conjugation with microbial profiling and bio-electrochemical analysis. After the selective enrichment of the biocatalyst, enhanced VFA synthesis was conducted with pretreated biocatalyst (PT; 11.1 g L−1) and compared with untreated parent biocatalyst (UT; 6.1 g L−1). In both systems biohydrogen was the co-product. Variations in the VFA profiles were documented with respect to the biocatalyst used, which influenced the degree of acidification (DOA – PT: 37% and UT: 11%). A high fraction of acetic acid (6.9 g L−1) was observed, followed by butyric acid (2.6 g L−1) and propionic acid (1.3 g L−1) in PT operation, contrary to the control system (acetic acid, 3.9 g L−1, butyric acid, 1.6 g L−1; propionic acid, 0.9 g L−1). Specifically, the PT system showed the biosynthesis of iso-valeric acid: 0.15 g L−1 (C5) and caproic acid: 1.9 g L−1 (C6), which indicates the possibility for chain-elongation through the selective enrichment of the microbial community. The PT system showed Epeak at −0.415 V on the cyclic voltammogram, which corresponds to the involvement of the redox couple, H+/H2, correlating with the enhanced acidogenic process, unlike UT. Tailoring of the parent inoculum (pretreatment) resulted in the enrichment and enhancement of the capabilities of the biocatalyst in secreting the redox mediators, which were not detected in the UT system. Acidogenic firmicutes (spore formers) and fatty acid producing bacteroides were enriched in the PT system along with saccharolytic and proteolytic bacteria (Bacillus cellulosilyticus (alkalophile), Soehngenia saccharolytica, etc.). The presence of Clostridium autoethanogenum and Propionibacterium freudenreichii in the PT system supports effective utilization of complex carbohydrates, facilitating acidification.
1. Introduction
The demand for renewable chemicals and fuels is pushing the industry towards higher sustainability, to improve cost-effectiveness and meet customers' demands with sustainability.1,2 Waste is being considered as renewable and potential feedstock for the production of a spectrum of bio-based products ranging from fuel to platform chemicals.3 At present, the development of environmentally sound and innovative strategies to process such waste into useful products is an area of increasing importance and relevance. Carboxylic acids or volatile fatty acids (VFA) are important bulk chemicals that are used as building blocks for the production of polymers, as acidulants, preservatives and flavouring agents, or as precursors for the synthesis of chemicals.4–7 Carboxylic acids contain a functional group whose reactivity allows the formation of other compounds, such as esters and amides. Additional innovative applications for VFA includes, their thermal conversion to ketones and subsequent hydrogenation to alcohol fuels, use as electron donors in microbial fuel cells and use as feedstock for microalgae based biodiesel production.8,9 As most other commodity chemicals, VFA are currently being produced from fossil fuels through chemical synthesis. The US Department of Energy (DOE) has indicated that the most interesting platform chemicals that can be derived from lignocellulose are carboxylic acids, which have diverse green chemistry applications.1,2,10
The anaerobic process, specifically acidogenic fermentation (acidogenesis), is one of the sustainable waste management routes gaining significant importance due to its potential to generate a broad spectrum of bio-based products.2,4,11,12 Biochemical pathways involved in the acidogenesis results in the formation of multiple products including carboxylic acids (C2: acetic acid, C3: propionic acid, C4: butyric acid, C5: valeric acid, C6: caproic acid), molecular hydrogen, lactic acids, ethanol, CO2, etc.1,10,13 Acidogenesis based VFA production and its composition are influenced by various physical, chemical and biological parameters, viz., substrate nature and composition, organic load, operating pH and temperature, nature of biocatalyst, fermentation time, etc. The use of microbiomes can establish a more robust and economically viable process than single strains;4,14,15 however, mixed microbiome operation restricts the function of acidogenic fermentation towards VFA production, due to the synergetic interaction of methanogenic bacteria (MB) consuming them along with H2 to produce methane (CH4). Among the various process parameters for regulating VFA production, parent inoculum is one of the main factor that plays an important role in the final fermentation products, specifically when mixed culture fermentation is adopted.16,17 Mixed fermentation provides diversity of metabolic abilities that adapts to a wide variety of substrates and conditions, and also offers the advantage of working with non-sterile conditions.12,18,19
Improving the production rate of carboxylic acids is important for making the process economically viable. In the context of biocatalysts, this can be done by avoiding the loss of H2 and VFA to H2-consuming anaerobes (methanogens). Pretreatment of mixed culture (inoculum) by selective strategies is often practiced to regulate the specific requirements of fermentation end-products.12,16,17 Regulating the metabolic pathway towards acidogenesis with simultaneously inhibiting MB, to allow carboxylic acids to become a metabolic end product along with H2, can facilitate good productivity. Pretreatment of the parent culture (biocatalyst) plays an important role in the enrichment of acidogenic bacteria (AB).12,17,20,21 Physiological differences between AB and H2-consuming bacteria (MB) forms the main basis for the preparation of biocatalysts for acidogenic fermentation. Moreover, food waste valorisation has attracted a great deal of attention as a raw material for the production of fuels and chemicals.10,22 Harnessing valuable products from food waste in controlled acidogenic fermentation makes this conversion process sustainable. In this context, the present communication reports comprehensive results from experiments carried out to decipher the dynamics of the mixed culture acidogenic fermentation process, by regulating the metabolism of enhanced short chain mono carboxylic acid synthesis from food waste in conjunction with the microbial community and bio-electrochemical analysis.
2. Materials and methods
2.1 Bioreactors and selective enrichment of biocatalyst
Two identical borosilicate-glass bottles were used to fabricate bench scale anaerobic reactors with a total/working volume, gas holding capacity of 0.5/0.4 L and 0.1 L respectively. The reactors were operated in suspended growth configuration with fed batch flow mode at ambient temperature (28 ± 2 °C) and OL of 15 g COD/L d−1 for 45 cycles. All the 45 cycles were operated for 102 h. Proper anaerobic conditions were maintained in the bioreactors by sparging with nitrogen gas for 10 min after every feeding and sampling event. The pH of the feed was adjusted to 10 using 1 N NaOH/1 N HCl, prior to loading the waste. The reactor contents were kept in suspension by subjecting to mixing (100 rpm).
2.2 Food waste
Composite food waste was collected from the institute's campus canteen. The non-biodegradable fraction was separated and used as renewable feedstock. The food waste was ground using an electrical blender and the resulting slurry was filtered through a stainless steel sieve (approx 0.15 mm pore size) to remove large particles. The filtered slurry was subjected to an oil-separating system (that worked based on gravity) to remove the oil. The resulting slurry was then diluted with domestic sewage water and brought down to the desired organic load (OL) prior to feeding the bioreactors.
2.3 Selective enrichment of the biocatalyst
Parent inoculum (biocatalyst) for the experiment was collected from an anaerobic bioreactor, treating complex wastewater. A nylon filter was used to sieve the collected biocatalyst to separate the grit from the biocatalyst and the resulting biocatalyst was used as the inoculum. For the acid-shock pretreatment experiment, the biocatalyst 10% v/v (0.05 L) was exposed to acid-shock treatment by adjusting the pH to 3 using 0.1 N HNO3, and the anaerobic conditions were maintained by sparging with N2 gas. The inoculum was subjected to acid shock for 24 h. Pretreatment operations were performed at room temperature (28 ± 1 °C) by continuous mixing using a magnetic stirrer (120 rpm). Before starting the experiment, the pH of the acid-pretreated inoculum was re-adjusted to 6 using 0.1 N NaOH/0.1 N HCl. For the control experiments, untreated biocatalyst (10% v/v (0.05 L)) was evaluated to assess the relative efficiency of the selective enrichment procedure. Enrichment of the inoculum (for both pretreated and untreated biocatalyst) was done with food waste (COD, 30 g L−1; 48 h; pH 10) for four cycles prior to subjecting them to the bioreactors.
2.4 Analysis
Sampling of both liquid and gas for analysis was done at different time intervals. The short chain fatty acid (VFA) composition was analyzed using high performance liquid chromatography (HPLC; Shimadzu LC10A), employing a UV-Vis detector (210 nm) and C18 reverse phase column (250 × 4.6 mm diameter; 5 μm particle size, flow rate: 0.5 mL h−1; wave length: 210 nm). The mobile phase was 40% acetonitrile (in 1 mN H2SO4; pH, 2.5–3.0) and sample injection of 20 μL was used. Alcohol analyses were performed using the same HPLC; Shimadzu LC20A employing RID20A RI detector (Shimadzu Scientific) and using a Rezex Monosaccharide H+ (8%), size: 300 × 7.80 mm (Phenomenex, India) HPLC column. For elution, a flow rate of 0.5 mL min−1 was used in an isocratic method with water as the mobile phase and the column temperature was maintained constant of 80 °C. Biogas composition was monitored using gas chromatography (GC; NUCON 5765) along with a thermal conductivity detector (TCD) with 1/8′′ × 2 m Heysep Q column, employing argon as the carrier gas. The injector and detector were maintained at 60 °C each, and the oven was operated isothermally, at 40 °C. Different analyses were performed, viz. chemical oxygen demand (COD-closed refluxing titrimetric method), VFA and pH as per standard methods (APHA 1998). Buffering capacity (β) was estimated based on the acid-base titrations employing an auto-titrator (Mettler Toledo DL50). β was calculated using eqn (1),| |
 | (1) |
where C is the concentration of acid or base (N), Vs is the volume of sample (ml), m is the slope of the tangent of the curve (eqn (1)).
2.5 Bioelectrochemical analysis
Electrochemical behaviour of the biocatalyst before and after pretreatment was evaluated by employing a potentiostat–galvanostat system (Biologic, EC Lab). Cyclic voltammetry was performed using a scan rate of 30 mV s−1 over an applied voltage range of −0.5 to 0.5 V. All the electrochemical assays were performed using platinum wire as the working electrode and graphite rod as the counter electrode against the reference electrode (SHE) in wastewater (as electrolyte).16
2.6 Metagenomic analysis
Both treated and untreated biocatalyst samples were collected at the end of the experiment and the genomic DNA (gDNA) was extracted using the NucleoSpin® Soil kit (Macherey-Nagel GmbH & Co, Germany). Primers [Forward primer 341F, 5I – AGG CCT AAC ACA TGC AAG TC – 3I; reverse primer 517R, 5I – ATT ACC GCG GCT GCT GG – 3I; a GC clamp was added to the forward primer] were used in the highly conserved region (V3) of the 16 rRNA gene, which was amplified using the 16S rRNA universal primer, via a thermal cycler (Eppendorf, Germany) (Table 1).12 The amplified PCR product was purified by using a QIA quick PCR purification kit (Qiagen, USA). With the amplified PCR product, denaturing gradient gel electrophoresis (DGGE) was performed on a Bio-Rad DCode system. The purified PCR product was separated on 8% (w/v) polyacrylamide gel with 30–80% denaturant gradient, and gel electrophoresis was performed at a constant voltage of 80 V at 60 °C for 14 h. Ethidium bromide was used to stain polyacrylamide gel and the image was captured by a molecular imager (Syngene G-Box, UK). Selected bands were eluted in ultra pure water overnight and the eluted DNA bands were re-amplified with the same primers (341F, 517R), but without the GC clamp in the forward primer. Amplified bands were sequenced at Bioserve seq., India. All the 16S rDNA partial sequences obtained were aligned with the NCBI GenBank database using the BLAST server (NCBI BLAST) to obtain the closest relatives. The MEGA 6.0 package was used to align the obtained sequences (ClustalW), and the evolutionary relationship between relatives was studied by constructing phylogenetic trees, by using the neighbour-joining statistical method. Bootstrap analysis based on 500 iterations was used as a test for the constructed phylogenetic trees.
Table 1 Primers used for the PCR amplification of the V3 region of the 16S rRNA gene for DGGE
| Name |
Target group |
Function |
Sequence |
| 341FGC |
Eubacteria |
Forward |
CGCCCGCCGCGCGCGGCGGGCGGGGCGGGGGCACGGGGGGCCTACGGGAGGCAGCAG |
| 341F |
Eubacteria |
Forward |
CTACGGGAGGCAGCAG |
| 517R |
Eubacteria |
Reverse |
ATTACCGCGGCTGCTGG |
3. Results and discussion
3.1 Short chain fatty acid production
The operation data documented distinct variations in VFA production, signifying the apparent change in the metabolic behaviour of selectively enriched biocatalyst (PT) compared to the control inoculums (UT) (Fig. 1). More than a 50% increment in VFA productivity was evident after applying acid-shock pretreatment to the anaerobic inoculum. Initially up to six initial cycles of operation, both the systems showed marginal variation in VFA synthesis (PT, 6 g L−1; UT, 4.1 g L−1). A steep increase in VFA production was recorded after the seventh cycle, until the 15th cycle of operation (PT, 6.6 to 10.6 g L−1; UT, 4.1 to 5.1 g L−1). VFA production remained more or less the same, up to the 25th cycle (10.6 g L−1), documenting stabilized performance up to the 45th cycle (11 ± 0.9 g L−1). The maximum VFA productivity (total) of 11.1 g L−1 was observed with PT, compared to 6.1 g L−1 for UT operation. Alkaline pH initiates the hydrolysis of the substrate in both PT and UT. However, selective enrichment of microbial consortia showed significant regulatory influence on short chain mono carboxylic acids synthesized from waste. Initially, systems were operated for cycle periods of 48 h, followed by 72 h and 102 h. With the decrease in the cycle period (to 24 h), total VFA production of 3 g L−1 and 2.7 g L−1 was noticed with PT and UT, respectively. In the 2nd phase operation (25th–48th h), a rapid increase in VFA production was recorded, particularly with the pretreated operation [PT/UT 24 h (3/2.7 g L−1) to 48 h (7.9/3.8 g L−1). In the case of the 3rd phase (49–84 h), a gradual increase in VFA production was observed (PT, 10.6 g L−1; UT, 5.6 g L−1). Extending the cycle period for another 12 h, PT operation resulted in the highest carboxylic acid productivity (11.1 g L−1; 102 h), whereas a reduction in fatty acids was noticed with UT operation (from 5.7 to 5.3 g L−1) due to their consumption by methanogenic bacteria (MB) to produce CH4, as evidenced by the biogas profile. Increased fermentation time enhanced the accumulation of fatty acids to a certain extent, based on the nature of the biocatalyst.
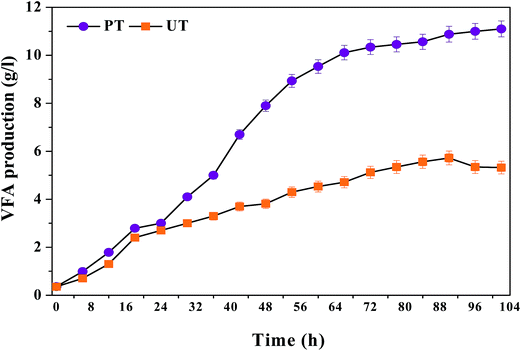 |
| | Fig. 1 Variations in total VFA production in acid-shock pretreated (PT) and untreated (UT) operations at initial pH of 10, with respect to operation time (45th cycle). | |
3.1.1 Finger printing of carboxylic acids. The carboxylic acid profile showed the presence of acetic acid (HAc, C2) in the major fraction followed by propionic acid (HPr, C3), butyric acid (HBu, C4) and traces of iso-valeric acid (HVa, C5) and caproic acid (HCa, C6) in the PT system (Fig. 2). PT operation documented relatively higher concentrations of HAc [PT, 7.9 g L−1 (102 h); UT = 3.9 g L−1 (96 h)] (eqn (2)), followed by HBu [PT, 3.9 g L−1 (102 h); UT = 1.29 g L−1 (96 h)] (eqn (3)), HPr [PT, 1.3 g L−1 (102 h); UT = 0.9 g L−1 (102 h)] and HVa [PT, 0.15 g L−1 (12 h); UT = 0.1 g L−1 (48 h)]. HAc that accumulated in the UT system was consumed due to the dominance of MB in the UT system. HBu production showed a gradual increase up to 102 h (4.0 g L−1). In the case of UT operation, HBu was more or less the same (3.9 g L−1). Relatively higher synthesis of HPr was observed during 102 h of PT operation (1.3 g L−1), compared to UT (0.9 g L−1). HPr concentration showed marked improvement with increase in the fermentation time from 12 to 72 h (PT, 0.2–1.3 g L−1; UT, 0.4–0.9 g L−1). The increase in propionic acid concentration at the end of fermentation might be attributed to the utilization of H2 (eqn (4)).| | |
C6H12O6 + 2H2O → 2CH3COOH + 4H2 + 2CO2
| (2) |
| | |
C6H12O6 → CH3CH2CH2COOH + 2H2 + 2CO2
| (3) |
| | |
C6H12O6 + 2H2 → 2CH3CH2COOH + 2H2O
| (4) |
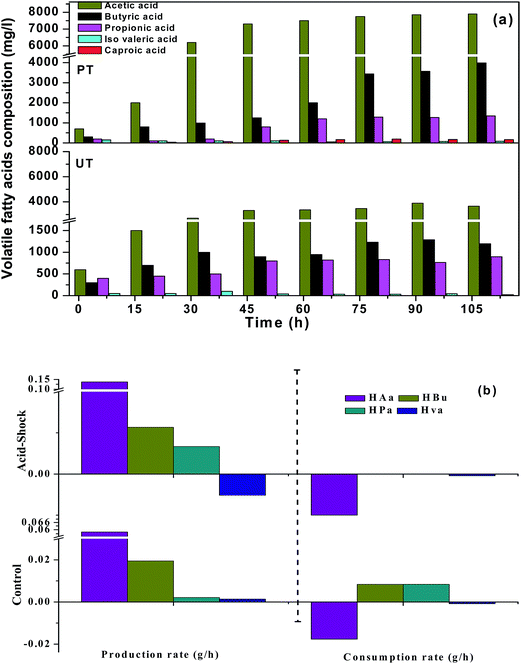 |
| | Fig. 2 (a) Pattern of fatty acid composition in VFA biosynthesis for the pretreated (PT) and untreated systems (UT), with respect to time (0th h to 102nd h). (b) Positive and negative profiles showing the production and consumption rate of individual fatty acids with the function of initial pH and fermentation time. | |
Interestingly, the PT system showed the presence of medium chain carboxylic acids (MCFA) from 36 h onwards, viz., caproic acid (C6: 36 mg L−1), contrary to the UT system. MCFA are straight carboxylic acids that have chain lengths of six to eight carbon atoms (C6–C8). The production of caproic acid continued until the end of the cycle operation (102 h: 48 mg L−1). The reduction of short carboxylic acids was tailored by H2 or ethanol as single electron donors, through a reverse β-oxidation process. The reverse β oxidation process is a recurring process and adds an acetyl-CoA molecule derived from the ethanol oxidation to a carboxylate (eqn (3)), elongating its carbon chain length.6,14 Suppression of MB in the PT system, in situ H2 pressure and accumulated ethanol (1.1 mg L−1) might have induced the production of MCFA (caproic acid). In contrast, the UT inoculum was not subjected to pretreatment (for methanogen inhibition), hence, it might have consumed the accumulated H2 and acetate for the production of CH4.
3.1.2 Carboxylic acid profile with fermentation time. The acidogenic process is dynamic and is influenced by the quantity and composition of carboxylic acids present at that time and their consumption pattern. In order to understand the dynamics of the process, the production/consumption rates of carboxylic acids were calculated based on the following equations (eqn (5) and (6)):10| | |
Production rate of carboxylic acids (PRCa) = (VFAmax − VFAint)/TProd
| (5) |
| | |
Consumption rate of carboxylic acids (CRCa) = (VFADrop − VFAmax)/TDrop
| (6) |
where, VFAmax represents the maximum VFA concentration (g L−1), VFAint is the initial VFA concentration (g L−1), VFADrop denotes the drop/consumption in VFA concentrations due to its consumption (g L−1), TProd represents fermentation time in hours and TDrop represents VFA consumption time (hours). The positive and negative values explain the rate of production and consumption of carboxylic acids respectively. Relatively higher PRCa was observed with PT operation. Based on HAc, PRCa showed higher values with PT (+0.085 g h−1) than UT (+0.03 g h−1) operation. HAc concentration was 0.7 g L−1 at the 12th h of the cycle and gradually increased until the end of the cycle operation [2.0 g L−1 (24 h) to 7.9 g L−1 (102 h)]. This accumulation of HAc with time was due to the absence of MB and the presence of other acid oxidizing bacteria like Acetobacter pasteurianus. These classes of bacteria have the capability of producing VFA in high-acid enriched media. Similarly, based on HBu/HPr, PT also showed higher PRCa (+0.038 g h−1, +0.0126 g h−1) compared to UT operation (+0.0117/+0.0043 g h−1). HVa had relatively lower PRCa with UT. CRCa was observed to be very low with PT operation, compared to its production (HAc, −0.007 g h−1), which facilitated fatty acid accumulation. CRCa with the control system was relatively higher (HAc, 0.02 g h−1), indicating higher consumption. In the UT system, VFA synthesis occurred until the 96th h (3.9 g L−1), followed by consumption up to the 102nd h (3.6 g L−1). Consumption of HAc after the 96th h can be attributed to the dominance of methanogenic activity in the later stages of operation.
3.1.3 Degree of acidification. Degree of acidification (DOA) represents the extent of acidification achieved due to the production of carboxylic acids in relation to substrate (as COD) degradation (eqn (7)),5,23| |
 | (7) |
where, Si represents the initial substrate concentration measured in COD as mg L−1 and Sf is the net VFA concentration (final − initial) expressed as theoretical equivalents of COD (HAc, 1.066; HPr, 1.512; HBu, 1.816 mg L−1). DOA was calculated in terms of individual carboxylic acid concentrations, and also with the mixture of three fatty acids. As valeric and caproic acid concentrations were low, they were not included in the DOA calculations. VFA composition and fermentation time showed a marked influence on the acidification (Fig. 3). A higher DOA of 37% was observed with PT operation, compared to UT (10%). It is interesting to note that higher HAc concentration contributed to higher acidification in the PT system (22.47%), compared to UT (4.95%). It is obvious that higher VFA production and substrate degradation influence the DOA, which is mainly influenced by the composition of the VFA produced in the system, and enumerates the capacity of the given system to produce the carboxylic acids. Lower HBu (10.3%) and HPr acid (5.04%) also contributed to the increase in DOA in pretreated operation. Comparatively lower acetate (4.9%), butyrate (3.9%) and propionate (2.02%) were seen in the control, which contributed to total DOA of 10.89%.
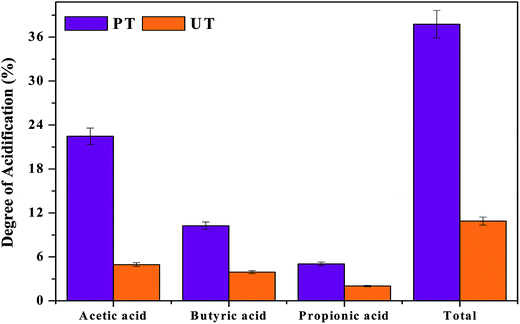 |
| | Fig. 3 Acidification achieved due to the production of VFAs in relation to substrate degradation, individual VFA's produced in the reactor and degree of acidification (DOA). | |
3.2 Biohydrogen (H2)
Three fold higher H2 production was observed with PT, compared to the untreated biocatalyst (Fig. 4a). With the course of time, cumulative hydrogen production (CHP) and hydrogen conversion efficiency (HCE) gradually increased in both the reactors, but total volume of H2 varied (Fig 4b and c). The PT system showed a threefold higher production efficiency (CHP, 0.73 L; HCE, 20.3%) than the corresponding UT operation (0.29 L; 6.6%) at operating pH of 10. Alkaline conditions facilitate the dominance of the phosphoroclastic pathway, resulting in increased acetate as well as H2 production. Mixed culture acidogenic fermentation involves the synergistic and competitive interactions of a wide diversity of microbial groups. Pretreatment of the parent inoculum (biocatalyst) plays a vital role in shifting the metabolic function of a biocatalyst towards acidogenesis with simultaneous inhibition of MB, without affecting the activity of the H2-producing acidogenic bacteria (AB).12,20 Physiological differences between AB and H2-consuming bacteria (MB) form the main basis for the preparation of the biocatalyst.21 Acidogenic H2-producing bacteria can form spores in adverse environmental conditions, viz., high temperature, extreme redox conditions, etc., which are specifically absent in the MB.12,24 Propionic acid and lactic acid pathways demand additional H2 of two moles and one mole, respectively. Biogas composition analysis showed a higher fraction of H2 (45%) from the PT than the UT (14%) system at the 38th h of cycle operation. H2 production correlated well with the formation of acetate and butyrate in the PT system.16,17 Apart from the H2 production, the PT system resulted in lower methane production (14% of total biogas) than the corresponding UT system (36% of total biogas). This signifies that the tailoring of the parent inoculum with acid-shock results in the specific enrichment of acidogenic bacteria, as opposed to methanogenic bacteria (consume VFA/H2), to produce methane. The enriched microbial community in PT also correlated well with the observed acidogenic microbial community profiling.
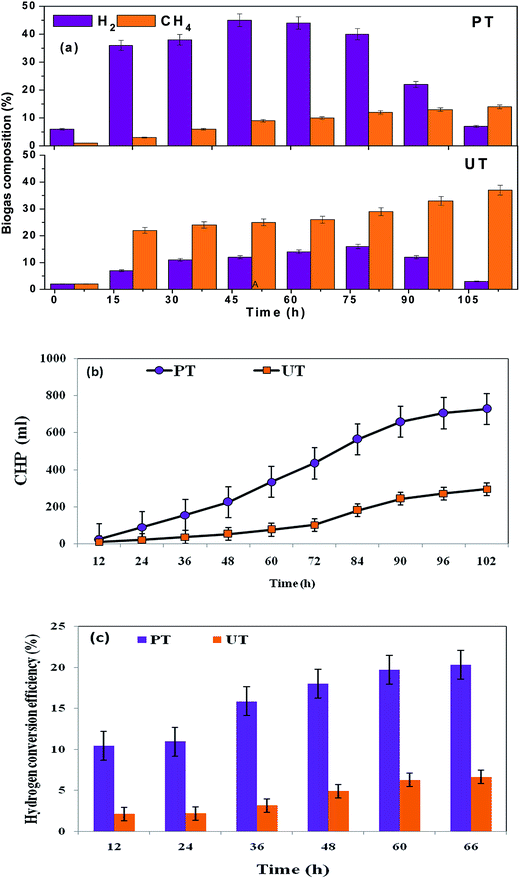 |
| | Fig. 4 (a) Enhanced H2 evolution and suppressed CH4 production with acid-shock pretreatment (PT). In the untreated system (UT), there is higher CH4 content. (b) Higher cumulative biohydrogen production (CHP) from acid-shock pretreatment (PT) than untreated culture (UT) (c) biohydrogen conversion efficiency (HCE) of pretreated and untreated cultures at initial pH 10. | |
3.3 Bioelectrochemical analysis
Cyclic voltammograms of pretreated (PT) and untreated (UT) systems were recorded during the course of operation to enumerate the bioprocess based redox couples involved in the electron transfer process. Marked variations in the voltammogram profiles were observed with the function of PT and UT inoculum (Fig. 5). Voltammogram profiles also showed specific peaks attributed to the involvement of redox mediators. The corresponding peak potentials (Epeak, vs. SHE) were compared with the standard redox potentials (Eo, redox).25,26
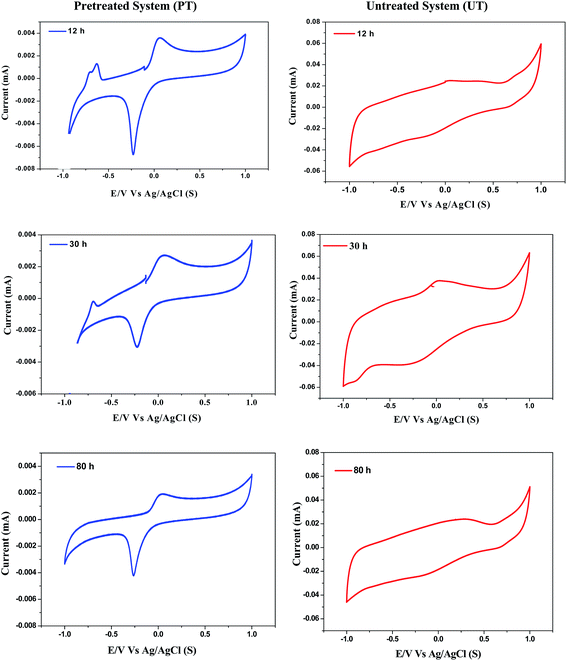 |
| | Fig. 5 Variations in cyclic voltammogram profiles with respect to course of time and pretreatment strategy. | |
In the case of the PT system, Epeak was identified during 12 h at −0.035 V, corresponding to the involvement of quinine as the redox mediator. This peak was observed to be consistent during the entire cycle of operation (until 80 h), depicting its role in the electron transfer during the bioprocess. Besides, an additional peak was detected at 0.205 V, corresponding to the involvement of cytochrome-bc1 complex. The electron transfer in the cytochrome-b complex occurs from a low-potential quinone to a higher-potential C-type cytochrome, and links this electron transfer to proton translocation.27 This can be ascribed to the involvement of protons either towards H2 production or facilitating the carboxylic acid synthesis. Interestingly, the PT system resulted in Epeak at −0.415 V, which depicts H2 formation during the bioprocess, confirmed by the presence of the redox couple H+/H2. During the course of fermentation (30 h), Epeak at −0.415 V was significantly decreased (peak current) and was not observed at the end of the operation (80 h). Pretreatment of the biocatalyst showed a specific influence on process efficiency in terms of carboxylic acids and H2 production. Significant and specific peaks depicted during the operation were found to have a specific role in the bioprocess. Redox couples viz., cytochrome b-complex, quinone or H+/H2 produced by the biocatalyst during the operation aided in the electron transfer efficiency of the reduction of protons towards either H2 or volatile fatty acids. In contrast to PT, the UT biocatalyst showed a single Epeak at 0.205 V during 30 h, which corresponds to the involvement of the cytochrome-bc1 complex, which can be attributed to the lower H+ shuttling, due to their reduction to CH4 (due to methanogenesis).16 These results show the specific influence of pretreatment in enriching and enhancing the capabilities of the biocatalyst in producing the redox mediators, which were not detected in the UT system, corroborating the microbial community fingerprinting as well.
3.4 Metagenomic profile
Structure and function of microbial communities are greatly influenced by their biodiversity and can differ in composition both qualitatively and quantitatively. Studying the metagenomic profiles can give information on various aspects of diversity, taxonomy and resources provided by microbial populations.28 Thus, for the present study where there is the possibility to control and direct the fermentation towards specific metabolites, knowledge of the microbial composition and metabolism is required. For microbial diversity identification, PCR DGGE demonstrated and confirmed the presence of volatile fatty acids, and H2 producers like members of Bacillaceae and Clostridiaceae in the acid treated reactors. Members of these families are known to be key players in the production of various volatile fatty acids and H2 in anaerobic conditions. Thus, the increased production of H2 was most probably due to acid-shock, and the subsequent reduction of hydrogen to methane was mostly decreased. DGGE patterns also suggested the presence of new bands in the acid-shock biocatalyst, indicative of either new species emerging, or the domination of species that are less abundant in the parent inoculums (UT) (Fig. 6). However, certain bands retained both in UT and PT suggest that certain species have adapted to life in the low acidic pH of the inoculum.
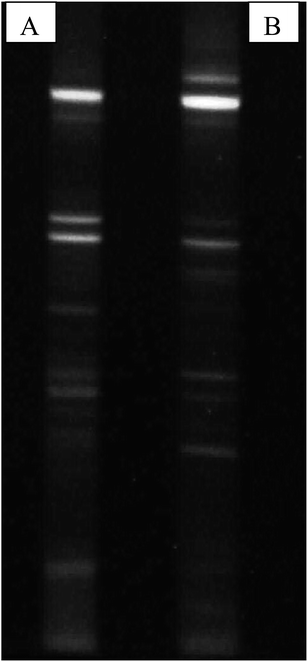 |
| | Fig. 6 PCR DGGE profiles of bacterial communities associated with (A) PT and (B) UT. Bands were excised and sequenced for further evolutionary analysis. | |
Major phylums related to the DGGE bands of the PT reactor can be divided into four groups viz., firmicutes, Bacteroides, actinobacteria and proteobacteria, while the UT was also dominated by four major groups viz., Bacteroides, firmicutes, actinobacteria and other unculturables (Table 2). Firmicutes have dominated the acid-shock reactor, which might be due to their ability to resist stress by various pathways like endosporulation.17 Similar results were obtained in the previous experiments, where the inoculum was pre-treated with acid for H2 production.29 Most of these bacteria are acidogenic in nature, and are versatile H2-producing bacteria that can form spores in adverse environmental conditions, viz., high temperature, extreme redox conditions, etc.; this is specifically absent in methanogens.30 Moreover, acidogenic pH inhibits the growth of hydrogenotrophic methanogens and thereby reduces the CH4 production from H2.29 Enriched firmicutes were mostly acidogenic like Lactobacillus delbrueckii (NC_008054.1), Lactobacillus harbinensis (NR_041263.1), Clostridium acidurici (CP003326.1) and Clostridium autoethanogenum (NC_022592.1), which are well known for their ability to produce various fatty acids (Fig. 7). Clostridia were previously reported to be a major part of the consortium producing H2 under anaerobic conditions supporting their enrichment.24 Along with these bacteria, relatives of saccharolytic bacteria like Bacillus cellulosilyticus (NR_074904.1) and Soehngenia saccharolytica (NR_117382.1) were also found. Clostridium autoethanogenum is a facultative chemolithoautotrophic, anaerobic, endospore forming gram positive bacteria.31 It is one of the few bacteria that can ferment carbon monoxide (CO) and can also utilize a few other carbon sources to form ethanol and acetate. Clostridium acidurici is a homoacetogen that can form acetic acid from purines. Soehngenia saccharolytica is a gram positive spore forming clostridia that forms acetate, H2 and CO2 as key products of its metabolism.32 Other bacteria relating to the lactobacillus group of the acidophilus complex were also observed. Bacillus cellulosilyticus produces a range of carbohydrate degrading enzymes and can produce VFA from a range of substrates including fructose, glucose, mannose, sucrose, lactose, etc., which are hydrolytic products of complex compounds present in food waste.
Table 2 Sequence based identification, classification and taxonomic affiliation of various bands excised from DGGE gels derived from the bacterial 16S rRNA gene from PT and UT
| DGGE band |
Closest relative |
Accession number |
Similarity |
Phylum |
Metabolic function |
| VFA SVM 1 |
Bacillus cereus |
NC_004722.1 |
83 |
Firmicutes |
Soil dwelling bacteria |
| Lactobacillus delbrueckii subsp. bulgaricus |
NC_008054.1 |
82 |
Firmicutes |
Lactic acid production |
| VFA SVM 2 |
Lactobacillus harbinensis |
NR_041263.1 |
96 |
Firmicutes |
Lactic acid production |
| Uncultured Lactobacillus sp. clone |
JX099832.1 |
96 |
Firmicutes |
Lactic acid production |
| VFA SVM 3 |
Propionibacterium freudenreichii subsp. shermanii |
NC_014215.1 |
88 |
Actinobacteria |
Propionic acid |
| VFA SVM 4 |
Clostridium autoethanogenum |
NC_022592.1 |
81 |
Firmicutes |
Ethanol and acetate from acetic acid |
| Acetobacter pasteurianus |
NC_013209.1 |
93 |
Proteobacteria |
Acetic acid |
| VFA SVM 5 |
Paludibacter propionicigenes |
NC_014734.1 |
85 |
Bacteroidetes |
Propionic and acetic acid |
| Bacteroides helcogenes |
NC_014933.1 |
85 |
Bacteroidetes |
Acetic acid, succinic acid, propionic acid and isobutyric acid |
| VFA SVM 6 |
Bacteroides graminisolvens |
NR_113069.1 |
93 |
Bacteroidetes |
Propionic and acetic acid |
| Bacteroides graminisolvens |
NR_041642.1 |
93 |
Bacteroidetes |
Propionic and acetic acid |
| VFA SVM 7 |
Proteiniphilum acetatigenes |
NR_043154.1 |
80 |
Bacteroidetes |
Propionic and acetic acid |
| Bacteroides graminisolvens |
NR_041642.1 |
81 |
Bacteroidetes |
Propionic and acetic acid |
| VFA SVM 8 |
Bacillus cellulosilyticus |
NR_074904.1 |
84 |
Firmicutes |
Can degrade various celluloses and produce acetic acid |
| Uncultured Brevibacillus sp. |
AM263548.1 |
82 |
Firmicutes |
— |
| VFA SVM 9 |
Soehngenia saccharolytica |
NR_117382.1 |
94 |
Firmicutes |
Acetate, H2 and CO2 |
| Clostridium acidurici |
CP003326.1 |
95 |
Firmicutes |
Acetate from purines |
| VFA SVM 10 |
Macellibacteroides fermentans |
NR_117913.1 |
86 |
Bacteroidetes |
Lacatate, acetate, butyrate and isobutyrate |
| VFA SVM 11 |
Uncultured low G + C Gram-positive bacterium |
DQ252446.1 |
84 |
— |
— |
| VFA SVM 12 |
Bacterium enrichment culture |
KJ629451.1 |
90 |
— |
— |
| Uncultured Bacteroides |
EU882476.1 |
90 |
Bacteroidetes |
— |
| VFA SVM 13 |
Uncultured bacterium |
KM105837.1 |
87 |
— |
— |
| Uncultured bacterium |
KM042872.1 |
87 |
— |
— |
| VFA SVM 14 |
Enterococcus saccharolyticus |
NR_114786.2 |
95 |
Firmicutes |
Grows on various carbon sources to produce acetic acid |
| Uncultured bacterium clone |
KM105837.1 |
95 |
— |
— |
| VFA SVM 15 |
Brassicibacter mesophilus |
NR_108841.1 |
95 |
Firmicutes |
Acetic acid and propionic acid from food waste |
| Clostridium ultunense |
NR_117379 |
95 |
Firmicutes |
Utilizes acetate and hydrogen in association with methanogen to produce methane |
| VFA SVM 16 |
Uncultured Bacteroides |
EU882476.1 |
87 |
Bacteroidetes |
— |
| Uncultured Bacteroidetes |
CU918067.1 |
87 |
Bacteroidetes |
— |
| VFA SVM 17 |
Bacillus toyonensis |
CP006863.1 |
92 |
Firmicutes |
Used for synthesizing toyonesin |
| Bacillus coagulans |
CP009709.1 |
86 |
Firmicutes |
Lactic acid |
| VFA SVM 18 |
Uncultured Bacteroidales |
KM059722.1 |
82 |
Bacteroidetes |
— |
| Uncultured Bacteroidetes |
KM058988.1 |
82 |
Bacteroidetes |
— |
| VFA SVM 19 |
Amycolicicoccus subflavus |
NC_015564.1 |
81 |
Actinobacteria |
Grows in harsh conditions like saline and oil contaminated soils |
| VFA SVM 20 |
Parabacteroides chartae |
NR_109439.1 |
86 |
Bacteroidetes |
Grows on various carbon sources to produce acetic acid |
| VFA SVM 21 |
Uncultured Bacteroidales |
FJ219718.1 |
93 |
Bacteroidetes |
— |
| Uncultured Bacteroidetes |
AB742116.1 |
91 |
Bacteroidetes |
— |
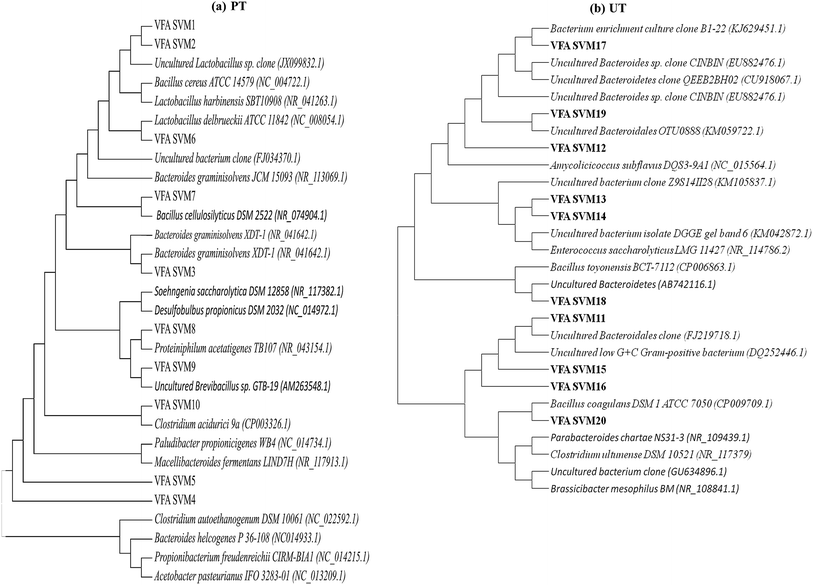 |
| | Fig. 7 The evolutionary profiles of the enriched microbial community, inferred using the neighbour-joining method (a) acid pretreated culture (PT), (b) untreated control (UT) system. | |
The majority of the bands next to the firmicutes were Bacteroidetes viz., Bacteroides graminisolvens (NR_113069.1), Proteiniphilum acetatigenes (NR_043154.1), Paludibacter propionicigenes (NC_014734.1), Macellibacteroides fermentans (NR_117913.1) and Bacteroides helcogenes (NC_014933.1). Bacteroidetes make the bulk of the microbial consortium along with firmicutes, which can treat wastewater/waste. They are acidogens and can produce fatty acids depending on the substrate available [(propionate/acetate; Proteiniphilum acetatigenes, Bacteroides graminisolvens and Paludibacter propionicigenes) (lacatate/acetate/butyrate/isobutyrate; Macellibacteroides fermentans)].33 Other groups of bacteria which showed relatedness to the acid-shock sequences were Propionibacterium freudenreichii (NC_014215.1) and Acetobacter pasteurianus (NC_013209.1). The major product of P. freudenreichii metabolism is propionic acid.28,34 The major product of A. pasteurianus metabolism is acetic acid. This bacterium is known to survive high acidity stress conditions, which explains its survival in the acid-shock reactor.35 Few of these reported bacteria are known to produce soluble external mediators, which were evident as peaks in cyclic voltammograms during various hours of operation. High propionic acid production observed in PT might be attributed due to the presence of Propionibacterium freudenreichii and Paludibacter propionicigenes bacteria. The presence of Macellibacteroides fermentans in PT leads to higher production of butyrate and iso-butyrate, as the main fermentation products of this bacterium are lactate, acetate, butyrate and iso-butyrate from glucose metabolism.
Microbial diversity of parent inoculum or UT was mostly dominated by the uncultured Bacteroides and firmicutes along with actinobacteria and several unidentified bacteria. Bacteria relating to the classes Bacillaceae and Clostridia were dominant among firmicutes, viz., Enterococcus saccharolyticus LMG 11427 (NR_114786.2), Bacillus toyonensis BCT-7112 (CP006863.1), Bacillus coagulans DSM 1 ATCC 7050 (CP009709.1), Brassicibacter mesophilus BM (NR_108841.1) and Clostridium ultunense DSM 10521 (NR_117379). Bacillus coagulans is a spore forming, lactic acid producing, facultative anaerobic bacterium while Bacillus toyonensis and Brassicibacter mesophilus are strict anaerobes found in food industry wastewater and are known to produce acetic acid and propionic acid.16 Among the phylum Bacteroidetes, relatives of parabacteriodes (NR_109439.1) and uncultured Bacteroides were found to be dominant. Other relatives observed are Amycolicicoccus subflavus (NC_015564.1), along with several unidentified and uncultured bacteria. Amycolicicoccus subflavus is an actinobacterium which is known for growing in harsh environments.36 In UT most of the Bacteroides identified are unculturables whose functional role in the fatty acid production is unknown. It has also been observed that many species that grow on various types of food wastes are identified in UT, owing to the substrate given.
On the basis of these results, it is can be proposed that the acid pretreatment of inoculum has enriched the bacteria related to the families Clostridiaceae, Bacteriodes and Bacillaceae, which are in turn involved in the production of volatile fatty acids and H2 from a wide range of carbon sources, while surviving the acid stress. In the case of UT, along with acidogens, certain non-specific and VFA utilizing bacteria also survived, which might have reduced the yield of VFA and H2. Lower production of VFA in the UT might be attributed to the prevailing of methanogenic activity that utilizes VFA along with H2 towards CH4 conversion, which is evident from the presence of Clostridium ultunense. Clostridium ultunense can oxidize acetic acid to produce CH4 in syntrophic association with H2, utilizing MB at low partial pressure of H2,37 which is particularly true in the case of UT, where the H2 production rates are low, making this reaction possible. Elevated levels of CH4 indicate the syntrophic association between this clostridium species and methanogens. PT suppresses the growth of MB resulting in regulation of the acidogenic activity, facilitating higher VFA production.
3.5 System redox microenvironment
Prior to start-up, the aqueous phase pH of both biosystems were adjusted to alkaline conditions (pH 10) based on a previous study,10 which aided higher solubilisation of food waste. Alkaline conditions prevent the specific activity of methanogenic archaea that prefer a neutral pH and eventually consume VFA. Over the course of time, both the bioreactors showed decrement in pH due to the accumulation of VFA in the system (Fig. 8). Initially, a marginal drop in pH was observed up to 6 h, followed by a marked drop (PT/UT: 8.76/8.91), which continued till the end of the cycle operation (102 h: 5.5/6.9). The PT system showed a greater pH drop (5.5) than the corresponding UT system (6.9). The drop in the system pH indicated fatty acid accumulation, and their effects are more evident when the pH is below 7.0. The UT system showed an increment in pH at the end of the cycle period, due to degradation of the fatty acids by obligate proton reducing bacteria (methanogens/heterotrophic acetogens). The pH imposes altered dynamics between different groups of microorganisms, but also facilitates a metabolic shift within the same group. Change in pH may also influence the enzyme activities and in turn, the metabolic activities of the biocatalyst. Neutral pH assists methanogens to grow over acidogens. In the case of UT operation, a more or less neutral redox microenvironment was observed from 78 to 102 h, which invariably favours the methanogenic activity and leads to CH4 evolution. A sudden increase in pH to 7.3 at the 90th h might be due to the consumption of accumulated VFA as a primary substrate by the homoacetogens. Alkaline pH improves the acetic acid accumulation/production and its fraction in the total VFA.12 Production and/or consumption of butyric acid was inconsistent with pH and time.
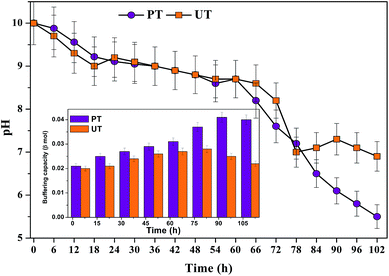 |
| | Fig. 8 Change in pH from 0th h to 102nd h of operation. Influence of acid-shock pretreatment on buffering capacity (shown as insert). | |
Fatty acid production influences the system's buffering capacity (BC) as well. The system's BC correlated well with the VFA production and system pH. The PT system showed improved buffering until the 90th h of cycle operation (12 h (0.021β mol); 102 h (0.04β mol; 102 h)). On the other hand, the UT system showed an increase in BC till the 72nd h and decreased thereafter till the end of cycle. The UT system has higher BC at 72nd h (0.028β mol), which was reduced to 0.022β mol at 102nd h. The pH is kept stable by the buffer effect of the protein residues and other macromolecules present.38 In situ buffering systems like ammonium bicarbonate (pKa 6.35/9.35) and free ammonia present in the system, which in association with fatty acids, viz., formic acid (pKa 9.25), acetic acid (pKa 4.75/9.25), bicarbonate (pKa 6.35/9.35) and carbonate (pKa 6.35/9.25), play a great role in buffering biological systems.
3.6 Waste remediation
COD removal helps in elucidating the substrate consumption by the system microbiomes (Fig. 9). Comparatively, the acid-shock pretreated system depicted less substrate (COD) removal (45–54%) than the UT system (58–65%), which can be directly attributed to the specific enrichment of acidogenic bacteria to terminate the metabolic reaction until fatty acid production. Prevalence of Proteiniphilum acetatigenes, Bacteroides graminisolvens, Paludibacter propionicigenes and Macellibacteroides make the system more effective in utilizing carbohydrate sources commonly found in food based wastewater. Interestingly, in the PT system Proteiniphilum acetatigenes a proteolytic bacterium was also found. It helps to degrade proteins and grows on very limited substrates to produce acetate and propionate. Most of the bacteria belonging to firmicutes have wide nutritional choices to act upon, enabling them to live on a wide range of substrates.
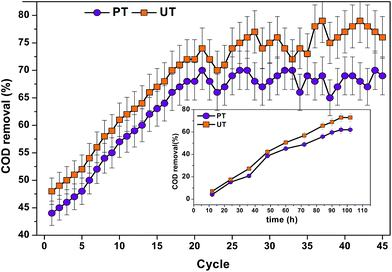 |
| | Fig. 9 Substrate degradation in terms of COD removal (%) (15 kg COD per m3 per day) at pH 10 for pretreated and untreated operations at different cycles. inset: change in the substrate removal pattern (COD removal (%) in both the reactors, with respect to time recorded at 37th cycle. | |
4. Conclusion
The selectively enriched acidogenic bacteria enhanced the biosynthesis of short chain carboxylic acids in a pre-treated system, as opposed to an untreated biocatalyst system. Alkaline operation conditions (pH 10) induced the hydrolysis of food based wastewater and resulted in enhanced short chain carboxylic acids, along with biohydrogen (H2) production as co-products in the pretreated system. A high concentration of acetic acid, with the simultaneous production of medium chain caproic acid in the pretreated system, demonstrates the efficiency of the system to produce carboxylic acids. This also induced the high degree of acidification (DOA) in the pretreated system, contrary to the untreated system. Microbial community profiling showed the dominance of spore forming acidogenic firmicutes and short chain fatty acid producing Bacteroides in the pretreated system. The present study highlights the application of pretreatment to parent biocatalyst and promises to be a viable option for enhancing the production of valuable platform chemicals through valorisation of food based wastewater in a sustainable way.
Abbreviations
| VFA | Volatile fatty acids |
| UT | Untreated biocatalyst |
| PT | Pretreated biocatalyst |
| DOE | Department of energy |
| AB | Acidogenic bacteria |
| MB | Methanogenic bacteria |
| OL | Organic load |
| SHE | Standard hydrogen electrode |
| MCFA | Medium chain fatty acids |
| DOA | Degree of acidification |
| BC | Buffering capacity |
| E | Applied potential |
| COD | Chemical Oxygen Demand |
| DGGE | Denaturing Gradient Gel Electrophoresis |
| PCR | Polymerase Chain Reaction |
Acknowledgements
We are grateful to the Director, CSIR-IICT for his kind support in carrying out this work. The reported research was supported by Department of Biotechnology (DBT) and CSIR (SETCA; CSC 0113).
References
- M. T. Agler, B. A. Wrenn, S. H. Zinder and L. T. Angenent, Trends Biotechnol., 2011, 29(2), 70–78 CrossRef CAS PubMed
 .
. - W. S. Lee, A. S. M. Chua, H. K. Yeoh and G. C. Ngoh, Chem. Eng. J., 2014, 235, 83–99 CrossRef CAS
 .
. - Z. Sun, L. Xue, S. Wang, X. Wang and J. Shi, Green Chem., 2016, 18, 742 RSC
 .
. - R. R. Singhania, A. K. Patel, G. Christophe, P. Fontanille and C. Larroche, Bioresour. Technol., 2013, 145, 166–174 CrossRef CAS PubMed
 .
. - K. Amulya, M. V. Reddy and S. Venkata Mohan, Bioresour. Technol., 2014, 158, 336–342 CrossRef CAS PubMed
 .
. - C. M. Spirito, H. Richter, K. Rabaey, A. J. M. Stams and L. T. Angenent, Curr. Opin. Chem. Biol., 2014, 27, 115–122 CrossRef CAS PubMed
 .
. - E. Reyhanitash, B. Zaalberg, H. M. IJmker, S. R. A. Kersten and B. Schuur, Green Chem., 2015, 17, 4393–4400 RSC
 .
. - S. Vajpeyi and K. Chandran, Bioresour. Technol., 2015, 188, 49–55 CrossRef CAS PubMed
 .
. - R. Chandra, S. Arora, M. V. Rohit and S. Venkata Mohan, Bioresour. Technol., 2015, 188, 169–178 CrossRef CAS PubMed
 .
. - S. Dahiya, O. Sarkar and S. Venkata Mohan, Bioresour. Technol., 2015, 182, 103–113 CrossRef CAS PubMed
 .
. - S. J. Lim, B. J. Kim, C. M. Jeong, J. Choi, Y. H. Ahn and H. N. Chang, Bioresour. Technol., 2008, 99, 7866–7874 CrossRef CAS PubMed
 .
. - S. Venkata Mohan, V. L. Babu and P. N. Sarma, Bioresour. Technol., 2008, 99, 59–67 CrossRef CAS PubMed
 .
. - M. Noori and C. Saady, Int. J. Hydrogen Energy, 2013, 38, 13172–13191 CrossRef
 .
. - M. X. Fang, W. W. Zhang, Y. Z. Zhang, H. O. Tan, X. O. Zhang, M. Wu and X. F. Zhu, Int. J. Syst. Evol. Microbiol., 2014, 62, 3018–3023 CrossRef PubMed
 .
. - L. D. Gottumukkala, R. K. Sukumaran, S. Venkata Mohan, S. K. Valappil, O. Sarkar and A. Pandey, Green Chem., 2015, 17, 3047–3058 RSC
 .
. - S. Srikanth, S. Venkata Mohan, V. L. Babu and P. N. Sarma, Int. J. Hydrogen Energy, 2010, 35, 10693–10700 CrossRef CAS
 .
. - R. K. Goud, S. V. Raghavulu, G. Mohanakrishna, K. Naresh and S. Venkata Mohan, Int. J. Hydrogen Energy, 2012, 37, 4068–4076 CrossRef CAS
 .
. - R. Kleerebezem and M. C. V. Loosdrecht, Curr. Opin. Biotechnol., 2007, 18, 207–212 CrossRef CAS PubMed
 .
. - S. Venkata Mohan, Y. V. Bhaskar and P. N. Sarma, Water Res., 2007, 41, 2652–2664 CrossRef CAS PubMed
 .
. - O. Sarkar, R. K. Goud and S. Venkata Mohan, Bioresour. Technol., 2013, 147, 321–331 CrossRef CAS PubMed
 .
. - R. K. Goud, O. Sarkar and S. Venkata Mohan, Int. J. Hydrogen Energy, 2014, 39, 7572–7586 CrossRef
 .
. - C. S. K. Lin, L. A. Pfaltzgraff, L. H. Davila, E. B. Mubofu, S. Abderrahim, J. H. Clark, A. A. Koutinas, N. Kopsahelis, K. Stamatelatou, F. Dickson, Z. Thankappan, S. Mohamed, R. Brocklesbyc and R. Luque, Energy Environ. Sci., 2013, 6, 426–464 CAS
 .
. - E. Alkaya and G. N. Demirer, Biomass Bioenergy, 2011, 35, 32–39 CrossRef CAS
 .
. - S. Venkata Mohan, L. Agarwal, G. Mohanakrishna, S. Srikanth, A. Kapley, H. J. Purohit and P. N. Sarma, Int. J. Hydrogen Energy., 2011, 36, 8234–8242 CrossRef CAS
 .
. - M. T. Madigan, J. M. Martinko and T. D. Brock, Brock biology of microorganisms, Pearson Prentice Hall, 2006 Search PubMed
 .
. - K. V. Krishna, O. Sarkar and S. Venkata Mohan, Bioresour. Technol., 2014, 174, 142–151 CrossRef CAS PubMed
 .
. - Y. Yang, M. Xua, J. Guo and G. Suna, Process Biochem., 2012, 47, 1707–1714 CrossRef CAS
 .
. - R. Kodziusa and T. Gojoboria, Mar. Genomics, 2015, 24, 21–30 CrossRef PubMed
 .
. - R. K. Goud and S. Venkata Mohan, RSC Adv., 2012, 2, 6336–6353 RSC
 .
. - G. W. Park, Q. Fei, K. Jung, H. N. Chang, Y. C. Kim, N. j. Kim, J. Choi, S. Kim and J. Cho, Biotechnol. J., 2014, 9, 1536–1546 CrossRef CAS PubMed
 .
. - K. Hartwich, P. Anja and D. Rolf, PLoS One, 2012, 7, e51662 CAS
 .
. - J. Abrini, N. Henry and N. Edmond-Jacques, Arch. Microbiol., 1994, 161, 345–351 CrossRef CAS
 .
. - D. Mead, D. Colleen and J. B. Phillip, PLoS One, 2013, 8, e61131 CAS
 .
. - A. Ueki, A. Hiroshi, S. Daisuke and K. Ueki, Int. J. Syst. Evol. Microbiol., 2006, 56, 39–44 CrossRef CAS PubMed
 .
. - J. H. L. Gannoun, J. L. Cayol, A. H. M. Sakamoto, E. Falsen and M. Ohkuma, Int. J. Syst. Evol. Microbiol., 2012, 62, 2522–2527 CrossRef PubMed
 .
. - V. M. Gullo, L. D. Vero and P. Giudici, Appl. Environ. Microbiol., 2009, 75, 2585–2589 CrossRef PubMed
 .
. - S. N. Parshina, K. Robbert, J. L. Sanz, G. Lettinga, A. N. Nozhevnikova, N. A. Kostrikina, A. M. Lysenko and A. J. M. Stams, Int. J. Syst. Evol. Microbiol., 2003, 53(6), 1791–1799 CrossRef CAS PubMed
 .
. - S. Dinamarca, G. Aroca, R. Chamy and L. Guerrero, Water Sci. Technol., 2003, 48, 249–254 CAS
 .
.
|
| This journal is © The Royal Society of Chemistry 2016 |


.
.
.
.
.
.
.
.
.
.
.
.
.
.
.
.
.
.
.
.
.
.
.
.
.
.
.
.
.
.
.
.
.
.
.
.
.
.


