 Open Access Article
Creative Commons Attribution 3.0 Unported Licence
Molecular understandings on the activation of light hydrocarbons over heterogeneous catalysts
Zhi-Jian
Zhao
 a,
Cheng-chau
Chiu
b and
Jinlong
Gong
 *a
*a
aKey Laboratory for Green Chemical Technology of Ministry of Education, School of Chemical Engineering and Technology, Tianjin University, Collaborative Innovation Center of Chemical Science and Engineering, Tianjin 300072, China. E-mail: jlgong@tju.edu.cn; Fax: +86-22-87401818
bDepartment Chemie, Technische Universität München, 85747 Garching, Germany
First published on 12th June 2015
Abstract
Due to the depletion of petroleum and the recent shale gas revolution, the dropping of the price for light alkanes makes alkanes an attractive feedstock for the production of light alkenes and other valuable chemicals. Understanding the mechanism for the activation of C–H bonds in hydrocarbons provides fundamental insights into this process and a guideline for the optimization of catalysts used for the processing of light alkanes. In the last two decades, density functional theory (DFT) has become a powerful tool to explore elementary steps and mechanisms of many heterogeneously catalyzed processes at the atomic scale. This review describes recent progress on computational understanding of heterogeneous catalytic dehydrogenation reactions of light alkanes. We start with a short description on basic concepts and principles of DFT as well as its application in heterogeneous catalysis. The activation of C–H bonds over transition metal and alloy surfaces are then discussed in detail, followed by C–H activation over oxides, zeolites and catalysts with single atoms as active sites. The origins of coking formation are also discussed followed by a perspective on directions of future research.
1 Introduction
Activation of hydrocarbons over heterogeneous catalysts is a dynamic and growing field of research since the birth of the modern petroleum and natural gas industry. Recent development of hydraulic fracturing or “fracking” technologies have shown the ability to efficiently extract shale gas, which will increase the supply of CH4 as well as other light alkanes, mainly ethane and propane,1 rendering them a cheap and reliable source for chemical industry.2 On the other hand, light alkenes are important feedstocks for the production of polymers, oxygenates and many other important chemical intermediates. Currently, the most common approaches to produce light alkenes are steam creaking and fluid catalytic cracking (FCC) of naphtha, light diesel and other oil byproducts.1 In 2007, 95% of propylene was produced as a byproduct of ethylene plants and other refineries.3 Although the recovery rate of propylene from a FCC unit have increased from 29% in 1980 to ∼80% in 2009, the fast growing demand for propylene still pushes up its price.4 Thus, an alternative process, such as the propane dehydrogenation (PDH), shows a high potential in profitability due to the large price difference between propane and propylene.Currently, the most commonly used commercial PDH catalysts include supported Pt or CrOx. Although supported Pt catalysts show high activity, the catalyst deactivation due to coke formation remains a challenging issue.5 Moreover, since PDH is an endothermic reaction (ΔH298![[thin space (1/6-em)]](https://www.rsc.org/images/entities/char_2009.gif) K = 124 kJ mol−1), high reaction temperatures favor transformation from propane to propylene. However, the undesired deep dehydrogenation leading to coke formation is also enhanced at high temperatures. Thus, the development of strategies to avoid coke formation is an important field of research. The robustness against coking can be increased with additional promoters, such as late transition metals, main-group metals including Sn and Ga, alkali-metal oxides and rare-earth metal oxides.6 However, the nature of atomic structure of these promoters during the dehydrogenation process is still under debate.
K = 124 kJ mol−1), high reaction temperatures favor transformation from propane to propylene. However, the undesired deep dehydrogenation leading to coke formation is also enhanced at high temperatures. Thus, the development of strategies to avoid coke formation is an important field of research. The robustness against coking can be increased with additional promoters, such as late transition metals, main-group metals including Sn and Ga, alkali-metal oxides and rare-earth metal oxides.6 However, the nature of atomic structure of these promoters during the dehydrogenation process is still under debate.
Besides the production of propylene, the activation of the C–H bond in methane is also an important but challenging process. The relatively stable methane C–H σ bond, the negative electron affinity, the large ionization energy, the absence of a dipole moment and the extremely high pKa renders methane highly resistant to attacks by most redox active reagents, acids and bases. One of the most widely used technologies is the reforming process. It converts methane as well as other hydrocarbons into synthesis gas or hydrogen (with other byproducts), which can be further used in various processes to yield value added chemicals. Although this process has been extensively studied for nearly half a century, researchers are still trying to gain more insights into the reforming process by means of modern (in situ) characterization techniques, as well as theoretical calculations.7
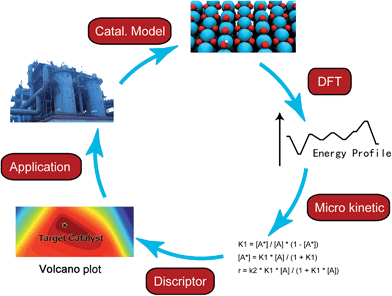
In the last few decades, density functional theory (DFT) has become a powerful tool for studying heterogeneous catalytic processes and their elementary steps and mechanisms at atomic scale. Such an “atomic resolution” of the processes is very hard to be achieved experimentally. Along with the development of novel computational architectures and the exponential increase in computational processor speed, the catalytic systems treated by DFT have developed from simple models such as metal or oxide single crystal surfaces to more sophisticated ones including alloys, supported catalysts and zeolites etc. In addition, with advanced kinetic modeling, the rate constants of elementary steps calculated with DFT can be further converted to turnover rate under reaction conditions. By applying linear correlations between activation energies and descriptors, e.g. binding energy or Brønsted–Evans–Polanyi (BEP) relationship, the activity and selectivity of a chemical process can be deduced from a small number of descriptors instead of from a large amount of detailed, but also hard to overview, information of all elementary steps. As the reaction rates are essentially governed by only a few descriptors, a large number of potential catalysts can be screened rapidly by means of computational chemistry.8,9 Nevertheless, the fundamental understanding offered by DFT calculations still serves as a cornerstone in the complete process of computer-aided catalytic design (Fig. 1).
This review describes mechanistic insights into heterogeneous catalytic dehydrogenation of light alkanes obtained from DFT calculations. The progress of dehydrogenation using homogenous catalysts was recently reviewed by Balcells et al.10 and it will not be included in this review. We start with the background of density functional theory and its application for heterogonous catalysts. We then provide an overview addressing dehydrogenation reactions on metal or alloy surfaces, which represent the most studied area under this topic. The reactions on three other types of catalysts, including oxides, zeolites and singe site (atom) catalysts are covered in the Section 4. We then turn to the review of mechanistic studies on coke formation, which is one of the most common factors leading to catalyst deactivation during dehydrogenation reactions. A summary and outlook is given in the last section.
2 Background of DFT calculations in heterogonous catalysis
For the investigation of solid states, DFT is an important and powerful method for quantum mechanical modeling developed in the last century. The origin of DFT can be traced back to the Thomas–Fermi model in 1920s.11,12 From the 1960s, the formulation of DFT addressed by Kohn and Sham (KS), became the basis of current routinely used computational methods.13 In the KS formalism, the entire unknown part of the energy functional is collected in the exchange–correlation energy EXC, where approximations are used. The approximation can have different levels of sophistication, which is compared by Perdew and Schmidt to the rungs of the “Jacob's ladder” of density functional approximations.14 Nowadays, most popular functionals used in periodic systems are mainly at the second rung, i.e. generalized gradient approximation (GGA) level, for example Perdew–Wang 199115 (PW91) and Perdew–Burke–Ernzerhof16 (PBE) functionals, which feature a high accuracy-to-cost ratio for many applications. However, for studies on heterogeneous catalysts, both PW91 and PBE functionals have several shortcomings, including over binding of surface intermediates17 and lack of van der Waals (vdW) dispersion interactions.18 The later developed revised PBE functional (RPBE17) improves the reproducibility of experimental binding energies for surface species. Recently, more attempts have been done in order to account for vdW dispersion between non-overlapped densities with several different approaches, and a new family of “vdW” functionals, such as vdW-DF,19 BEEF-vdW20etc., have been developed. The performance of functionals at different levels have been compared in several test studies.21,22To model a catalytic particle/surface, the simplest and most common way is to employ a slab model of a low Miller index surface, with typically 3–6 atomic layers thickness in case of modeling metals. The terrace, edge and corner atoms on a metal particle can be approximately described by corresponding atoms on flat, step and kink surfaces, respectively. However, if the studied catalyst consists of ultra-small nanoparticles or sub-nanometer clusters, a non-periodical cluster model may be more reasonable due to the existence of quantum size effects.23 Recent researches start to take the support into account, using either a metal cluster/particle,24 an 1-D periodic nanowire,25 or a 2-D periodic catalyst slab supported on a 2-D periodic support slab. The former two types of models, i.e. supported clusters or nanowires, explicitly contain the sites at metal/support interface, which may be essential for the understanding of the catalytic activity at the catalyst–support interface of a bi-functional catalyst.
To describe a reaction, at least three data points need to be located on the potential energy surface: the initial, transition and final states. The optimization of initial and final states are relatively simple. However, the identification of a transition-state structure, which is a saddle point on the potential energy surface, is more challenging and computationally expensive. Moreover, due to the lack of an analytical second derivative for plane wave based DFT code, so-called mode-following methods which find transition states by following low curvature directions from energy minima are not easily implemented.26 The most widely used methods in this area can be categorized into two groups: (1) Elastic Band (EB) method and its improvements such as the Nudged Elastic Band method (NEB) and the climbing image nudged elastic band method;27 (2) dimer method.28 The EB family of methods locate a transition state by simultaneously optimizing a chain of structures between the initial and final states, which are connected by an “elastic band”. In the dimer method, the algorithm moves two images (dimer) uphill along the lowest curvature mode, which is estimated according to Voter's hyperdynamics method without evaluating the Hessian matrix, on the potential energy surface.28 Because of the complexity associated with the identification of a transition state, other attempts have been made to estimate the reaction barrier without explicitly obtaining the transition state structure and energy. Widely used ones include the BEP relationship29 and other types of scaling relationship. All of these attempts try to obtain linear correlations between activation barriers and other easily calculated quantities, or so called descriptors, such as reaction energies,29 d-band center of metal slabs,30 and atomic binding energies.31
The energetics obtained directly from DFT calculations describe the potential energy surface at 0 K and 0 bar. To describe a chemical process under realistic reaction conditions, thermodynamic corrections are necessary, which includes the zero point energy as well as the contributions to enthalpy and entropy at higher temperature and pressure. These corrections can be easily calculated according to statistical thermodynamics for an ideal gas. However, the corrections for an adsorbed system, especially for the soft frustrated translation and rotation modes, are not always well defined. Unfortunately, these soft modes have a large contribution to the total entropy. Thus, they cannot be completely ignored. Several different approaches have been made to estimate this entropy, including treating soft modes in the same way as other vibration modes,32 employing a harmonic well model,33 or estimating from gas-phase entropy values.34
Although the calculated reaction energies and barriers of the elementary steps provide useful clues to interpret the reaction mechanism, a more reliable method is to solve the steady-state at reaction conditions based on the calculated kinetic and thermodynamic information. Two common approaches include micro-kinetic modeling, which uses a mean-filed description,33 and kinetic Monte Carlo (kMC) simulation which includes the explicit consideration of the correlations, fluctuations and spatial distributions of the adsorbates at the catalyst surface.35 By including the linear relationship between barriers and descriptors mentioned above, the activity and selectivity predicated by kinetic analysis can be projected from a high dimension space including information of all elementary steps to a simple descriptor space, and a volcano plot can be generated for a direct guide to locate the optimal catalyst.36
3 Metal surfaces
3.1 Pure metal surfaces
Methane dehydrogenation on fcc(111) and hcp(0001). Table 1 collected parts of previously calculated reaction energies and barriers of CH4 decomposition steps over close packed fcc(111)40–60 or hcp(0001)61 surfaces. The most obverse signature for this series of reactions is the relatively high barriers for the first (D1) and last (D4) dehydrogenation steps, among many of which the barriers are higher than 100 kJ mol−1 (Table 1). In contrast, the barriers for D2 and D3 steps are mostly less than 80 kJ mol−1, and can be even as low as <10 kJ mol−1. A necessary condition to form such a trend is the similar transition states of these dehydrogenation reactions over hexagon-shaped fcc(111) or hcp(0001) surfaces: the C–H bond is activated by interacting simultaneously with a surface metal atom, forming C–M–H three-membered ring structure (Fig. 2).
| D1 | D2 | D3 | D4 | ||||||||||||||||
|---|---|---|---|---|---|---|---|---|---|---|---|---|---|---|---|---|---|---|---|
| Surface | CH4 = CH3 + H | CH3 = CH2 + H | CH2 = CH + H | CH = C + H | XC | Cut-off/eV | k points | Unit cell | No. layersd | Software | Ref. | ||||||||
| E(s) | E(c) | E a | E(s) | E(c) | E a | E(s) | E(c) | E a | E(s) | E(c) | E a | ||||||||
| a Double-ζ plus polarization. b Ads on both sides. c Unspecified E(s) or E(a). d xr yf: x relaxed layer with y fixed layer | |||||||||||||||||||
| Ni(111) | 88 | 126 | 15 | 86 | −37 | 40 | 41 | 133 | RPBE | 15 | 2 × 2 | 1r 2f | ADF-BAND | 46 | |||||
| Ni(100) | 65 | 119 | 9 | 60 | −32 | 21 | −3 | 62 | RPBE | 15 | 2 × 2 | 1r 2f | ADF-BAND | 46 | |||||
| Ni(553) | 8 | 104 | −8 | 69 | −49 | 14 | −28 | 45 | RPBR | 12 | 2 × 1 | 5r 8f | ADF-BAND | 46 | |||||
| Ni(111) | 38 | 114 | 20 | 75 | −33 | 36 | 59 | 131 | PBE | 340 | 5 × 5 × 1 | 2 × 2 | 2r 1f | CASTEP | 40 | ||||
| Ni(111) | 5 | 34 | 77 | −43 | −27 | 35 | 49 | 81 | 137 | PBE | DZPa | 5 × 5 × 1 | 1r 3f | SeqQuest | 41 | ||||
| Ni(111) | −1c | 88 | 7c | 68 | −33c | 34 | 50c | 128 | PBE | 400 | 3 × 3 × 1 | 3 × 3 | 3r 1f | VASP | 42 | ||||
| Co(111) | 7 | 31 | 104 | 17 | 42 | 60 | −38 | 25 | 39 | 35 | 107 | 119 | PW91 | 340 | 5 × 5 × 1 | 2 × 2 | 3r 1f | CASTEP | 45 |
| Cu(100) | 70c | 145 | 65c | 116 | 33c | 72 | 98c | 170 | PBE | DZPa | 2 × 2 × 1 | 4 × 4 | SIESTA | 47 | |||||
| Cu(111) | 76 | 86 | 171 | 82 | 92 | 148 | 56 | 61 | 109 | 143 | 144 | 191 | PBE | DZPa | 4 × 4 × 1 | 3 × 3 | 2r 2f | Dmol | 50 |
| Cu(100) | 87 | 84 | 153 | 81 | 104 | 150 | 12 | 26 | 74 | 84 | 86 | 149 | PBE | DZPa | 4 × 4 × 1 | 3 × 3 | 2r 3f | Dmol | 50 |
| Cu(111) | 72 | 151 | 80 | 131 | 40 | 91 | 118 | 178 | PBE | 400 | 5 × 5 × 1 | 3 × 3 | 2r 2f | VASP | 48 | ||||
| Cu(111) | 95 | 158 | 142 | 49 | 100 | PBE | 400 | 7 × 7 × 1 | 2 × 2 | 2r 2f | VASP | 48 | |||||||
| Cu(111) | 96 | 188 | 92 | 138 | 46 | 117 | 130 | 205 | PBE | 340 | 5 × 5 × 1 | 2 × 2 | 3f | VASP | 49 | ||||
| Cu(211) | 33 | 138 | 79 | 134 | 13 | 184 | 75 | 176 | PBE | 340 | 4 × 4 × 1 | 3 × 3 | 3f | VASP | 49 | ||||
| Ru(0001)b | −6 | 15 | 85 | −5 | 18 | 49 | −45 | −33 | 16 | 35 | 59 | 108 | PW91 | 5 × 5 × 1 | 2 × 2 | 4r | VASP | 61 | |
| Rh(111) | 11 | 79 | −10 | 53 | −50 | 6 | 54 | 108 | PW91 | 310 | 5 × 5 × 1 | 2 × 2 | 3r 1f | CASTEP | 51 | ||||
| Rh(100) | −13 | 62 | −10 | 32 | −60 | 5 | −22 | 68 | PW91 | 310 | 5 × 5 × 2 | 2 × 2 | 3r 1f | CASTEP | 51 | ||||
| Rh(110) | −2 | 67 | −11 | 30 | −12 | 111 | −17 | 50 | PW91 | 310 | 3 × 5 × 2 | 2 × 2 | 3r 1f | CASTEP | 51 | ||||
| Rh(111) | −49 | −7 | 58 | −26 | −62 | 53 | −95 | −63 | 3 | 46 | 36 | 104 | PW91 | 400 | 3 × 3 × 1 | 3 × 3 | 5 | VASP | 52 |
| Rh(211) | −87 | −40 | 35 | −55 | −12 | 60 | −112 | −63 | 25 | −16 | 24 | 78 | PW91 | 400 | 3 × 3 × 1 | 6 | VASP | 52 | |
| Rh(111) | 10 | 21 | 67 | 10 | 41 | PBE | 367 | 4 × 4 × 1 | 2 × 2 | 3r 1f | QESPRESSO | 53 | |||||||
| Rh(111)b | 9 | 29 | 70 | 47 | 10 | PW91 | 400 | 5 × 5 × 1 | 2 × 2 | 2r 1f 2r | 54 | ||||||||
| Pd(111) | 35 | 92 | 21 | 100 | −20 | 57 | 99 | 120 | PW91 | 400 | 4 × 4 × 1 | 2 × 2 | 4 | CASTEP | 60 | ||||
| Ir(111) | −30 | 11 | 90 | −34 | −19 | 48 | −53 | −71 | 39 | 75 | 149 | PBE | 380 | 6 × 6 × 1 | 2 × 2 | 2r 2f | CASTEP | 56 | |
| Pt(111) | −13 | 5 | 82 | 33 | 5 | 97 | −38 | −58 | 57 | 84 | 61 | 149 | PBE | 380 | 6 × 6 × 1 | 2 × 2 | 1r 2f | CASTEP | 56 |
| Pt(111) | −28c | 61 | 7c | 80 | −63c | 16 | 45c | 124 | PBE | DZPa | 5 × 5 × 1 | 2 × 2 | 2r 2f | SIESTA | 62 | ||||
| Pt(211) | −55c | 20 | −44c | 17 | −43c | 53 | 32c | 124 | PBE | DZPa | 3 × 4 × 1 | 2 × 1 | 6r 6f | SIESTA | 62 | ||||
| Pt(111) | 21 | 90 | 7 | 72 | 74 | 16 | 24 | 120 | RPBE | 415 | 6 × 6 × 1 | 3 × 3 | 6 | VASP | 59 | ||||
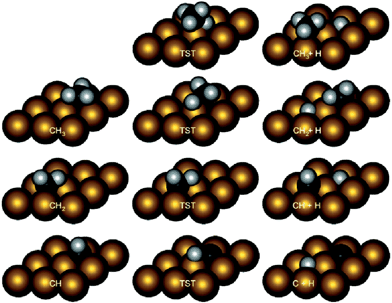 | ||
| Fig. 2 Intermediate and transition state structures of CH4 dehydrogenation on Rh(111). Adapted with permission from ref. 52. Copyright 2011 American Chemical Society. | ||
At least two factors contribute to the relative high barriers of D4 among all four dehydrogenation steps, electronically and geometrically. The electronic effect is influenced by the relative stability of dehydrogenated intermediates. CH is the most stable surface intermediate during the dehydrogenation process.29 The following D4 step starting from CH is always strongly endothermic and leads to a high thermodynamic barrier (i.e. reaction energy), over 50 kJ mol−1, on many calculated surfaces. Meanwhile, geometrically the perpendicular nature of CH is not favorable for further dehydrogenation, where an energy penalty needs to be applied to bend the structure parallel to surface in the transition state (Fig. 2). Both effects tend to push up the barrier of D4 step. Similar strong bending of the adsorbate is also necessary for the D1 step, in order to move the C atom more close to the metal surface in the transition state.
Table 1 also shows that, in general, CH4 decomposition barriers become higher along with the surface metal elements moving to the right of the periodic table. Following the Nilsson and Pettersson model,62 the interaction between doubly occupied orbitals of adsorbates and high electron occupied d orbitals is repulsive. As we move to the right of periodic table from Ru, there are more electrons filled in the metal d band, and the repulsion between occupied orbital interactions becomes stronger. This leads to weak binding of surface intermediates, as well as poor stabilization of transition states. Deeper dehydrogenation removes H atoms from the adsorbed intermediate, which results in more C–metal interaction, and eventually leads to higher reaction barriers. Indeed, the total thermodynamics for CH4 = C* + 4H* is exothermic by 21 kJ mol−1 on Ru(0001), where Ru has 7 electrons in the d band. However, on Cu(111) where Cu has a filled d band, this process becomes strongly endothermic by 364 kJ mol−1, which is even much higher than highest kinetic barrier over Ru(0001). It has been suggested that this effect can be simply characterized by the d-band center solely, where stronger binding of the adsorbate is expected in case of a metal with higher d-band center (Fig. 3).63
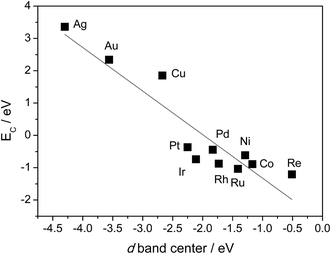 | ||
| Fig. 3 Relationship between C binding energy and metal d-band center. C binding energies are calculated with 3 × 3 unit cell, BEEF functional. Values of d-band center energies are adapted from ref. 63. | ||
Another interesting observation is the high D1 barriers (>100 kJ mol−1) on 3d metals compared with the D1 barriers (<100 kJ mol−1) on 4d or 5d metals. For elements in the same column, the main difference between them is the extension of the d atomic orbitals.29 The 3d orbitals of Ni, Co and Cu are more contracted, while the transition metals in the fourth or fifth row are found with larger extension of the d atomic orbitals, which leads to preferential adsorption of the adsorbates such as CH3, CO or NH3 on top sites.64 This process minimizes the similar repulsion interaction,29 which results in the stronger binding and lower barrier for 4d and 5d series.
Methane dehydrogenation on fcc(100). The (100) facet is a more open surface whose surface atoms have a coordination number (CN) of 8. On Ni(100), the rate determining step for CH4 decomposition is the D1 step, with >120 kJ mol−1 barrier. The barriers of the other three steps are <65 kJ mol−1. Interestingly, all four dehydrogenation barriers on Ni(100) are lower than the corresponding ones on Ni(111), which has been connected to the higher d-band center of Ni(100) surface (−1.64 eV) than of Ni(111) (−1.78 eV).46 Besides the electronic effect, a strong stabilization of adsorbed C atoms was observed on Ni(100), which binds >100 kJ mol−1 stronger than a C atom on Ni(111). The more stable tetra-coordinated C on Ni(100) reflects the needs of a C atom to satisfy its valence.46 It further results in that the D4 barrier is only 62 kJ mol−1 on Ni(100), much lower than the barrier on Ni(111), which is >120 kJ mol−1. Similar stabilization of adsorbed carbon atom and low barriers of D4 steps were also observed on Cu(100)50,65 and Rh(100).51
Methane dehydrogenation on stepped fcc(211) surfaces. Compared with barriers on terrace (111) surfaces, lower dehydrogenation barriers of D1 and D4 were reported on stepped (211) surfaces.49,50,66 The first clue related to this observation is the existence of low-coordinated step atoms on (211) surfaces. Since the binding strength of surface intermediates tends to increase along with the decreasing of coordination number,32 there is more stabilization of transition and final states of D1 step at low coordinated step site of (211) than on corresponding (111) surfaces. However, the initial state of this reaction is physically adsorbed CH4 whose binding strength is not influenced by the coordination number of surface atoms. Thus, D1 barriers on the (211) step edge are lower than the corresponding ones on the (111) terrace site. In the following D2–D4 dehydrogenation steps, all the initial, transition and final states have already bound to edge sites, and the additional stabilization between the low coordinated edge atoms and adsorbed intermediates mostly cancels out. In addition, the geometry effect also influences the relative barrier heights of these steps on step and terrace surfaces. Additional bending in the transition states of D3 step on Rh(211)50 and Cu(211)49 induces higher D3 barriers on (211) surfaces than the corresponding barriers on (111). While reverse effects were observed for the D4 step, resulting in lower barriers on (211) surfaces.49,50
Methane steam reforming on transition-metal surfaces. Jones et al.7 performed a detailed kinetic analysis on the methane steam reforming reactions over more than 10 transition-metal surfaces. By applying linear scaling relationships between the binding energies of selected molecular fragments, which serve as descriptors, and the binding energies of intermediates as well as of transition states that occur in the reforming process, the reaction rate (as characterized by the turnover frequency) can be simply mapped to a two-dimensional descriptor space, which is defined by the binding energy of C and O in that study. As indicated in Fig. 4, theoretical calculations predict that the steam reforming activity decreases in the sequence Ru > Rh > Ni > Ir > Pt ≈ Pd, which is comparable with experimental observations showing Ru ≈ Rh > Ni ≈ Ir ≈ Pt ≈ Pd.7 The small discrepancies might arise due to the different morphology of the nanoparticles under experimental conditions, as well as due the uncertainty of DFT calculations and the errors introduced by the scaling scheme.
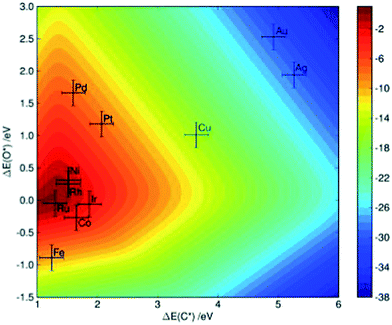 | ||
| Fig. 4 Two-dimensional volcano-curve of the turnover frequency (log10, at 773 K, 1 bar) as a function of C and O binding energy. Reprinted with permission from ref. 7. Copyright 2008 Elsevier. | ||
![[triple bond, length as m-dash]](https://www.rsc.org/images/entities/char_e002.gif) , on many transition-metal surfaces such as Pt(111),68 Rh(111),69 Pd(111),70 Ir(111)71 and Ru(0001).72 Although the transformation from ethylene to ethylidyne seems simple with only one H atom removed from hydrocarbon, the mechanism of this transformation has long been debated. Based on the extensive kinetic and spectroscopic studies, Zaera and French73 suggested a two-step mechanism of ethylidyne formation: a direct 1,2-H shift reaction converts ethylene to ethylidene (CH3CH), followed by a dehydrogenation reaction to form ethylidyne.
, on many transition-metal surfaces such as Pt(111),68 Rh(111),69 Pd(111),70 Ir(111)71 and Ru(0001).72 Although the transformation from ethylene to ethylidyne seems simple with only one H atom removed from hydrocarbon, the mechanism of this transformation has long been debated. Based on the extensive kinetic and spectroscopic studies, Zaera and French73 suggested a two-step mechanism of ethylidyne formation: a direct 1,2-H shift reaction converts ethylene to ethylidene (CH3CH), followed by a dehydrogenation reaction to form ethylidyne.
However, a later theoretical study74 provided strong evidence against the two-step mechanism. The calculated 1,2-H-shift barrier from ethylene to ethylidene was as high as ∼200 kJ mol−1 on Pt(111). Similar high barriers for H shift reactions were also observed on Pt(110),75 Pt(211),58 Pd(111),76 Rh(111)77 and Fe(100).78 Although the substrate metals or surface structures are different from each other, a common observation for this type of H-shift reaction is a C–H–C three membered ring transition-state structure. The C–H–C ring does not directly interact with surface metal atoms, indicating little assistance of the metal catalyst in stabilizing the transition state during this conversion.
Even if the hydrogen shift reactions have been excluded due to their high barrier, there are still at least three competing pathways for this conversion: (1) CH2CH2 → CH2CH → CH3CH → CH3C; (2) CH2CH2 → CH2CH → CH2C → CH3C; (3) CH2CH2 → CH3CH2 → CH3CH → CH3C (Fig. 5a). DFT calculations indicate74 that at low coverage (1/9 ML), the conversion prefers a mechanism via two consecutive dehydrogenation steps to form CH2CH and then CH2C, with a final hydrogenation step to form CH3C (Fig. 5b). When the coverage is increased to 1/3 ML, the dehydrogenation barrier increases in general by ∼20 kJ mol−1.74 The dominated mechanism still starts from dehydrogenation to CH2CH, but shifts to hydrogenation reaction in the second step to form CH3CH and the last dehydrogenation to form CH3C (Fig. 5b).
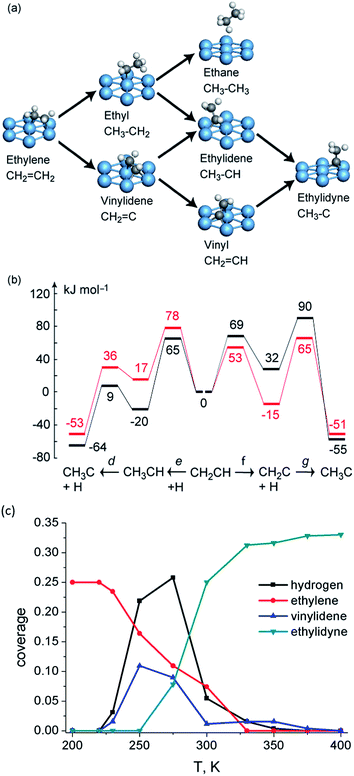 | ||
| Fig. 5 (a) Reaction network of ethylene transformation over Pt(111); (b) reaction energy profiles (kJ mol−1) of vinyl conversion to ethylidyne over Pt(111) at 1/3 coverage (black) and 1/9 coverage (red). Reprinted with permission from ref. 74. Copyright 2010 American Chemical Society; (c) kMC simulated surface coverage after 1 s reaction over Pt(111). Reprinted with permission from ref. 79. Copyright 2012 Elsevier. | ||
Due to the existence of the coverage effect, it is not easy to identify dominating reaction mechanisms under reaction conditions purely based on DFT-calculated barriers. Further clarification of the mechanistic scenario is achieved by kMC simulations, which allow one to track explicitly the behavior of all surface species as a function of time and processing conditions. The kMC study79 predicts the conversion of ethylene starts at temperatures as low as 230 K on Pt(111). The dominated mechanism predicted by kMC follows the route (2) CH2CH2 → CH2CH → CH2C → CH3C. The third hydrogenation step is rate limiting, which results in the accumulation of CH2C on surface. Interestingly, in some cases, even with a lower hydrogenation barrier, these hydrogenation steps can still be slower than dehydrogenation steps with a higher barrier due to the limited amount of adsorbed hydrogen atoms.
Indeed, experimentalists observed an intermediate during ethylene conversion on Pt(111). Spectroscopic studies with sum frequency generation (SFG)80 and reflection adsorption inferred spectroscope (RAIRS)81 methods observed a peak at ∼2960 cm−1 and assign it to asymmetric stretching of the CH3 group in CH3CH. A second peak at 1387 cm−1 was observed which developed in parallel with the 2960 cm−1 feature by the latter study and was assigned to the symmetric bending of ethylidene. Both assignments contradict with the very low DFT barrier for dehydrogenation of ethylidene as well as the kMC simulation results, which indicate accumulation of vinylidene instead of ethylidene during ethylene conversion. Further DFT calculations74 indicated that both vinylidene and ethylidene have modes which locate close to 2960 and 1387 cm−1 due to the structure similarity of these C2 intermediates. Moreover, with deuterium substituted spectra, the C–C stretching mode of vinylidene is separated by at least 200 cm−1 with modes belonging to ethylidene, suggesting a possible way to identify this puzzling intermediate by future experiment.82
The formation mechanism of ethylidyne has also been studied on Pd(111)79,83,84 and Rh(111).77 On both surfaces, kinetic analyses predict that the dominant reaction mechanism is via the vinyl and vinylidene route, which is the same as on Pt(111). In general, the hydrogenation/dehydrogenation barrier heights follow the trend Rh(111) < Pt(111) < Pd(111),85 which can again be qualitatively explained by the filling of the d band, as discussed in methane decomposition (Section 3.1).
The binding of surface intermediates tend to be stronger on (211) surfaces than on the corresponding terrace (111),58,76 due to the low coordinated nature of step edge atoms. Besides the enhanced binding, CH3CH dehydrogenation barriers on (211) surfaces are significantly higher (e.g., >80 kJ mol−1) than the corresponding barriers (<40 kJ mol−1) on (111) surfaces. By checking the transition-state structures, one can notice that this reaction is mainly catalyzed by a terrace metal atom, which is in the second row away from the step edge, although the reactant CH3CH and product CH3C directly binds to step edge. This leads to similar absolute energy of the transition state on both (111) and (211) surfaces. Thus, the barrier is higher on (211) because the initial CH3CH binds much more strongly at the step edge compared to on (111).
C–C bond breaking vs. dehydrogenation. As discussed in the ethylene conversion to ethylidyne section, only hydrogenation/dehydrogenation occur at low temperature range, e.g. below 400 K on Pt(111). Ethylidyne can be further dehydrogenated and coke can be formed at higher temperatures.86 Chen and Vlachos calculated all the possible C–C scission barriers from different C2 species on Pt(111) and Pt(211). On flat (111), most of the C–C bond breaking barriers are higher than 150 kJ mol−1, except for three cases, CC breaking from CH3CH (Ea = 114 kJ mol−1), CHCH (Ea = 103 kJ mol−1) and CHC (Ea = 88 kJ mol−1). Although the C–C breaking from CHC has a low barrier at 88 kJ mol−1, it was still proposed that C–C bond breaking might not occur via this pathway due to strong endothermicity of this step and the high formation barrier of CHC (>200 kJ mol−1). Instead, CHCH or CH3CH are more likely to be the precursor for C–C bond breaking on Pt(111). Since the highest dehydrogenation barrier during ethylene conversion to ethylidyne is below 100 kJ mol−1, the higher C–C bond breaking barriers prevent C2 cracking at low temperatures, which is consistent with the fact that C–C scission reaction can only occur over 540 K.87 Stepped Pt(211) in general shifts down C–C scission barriers from light dehydrogenated intermediates, and shifts up the ones from deep dehydrogenated intermediates. It is more likely that CHCH to be precursor of C–C bond scission, with the barrier at 123 kJ mol−1. Although the lowest C–C breaking barrier is from CH3CH2, it might not be the precursor because of the lack of surface H, particularly after CH3C is formed prior to the C–C bond breaking.
As shown in Fig. 6, the lowest C–C bond breaking barrier on Pd(111) is 122 kJ mol−1 and the corresponding precursor is the C2 dimer.88 However, the formation of the C2 dimer suffers from a high dehydrogenation barrier (154 kJ mol−1) from CHC. Hence, Chen et al. suggested88 that the formation of C1 species is most probably via a CH2C → CHC → CH + C pathway, where the precursor to form CH2C can be CH3C or CH2CH2 depending on the reaction conditions. The calculated CH–C dissociation barrier is 138 kJ mol−1, higher than the dehydrogenation barrier to form CHC, indicating possible accumulation of CHC during this conversion, which is in good agreement with experimental observations.89 A later study extended this network to Pd(211) surfaces, which again suggested the same CH2C → CHC → CH + C pathway for C–C scission. However, on stepped surfaces, rate determining step is CH3–C dehydrogenation to CH2C or C–C scission from CHC, whose barriers are both about 25 kJ mol−1 higher than dehydrogenation barrier from CH2C to CHC.
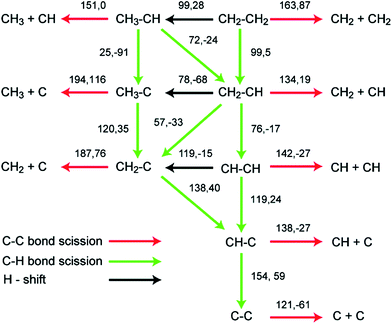 | ||
| Fig. 6 Reaction barriers and reaction energies (black, first and second values, respectively; in kJ mol−1) for various C–H and C–C bond-breaking reactions of ethylene and related species C2Hx (x = 0–4) over a Pd(111) surface. Reprinted with permission from ref. 88. Copyright 2010 American Chemical Society. | ||
A simpler reaction network was employed by Vang et al.90 to check the selectivity of ethylene dehydrogenation and cracking (C–C bond scission) on Ni surfaces (Fig. 7). It includes CH2CH2 dehydrogenations to CH2CH and CHCH, as well as C–C bond breaking from CH2CH2 and CHCH. On Ni(111), the initial dehydrogenation from ethylene is much more favorable than its cracking to form two CH2 groups, with about 50 kJ mol−1 lower dehydrogenation barrier. On stepped Ni(211), the ethylene cracking barrier dramatically decreases to about 100 kJ mol−1, which is comparable to its dehydrogenation barrier. The reduced barrier height of ethylene cracking, when comparing step sites with terrace sites, was explained by the geometry effect.90 The two CH2 groups, which are the final state of this cracking, locate on two threefold hollow sites on Ni(111). On Ni(211), one methylene adsorbs on a twofold sites, resulting in a much shorter distance between two CH2 groups than the pairs on Ni(111). It means that the transition state is stabilized at an earlier point in the former case, and thus the barrier of this reaction is lower on Ni(211). Nevertheless, step-edge sites are far more reactive towards ethylene decomposition than the regular sites on Ni(111), and thus play a very important role in the bond breaking selectivity between the initial C–H and C–C bond breaking.90
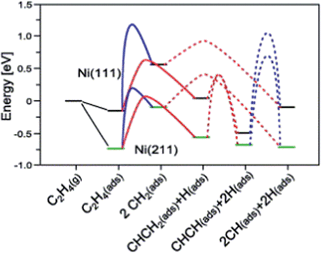 | ||
| Fig. 7 Potential energy diagram for C–C bond breaking (blue line) and C–H bond breaking (red line) on Ni(111) and Ni(211). The transition state energy for C–H bond breaking of CH2 is for one CH2. Reprinted with permission from ref. 90. Copyright 2006 Elsevier. | ||
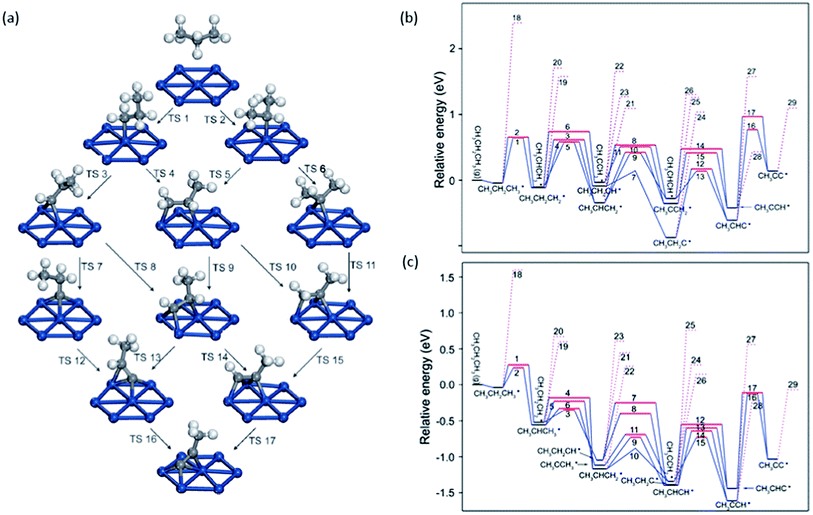 | ||
| Fig. 8 (a) Reaction network of propane dehydrogenation on Pt(111); (b and c) energy profile for propane dehydrogenation on Pt(111) (b) and Pt(211) (c) including both the dehydrogenation steps (solid lines) and the C–C cracking steps (dotted lines). Adapted with permission from ref. 92 with permission from the PCCP Owner Societies. | ||
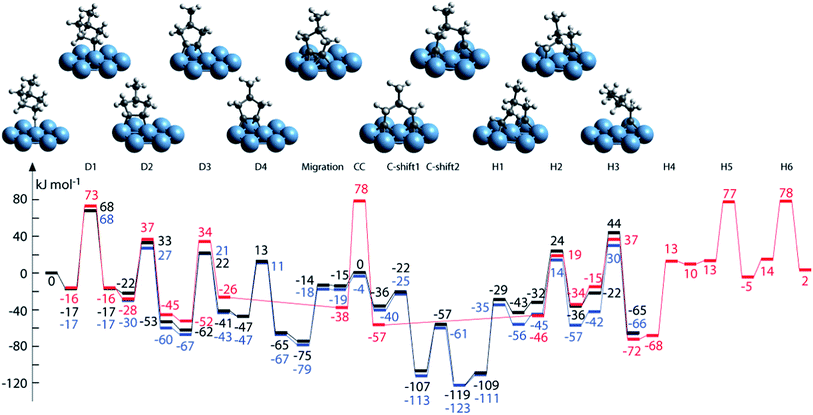 | ||
| Fig. 9 Structures and energy profiles of the MCP ring-opening reactions over Pt(111): reaction path to 2-methylpentane (2-MP) (black), 3-methylpentane (3-MP) (blue) and nHx (red). Adapted with permission from ref. 95. Copyright 2012 Elsevier. | ||
Similar analysis has further been done on Rh, Ir and Pd surfaces, with the assumption that deep dehydrogenation precedes ring cleavage.97 Based on the calculated barriers, the ring-opening activity follows the trend of Rh ≈ Ir > Pt > Pd, which agrees with experimental observations. The particle size effect on selectivity of MCP ring-opening products can also be rationalized by the calculated C–C bond breaking barriers. For example, the C–C breaking barrier leading to branched product is always lower on both Rh(111) and Rh(211) than barrier in the pathway to linear nHx, which consists with experimentally observed favored production of branched methylpentanes.
3.2 Alloy surfaces
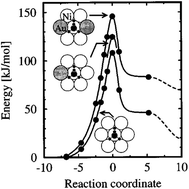 | ||
| Fig. 10 The calculated energy along the reaction path for CH4 dissociating over a Ni atom in the Au/Ni(111) surface. The rightmost data points (dashed curves) refer to infinite separation of the dissociated H and CH3 group on the surface. The dissociation geometry for the three chemical compositions is indicated by the insets, with gold atoms gray-shaded. Reprinted with permission from ref. 37. Copyright 1996 American Institute of Physics Publishing LLC. | ||
In the case of a more reactive Rh atom embedded to a less reactive Cu(111) surface, the situation is slightly different. The C–Rh bond is roughly ∼50 kJ mol−1 stronger than C–Cu bond.53 In the first dehydrogenation step, the reaction can be catalyzed by the single Rh atom on the embedded Rh/Cu(111) surface. Thus, the calculated barrier of D1 on Rh/Cu(111), 68 kJ mol−1, is almost the same as the barrier on perfect Rh(111), 67 kJ mol−1. However, the subsequent dehydrogenation step generates methylene which binds to bridge sites, forming one C–Rh and one C–Cu bond. As expected, the D2 barrier on Rh/Cu(111), 81 kJ mol−1, is 40 kJ mol−1 higher than the barrier on Rh(111), because of the weaker binding of the product methylene on the anterior surface.
Besides the embedded model mentioned above, Kokalj et al.53 further considered a case with a Rh as an ad-atom on hollow sites of Rh(111) as well as on Cu(111). The coordination number of the ad-atom is only 3, which is significantly smaller than CN of the surface atoms on (111) (CN = 9), (211) step edge (CN = 7) and ad-row atoms (CN = 5). It is expected that the strongest binding of a surface intermediate should be observed on an ad-atom due to its smallest coordination number. However, the calculated binding energy indicates that the strongest binding occur on ad-row atoms. The discrepancy was explained53 by the formation of an agostic bond, which is a three-center C–H–metal interaction normally with two electrons. Due to the three agostic bonds, fcc adsorbed eclipsed CH3 on Rh(111) is 40 kJ mol−1 more stable than the staggered confirmation. Agostic bonds have been observed between CH3 and Rh(111), Rh(211) and ad-row surfaces, except for the case of ad-atoms (Fig. 11). In the latter case, the CH3 binds to the ad-atom with C–Rh bond tilted to surface normal. The closest H–Rh interaction is 250 pm, indicating much weaker agostic bond interaction. Although the binding of CH3 is not the strongest, the ad-atom still can well stabilize the transition state. The D1 dissociation barriers catalyzed by ad-atoms are at least 20 kJ mol−1 lower than the corresponding barriers on Rh(111) and Cu(111) surfaces. However, the D2 barriers become comparable or even higher on ad-atoms compared with the corresponding barriers on (111) surfaces. In the final state of D2, the CH2 group attaches to bridge sites between the ad-atom (CN = 3) and a surface atom underneath (CN = 10), with an average CN = 6.5. Accordingly, the calculated binding energy of CH2 on the ad-atom/surface bridge site is similar to the value on step edges (CN = 7). Moreover, the dissociated H atom is about 20 kJ mol−1 less stable on top of ad-atoms than adsorption on other cases. The combination of both effects shifts up the D2 barrier on ad-atom.
 | ||
| Fig. 11 Integrated local density of states (ILDOS) illustrating the extent of three-center C–H–metal agostic bonding of methyl adsorbed on (a) a Rh(111) facet, (b) a step edge, and (c) an ad-atom. The magnitude of ILDOS increases from red to violet, following a rainbow scale. Five contours are drawn in logarithmic scale from 10−1 to 10−3e/a03. Reprinted with permission from ref. 53. Copyright 2006 American Chemical Society. | ||
A third type of studies covers the case with AB type alloy, in most cases with A![[thin space (1/6-em)]](https://www.rsc.org/images/entities/char_2009.gif) :
:![[thin space (1/6-em)]](https://www.rsc.org/images/entities/char_2009.gif) B = 1
B = 1![[thin space (1/6-em)]](https://www.rsc.org/images/entities/char_2009.gif) :
:![[thin space (1/6-em)]](https://www.rsc.org/images/entities/char_2009.gif) 1. Qi et al.56 selected two metals, Pt and Ir, which are both active for CH4 dissociation. Instead of expected in between catalytic activity of alloy, the initial dehydrogenation activity is enhanced on PtIr(111), with a lower D1 barrier, 53 kJ mol−1, than barriers on Pt(111) (Ea = 82 kJ mol−1) and Ir(111) (Ea = 90 kJ mol−1). Similar lowest barrier on alloy surfaces is also observed for the D2 step. However for D3 and D4, the calculated barriers on PtIr(111) are quite similar to values on Ir(111), and lower than the ones on Pt(111). The enhanced activity on alloys does not seem to be unique for PtIr(111). Similar lower barriers on alloy surfaces were also observed on PdNi(111)99 and NiCu(111),100 while in the case of NiCo(111),101 the barriers are similar to those on Ni(111).
1. Qi et al.56 selected two metals, Pt and Ir, which are both active for CH4 dissociation. Instead of expected in between catalytic activity of alloy, the initial dehydrogenation activity is enhanced on PtIr(111), with a lower D1 barrier, 53 kJ mol−1, than barriers on Pt(111) (Ea = 82 kJ mol−1) and Ir(111) (Ea = 90 kJ mol−1). Similar lowest barrier on alloy surfaces is also observed for the D2 step. However for D3 and D4, the calculated barriers on PtIr(111) are quite similar to values on Ir(111), and lower than the ones on Pt(111). The enhanced activity on alloys does not seem to be unique for PtIr(111). Similar lower barriers on alloy surfaces were also observed on PdNi(111)99 and NiCu(111),100 while in the case of NiCo(111),101 the barriers are similar to those on Ni(111).
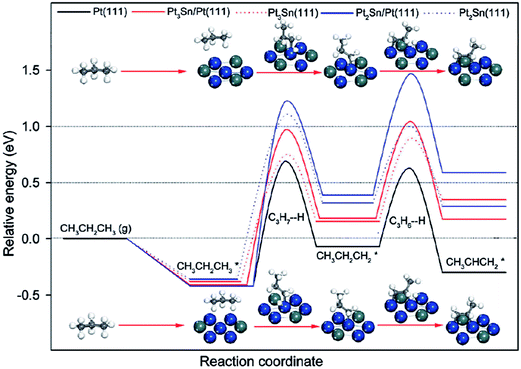 | ||
| Fig. 12 Energy profiles for propane dehydrogenation to propylene on Pt and PtSn surfaces. Reprinted with permission from ref. 104. Copyright 2012 American Chemical Society. | ||
3.3 Metal clusters/particles
In addition to the slab models, another widely used approach is the cluster model, in which the catalyst is described by a finite metal particle. The advantage of the cluster model is that various types of site, e.g. corner, edge as well as terrace, can be described simultaneously in one model. In addition, it is easy to set up a supported particle calculation. The size of metal particle is normally limited to hundreds of atoms, whose diameter is in range of several nanometers.In case of finite particles, the binding strength is also correlated to the size of the cluster besides the influence caused by the difference on coordination number. For example, a linear relationship between the size of Pd particles and the corresponding adsorption energy of CO has been established by Yudanov et al.107 The particle size affected binding energy is linked to the strain effects.30 Shorter Pd–Pd distance was observed in smaller Pd particle/clusters, which results in stronger binding of intermediates and transition states on small metal particles than on large ones and on edge sites of (211) surfaces. Viñes et al.59 has shown that the complete dehydrogenation of CH4 to form C atom and 4H atoms is more exothermic by 128 kJ mol−1 on Pt79 than on Pt(111) (Fig. 13). Stronger binding of dehydrogenated intermediate on Pt79 significantly decreases the first dehydrogenation barrier of CH4, only 32 kJ mol−1 on Pt79, while this barrier is 90 kJ mol−1 on Pt(111). Correspondingly, CH3 was observed on small Pt particles in a direct dissociation process to undergo spontaneous, thermally induced dehydrogenation, even at surface temperatures as low as 100 K.59
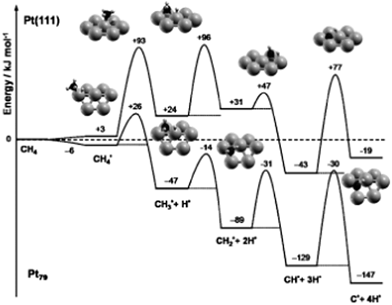 | ||
| Fig. 13 ZPE-corrected reaction energy profile for the complete dehydrogenation of methane on a Pt(111) surface and on a Pt79 nanoparticle. All energies, in kJ mol−1, refer to methane in the gas phase and the clean substrate. Reprinted with permission from ref. 59. Copyright 2010 Wiley-VCH Verlag GmbH. | ||
Enhanced dehydrogenation by small nanoparticles is not unique for methane. Vajda et al.108 reported that size-preselected Pt8–10 clusters are 40–100 times more active for oxidative dehydrogenation of propane than previous studied platinum and vanadia catalysts. Calculations with a tetrahedral Pt4 cluster indicate the barrier for the first dehydrogenation of propane decreased to 41 kJ mol−1. Furthermore, further C–C bond breaking as well as dehydrogenation of the CH3 group from propylene have much higher barriers (e.g., over 100 kJ mol−1) than the first two dehydrogenation steps to form propylene, which is consistent with the experimentally observed high selectivity of propylene.108 The high barrier for the C–C bond breaking can be explained by the sp3 directionality of the orbitals on C compared with the spherical nature of the s orbital on hydrogen, which results in poorer overlap between adsorbate and the reaction site orbitals in the transition state for breaking of the C–C bond.108
4 Other catalysts
4.1 Oxides
Supported vanadium oxides are one of the best catalysts for oxidative dehydrogenation (ODH) of propane.109 It is generally accepted that this catalytic process proceeds via a two-step mechanism:110 (1) reduction of the oxide surface by dehydrogenation of hydrocarbon and (2) re-oxidation of the surface by gas-phase O2. At high vanadium loadings, vanadium oxide exists in form of V2O5, whose most stable surface is the oxygen terminated basal V2O5(001). There are three different types of surface O atoms. Depending on the type of the O center, the corresponding coordination number can be 1, 2 or 3. Previous experimental studies have suggested both the single coordinated111 and the di-coordinated112 surface O atoms to be the active site of ODH of propane. These suggestions are in line with DFT calculations by Fu et al.,110 which clearly showed that for propane activation on V2O5(001), the activation of a C–H bond by tri-coordinated O atoms is least likely, as yielded propyl upon dehydrogenation of propane is least stable at the tri-coordinated O sites on V2O5(001). On the other two O active sites, similar dehydrogenation barriers for the initial step were obtained, with slight preference for the single coordinated O (Fig. 14). However, the di-coordinated O has a higher activity for further decomposition of surface propoxide, i.e. the propyl bound to O site, into propylene. Nevertheless, one should be aware that a good catalyst for propane ODH should not only feature high activity for the dehydrogenation step but also yield a high selectivity towards desired product, i.e. propylene, over deep dehydrogenated ones. Unfortunately, these two properties of a catalyst are somewhat oppositional: a too high catalytic activity often comes with a decreased selectivity towards partially dehydrogenated propylene.110 Dai et al.113 focused on ODH of ethane on vanadium oxide, whose rate was much lower than ODH of propane.114 DFT studies identified the ODH mechanisms from both ethane and propane are similar to each other: the first C–H dissociation step being rate-limiting in both cases. However, in the case of ethane, the undesired acetaldehyde can be formed on the single coordinated O site with a barrier that is slightly lower than the barrier associated with ethylene formation. This undesired acetaldehyde is a stable species on the surface. However, it was suggested, although without having explicitly calculated the corresponding elementary steps, that acetaldehyde can be further oxidized to CO or CO2 under the typical ODH reaction conditions. The presence of this easily accessible side reaction significantly lower the efficiency of ethane ODH, which was suggested to be the reason for the low ODH activity of ethane on V2O5.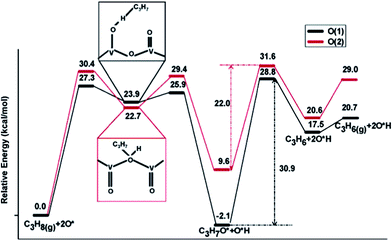 | ||
| Fig. 14 Lowest-energy pathways of propane ODH process on V2O5(001) occurring on O(1) (single coordinated O) and O(2) (di-coordinated O), respectively. Reprinted with permission from ref. 110. Copyright 2006 American Chemical Society. | ||
Ga2O3 is another highly active and selective catalyst for the production of alkenes via alkane dehydrogenation reactions. However, such catalysts deactivate quickly, which was suggested to be a consequence of poisoning by carbon deposition formed in light alkane dehydrogenation reactions.115 Liu et al.116 employed a slab model for β-Ga2O3 and considered two competitive mechanisms for dehydrogenation of propane, a direct dehydrogenation and oxidative dehydrogenation. The study reveals that the direct dehydrogenation mechanism is preferred over the oxidative dehydrogenation. However, the latter mechanism could not be completely ruled out for reactions in the presence of mild oxidants such as CO2. The most active site for the first dehydrogenation step is a bridge-bound surface O atom. Once the H is abstracted from hydrocarbon, rather stable surface hydroxyl groups are formed (Fig. 15). The direct removal of the H, either as H2 or H2O, to regenerate the O site of the catalyst is difficult and will eventually decrease the activity of the catalyst. Upon blocking of the O site by the H atom, Ga centers can also catalyze the further dehydrogenation of the intermediate propyl. This leads to the formation of a hydrogenated Ga center “GaH” and facilitates the removal of surface H at the neighboring O sites in the form of H2 or H2O.
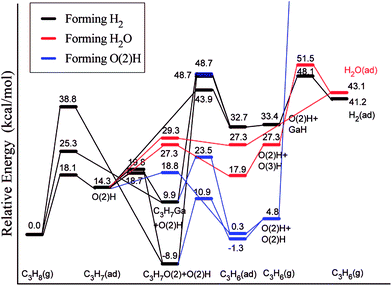 | ||
| Fig. 15 Lowest-energy pathways of propane ODH process on β-Ga2O3(100). Reprinted with permission from ref. 116. Copyright 2008 American Chemical Society. | ||
We should note here that there is another important type of dehydrogenation catalyst which is based on chromium oxide. As early as the 1940s, UOP had already achieved the dehydrogenation of butane to produce butylene with chromia supported on alumina at industrial scale.1 Numerous experimental attempts have been performed in order to identify the active site and reaction mechanism for light alkane dehydrogenation reactions on chromium oxide, which was recently reviewed in ref. 1, and will not be repeated here. However, due to the complexity of the chromium oxide, including the different oxidation states, the crystal structure and the surface facets, theoretical studies addressing chromium oxide catalyzed dehydrogenation processes are challenging and thus rare.
4.2 Zeolites
Zeolites have been widely used as catalysts and/or supports for hydrocarbon cracking, alkylation, aromatization and isomerization reactions.117 Due to the nature of their 3-D structure, theoretical studies of this system either employ a finite cluster model describing the immediate surroundings of the active site,118 or use a 3-D periodic model to describe the complete structure of the zeolite system.119 At least two different mechanisms have been proposed by previous theoretical studies on zeolite catalyzed alkane dehydrogenation reactions: one proceeding via an alkyl intermediate and an alternative mechanism via a carbenium ion.118The dehydrogenation of alkanes in zeolites can be promoted by extra-framework metal atoms, such as Zn, In, Ga and Cu, which create new Lewis-acid sites in zeolites.117 However, the nature and role of the extra-framework metals are still under debate. Previous studies have suggested that metal oxide or metal hydride clusters are the active sites for dehydrogenation reactions. A series of studies on the dehydrogenation of light alkanes catalyzed by Ga exchanged ZSM-5 have been made by Pidko et al.118,120 using a cluster approach. These studies considered four different possible species, Ga+, GaH2+, GaH2+ and GaO+, to be the active centers. Among the first three active sites, Ga+ is the most stable form of extra-framework Ga in ZSM-5. However, because the filled d and s orbitals of Ga+ are energetically low lying under the Fermi level, the Ga+ center is unable to donate or accept electrons, resulting in a high barrier (Ea = 374 kJ mol−1) for direct oxidative addition of ethane (Fig. 16).118 A two-step heterolytic splitting of the C–H bond is much more favorable with the highest barrier of 233 kJ mol−1 (Fig. 16), due to the polarization induced by the interaction of the hydrocarbon with the Ga⋯O Lewis acid–base pair. Hydrogenated gallium species are less active than Ga+ as reflected by the higher activation energies for ethane dehydrogenation. At variance, the oxidized gallium GaO+ shows the lowest initial dehydrogenation barrier of ethane (Ea ≈ 100 kJ mol−1) and yields very stable intermediates, [C2H5–Ga–OH]+ or [C2H5O–Ga–H]+. However, the desorption of C2H4 from both intermediates leads to formation of [H–Ga–OH]+, from which the regeneration of active site via H2 desorption is strongly disfavored both thermodynamically and kinetically.
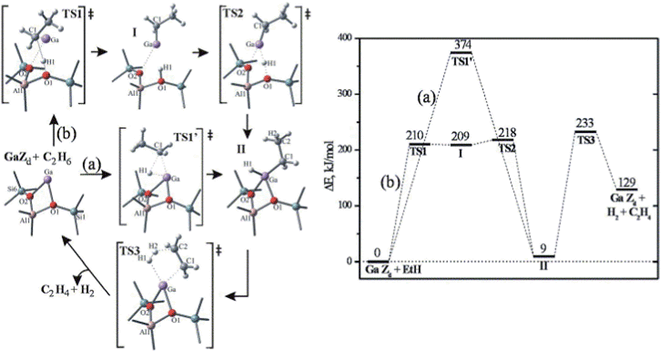 | ||
| Fig. 16 Homolytic (a) and heterolytic (b) “alkyl” pathways of ethane dehydrogenation over Ga in ZSM5. Reprinted with permission from ref. 118. Copyright 2006 Elsevier. | ||
For the Zn/ZSM-5 system, Pidko et al.121 further considered a model with Zn at a distant location from the [AlO2]− framework units. The initial dehydrogenation barrier of ethane on such a Zn site is lower than the barrier at Zn of a conventional ion-exchange site. This is related to the stronger Lewis acidity in the former case caused by the indirect charge-compensation.121 Once the [Zn–C2H5]+ is formed upon the dehydrogenation of ethane, the barrier of the following one-step elimination of H2 and C2H4 strongly depends on the relative position of [Zn–C2H5]+ and H+ species. Thus, the presence of acidic protons in the catalyst can promote the regeneration of active sites.121 Lower barriers for the initial dehydrogenation steps have been determined for the reaction at binuclear ZnOZn sites, which can be rationalized by the high Lewis basicity of the extra-lattice oxygen and strong steric stain of the active site. Both effects also lead to strong stabilization of the [Zn–C2H5⋯HO–Zn]2+ intermediate, resulting in a high activation barrier of 190 kJ mol−1 for the elimination of ethylene.
The stability of metal oxides or hydride clusters is also influenced by the structure of the zeolite framework. Joshi and Thomson122,123 showed that [GaH]2+ is more stable in a six-membered ring structure than in an eight-membered ring.122 In the case of a more stable site, the interaction between reaction intermediates and active site is expected to be weaker. The poorly stabilized transition states result in a relatively high barrier for C–H activation as well as decreasing the catalytic activity of the system. On the other hand, the weak binding of the intermediate on such sites favors the desorption of H2. Considering these two opposite effects, calculations suggested that the optimal Al–Al distance to be 453 pm corresponding to a minimum overall barrier, and a simple ‘structure-to-activity’ correlation based on the Sabatier principle (Fig. 17) was proposed.122 Further thermochemical analysis indicates that pair-Al sites with larger Al–Al distances become more prevalent, which can be used as a guideline of optimal Si/Al ratio for a given Ga loading.123
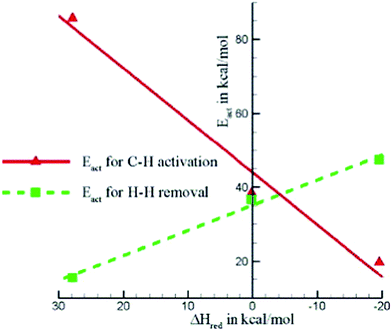 | ||
| Fig. 17 Important activation energies plotted against the heat of reaction for dissociative adsorption of H2 (i.e. reduction of the Z2−[GaH]2+species). Reprinted with permission from ref. 122. Copyright 2005 Elsevier. | ||
Besides the position of Al atoms, the topology of zeolite framework also affects the dehydrogenation activity. Wannakao et al.124 calculated the methane activation in Au-substituted FAU, FER, ZSM-5 and MCM-22. In FAU, Au binds to three O atoms, while it is bi-coordinated in the other three zeolites. The higher coordination number results in weaker binding of intermediates and transition states, leading to lower activity in FAU than in ZSM-5. Apart from the effect of the coordination of the extra-framework Au center, the pore size is also considered to have a slight effect on the catalytic activity, i.e., lower activation barriers for reactions in zeolites with larger pore size.124
4.3 Single atom catalysts
Earlier calculations suggested initial dehydrogenation of alkanes in general requires a smaller ensemble of active metal centers, i.e. on top of a single atom, than deep dehydrogenations as well as C–C bond breaking, which normally require bridge or 3-fold hollow sites.92 Thus, the diluted concentration of surface active metal atoms suppresses deep dehydrogenation as well as coke formation, and in turn increases selectivity towards the desired alkenes. In the extreme case, dehydrogenation reactions may be catalyzed by an active site that composes of only one active metal atom on a support, which maximize the efficiency of metal utilization.125Guo et al.126 reported a direct, nonoxidative process for the conversion of methane to ethylene, aromatics and hydrogen that is catalyzed by a single Fe atom embedded in a silica matrix (Fig. 18a). Compared to other forms of the Fe catalyst, e.g. Fe supported on oxides or substituted in zeolites, the coke formation is negligible here. Based on DFT-calculated energetics, the active sites was suggested to be one Fe atom coordinated by one Si from silica supports and two C atoms originally derived from complete dehydrogenation of methane.126 It further indicates that the Fe center can active CH4 to form CH3, which desorbs as a radical into the gas phase at temperatures as high as 1200 K. A series of gas-phase radical reactions generate the final products, including ethylene and aromatics. Two CH3 radicals further combine to form ethane in a strong exothermic process, and ethane undergoes dehydrogenation to form ethylene with a barrier of 152 kJ mol−1. The aromatics can be formed by transformation via cyclization of C2H3 radicals generated from ethylene with high barriers, e.g. benzene (Ea = 275 kJ mol−1) and naphthalene (Ea = 314 kJ mol−1). Despite the aromatics being thermodynamically more stable than ethylene (Fig. 18b), the process can still be tuned to feature ethylene as major product by increasing the flow rate of the feedstock which reduces the secondary conversion from ethylene to aromatics.
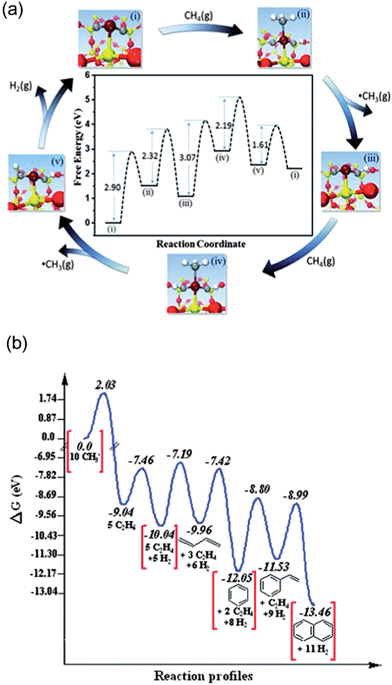 | ||
| Fig. 18 (a) DFT calculations on catalytic generation of methyl radicals at 1223 K. (b) DFT simulated reaction profile of methyl radicals in the gas phase at 1225 K; ΔG, Gibbs free energy. Reprinted with permission from ref. 126. Copyright 2014 American Association for the Advancement of Science. | ||
Another example for a single atom catalyst is the Zn2+/SiO2 system used for selective dehydrogenation of propane to propene.127 In this catalyst, the Zn2+ center is coordinated with three O centers of the SiO2 surface. DFT-calculated barriers show the rate-limiting step is the second dehydrogenation with simultaneously desorption of propylene, with a barrier of 192 kJ mol−1 (Fig. 19). The C–C bond breaking step is at least 42 kJ mol−1 higher than dehydrogenation reactions, consistent with the high selectivity to propylene.
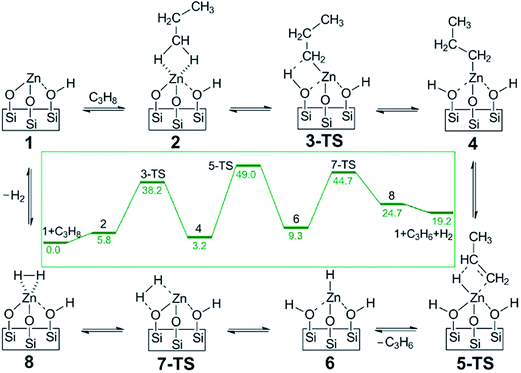 | ||
| Fig. 19 DFT calculated proposed catalytic reaction pathway for olefin hydrogenation and alkane dehydrogenation on single-site, Zn Lewis acid catalyst. The reaction free energies (kcal mol−1) are shown in the inset. Reprinted with permission from ref. 127. Copyright 2014 American Chemical Society. | ||
5 The origin of coke formation
The following section deals with the side reaction of the dehydrogenation process leading to the formation of coke. Coke may, for instance, form if carbon centers are completely dehydrogenated but not removed from the catalyst surface. The unwanted formation of carbonaceous depositions not only decreases the selectivity towards the desired products, but also leads to the modification of a catalyst and the reduction of the catalytic activity up to complete deactivation. When discussing “coking”, one should be aware that the carbonaceous species can be present in different forms, which are of varying stability, e.g. as on-surface C atoms, as sub-surface C atoms, forming a carbidic phase, but also as graphene islands covering the catalyst surface (Fig. 20).128 Although this review intends to address the dehydrogenation of light hydrocarbons, this section will be kept more general and discuss the coking process in catalytic reactions that involve general organic species (e.g. steam reforming, Fischer–Tropsch synthesis, etc.). We will see in this section that the crucial processes for coking (or for the prevention thereof), are the reactions of the isolated C centers, which may arise from the dehydrogenation (and C–C scission) of hydrocarbons but also from CO activation as occurring in Fischer–Tropsch synthesis. As the origin of the C centers is not of primary importance for the discussion of the coking process, it seems reasonable to extend our focus on the coking process in systems that are beyond the typical catalysts used for alkane activation. In the following section we will begin the discussion exemplarily on the relatively well studied formation of coke on Ni surface, which is the most widely used reforming catalysts, and show the strategies proposed to enhance the robustness of Ni against coking.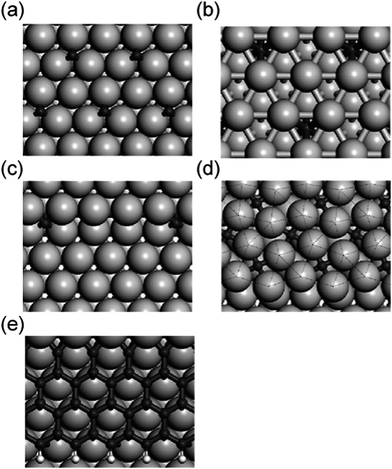 | ||
| Fig. 20 Different types of adsorbed C atoms on Co surfaces: (a) on-surface; (b) sub-surface; (c) step; (d) P4g clock; (e) graphene. Adapted with permission from ref. 140. Copyright 2010 American Chemical Society. | ||
5.1 Coking on Ni
Although there are other metallic reforming catalysts such as Ru and Rh, which are less strongly prone to coking than Ni,129 Ni is one of the most common reforming catalysts, which is partly due to its significantly cheaper price. In order to overcome the coking problem of Ni catalysts, numerous theoretical studies have been conducted to understand the coke formation on nickel and to come up with potential strategies to avoid the unwanted coking process.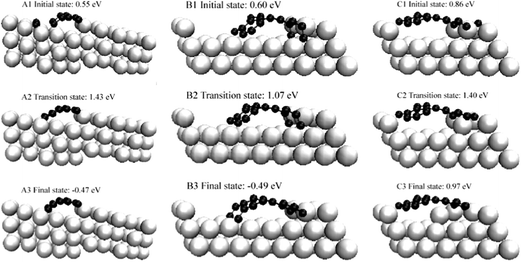 | ||
| Fig. 21 Initial transition and final states of three pathways on growth of graphic structure. Reprinted with permission from ref. 130. Copyright 2006 American Physical Society. | ||
It has been demonstrated for graphene islands on the Ni(111) surface, unsaturated C atoms at the edge of a graphene island are less stable than isolated C atoms on the metal surface.66,128 At variance the atoms “inside” the graphene islands coordinated by three other C atoms are more stable than the isolated C.66,128 Consequently, graphene islands are only stable, if they reach a critical size. Depending on the model and the assumptions, this critical size has been estimated to be between 10 to 80 C atoms.66,128 Thus, it has been concluded that the formation of graphene islands is a process with a high reaction-order whose formation is most favourable at high C coverage rates.128
A second form of coke on Ni is the carbidic layer. In such structures, C atoms occupy sub-surface sides. In contrast to the formation of graphene-islands, the diffusion of C atoms to sub-surface sides forming a carbidic layer is discussed to be a first-order process with an associated barrier estimated to be around 70 kJ mol−1.128 In other words a carbidic layer can also be formed at low C coverage on the surface. Also this type of coke has shown to reduce the catalytic activity of Ni for methane reforming: the barrier of methane activation on a Ni(111) surface with sub-surface C is reported to be 143 kJ mol−1, significantly higher than the value of 91 kJ mol−1 calculated for the analogue process on a pure close-packed Ni surface.131 A similar trend is also found, when comparing the methane activation on pure Ni surfaces with the reaction on surfaces of the Ni3C system.132
Different approaches have been proposed to encounter the coking problem. It could be shown that the adsorption of C atoms on the closed packed surface of a NiAu surface alloy is thermodynamically less favoured, by 23 kJ mol−1 or more, than the analogous process on a pure Ni(111) surface.134 Based on this finding, it has been proposed to alloy Ni with Au.134 A cheaper alternative is to alloy Ni with Sn which hinders the C–C bond formation and enhances the C–O bond formation leading to the removal of surface C centers as carbon monoxide.135,136 It has been discussed that the Sn atoms separate the Ni centers on the catalyst surface, which tend to bind C atoms, from each other. With the Ni centers being separated, the C atoms on the surface are separated as well, which hinders the formation of coke.135,136 These theoretical results are consistent with experiments which show that pure Ni catalysts deactivate significantly faster than NiSn alloy based catalysts.135
Since the step sites play an essential role in the growth of the graphene islands, as mentioned above, additives such as potassium,66 sulfur,66 gold66 or boron131 have been proposed.66 Computational calculations have shown that these elements tend to occupy the step sites and thus avoid the formation of graphene islands.66,131
A similar strategy, by blocking the crucial sites, has been proposed to prevent the formation of a carbidic phase. Calculations have shown that boron prefers the same sub-surface sites on Ni as C.137 By occupying these sites with B, the diffusion of C to these sub-surface sites and the formation of the thermodynamically more stable carbide phase can be prevented.128 Apart from blocking the sub-surface sites, sub-surface boron in Ni(111) also has been shown to have an destabilizing effect on on-surface C centers,138 which may help to prevent the accumulation of C atoms on the surface.
5.2 Coking on other metals
Similar to Ni, experimental and DFT studies on Co have shown that coke can be present as graphene islands as well as in the form of a surface carbide.139 The comparison of adsorption properties of boron and carbon on Co surfaces reveals that both elements behave similarly, i.e. both elements occupy the same adsorption sites. This indicates that the presence of B may prevent the deposition of carbonaceous species on Co,140 comparable to the case for Ni described above. This hypothesis, based on theoretical consideration, could be confirmed by experiments, which demonstrated that the promotion of a Co Fischer–Tropsch catalyst with boron can significantly reduce the deactivation rate, while leaving the selectivity and activity unaffected.140It is interesting to note here that also the presence of on-surface carbonaceous species of the formula CHx (x = 0–3) have been discussed to influence the activity of a catalyst. An example is the decomposition of methanol studied on Pd cluster models.141 It could be shown that CH3 and CH2 species formed from the C–O cleavage of methanol tend to move to the thermodynamically more stable near-edge sites of the cluster where they further dehydrogenate to CH or C.141 The calculated results are in line with experimental studies which indicate that the decomposition of methanol leads to the formation of carbonaceous species at the near-edge sites of the Pd catalyst.142 The experiments further demonstrates that the occupation of the near edge sites leads to a strong decrease of the C–O cleavage rate, while the complete dehydrogenation of methanol yielding CO is essentially unaffected.142 This finding shows that the formation of carbonaceous species is not generally negative. In the above example, the on-surface C centers selectively block the C–O cleavage reaction which is for instance unwanted in methanol reforming.
A study addressing reactions over Pt clusters supported on γ-alumina has compared the Gibbs free energies of reaction for alkane dehydrogenation and for the undesired coke formation and hydrogenolysis processes.143 By considering the ΔG values, the impact of the alkane pressure as well as of the H2 pressure could be investigated. It has been demonstrated, in accordance with experimental observations, that the performance of the dehydrogenation process is the best, if the ratio between the H2 pressure and the alkane pressure is between 1 and 10.143 At lower H2![[thin space (1/6-em)]](https://www.rsc.org/images/entities/char_2009.gif) :
:![[thin space (1/6-em)]](https://www.rsc.org/images/entities/char_2009.gif) alkane ratios, the formation of coke precursors via highly dehydrogenated carbon species is promoted, whereas at larger H2
alkane ratios, the formation of coke precursors via highly dehydrogenated carbon species is promoted, whereas at larger H2![[thin space (1/6-em)]](https://www.rsc.org/images/entities/char_2009.gif) :
:![[thin space (1/6-em)]](https://www.rsc.org/images/entities/char_2009.gif) alkane ratios, the dehydrogenation of the alkane is hindered. Despite the fact that this result appears rather intuitive, it should be noted that the underlying molecular processes are far more complex. An example is the destabilization of C1 C–C scission products: the formation of the C–C scission products induces a change in the geometry of the Pt cluster. The so-formed cluster morphology binds relatively little hydrogen atoms, which leads, under high H2 pressure, to a high and thermodynamically unfavoured value for the Gibbs free energy.143
alkane ratios, the dehydrogenation of the alkane is hindered. Despite the fact that this result appears rather intuitive, it should be noted that the underlying molecular processes are far more complex. An example is the destabilization of C1 C–C scission products: the formation of the C–C scission products induces a change in the geometry of the Pt cluster. The so-formed cluster morphology binds relatively little hydrogen atoms, which leads, under high H2 pressure, to a high and thermodynamically unfavoured value for the Gibbs free energy.143
Although we have mentioned in the beginning of this section, that Ru and Rh catalysts are more robust against coking than Ni, carbon deposits can also form on surfaces of such metals. It has for instance been reported, that Rh(111) surfaces can be used for the growth of graphene.86 Calculations on Ru have shown that C atoms on a Ru surface tend to occupy the step sites, which are about 100 kJ mol−1 more favoured than the terrace sites.144 Experiments have shown that this deactivates the highly structure sensitive CO scission,144 a process that plays a central role in the methanation process or the Fischer–Tropsch process.
6 Concluding remarks and perspectives
With state-of-art DFT calculations, more and more insights into the mechanistic aspect for heterogeneous catalytic C–H activation reactions have been gained in the last two decades. The most widely calculated model system, methane dehydrogenation on metal surfaces, has covered many important transition-metal catalyst as well as alloy systems. Although most of the calculations have been conducted on relatively simple slab models, these results still serve as important clues which successfully explain many experimental phenomena. Similar to many heterogeneous catalyst reactions, the dehydrogenation activity is observed to follow the d-band rule: a surface with higher d-band center tends to bind intermediates and transition states more strongly, in general resulting in a low dehydrogenation barrier. Although low dehydrogenation barrier indicates high dehydrogenation activity for a catalyst, too high dehydrogenation activity might result in uncontrolled deep dehydrogenation of hydrocarbons, which in the worst case results in undesired coke formation.The ultimate goal for theoretical studies is to identify optimal catalysts for particular chemical processes. Recently developed BEP or other linear scaling relationships connect transition states, which are computationally expensive to be located, with simply calculated parameters or so called descriptors, such as reaction energies or binding energies. These linear relationships reduce the complexity of a catalytic system from a high dimensional system with rate constants of N elementary steps to a few, in many cases even with only one or two, dimensions of descriptors, which offers a powerful strategy to achieve fast screening of large numbers of new catalysts.
The continuing improvements of computer hardware, the development of new functionals, as well as the increasing sophistication of computational electronic structure software have insured the ability of a computational study to access more complicated catalytic systems beyond simple transition-metal surfaces. Although the general trend of catalytic activity is not as easy to be addressed for these as for metal systems, the case studies still shed light on dehydrogenation mechanisms in these systems, and more insights emerge which are normally difficult to be explored at molecular level even by the most advanced experimental equipment.
However, there are still limitations for current theoretical calculations to model more realistic catalytic systems. For example, there is still no perfect solutions to calculate entropies of soft modes, including frustrated translation and rotation, for an adsorbate, which prevents an accurate estimation of surface thermodynamics. The above mentioned linear scaling relationships introduce additional errors besides the errors by DFT calculations. In addition, most of the linear scaling relationships have been developed at a given coverage of a single adsorbate. However, under reaction conditions, the catalyst surface is a complicated system with different types of co-adsorbates. Although advanced kinetic modeling does explicitly include co-adsorbates, a fast and reliable way to generate binding energies as well as reaction barriers with different types of co-adsorbate is still under development.
In more complicated cases such as oxides, the reacting molecules can induce change of the structure of a catalyst, creating vacancies or oxidizing surface metal atoms, resulting in a large amount of different types of sites for elementary reactions, and dramatically increase the computational complexity. Moreover, many catalytic reactions are catalyzed at the interface of a bi-functional catalyst, which is also not easy to be well described by calculations. The lattice mismatch between the particle and support results in a shift of relative positions between sites on particle and surface, which results in different environments of given sites, leading to a large number of possibilities to be considered in a single study. Similar issues occur in the case of zeolites, where the possibility to distribute Al atoms in the framework increase rapidly with increase of Al/Si ratio. The complexity of the systems mentioned above seems to beyond the ability to completely scan the potential energy surfaces to a large extent with DFT calculations, which limits most of the current studies which focus to understand one aspect of the catalyst instead of the complete picture of dehydrogenation. There is still a long way to go for theoretical studies to generate a complete and accurate description of complex catalytic systems.
In addition to the development of computational approaches, the progress of advanced in situ characterizations has helped in the identification of active sites in complex catalytic systems and offers more guidelines for theoretical studies to build more reliable models. On the other hand, controllable synthesis via colloidal chemistry is also necessary which can maximize the content of the theoretically identified highly active and selective sites and structures in a real catalyst.
Acknowledgements
This work was supported by the National Science Foundation of China (21222604), the Program for New Century Excellent Talents in University (NCET-10-0611) and the Program of Introducing Talents of Discipline to Universities (B06006).References
- J. J. H. B. Sattler, J. Ruiz-Martinez, E. Santillan-Jimenez and B. M. Weckhuysen, Chem. Rev., 2014, 114, 10613–10653 CrossRef CAS PubMed.
- P. C. A. Bruijnincx and B. M. Weckhuysen, Angew. Chem., Int. Ed., 2013, 52, 11980–11987 CrossRef CAS PubMed.
- C. Radcliffe, The FCC unit as a propylene source, http://www.digitalrefining.com/article/1000312#.VYcgIflVhBd.
- M. S. Kumar, D. Chen, A. Holmen and J. C. Walmsley, Catal. Today, 2009, 142, 17–23 CrossRef PubMed.
- F. Jiang, L. Zeng, S. Li, G. Liu, S. Wang and J. Gong, ACS Catal., 2015, 5, 438–447 CrossRef CAS.
- J. J. H. B. Sattler, I. D. Gonzalez-Jimenez, L. Luo, B. A. Stears, A. Malek, D. G. Barton, B. A. Kilos, M. P. Kaminsky, T. W. G. M. Verhoeven, E. J. Koers, M. Baldus and B. M. Weckhuysen, Angew. Chem., Int. Ed., 2014, 53, 9251–9256 CrossRef CAS PubMed.
- G. Jones, J. G. Jakobsen, S. S. Shim, J. Kleis, M. P. Andersson, J. Rossmeisl, F. Abild-Pedersen, T. Bligaard, S. Helveg, B. Hinnemann, J. R. Rostrup-Nielsen, I. Chorkendorff, J. Sehested and J. K. Nørskov, J. Catal., 2008, 259, 147–160 CrossRef CAS PubMed.
- J. Greeley, T. F. Jaramillo, J. Bonde, I. Chorkendorff and J. K. Nørskov, Nat. Mater., 2006, 5, 909–913 CrossRef CAS PubMed.
- F. Studt, I. Sharafutdinov, F. Abild-Pedersen, C. F. Elkjær, J. S. Hummelshøj, S. Dahl, I. Chorkendorff and J. K. Nørskov, Nat. Chem., 2014, 6, 320–324 CrossRef CAS PubMed.
- D. Balcells, E. Clot and O. Eisenstein, Chem. Rev., 2010, 110, 749–823 CrossRef CAS PubMed.
- L. H. Thomas, Math. Proc. Cambridge Philos. Soc., 1927, 23, 542–548 CrossRef CAS.
- E. Fermi, Rend. Accad. Naz. Lincei, 1927, 6, 602–607 CAS.
- W. Kohn and L. J. Sham, Phys. Rev., 1965, 140, A1133 CrossRef.
- J. P. Perdew and K. Schmidt, AIP Conference Proceedings, AIP Publishing, 2001, vol. 577, pp. 1–20 Search PubMed.
- J. P. Perdew and Y. Wang, Phys. Rev. B: Condens. Matter, 1992, 45, 13244–13249 CrossRef.
- J. P. Perdew, K. Burke and M. Ernzerhof, Phys. Rev. Lett., 1996, 77, 3865–3868 CrossRef CAS.
- B. Hammer, L. B. Hansen and J. K. Nørskov, Phys. Rev. B: Condens. Matter, 1999, 59, 7413–7421 CrossRef.
- C. D. Sherrill, J. Chem. Phys., 2010, 132, 110902 CrossRef PubMed.
- M. Dion, H. Rydberg, E. Schröder, D. C. Langreth and B. I. Lundqvist, Phys. Rev. Lett., 2004, 92, 246401 CrossRef CAS PubMed.
- J. Wellendorff, K. T. Lundgaard, A. Møgelhøj, V. Petzold, D. D. Landis, J. K. Nørskov, T. Bligaard and K. W. Jacobsen, Phys. Rev. B: Condens. Matter Mater. Phys., 2012, 85, 235149 CrossRef.
- J. Lüder, B. Sanyal, O. Eriksson, C. Puglia and B. Brena, Phys. Rev. B: Condens. Matter Mater. Phys., 2014, 89, 045416 CrossRef.
- K. Yang, J. Zheng, Y. Zhao and D. G. Truhlar, J. Chem. Phys., 2010, 132, 164117 CrossRef PubMed.
- I. V. Yudanov, A. Genest and N. Rösch, J. Cluster Sci., 2011, 22, 433–448 CrossRef CAS PubMed.
- Y. Chen, H. Wang, R. Burch, C. Hardacre and P. Hu, Faraday Discuss., 2011, 152, 121–133 RSC.
- W. Song and E. J. M. Hensen, Catal. Sci. Technol., 2013, 3, 3020–3029 CAS.
- D. S. Sholl and J. A. Steckel, Density Functional Theory: A Practical Introduction, Wiley, New Jersey, 2009, p. 144 Search PubMed.
- G. Henkelman, B. P. Uberuaga and H. Jónsson, J. Chem. Phys., 2000, 113, 9901–9904 CrossRef CAS PubMed.
- G. Henkelman and H. Jónsson, J. Chem. Phys., 1999, 111, 7010–7022 CrossRef CAS PubMed.
- R. A. van Santen, M. Neurock and S. G. Shetty, Chem. Rev., 2010, 110, 2005–2048 CrossRef CAS PubMed.
- M. Mavrikakis, B. Hammer and J. K. Nørskov, Phys. Rev. Lett., 1998, 81, 2819–2822 CrossRef.
- A. J. Medford, A. C. Lausche, F. Abild-Pedersen, B. Temel, N. C. Schjødt, J. K. Nørskov and F. Studt, Top. Catal., 2014, 57, 135–142 CrossRef CAS PubMed.
- C.-R. Chang, Z.-J. Zhao, K. Köhler, A. Genest, J. Li and N. Rösch, Catal. Sci. Technol., 2012, 2, 2238–2248 CAS.
- A. A. Gokhale, S. Kandoi, J. P. Greeley, M. Mavrikakis and J. A. Dumesic, Chem. Eng. Sci., 2004, 59, 4679–4691 CrossRef CAS PubMed.
- C. T. Campbell, L. Árnadóttir and J. R. V. Sellers, Z. Phys. Chem., 2013, 227, 1435–1454 CrossRef CAS.
- K. Reuter and M. Scheffler, Phys. Rev. B: Condens. Matter Mater. Phys., 2006, 73, 045433 CrossRef.
- Y. Xu, A. C. Lausche, S. Wang, T. S. Khan, F. Abild-Pedersen, F. Studt, J. K. Nørskov and T. Bligaard, New J. Phys., 2013, 15, 125021 CrossRef.
- P. Kratzer, B. Hammer and J. K. Nørskov, J. Chem. Phys., 1996, 105, 5595–5604 CrossRef CAS PubMed.
- J. R. Rostrup-Nielsen, Catalysis Science and Technology, ed. J. R. Anderson and M. Boudart, Springer, Berlin, 1984, vol. 5 Search PubMed.
- M. S. Aw, M. Zorko, I. G. Osojnik Črnivec and A. Pintar, Ind. Eng. Chem. Res., 2015, 54, 3775–3787 CrossRef CAS.
- H. Liu, R. Yan, R. Zhang, B. Wang and K. Xie, J. Nat. Gas Chem., 2011, 20, 611–617 CrossRef CAS.
- J. E. Mueller, Adri C. T. van Duin and W. A. Goddard III, J. Phys. Chem. C, 2009, 113, 20290–20306 CAS.
- Y.-A. Zhu, D. Chen, X.-G. Zhou and W.-K. Yuan, Catal. Today, 2009, 148, 260–267 CrossRef CAS PubMed.
- C. Fan, Y.-A. Zhu, Y. Xu, Y. Zhou, X.-G. Zhou and D. Chen, J. Chem. Phys., 2012, 137, 014703 CrossRef PubMed.
- R. M. Watwe, H. S. Bengaard, J. R. Rostrup-Nielsen, J. A. Dumesic and J. K. Nørskov, J. Catal., 2000, 189, 16–30 CrossRef CAS.
- Z. Zuo, W. Huang, P. Han and Z. Li, Appl. Surf. Sci., 2010, 256, 5929–5934 CrossRef CAS PubMed.
- J. Li, E. Croiset and L. Ricardez-Sandoval, J. Mol. Catal. A: Chem., 2012, 365, 103–114 CrossRef CAS PubMed.
- S. Yuan, L. Meng and J. Wang, J. Phys. Chem. C, 2013, 117, 14796–14803 CAS.
- G. Gajewski and C.-W. Pao, J. Chem. Phys., 2011, 135, 064707 CrossRef PubMed.
- N. M. Galea, D. Knapp and T. Ziegler, J. Catal., 2007, 247, 20–33 CrossRef CAS PubMed.
- W. Zhang, P. Wu, Z. Li and J. Yang, J. Phys. Chem. C, 2011, 115, 17782–17787 CAS.
- B. Wang, L. Song and R. Zhang, Appl. Surf. Sci., 2012, 258, 3714–3722 CrossRef CAS PubMed.
- P. W. van Grootel, R. A. van Santen and E. J. M. Hensen, J. Phys. Chem. C, 2011, 115, 13027–13034 CAS.
- A. Kokalj, N. Bonini, S. de Gironcoli, C. Sbraccia, G. Fratesi and S. Baroni, J. Am. Chem. Soc., 2006, 128, 12448–12454 CrossRef CAS PubMed.
- B. S. Bunnik and G. J. Kramer, J. Catal., 2006, 242, 309–318 CrossRef CAS PubMed.
- Z.-P. Liu and P. Hu, J. Am. Chem. Soc., 2003, 125, 1958–1967 CrossRef CAS PubMed.
- Q. Qi, X. Wang, L. Chen and B. Li, Appl. Surf. Sci., 2013, 284, 784–791 CrossRef CAS PubMed.
- G. Henkelman and H. Jónsson, Phys. Rev. Lett., 2001, 86, 664–667 CrossRef CAS.
- Y. Chen and D. G. Vlachos, J. Phys. Chem. C, 2010, 114, 4973–4982 CAS.
- F. Viñes, Y. Lykhach, T. Staudt, M. P. A. Lorenz, C. Papp, H.-P. Steinrück, J. Libuda, K. M. Neyman and A. Görling, Chem.–Eur. J., 2010, 16, 6530–6539 CrossRef PubMed.
- Z. Jiang, L. Li, J. Xu and T. Fang, Appl. Surf. Sci., 2013, 286, 115–120 CrossRef CAS PubMed.
- I. M. Ciobîcǎ, F. Frechard, R. A. van Santen, A. W. Kleyn and J. Hafner, J. Phys. Chem. B, 2000, 104, 3364–3369 CrossRef.
- A. Nilsson and L. G. M. Pettersson, Chemical Bonding at Surfaces and Interfaces, ed. A. Nilsson, L. G. M. Pettersson and J. K. Nørskov, Elsevier, Amsterdam, 2008 Search PubMed.
- B. Hammer and J. K. Nørskov, Advances in Catalysis, ed. H. K. Bruce and C. Gates, Academic Press, 2000, vol. 45, p. 99 Search PubMed.
- R. A. van Santen, Theoretical Heterogeneous Catalysis, World Scientific, Singapore, 1991 Search PubMed.
- K. Li, C. He, M. Jiao, Y. Wang, J. Liu and Z. Wu, J. Phys. Chem. C, 2014, 118, 17662–17669 CAS.
- H. S. Bengaard, J. K. Nørskov, J. Sehested, B. S. Clausen, L. P. Nielsen, A. M. Molenbroek and J. R. Rostrup-Nielsen, J. Catal., 2002, 209, 365–384 CrossRef CAS.
- M. B. Hugenschmidt, P. Dolle, J. Jupille and A. Cassuto, J. Vac. Sci. Technol., A, 1989, 7, 3312–3316 CAS.
- H. Steininger, H. Ibach and S. Lehwald, Surf. Sci., 1982, 117, 685–698 CrossRef CAS.
- R. J. Koestner, M. A. van Hove and G. A. Somorjai, Surf. Sci., 1982, 121, 321–337 CrossRef CAS.
- L. L. Kesmodel and J. A. Gates, Surf. Sci., 1981, 111, L747–L754 CrossRef CAS.
- T. Marinova and K. L. Kostov, Surf. Sci., 1987, 181, 573–585 CrossRef CAS.
- M. M. Hills, J. E. Parmeter, C. B. Mullins and W. H. Weinberg, J. Am. Chem. Soc., 1986, 108, 3554–3562 CrossRef CAS.
- F. Zaera and C. R. French, J. Am. Chem. Soc., 1999, 121, 2236–2243 CrossRef CAS.
- Z.-J. Zhao, L. V. Moskaleva, H. A. Aleksandrov, D. Başaran and N. Rösch, J. Phys. Chem. C, 2010, 114, 12190–12201 CAS.
- A. T. Anghel, D. J. Wales, S. J. Jenkins and D. A. King, J. Chem. Phys., 2007, 126, 044710 CrossRef CAS PubMed.
- J. Andersin, N. Lopez and K. Honkala, J. Phys. Chem. C, 2009, 113, 8278–8286 CAS.
- M. Li, W. Guo, R. Jiang, L. Zhao, X. Lu, H. Zhu, D. Fu and H. Shan, J. Phys. Chem. C, 2010, 114, 8440–8448 CAS.
- J. M. H. Lo and T. Ziegler, J. Phys. Chem. C, 2007, 111, 13149–13162 CAS.
- H. A. Aleksandrov, L. V. Moskaleva, Z.-J. Zhao, D. Basaran, Z.-X. Chen, D. Mei and N. Rösch, J. Catal., 2012, 285, 187–195 CrossRef CAS PubMed.
- P. Cremer, C. Stanners, J. W. Niemantsverdriet, Y. R. Shen and G. Somorjai, Surf. Sci., 1995, 328, 111–118 CrossRef CAS.
- R. Deng, E. Herceg and M. Trenary, Surf. Sci., 2004, 560, L195–L201 CrossRef CAS PubMed.
- Z.-J. Zhao and J. P. Greeley, Surf. Sci., 2015 DOI:10.1016/j.susc.2015.01.022.
- L. V. Moskaleva, H. A. Aleksandrov, D. Basaran, Z.-J. Zhao and N. Rösch, J. Phys. Chem. C, 2009, 113, 15373–15379 CAS.
- L. V. Moskaleva, Z.-X. Chen, H. A. Aleksandrov, A. B. Mohammed, Q. Sun and N. Rösch, J. Phys. Chem. C, 2009, 113, 2512–2520 CAS.
- D. Basaran, H. A. Aleksandrov, Z.-X. Chen, Z.-J. Zhao and N. Rösch, J. Mol. Catal. A: Chem., 2011, 344, 37–46 CrossRef CAS PubMed.
- B. Wang, X. Ma, M. Caffio, R. Schaub and W.-X. Li, Nano Lett., 2011, 11, 424–430 CrossRef CAS PubMed.
- J. J. W. Harris, V. Fiorin, C. T. Campbell and D. A. King, J. Phys. Chem. B, 2005, 109, 4069–4075 CrossRef CAS PubMed.
- Z.-X. Chen, H. A. Aleksandrov, D. Basaran and N. Rösch, J. Phys. Chem. C, 2010, 114, 17683–17692 CAS.
- H. Gabasch, K. Hayek, B. Klötzer, A. Knop-Gericke and R. Schlögl, J. Phys. Chem. B, 2006, 110, 4947–4952 CrossRef CAS PubMed.
- R. T. Vang, K. Honkala, S. Dahl, E. K. Vestergaard, J. Schnadt, E. Lægsgaard, B. S. Clausen, J. K. Nørskov and F. Besenbacher, Surf. Sci., 2006, 600, 66–77 CrossRef CAS PubMed.
- M.-L. Yang, Y.-A. Zhu, C. Fan, Z.-J. Sui, D. Chen and X.-G. Zhou, J. Mol. Catal. A: Chem., 2010, 321, 42–49 CrossRef CAS PubMed.
- M.-L. Yang, Y.-A. Zhu, C. Fan, Z.-J. Sui, D. Chen and X.-G. Zhou, Phys. Chem. Chem. Phys., 2011, 13, 3257–3267 RSC.
- M.-L. Yang, J. Zhu, Y.-A. Zhu, Z.-J. Sui, Y.-D. Yu, X.-G. Zhou and D. Chen, J. Mol. Catal. A: Chem., 2014, 395, 329–336 CrossRef CAS PubMed.
- C. Chiu, A. Genest and N. Rösch, ChemCatChem, 2013, 5, 3299–3308 CrossRef CAS PubMed.
- Z.-J. Zhao, L. V. Moskaleva and N. Rösch, J. Catal., 2012, 285, 124–133 CrossRef CAS PubMed.
- Z.-J. Zhao, L. V. Moskaleva and N. Rösch, J. Catal., 2013, 299, 146–149 CrossRef CAS PubMed.
- Z.-J. Zhao, L. V. Moskaleva and N. Rösch, ACS Catal., 2013, 3, 196–205 CrossRef CAS.
- W. An, X. C. Zeng and C. H. Turner, J. Chem. Phys., 2009, 131, 174702 CrossRef PubMed.
- K. Li, Z. Zhou, Y. Wang and Z. Wu, Surf. Sci., 2013, 612, 63–68 CrossRef CAS PubMed.
- H. Liu, R. Zhang, R. Yan, J. Li, B. Wang and K. Xie, Appl. Surf. Sci., 2012, 258, 8177–8184 CrossRef CAS PubMed.
- H. Liu, R. Zhang, R. Yan, B. Wang and K. Xie, Appl. Surf. Sci., 2011, 257, 8955–8964 CrossRef CAS PubMed.
- Z. Han, S. Li, F. Jiang, T. Wang, X. Ma and J. Gong, Nanoscale, 2014, 6, 10000–10008 RSC.
- Y. Zhang, Y. Zhou, J. Shi, S. Zhou, X. Sheng, Z. Zhang and S. Xiang, J. Mol. Catal. A: Chem., 2014, 381, 138–147 CrossRef CAS PubMed.
- M.-L. Yang, Y.-A. Zhu, X.-G. Zhou, Z.-J. Sui and D. Chen, ACS Catal., 2012, 2, 1247–1258 CrossRef CAS.
- L. Nykänen and K. Honkala, J. Phys. Chem. C, 2011, 115, 9578–9586 Search PubMed.
- L. Nykänen and K. Honkala, ACS Catal., 2013, 3, 3026–3030 CrossRef.
- I. V. Yudanov, M. Metzner, A. Genest and N. Rösch, J. Phys. Chem. C, 2008, 112, 20269–20275 CAS.
- S. Vajda, M. J. Pellin, J. P. Greeley, C. L. Marshall, L. A. Curtiss, G. A. Ballentine, J. W. Elam, S. Catillon-Mucherie, P. C. Redfern, F. Mehmood and P. Zapol, Nat. Mater., 2009, 8, 213–216 CrossRef CAS PubMed.
- C. A. Carrero, R. Schloegl, I. E. Wachs and R. Schomaecker, ACS Catal., 2014, 4, 3357–3380 CrossRef CAS.
- H. Fu, Z.-P. Liu, Z.-H. Li, W.-N. Wang and K.-N. Fan, J. Am. Chem. Soc., 2006, 128, 11114–11123 CrossRef CAS PubMed.
- K. Tarama, S. Yoshida, S. Ishida and H. Kakioka, Bull. Chem. Soc. Jpn., 1968, 41, 2840–2845 CrossRef CAS.
- J. G. Eon, R. Olier and J. C. Volta, J. Catal., 1994, 145, 318–326 CrossRef CAS.
- G.-L. Dai, Z.-P. Liu, W.-N. Wang, J. Lu and K.-N. Fan, J. Phys. Chem. C, 2008, 112, 3719–3725 CAS.
- M. D. Argyle, K. Chen, A. T. Bell and E. Iglesia, J. Catal., 2002, 208, 139–149 CrossRef CAS.
- P. Michorczyk and J. Ogonowski, React. Kinet. Catal. Lett., 2003, 78, 41–47 CrossRef CAS.
- Y. Liu, Z. H. Li, J. Lu and K.-N. Fan, J. Phys. Chem. C, 2008, 112, 20382–20392 CAS.
- N. Rahimi and R. Karimzadeh, Appl. Catal., A, 2011, 398, 1–17 CrossRef CAS PubMed.
- E. A. Pidko, V. B. Kazansky, E. J. M. Hensen and R. A. van Santen, J. Catal., 2006, 240, 73–84 CrossRef CAS PubMed.
- C. Chiu, G. N. Vayssilov, A. Genest, A. Borgna and N. Rösch, J. Comput. Chem., 2014, 35, 809–819 CrossRef CAS PubMed.
- E. A. Pidko, E. J. M. Hensen and R. A. van Santen, J. Phys. Chem. C, 2007, 111, 13068–13075 CAS.
- E. A. Pidko and R. A. van Santen, J. Phys. Chem. C, 2007, 111, 2643–2655 CAS.
- Y. V. Joshi and K. T. Thomson, Catal. Today, 2005, 105, 106–121 CrossRef CAS PubMed.
- Y. V. Joshi and K. T. Thomson, J. Catal., 2007, 246, 249–265 CrossRef CAS PubMed.
- S. Wannakao, C. Warakulwit, K. Kongpatpanich, M. Probst and J. Limtrakul, ACS Catal., 2012, 2, 986–992 CrossRef CAS.
- X.-F. Yang, A. Wang, B. Qiao, J. Li, J. Liu and T. Zhang, Acc. Chem. Res., 2013, 46, 1740–1748 CrossRef CAS PubMed.
- X. Guo, G. Fang, G. Li, H. Ma, H. Fan, L. Yu, C. Ma, X. Wu, D. Deng, M. Wei, D. Tan, R. Si, S. Zhang, J. Li, L. Sun, Z. Tang, X. Pan and X. Bao, Science, 2014, 344, 616–619 CrossRef CAS PubMed.
- N. M. Schweitzer, B. Hu, U. Das, H. Kim, J. Greeley, L. A. Curtiss, P. C. Stair, J. T. Miller and A. S. Hock, ACS Catal., 2014, 4, 1091–1098 CrossRef CAS.
- J. Xu and M. Saeys, J. Catal., 2006, 242, 217–226 CrossRef CAS PubMed.
- J. R. Rostrupnielsen and J. H. B. Hansen, J. Catal., 1993, 144, 38–49 CrossRef CAS.
- F. Abild-Pedersen, J. K. Nørskov, J. R. Rostrup-Nielsen, J. Sehested and S. Helveg, Phys. Rev. B: Condens. Matter Mater. Phys., 2006, 73, 115419 CrossRef.
- J. Xu and M. Saeys, J. Phys. Chem. C, 2009, 113, 4099–4106 CAS.
- Z. Wang, X.-M. Cao, J. Zhu and P. Hu, J. Catal., 2014, 311, 469–480 CrossRef CAS PubMed.
- R. C. Catapan, A. A. M. Oliveira, Y. Chen and D. G. Vlachos, J. Phys. Chem. C, 2012, 116, 20281–20291 CAS.
- F. Besenbacher, I. Chorkendorff, B. S. Clausen, B. Hammer, A. M. Molenbroek, J. K. Nørskov and I. Stensgaard, Science, 1998, 279, 1913–1915 CrossRef CAS.
- E. Nikolla, A. Holewinski, J. Schwank and S. Linic, J. Am. Chem. Soc., 2006, 128, 11354–11355 CrossRef CAS PubMed.
- E. Nikolla, J. Schwank and S. Linic, J. Catal., 2007, 250, 85–93 CrossRef CAS PubMed.
- J. Xu, L. Chen, K. F. Tan, A. Borgna and M. Saeys, J. Catal., 2009, 261, 158–165 CrossRef CAS PubMed.
- J. Xu and M. Saeys, Chem. Eng. Sci., 2007, 62, 5039–5041 CrossRef CAS PubMed.
- K. Fei Tan, J. Xu, J. Chang, A. Borgna and M. Saeys, J. Catal., 2010, 274, 121–129 CrossRef CAS PubMed.
- M. Saeys, K. F. Tan, J. Chang and A. Borgna, Ind. Eng. Chem. Res., 2010, 49, 11098–11100 CrossRef CAS.
- I. V. Yudanov, A. V. Matveev, K. M. Neyman and N. Rösch, J. Am. Chem. Soc., 2008, 130, 9342–9352 CrossRef CAS PubMed.
- S. Schauermann, J. Hoffmann, V. Johánek, J. Hartmann, J. Libuda and H.-J. Freund, Angew. Chem., Int. Ed., 2002, 41, 2532–2535 CrossRef CAS.
- P. Paybaud, C. Chizallet, C. Mager-Maury, M. Digne, H. Toulhoat and P. Sautet, J. Catal., 2013, 308, 328–340 CrossRef PubMed.
- S. B. Vendelbo, M. Johansson, D. J. Mowbray, M. P. Andersson, F. Abild-Pedersen, J. H. Nielsen, J. K. Nørskov and I. Chorkendorff, Top. Catal., 2010, 53, 357–364 CrossRef CAS.
| This journal is © The Royal Society of Chemistry 2015 |


