DOI:
10.1039/D3AY00860F
(Paper)
Anal. Methods, 2023,
15, 3426-3431
Simultaneous determination of intracellular reduced and oxidized glutathiones by the König reaction†
Received
26th May 2023
, Accepted 3rd July 2023
First published on 4th July 2023
Abstract
The König reaction is commonly used for the detection of cyanide and its derivatives, including thiocyanate and selenocyanate. We found that this reaction can be used to quantify glutathione fluorometrically, and applied it to the simultaneous determination of reduced and oxidized glutathiones (GSH and GSSG) using a conventional LC system with isocratic elution. The limits of detection were 6.04 nM and 9.84 nM for GSH and GSSG, respectively, and the limits of quantification were 18.3 nM and 29.8 nM, respectively. We also determined GSH and GSSG levels in PC12 cells exposed to paraquat, an oxidative stressor, and observed a decrease in GSH/GSSG ratio, as expected. Total GSH levels quantified by this method and by the conventional colorimetric method with 5,5′-dithiobis(2-nitrobenzoic acid) were comparable. Our new application of the König reaction offers a reliable and useful method to simultaneously quantify intracellular GSH and GSSG.
Introduction
Reduced glutathione (GSH, γ-L-glutamyl-L-cysteinylglycine) is a tripeptide abundantly present in cells. The main role of GSH is to ameliorate intracellular oxidative stress. GSH is oxidized to glutathione disulfide (GSSG) via a direct reaction with intracellular oxidants or enzymatic reactions with glutathione peroxidase and glutathione S-transferase. Intracellular GSH exists at concentrations of 0.5–10 mM, whereas intracellular GSSG concentrations are much lower under physiological conditions, which are 5–50 μM.1 However, an increase in intracellular GSSG is observed when cells are exposed to oxidative stress. Hence, the GSH/GSSG ratio can be used as a biomarker of intracellular oxidative stress. Oxidative stress is related to aging and various diseases, such as cancer, diabetes, cardiovascular diseases, neurodegenerative diseases, and chronic kidney diseases.2,3 Toxic substances including paraquat and certain metals are known to induce oxidative stress.4,5 The determination of intracellular GSH and GSSG levels is important to elucidate the pathology of various diseases and the toxicity of various substances.
The enzymatic recycling assay with 5,5′-dithiobis(2-nitrobenzoic acid) (DTNB),6 also called Ellman's reagent, is widely used as the simplest method for determining GSH and GSSG levels, and can be performed using a commercially available kit. However, this method does not allow for the simultaneous determination of GSH and GSSG levels, and is also prone to false-positive errors because DTNB is not specific to GSH and reacts with other thiol groups, such as cysteine and protein thiols.7 The simultaneous determination of intracellular GSH and GSSG levels using liquid chromatographic (LC) techniques with fluorescence detection (FLD),8 electrochemical detection (ECD),9 or mass spectrometry (MS)10–14 has been reported. These techniques, however, have disadvantages: in the FLD method, GSH was derivatized with monobromobimane on a pre-column, and GSSG was derivatized with o-phthalaldehyde on a post-column. Hence, two detectors with the column-switching system are required to detect them simultaneously. The ECD method detects not only GSH but also other electrochemically active compounds, such as thiols, sugars, and catechol amines contained in the biological matrix; thus, obtaining a clear chromatogram by LC-ECD is more difficult than by LC-FLD or LC-MS. As for the MS method, LC-MS analysis of GSH and GSSG is highly sensitive, but access to LC-MS is limited owing to the high costs. Therefore, it is worthwhile to develop a novel technique to overcome these disadvantages.
Generally, cyanide (CN−) and its derivatives such as thiocyanate (SCN−) and selenocyanate (SeCN−) are detected using the König reaction. The reaction consists of three steps (Scheme 1). First, cyanide, thiocyanate, and selenocyanate are chlorinated by a chlorinating reagent, such as chloramine T, and the chlorinated compound, cyanogen chloride, generates glutaconic aldehyde via a pyridine ring–opening reaction; the reaction between the aldehyde and a coupling reagent generates a derivatized compound. Among various coupling reagents, barbituric acid in particular allows for the high-sensitivity detection and quantification of cyanide and its derivatives via the generation of a fluorescent compound.15–17 Interestingly, glycine is also converted into cyanogen chloride by a chlorinating reagent.18 We envisioned that the König reaction could be applied to the simultaneous determination of GSH and GSSG having a glycine residue at their C-termini. Here we report the simultaneous detection of intracellular GSH and GSSG by this highly specific reaction.
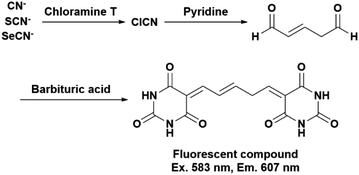 |
| | Scheme 1 Reaction flow of the König reaction. The fluorescent compound is produced by the third reaction with barbituric acid. | |
Experimental
Reagents
Chloramine T, reduced and oxidized glutathiones, hydrochloric acid, pyridine, sodium cyanide, sodium thiocyanate, and threonine were obtained from Nacalai Tesque (Kyoto, Japan). Glycine, serine, 5-sulfosalicylic acid dihydrate, and tyrosine were obtained from FUJIFILM Wako Pure Chemical Corporation (Osaka, Japan). Barbituric acid and paraquat were obtained from Tokyo Chemical Industry (Tokyo, Japan). Purified water was prepared by a Milli-Q system (Merck, Darmstadt, Germany).
Optimization of the König reaction
To investigate the relationship between the detection sensitivity and the chlorinating temperature, 100 μM GSH and 100 μM GSSG aqueous solutions were injected into a flow injection system similar to the system described in “HPLC conditions” (except that the column was not connected) at various chlorinating temperatures in the range of 30–80 °C.
Acquisition of absorption and fluorescence emission spectra
One hundred microliters of 100 μM GSH, 100 μM GSSG, or 10 μM cyanide aqueous solution was mixed with 400 μL of 75 mM acetate buffer (pH 5.0) and 100 μL of 0.03% chloramine T aqueous solution or H2O, and the reaction mixture was incubated for 10 min at 80 °C. Following this, 100 μL of the pyridine–barbituric acid reagent consisting of 5% (w/v) barbituric acid, 15% (v/v) pyridine, and 3% (v/v) hydrochloric acid or H2O was added, and the reaction mixture was incubated for 10 min at room temperature. Absorption and fluorescence emission spectra were analyzed by a SpectraMax iD3 microplate reader (Molecular Devices, San Jose, CA, USA).
HPLC conditions
The HPLC system and the operating conditions (Fig. S1†) were modified from those previously reported.16,17 Briefly, the system consisted of a Shimadzu LC-20 series (Shimadzu, Kyoto, Japan) comprising a degasser, pumps for delivering the mobile phase and the post-column derivatizing reagents, an autosampler, a fluorescence detector, the first reaction coil for chlorination (3000 × 0.5 mm i.d.) in a column oven, and the second reaction coil for the pyridine–barbituric acid reaction (15![[thin space (1/6-em)]](https://www.rsc.org/images/entities/char_2009.gif) 000 × 0.25 mm i.d.). A Scherzo SM-C18 column (3 μm, 150 × 4.6 mm i.d., Imtakt, Kyoto, Japan) was operated at room temperature and was isocratically eluted with 75 mM acetate buffer (pH 5.0) at a flow rate of 0.5 mL min−1. A chloramine T solution and pyridine–barbituric acid reagent were pumped into the reaction coil at a flow rate of 0.1 mL min−1. The post-column running time was 2.4 min. The reactant was monitored on-line at 583 nm excitation and 607 nm emission wavelengths. The injection volume was 20 μL in each experiment. Data acquisition and processing were performed using LabSolutions 5.97 software (Shimadzu). The analyte concentrations were quantified by the absolute calibration method with the peak area.
000 × 0.25 mm i.d.). A Scherzo SM-C18 column (3 μm, 150 × 4.6 mm i.d., Imtakt, Kyoto, Japan) was operated at room temperature and was isocratically eluted with 75 mM acetate buffer (pH 5.0) at a flow rate of 0.5 mL min−1. A chloramine T solution and pyridine–barbituric acid reagent were pumped into the reaction coil at a flow rate of 0.1 mL min−1. The post-column running time was 2.4 min. The reactant was monitored on-line at 583 nm excitation and 607 nm emission wavelengths. The injection volume was 20 μL in each experiment. Data acquisition and processing were performed using LabSolutions 5.97 software (Shimadzu). The analyte concentrations were quantified by the absolute calibration method with the peak area.
Limit of detection (LOD), limit of quantification (LOQ), and linearity
Serially diluted GSH and GSSG solutions (GSH: 0.05–50 μM, GSSG: 0.05–10 μM) were used to evaluate the LOD, LOQ, and linearity of the method. LOD and LOQ were calculated as 3.3 and 10 times the standard deviations of peak areas, respectively, of the lowest calibrant concentration (0.05 μM) divided by the slope of the calibration curves. Each experiment was repeated five times.
Cell culture
Rat pheochromocytoma cells (PC12 cells) were obtained from RIKEN Cell Bank (Tsukuba, Japan). PC12 cells were cultured on a collagen-coated dish in Dulbecco's modified Eagle's medium (FUJIFILM Wako Pure Chemical) supplemented with 10% horse serum (BioWest, Nuaillé, France) and 5% fetal bovine serum (Biosera, Nuaillé, France) at 37 °C under 5% CO2 atmosphere.
Paraquat exposure
PC12 cells were seeded on a collagen-coated 6-well plate at 1.0 × 10⁶ cells per well and incubated overnight. The cells were exposed to paraquat at concentrations of 250 and 500 μM for 24 h. After the incubation the cells were collected to quantify intracellular GSH and GSSG. This experiment was repeated three times.
Sample preparation
A cell pellet was suspended in 200 μL of 1% (w/v) 5-sulfosalicylic acid solution and placed on ice for 10 min after stirring on a vortex mixer. The mixture was centrifuged at 10![[thin space (1/6-em)]](https://www.rsc.org/images/entities/char_2009.gif) 000×g for 10 min at 4 °C. The supernatant was diluted with the same volume of H2O and filtered through a membrane filter (pore size: 0.45 μm). The filtrate was injected into the HPLC system, and was also analyzed by the glutathione quantification kit based on the DTNB method (Dojindo Laboratories, Kumamoto, Japan).
000×g for 10 min at 4 °C. The supernatant was diluted with the same volume of H2O and filtered through a membrane filter (pore size: 0.45 μm). The filtrate was injected into the HPLC system, and was also analyzed by the glutathione quantification kit based on the DTNB method (Dojindo Laboratories, Kumamoto, Japan).
Statistical analysis
Tukey's tests were used to compare GSH/GSSG ratios among three groups including control, 250, and 500 μM of paraquat exposure. Pearson's correlation analysis was performed to compare quantified values between by the HPLC and the DTNB methods. Statistical analyses were performed using JMP Pro 16.2.0 software (JMP Statistical Discovery LLC, Cary, NC, USA).
Results and discussion
Detection of GSH and GSSG by the König reaction
The reaction was dependent on the reaction temperature (Fig. 1). Although the sensitivity of the reaction was expected to increase further at temperatures above 80 °C, we set 80 °C as the optimum temperature for the chlorination to avoid bubbles generated at excessively high temperatures. The ratio of the peak heights of GSH and GSSG was close to 1![[thin space (1/6-em)]](https://www.rsc.org/images/entities/char_2009.gif) :
:![[thin space (1/6-em)]](https://www.rsc.org/images/entities/char_2009.gif) 2, the theoretical ratio at the high temperature conditions since GSSG has twice glycines than GSH. These results indicated that the chlorination reaction was a key step for the fluorescence detection of glutathiones. Indeed, the HPLC system in the absence of chloramine T or pyridine–barbituric acid reagent failed to detect glutathiones (data not shown). This also suggested that the detection of glutathiones requires both post-column reagents, as in the case of the cyanide detection. The absorption and fluorescence emission spectra of GSH and GSSG reacted with these reagents were similar to those of cyanide; the absorption and fluorescence emission spectra were not obtained in the absence of either or both reagents (Fig. S2 and S3†). These results suggest that the derivatization procedure of GSH and GSSG is similar to that of cyanide. Considering glycine is converted to cyanide by chlorination,18 we speculate that the glycine residues of GSH and GSSG are decomposed to generate cyanide which subsequently undergo the König reaction (Schemes S1† and 1).
2, the theoretical ratio at the high temperature conditions since GSSG has twice glycines than GSH. These results indicated that the chlorination reaction was a key step for the fluorescence detection of glutathiones. Indeed, the HPLC system in the absence of chloramine T or pyridine–barbituric acid reagent failed to detect glutathiones (data not shown). This also suggested that the detection of glutathiones requires both post-column reagents, as in the case of the cyanide detection. The absorption and fluorescence emission spectra of GSH and GSSG reacted with these reagents were similar to those of cyanide; the absorption and fluorescence emission spectra were not obtained in the absence of either or both reagents (Fig. S2 and S3†). These results suggest that the derivatization procedure of GSH and GSSG is similar to that of cyanide. Considering glycine is converted to cyanide by chlorination,18 we speculate that the glycine residues of GSH and GSSG are decomposed to generate cyanide which subsequently undergo the König reaction (Schemes S1† and 1).
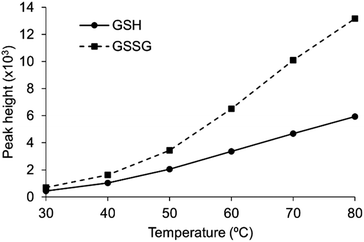 |
| | Fig. 1 Temperature-dependent improvement of sensitivity in the detection of GSH and GSSG. 100 μM GSH and GSSG aqueous solutions were injected into the flow injection system. | |
Separation of GSH and GSSG
The SM-C18 column enabled good separation with isocratic elution. Typical chromatograms are shown in Fig. 2. The retention times of GSH and GSSG were 7.8 min and 9.9 min, respectively. They were also separated from other expected detectable compounds, i.e., glycine, cyanide and thiocyanate (Fig. 2B and C). The peak observed at 5.6 min in Fig. 2A was believed to originate in contaminants from glycine or its derivatives, such as cysteinylglycine, in the GSH and GSSG reagents.
 |
| | Fig. 2 Typical chromatograms of reduced and oxidized glutathiones (GSH and GSSG), glycine (Gly), and cyanide and thiocyanate (CN−, and SCN−). (A) 5 μM GSH and 5 μM GSSG, (B) 0.1 μM Gly, (C) 0.1 μM CN− and 0.1 μM SCN−. Column: Scherzo SM-C18 (3 μm, 150 × 4.6 mm i.d.). Mobile phase: 75 mM acetate buffer (pH 5.0). | |
Evaluation of LOD, LOQ, and linearity
The coefficients of determination of the calibration curves for the quantification of GSH and GSSG were higher than 0.999 in the range of 0.05–50 μM for GSH and 0.05–10 μM for GSSG, indicating good linearity (Tables 1 and S1†). LOD and LOQ values were calculated using the calibration curves to be 6.04 nM and 18.3 nM for GSH, respectively, and 9.84 nM and 29.8 nM for GSSG, respectively (Table 1). The LOQ values of the present method were superior to those of previously reported LC-MS methods (Table S2†). The precisions and accuracies were 0.44–3.69% and 80.6–104.8%, respectively (Table S3†). These results validate the usefulness of our method for determining GSH and GSSG levels.
Table 1 LOD, LOQ, and linearity of the present method
| Compound |
LOD (nM) |
LOQ (nM) |
Linearity (μM, R2 > 0.999) |
| GSH |
6.04 |
18.3 |
0.05–50 |
| GSSG |
9.84 |
29.8 |
0.05–10 |
Application to cell samples
Typical chromatograms of PC12 cell samples are shown in Fig. 3. GSH and GSSG were separately eluted at the retention times of 7.7 min and 9.7 min, respectively. Although a large fluorescence peak possibly due to glycine appeared at 5.6 min, it did not seem to affect the GSH elution, as the resolution between this peak and the GSH peak was 2.7. The precisions were 2.39–10.9%, and the accuracies were 84.8–96.5% (Table 2). We determined GSH and GSSG levels and calculated GSH/GSSG ratios in PC12 cells exposed to paraquat. As expected, a dose-dependent decrease in GSH/GSSG ratio was observed (Fig. 4). These results suggest that the method developed in the present study is applicable to biological samples such as cultured cells, and can be used to evaluate the effect of oxidative stress on intracellular GSH and GSSG concentrations. In terms of accuracy, the present method is comparable to the most conventional GSH determination method using DTNB (Fig. 5). Pearson's correlation analysis revealed a high correlation between the two methods, with a correlation coefficient of 0.9970 and a p-value less than 0.0001. The slope of the regression curve was almost equal to 1, suggesting that values obtained using the present method correlated well with those obtained by the DTNB method. The DTNB method cannot be used to directly determine GSSG concentration, i.e., GSSG must be reduced with glutathione reductase first, and the concentration obtained as the total GSH concentration. In other words, the measurement must be repeated twice for GSH and GSH plus GSSG. In contrast, our method allows for the simultaneous determination of GSH and GSSG levels in one HPLC run, which is a great advantage over the conventional method.
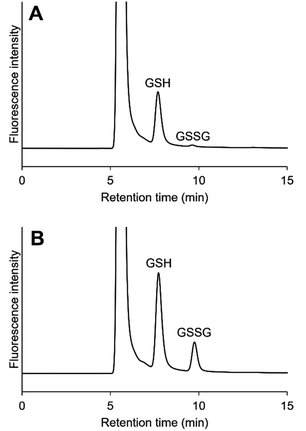 |
| | Fig. 3 Typical chromatograms of GSH and GSSG in PC12 cell samples. (A) Unspiked, (B) spiked with 40 μM GSH and 10 μM GSSG. | |
Table 2 Precision and accuracy of the present method using PC12 cell samples (n = 5)
| Compound |
Concentration |
Precision (%RSD) |
Accuracy (% of target) |
| Spiked (μM) |
Observed (mean ± SD, μM) |
| GSH |
0 |
44.8 ± 1.4 |
3.08 |
— |
| 40 |
78.7 ± 2.5 |
3.21 |
84.8 |
| GSSG |
0 |
0.609 ± 0.066 |
10.9 |
— |
| 1 |
1.57 ± 0.04 |
2.79 |
96.0 |
| 10 |
10.3 ± 0.2 |
2.39 |
96.5 |
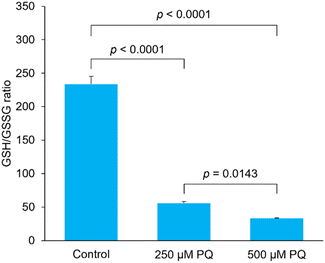 |
| | Fig. 4 Effect of paraquat on intracellular GSH/GSSG ratio. GSH/GSSG ratios were calculated by quantifying GSH and GSSG in PC12 cells co-incubated with 0, 250, or 500 μM paraquat (PQ) for 24 h. Data are presented as mean ± S.D. (n = 3). Tukey's tests were performed. | |
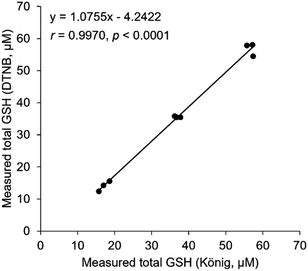 |
| | Fig. 5 Correlation between the present method and the DTNB method. Total GSH concentration in the same sample was quantified by the present method (x-axis) and the DTNB method (y-axis). Pearson's correlation analysis was performed. | |
Other detectable compounds
We performed the König reaction with other proteinous amino acids and found that in addition to glycine and glutathiones, serine, threonine, and tyrosine can also be detected by the present method (Fig. 6). Serine and threonine were eluted at almost the same retention time as glycine. The first large peak at around 5.6 min in Fig. 3 may thus be attributed to not only glycine but also serine and threonine. The detailed mechanisms of the formation of the fluorescent compound with these amino acids are still unclear, and the reaction conditions have yet to be optimized. Nevertheless, our method based on the König reaction is applicable to the analysis of serine, threonine, and tyrosine, with adequate separation and detection conditions.
 |
| | Fig. 6 Detection of serine (Ser), threonine (Thr), and tyrosine (Tyr) using the present method. (A) 5 μM Ser, (B) 5 μM Thr, and (C) 5 μM Tyr. | |
Conclusions
We have developed a method for the simultaneous determination of GSH and GSSG levels using the König reaction. This is the first application of the König reaction to the quantification of compounds other than cyanide and its derivatives. The fluorescence detection method enabled the high-sensitivity quantification of glutathiones, especially GSSG whose intracellular levels are low. The developed method is expected to contribute to the elucidation of the relationship between oxidative stress and biological systems.
Author contributions
R. M.: conceptualization, investigation, methodology, validation, writing – original draft; A. K.: investigation, methodology, writing – review & editing; H. T.: methodology, writing – review & editing; T. T.: conceptualization, methodology, writing – review & editing; Y. O.: conceptualization, methodology, project administration, resources, supervision, writing – review & editing.
Conflicts of interest
There are no conflicts to declare.
Acknowledgements
This work was supported by the Support for Pioneering Research Initiated by the Next Generation (JPMJSP2109) from the Japan Science and Technology Agency (JST), and Grants-in-Aid for Scientific Research on Innovative Areas (19H05772) and Scientific Research (A) (21H04920) from the Japan Society for the Promotion Science (JSPS).
References
- G. K. Balendiran, R. Dabur and D. Fraser, Cell Biochem. Funct., 2004, 22, 343–352 CrossRef CAS PubMed
 .
.
- I. Liguori, G. Russo, F. Curcio, G. Bulli, L. Aran, D. Della-Morte, G. Gargiulo, G. Testa, F. Cacciatore and D. Bonaduce, Clin. Interventions Aging, 2018, 13, 757 CrossRef CAS PubMed
 .
.
- J. D. Hayes, A. T. Dinkova-Kostova and K. D. Tew, Cancer Cell, 2020, 38, 167–197 CrossRef CAS PubMed
 .
.
- K. Jomova and M. Valko, Toxicology, 2011, 283, 65–87 CrossRef CAS PubMed
 .
.
- B. K. Barlow, D. W. Lee, D. A. Cory-Slechta and L. A. Opanashuk, Neurotoxicology, 2005, 26, 63–75 CrossRef CAS PubMed
 .
.
-
M. E. Anderson, in Methods in Enzymology, Elsevier, 1985, vol. 113, pp. 548–555 Search PubMed
 .
.
- G. L. Ellman, Arch. Biochem. Biophys., 1959, 82, 70–77 CrossRef CAS PubMed
 .
.
- A. K. Sakhi, R. Blomhoff and T. E. Gundersen, J. Chromatogr. A, 2007, 1142, 178–184 CrossRef CAS PubMed
 .
.
- L.-P. Yap, H. Sancheti, M. D. Ybanez, J. Garcia, E. Cadenas and D. Han, Methods Eenzymol., 2010, 473, 137–147 CAS
 .
.
- D. T. Harwood, A. J. Kettle, S. Brennan and C. C. Winterbourn, J. Chromatogr. B, 2009, 877, 3393–3399 CrossRef CAS PubMed
 .
.
- T. Moore, A. Le, A.-K. Niemi, T. Kwan, K. Cusmano-Ozog, G. M. Enns and T. M. Cowan, J. Chromatogr. B, 2013, 929, 51–55 CrossRef CAS PubMed
 .
.
- D. Carroll, D. Howard, H. Zhu, C. M. Paumi, M. Vore, S. Bondada, Y. Liang, C. Wang and D. K. S. Clair, Free Radicals Biol. Med., 2016, 97, 85–94 CrossRef CAS PubMed
 .
.
- H. Liu, F. Xu, Y. Gao, Y. Pang, C. Xie and C. Jiang, Anal. Chem., 2020, 92, 8810–8818 CrossRef CAS PubMed
 .
.
- Y.-F. Zhang, Y. Wang, K.-R. Zhang, H.-M. Lei, Y.-B. Tang and L. Zhu, J. Chromatogr. B, 2020, 1148, 122145 CrossRef CAS PubMed
 .
.
- J. L. Lambert, J. Ramasamy and J. V. Paukstelis, Anal. Chem., 1975, 47, 916–918 CrossRef CAS
 .
.
- T. Toida, T. Togawa, S. Tanabe and T. Imanari, J. Chromatogr. B: Biomed. Sci. Appl., 1984, 308, 133–141 CrossRef CAS PubMed
 .
.
- R. Mochizuki, K. Higashi, Y. Okamoto, H. Abe, H. Iwase and T. Toida, Chem. Pharm. Bull., 2019, 67, 884–887 CrossRef CAS PubMed
 .
.
- C. Na and T. M. Olson, Environ. Sci. Technol., 2006, 40, 1469–1477 CrossRef CAS PubMed
 .
.
|
| This journal is © The Royal Society of Chemistry 2023 |
Click here to see how this site uses Cookies. View our privacy policy here.  Open Access Article
 *
*

![[thin space (1/6-em)]](https://www.rsc.org/images/entities/char_2009.gif) 000 × 0.25 mm i.d.). A Scherzo SM-C18 column (3 μm, 150 × 4.6 mm i.d., Imtakt, Kyoto, Japan) was operated at room temperature and was isocratically eluted with 75 mM acetate buffer (pH 5.0) at a flow rate of 0.5 mL min−1. A chloramine T solution and pyridine–barbituric acid reagent were pumped into the reaction coil at a flow rate of 0.1 mL min−1. The post-column running time was 2.4 min. The reactant was monitored on-line at 583 nm excitation and 607 nm emission wavelengths. The injection volume was 20 μL in each experiment. Data acquisition and processing were performed using LabSolutions 5.97 software (Shimadzu). The analyte concentrations were quantified by the absolute calibration method with the peak area.
000 × 0.25 mm i.d.). A Scherzo SM-C18 column (3 μm, 150 × 4.6 mm i.d., Imtakt, Kyoto, Japan) was operated at room temperature and was isocratically eluted with 75 mM acetate buffer (pH 5.0) at a flow rate of 0.5 mL min−1. A chloramine T solution and pyridine–barbituric acid reagent were pumped into the reaction coil at a flow rate of 0.1 mL min−1. The post-column running time was 2.4 min. The reactant was monitored on-line at 583 nm excitation and 607 nm emission wavelengths. The injection volume was 20 μL in each experiment. Data acquisition and processing were performed using LabSolutions 5.97 software (Shimadzu). The analyte concentrations were quantified by the absolute calibration method with the peak area.
![[thin space (1/6-em)]](https://www.rsc.org/images/entities/char_2009.gif) 000×g for 10 min at 4 °C. The supernatant was diluted with the same volume of H2O and filtered through a membrane filter (pore size: 0.45 μm). The filtrate was injected into the HPLC system, and was also analyzed by the glutathione quantification kit based on the DTNB method (Dojindo Laboratories, Kumamoto, Japan).
000×g for 10 min at 4 °C. The supernatant was diluted with the same volume of H2O and filtered through a membrane filter (pore size: 0.45 μm). The filtrate was injected into the HPLC system, and was also analyzed by the glutathione quantification kit based on the DTNB method (Dojindo Laboratories, Kumamoto, Japan).
![[thin space (1/6-em)]](https://www.rsc.org/images/entities/char_2009.gif) :
:![[thin space (1/6-em)]](https://www.rsc.org/images/entities/char_2009.gif) 2, the theoretical ratio at the high temperature conditions since GSSG has twice glycines than GSH. These results indicated that the chlorination reaction was a key step for the fluorescence detection of glutathiones. Indeed, the HPLC system in the absence of chloramine T or pyridine–barbituric acid reagent failed to detect glutathiones (data not shown). This also suggested that the detection of glutathiones requires both post-column reagents, as in the case of the cyanide detection. The absorption and fluorescence emission spectra of GSH and GSSG reacted with these reagents were similar to those of cyanide; the absorption and fluorescence emission spectra were not obtained in the absence of either or both reagents (Fig. S2 and S3†). These results suggest that the derivatization procedure of GSH and GSSG is similar to that of cyanide. Considering glycine is converted to cyanide by chlorination,18 we speculate that the glycine residues of GSH and GSSG are decomposed to generate cyanide which subsequently undergo the König reaction (Schemes S1† and 1).
2, the theoretical ratio at the high temperature conditions since GSSG has twice glycines than GSH. These results indicated that the chlorination reaction was a key step for the fluorescence detection of glutathiones. Indeed, the HPLC system in the absence of chloramine T or pyridine–barbituric acid reagent failed to detect glutathiones (data not shown). This also suggested that the detection of glutathiones requires both post-column reagents, as in the case of the cyanide detection. The absorption and fluorescence emission spectra of GSH and GSSG reacted with these reagents were similar to those of cyanide; the absorption and fluorescence emission spectra were not obtained in the absence of either or both reagents (Fig. S2 and S3†). These results suggest that the derivatization procedure of GSH and GSSG is similar to that of cyanide. Considering glycine is converted to cyanide by chlorination,18 we speculate that the glycine residues of GSH and GSSG are decomposed to generate cyanide which subsequently undergo the König reaction (Schemes S1† and 1).


.
.
.
.
.
.
.
.
.
.
.
.
.
.
.
.
.
.


