
 Open Access Article
 This Open Access Article is licensed under a Creative Commons Attribution-Non Commercial 3.0 Unported Licence
Slow hole diffusion limits the efficiency of p-type dye-sensitized solar cells based on the P1 dye†
Maria B. Brandsa,
Olivier C. M. Lugier a,
Kaijian Zhub,
Annemarie Huijserb,
Stefania Tanasea and
Joost N. H. Reek*a
a,
Kaijian Zhub,
Annemarie Huijserb,
Stefania Tanasea and
Joost N. H. Reek*a
aVan’t Hoff Institute for Molecular Sciences, University of Amsterdam, Science Park 904, 1098 XH Amsterdam, The Netherlands. E-mail: j.n.h.reek@uva.nl
bMESA+ Institute for Nanotechnology, University of Twente, Hallenweg 23, 7522 NH, Enschede, The Netherlands
First published on 2nd July 2024
Abstract
NiO electrodes are widely applied in p-type dye-sensitized solar cells (DSSCs) and photoelectrochemical cells, but due to excessive charge recombination, the efficiencies of these devices are still too low for commercial applications. To understand which factors induce charge recombination, we studied electrodes with a varying number of NiO layers in benchmark P1 p-DSSCs. We obtained the most efficient DSSCs with four layers of NiO (0.134%), and further insights into this optimum were obtained via dye loading studies and in operando photoelectrochemical immittance spectroscopy. These results revealed that more NiO layers led to an increasing light harvesting efficiency (ηLH), but a decreasing hole collection efficiency (ηCC), giving rise to the maximum efficiency at four NiO layers. The decreasing ηCC with more NiO layers is caused by longer hole collection times, which ultimately limits the overall efficiency. Notably, the recombination rates were independent of the number of NiO layers, and similar to those observed in the more efficient n-type DSSC analogues, but hole collection was an order of magnitude slower. Therefore, with more NiO layers, the beneficial increase in ηLH can no longer counteract the decrease in ηCC due to slow hole collection, resulting in the overall efficiency of the solar cells to maximize at four NiO layers.
Introduction
NiO is commonly used as a p-type semiconducting photocathode in solar-energy harvesting devices, such as dye-sensitized solar cells (DSSCs) and dye-sensitized photoelectrochemical cells.1–3 The efficiencies of p-type and tandem DSSCs (4.1%4) are still limited, especially compared to that of n-type DSSCs, which recently reached over 15%.5 Excessive charge recombination at the photocathode is the main reason for the poor performance of tandem and p-type devices. To prevent this recombination, efforts have been put into rationally designing the molecular components of these devices. For instance, the push–pull character of a photosensitizer supports spatial separation of electrons and holes, thereby reducing charge recombination to some extent.6–8 Photosensitizers equipped with binding motifs to pre-organize the electrolyte via pseudo-rotaxane formation also result in spatial separation of charges, similarly reducing charge recombination and thus improving the overall efficiency.9 Furthermore, alternative p-type semiconductor materials have been investigated, including CuCrO210,11 or indium-doped tin oxide (ITO).12,13 Although these materials are very promising in terms of transparency and hole mobility, they are still outperformed by NiO, which possesses a combination of characteristics that are crucial for an efficient photocathode, such as a good transparency and surface area, and high stability in various solvent systems.7Several groups have thus focused on the optimization of NiO photocathodes, where efforts have been put into designing the optimal preparation route for the NiO electrode, which can greatly impact the DSSC efficiency.14–16 To facilitate comparison between different NiO electrodes in p-type DSSCs, a benchmark system has been developed, in which NiO has been sensitized with the P1 dye.14,17 The working principle of the overall p-DSSC based on P1 is schematically shown in Fig. 1(a), where the photocathode is typically combined with a Pt counter anode18,19 and an iodide/triiodide redox couple in a sandwich cell, as depicted in Fig. 1(b). Although these solar cells do not lead to record efficiencies, this benchmark system is valuable in understanding the influence of the NiO preparation route on the performance of the photocathode. Previous benchmark studies concluded that doctor-blading of a NiCl2 sol–gel precursor solution leads to the most efficient P1-based p-DSSCs.14,15
 | ||
| Fig. 1 (a) Schematic overview of the P1 p-DSSC benchmark system; (b) the sandwich DSSC, left: top view; right: side view. | ||
In general, during doctor-blading, a NiCl2 precursor solution is applied on a conduction substrate (FTO) using a tape mask, after which the resulting sol–gel is sintered, and this process is repeated as often as desired. However, the exact experimental details of the optimal preparation still seem to be under debate. For instance, several reports suggest that two layers of the nickel sol–gel solution should be applied,20–26 whereas others apply one,27 three,28–30 or ‘multiple’31–34 layers. Furthermore, even when the reported preparation method is exactly the same, the efficiencies of the resulting solar cells tend to vary significantly.14,20,35 It is also known that the quality of NiO can vary significantly when prepared by different researchers while using the same procedure.6,36
We therefore revisit the preparation of NiO electrodes via doctor-blading. In this context, we optimized the method by studying how the number of NiO layers influences the performance of the photocathode in the benchmark P1 p-DSSC. To obtain deeper insights into the efficiency-limiting factors, the charge transfer dynamics were investigated with photoelectrochemical impedance spectroscopy (PEIS), and intensity-modulated photocurrent and photovoltage spectroscopy (IMPS and IMVS). These in operando methods have been combined often for n-type DSSCs, to obtain a better understanding of the charge dynamics on the solar cell efficiency.37–51 On the other hand, the hole kinetics of the benchmark P1 p-DSSC has exclusively been characterized in operando with PEIS,52 whereas IMPS and IMVS can be valuable complementary methods. We thus investigated the kinetics of the photogenerated holes by combining these three methods, from which we obtained important insights on how the charge dynamics influence the performance of the solar cell. To the best of our knowledge, this is the first study that addresses the influence of the NiO doctor-blading method on the in operando charge dynamics and overall efficiency of p-DSSCs.
Results and discussion
P1-sensitized NiO electrodes with one to five layers of NiO were synthesized and characterized, and their performance was subsequently evaluated in the benchmark P1 p-DSSCs. We tested their performance by measuring the J–V curves of the solar cells, and we also determined the thickness and dye loading of the electrodes. Finally, the charge dynamics were investigated with IMPS and PEIS.Somewhat unconventional, we classified the NiO electrodes according to the number of doctor-blade cycles instead of their thickness, where the latter is more common in the literature. Although the film thickness is a very relevant property, it can be an impractical point of reference, since there appears to be no general consensus on the optimal value.20,25–34 More importantly, we found that a reproduced film thickness does not automatically result in a similarly performing electrode (vide infra). On the other hand, classifying the electrodes by the number of NiO layers lies close to practice, and is a more straightforward target to aim for than for a certain film thickness. Furthermore, this categorization still directly relates to the film thickness, but includes additional relevant parameters,20 such as the film porosity and density.
Synthesis, characterization and assembly of the P1-sensitized p-DSSCs
Since the exact preparation route is very relevant for reproduction of the results below, we have provided a detailed experimental description on our electrode preparation procedure in the ESI.† The first step of the NiO electrode preparation is the electrodeposition of a thin layer (<100 nm) of NiO on fluorine doped tin oxide (FTO).53 The surface roughness of this thin NiO layer enhances the connection between the porous NiO film and the FTO substrate, allowing for efficient charge transfer, essential for the performance of the DSSC. Subsequently, the mesoporous NiO film was applied via doctor-blading according to the method of Sun et al.,20 but instead of two layers, one to five layers were applied (in quadruple). Each set was named after the number of doctor-bladed NiO layers; the samples consisting of one layer of NiO is referred to as the NiO1 set. The electrodes were characterized with scanning electron microscopy (Fig. SI-4 and SI-5, ESI†). The thickness was determined with a profilometer (see the ESI,† Section 2.1). As expected, the average NiO film thickness increases with the number of layers (Table 1). The P1 dye was then grafted on the NiO surface by dipping the electrode in a P1 dye solution in acetonitrile for 16 hours.20 Visual inspection of the electrodes showed that these turned from light grey into bright red (see Table SI-1, ESI†).| Sample group | Film thickness (μm) | P1 loading (nmol cm−2) |
|---|---|---|
| NiO1 | 0.63 ± 0.06 | 75.31 ± 20.11 |
| NiO2 | 0.93 ± 0.23 | 74.91 ± 12.31 |
| NiO3 | 1.30 ± 0.34 | 111.28 ± 34.19 |
| NiO4 | 1.58 ± 0.32 | 143.37 ± 25.74 |
| NiO5 | 2.16 ± 0.14 | 130.39 ± 15.74 |
The P1 dye loading generally increases with the NiO layers, as was determined by dye leaching studies under mild conditions (Table 1).54–56 The P1 dye loadings on the electrodes reported herein are well within the range of earlier reported values (see Table SI-4, ESI†).57–61 Remarkably, comparison of NiO5 and NiO4 shows that the dye loading did not increase, while the NiO5 film is thicker. A possible explanation can be found by closely inspecting the SEM images in Fig. SI-5 (ESI†). When carrying out multiple rounds of doctor blading, the bottom NiO layers are exposed to high temperatures repeatedly. The particles in these bottom layers will continue to sinter and grow. After four layers, larger pores seem to form in the bottom layers, which will negatively influence the available surface area and thus dye loading. The inferior dye loading observed for sample NiO5 compared to NiO4 is thus likely the result of this reduced available surface area, which is not compensated for by the increase in the film thickness. These results also illustrate the relevance of the number of doctor blade cycles on the porosity and film density, and why we thus prefer to assort the NiO electrodes accordingly.
Efficiency of benchmark p-DSSCs
The P1-sensitized electrodes were assembled in sandwich cells (Fig. 1(b)) and their performance was assessed by measuring the J–V curve while illuminated with 100 mW cm−2 white LED light (emission spectrum in Fig. SI-11, ESI†). The open-circuit potential (VOC), short-circuit current density (JSC), fill factor (FF), and power conversion efficiency (η) were extracted from the J–V data (eqn (SI-2) and (SI-3), ESI†). We also investigated the performance of solar cells with a similar NiO thickness (within 0.05 μm difference), to see if a reproduced film thickness leads to a reproduced photocathode performance, but the results were rather divergent (Tables SI-12, ESI†). The results categorized on the number of NiO layers are shown in Table 2. The values have been averaged for the various sample groups, with the values of the most efficient solar cell of the corresponding set in parentheses. Details of the individual solar cells can be found in the ESI.†| Sample group | η (%) | JSC (mA cm−2) | VOC (mV) | FF |
|---|---|---|---|---|
| NiO1 | 0.075 ± 0.029 (0.096) | −2.19 ± 0.82 (−2.948) | 106 ± 9 (107) | 0.318 ± 0.010 (0.307) |
| NiO2 | 0.093 ± 0.020 (0.114) | −2.59 ± 0.95 (−3.196) | 119 ± 20 (117) | 0.316 ± 0.037 (0.303) |
| NiO3 | 0.087 ± 0.046 (0.133) | −2.94 ± 1.36 (−4.254) | 101 ± 7 (106) | 0.288 ± 0.028 (0.295) |
| NiO4 | 0.134 ± 0.049 (0.190) | −4.49 ± 1.45 (−6.154) | 107 ± 1 (107) | 0.277 ± 0.017 (0.289) |
| NiO5 | 0.121 ± 0.031 (0.143) | −4.15 ± 0.81 (−4.724) | 105 ± 2 (106) | 0.278 ± 0.013 (0.295) |
Notably, the average solar cell efficiencies (η) vary significantly, showing an upward trend from 0.087% observed for NiO1 up to the maximum of 0.134% (NiO4), followed by a slight drop to 0.121% for NiO5. To find out which factors dictate this efficiency, we examined the correlation between η and VOC, FF and JSC (see Fig. SI-13, ESI†). VOC varies considerably between the different sample groups (101–119 mV), but no clear correlation with η could be found. Similarly, the fill factor varies between 0.277–0.318, but also did not show a clear link to η. On the other hand, we observed a linear dependency of η on JSC (Fig. SI-13, ESI†). On average, an increase in photocurrent was observed from −2.19 mA cm−2 for NiO1, to −4.49 mA cm−2 for NiO4, followed by a slight decrease for NiO5 to −4.15 mA cm−2, which is a similar trend to that observed for η. Clearly, the solar cell efficiency strongly depends on the short-circuit photocurrent, and therefore we decided to investigate the fundamental elements of the photocurrent in more detail.
The measured photocurrent is a result of multiple light-harvesting and charge separation processes in the p-DSSC, as described by eqn (1):62,63
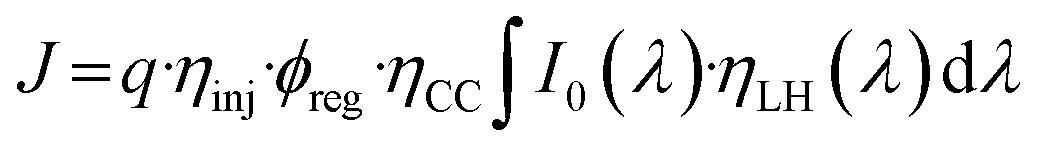 | (1) |
ηLH is related to the dye loading according to eqn (2):64
| ηLH(λ) = 1 − 10−Γσ(λ) | (2) |
Probing the charge collection efficiency with photoelectrochemical immittance spectroscopy
After light harvesting (i.e., photoexcitation of the dye and hole injection into NiO), the hole needs to travel through the nanoporous NiO network to the conducting FTO substrate. The success of this process is described as the charge collection efficiency (ηCC). The average time it takes for a photogenerated hole to travel to the FTO electrode is given by the hole collection time (τc), as is schematically shown by the green path in Fig. 2. Ideally, this time is short, because fast hole transport can manifest on the macroscale as a high photocurrent. Alternatively, the photogenerated hole can recombine with electrons from species in the electrolyte or at the surface of the NiO particle. The electron–hole pair generated by light absorption is then lost at the expense of the solar cell efficiency. The average time it takes for a photogenerated hole to recombine with an electron is given by the hole lifetime (τn).65 A long τn with respect to τc is beneficial, since it means that most of the holes will be collected before recombination occurs. This competition between the charge collection and recombination is expressed by the charge collection efficiency (eqn (3)).66,67
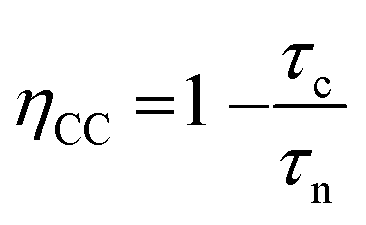 | (3) |
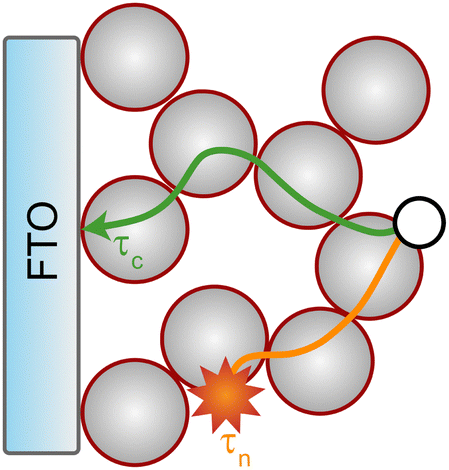 | ||
| Fig. 2 Schematic overview of the hole collection pathway (green) and the hole recombination pathway (orange) in the dye-sensitized photocathode. The dye-sensitized NiO nanoparticles are represented by the red circles filled with grey, and the photogenerated hole is shown as the empty circle. The competition between these two processes is described by the charge collection efficiency (ηCC). | ||
The time constants τc and τn in DSSCs can be measured in operando with (combinations of) the three complementary photoelectrochemical immittance techniques: intensity modulated photocurrent and photovoltage spectroscopy (IMPS and IMVS, respectively) and photoelectrochemical impedance spectroscopy (PEIS).50,68 To understand how ηCC changes in DSSCs based on different NiO layers, we have determined both τc and τn (Fig. 3) under short circuit conditions (at 0 V, where the photocurrent is at its maximum).69 The values for τc were determined using IMPS analysis,70 and those for τn by PEIS (see Sections 3.2 and 3.3 in the ESI† for detailed procedures). Subsequently, the average ηCC for the different sets of solar cells was calculated, and the results are plotted in the left panel of Fig. 3.
 | ||
| Fig. 3 Left: The charge collection efficiency ηCC versus the number of NiO layers; right: variation of the hole collection time τc (navy) and hole recombination time τn (orange) as a function of the number of applied NiO layers. | ||
For NiO1, a reasonable ηCC of 0.91 was observed, but ηCC decreases linearly with the number of layers, and ends up at a value of 0.65 for NiO5. The samples with the highest photocurrent (NiO4) show an average ηCC of 0.70. The underlying reason for this decline in ηCC with more NiO layers is given by the trends in τc and τn, which are plotted in Fig. 3 (right). The hole collection times τc are depicted in navy and the hole recombination times τn in orange. Interestingly, τn was only marginally affected by the number of NiO layers: for NiO1 the average time was 101.3 ± 13.7 ms, and for NiO5 this value decreased to 87.7 ± 6.8 ms. For NiO4, the hole recombination time was approximately 93.5 ± 33.7 ms. On the other hand, a clear trend in τc was observed as the number of NiO layers increased. In the NiO1 devices, it took the average hole 9.0 ± 3.0 ms to travel from the surface of the NiO particles to the FTO. For devices with thicker NiO films, this average τc increases: for NiO4, τc is as large as 28.2 ± 0.0 ms, and for NiO5 the collection time has increased to 30.3 ± 14.6 ms. The τc thus increases as more NiO layers are applied, but τn remains relatively constant. The overall result is a decline in the charge collection efficiency with more NiO layers.
These time constants and charge collection efficiencies are in line with earlier reports on the charge dynamics of similar p-DSSCs.28,31,32,52,67,71–75 However, the results stand in strong contrast with the ηCC observed for n-type DSSCs, which is typically close to 1, even when relatively thick films (8 μm) of semiconductor material are used.76 This excellent charge collection efficiency in n-type DSSCs arises from a favourable τn/τc ratio, which frequently lies above 102. Interestingly, we found that τn in our p-DSSCs is close to those in n-type solar cells (0.1 vs. 0.2 s, respectively). τc, however, is an order of magnitude faster in the n-type DSSCs (10−3 s). In n-type DSSCs, the photogenerated charges are thus collected up to thirtyfold faster, even though the film thickness is at least fourfold higher. The recombination times are thus comparable to those in n-type DSSCs, whereas the τc values are remarkably slow. This slow τc causes more holes to recombine, limits ηCC, and causes the photocurrent to be more than a factor two lower, at −4.49 mA cm−2 for NiO4, compared to typical n-type DSSCs.76
The limiting factors of the p-DSSC efficiency
In summary, the solar cell efficiency, which strongly depends on the short-circuit current, showed an optimum at NiO4. With an increase in the number of NiO layers, the dye loading rises, resulting in an increased light harvesting efficiency (ηLH). The dye loading was the highest for NiO4, which could explain the high photocurrents observed for this sample group. Besides the dye loading, other factors regarding the homogeneity of the film might influence the performance of the electrode, such as the changing porosity of the bottom layers during multiple doctor blading and sintering cycles. For instance, Fig. SI-5 (ESI†) shows that the cracks in the NiO films of NiO1 and NiO2 disappear after three or more doctor-blading cycles. Furthermore, upon examination of the connection between the NiO film and the FTO surface, gaps could be observed for NiO1, NiO2 and NiO3. After four doctor-blade cycles or more, these gaps were absent. The good homogeneity of the NiO4 films, combined with appropriate connection to the FTO surface, could thus also positively influence the electrode performance.Meanwhile, the charge collection efficiency (ηCC) steadily dropped as the NiO film thickness increased, due to the longer hole diffusion length. The relatively long hole diffusion time of NiO caused more holes to recombine as the hole diffusion length increased. Therefore, the low ηCC, caused by slow hole collection and an unfavourable hole diffusion–recombination ratio, currently limits the photocurrent of the NiO photocathode in this benchmark P1-sensitized p-DSSC.
Furthermore, the efficiency of our DSSCs is also limited by the low VOC, which is determined by the difference in energy between the NiO valence band and the I−/I3− redox potential. With the NiO electrode preparation optimized, further improvement in the efficiency should be achieved by (1) shortening the hole collection time by increasing the hole diffusion rate constant, (2) using dyes that absorb a broader part of the solar spectrum, (3) increasing the VOC by adjusting the potential of the redox mediator,77 and (4) implementing strategies that lead to active charge separation in these devices, as also described in the introduction.6–9
Conclusions and outlook
To find out how NiO photocathodes are limiting the efficiency of dye-sensitized solar cells (DSSCs), we have thoroughly characterized the properties of the benchmark P1 p-DSSCs, while varying the number of doctor-bladed NiO layers. Analysis of the J–V curves showed that the most efficient solar cells were obtained with four layers of NiO (NiO4) on FTO. The DSSC efficiency showed a linear relation with the short-circuit current density; the higher the JSC, the higher the efficiency. Partially in line with the trend observed for the JSC, the light harvesting efficiency (ηLH) increased with the NiO film thickness, and reached a maximum at NiO4. The trend in JSC could be further explained by the charge collection efficiency (ηCC), which decreased as more layers of NiO were applied in the device. Thicker NiO films resulted in impeded hole diffusion, while the hole recombination time remained unaffected. Therefore, the optimum in solar cell efficiency at NiO4 is the result of an increasing ηLH as more NiO layers are applied, but a decreasing ηCC, which limits the average solar cell efficiency of this benchmark system to a maximum of 0.134 ± 0.049%.Future efforts could focus on improving the ηCC by increasing the hole lifetime or by decreasing the hole collection time. Several strategies have been reported to lower charge recombination,9,28,32,78 including rational design of the dye and redox mediator to impose electronic repulsion between the reduced electrolyte and the dye. Furthermore, the hole transfer time could be decreased by the incorporation of conductive materials,79,80 such as Ni–NiO core–shell structures. This latter concept is currently under investigation in our groups.
Author contributions
J. R. and M. B. conceived the project and designed the experiments. K. Z. carried out scanning electron microscopy imaging, supervised by A. H. O. L. determined the film thickness of the NiO films, supervised by S. T. M. B. prepared the electrodes, solar cells, analysed the data and wrote the manuscript, under supervision of J. R. All authors discussed the results and commented on the manuscript.Data availability
The data supporting this article have been included as part of the ESI.†Conflicts of interest
There are no conflicts to declare.Acknowledgements
This work is part of the Advanced Research Center for Chemical Building Blocks, ARC CBBC, which is co-founded and co-financed by the Dutch Research Council (NWO) and the Netherlands Ministry of Economic Affairs and Climate Policy. Jaap Beerens is acknowledged for practical assistance on the profilometer measurements. We thank Dr Sonja Pullen, Dr Tessel Bouwens, Dr Tijmen Bakker and Tom Keijer, MSc. for fruitful discussions regarding this study.Notes and references
- A. Belén Muñoz-García, I. Benesperi, G. Boschloo, J. J. Concepcion, J. H. Delcamp, E. A. Gibson, G. J. Meyer, M. Pavone, H. Pettersson, A. Hagfeldt and M. Freitag, Chem. Soc. Rev., 2021, 50, 12450 RSC.
- V. Nikolaou, A. Charisiadis, G. Charalambidis, A. G. Coutsolelos and F. Odobel, J. Mater. Chem. A, 2017, 5, 21077 RSC.
- J. He, H. Lindström, A. Hagfeldt and S. E. Lindquist, J. Phys. Chem. B, 1999, 103, 8940 CrossRef CAS.
- Y. Farré, M. Raissi, A. Fihey, Y. Pellegrin, E. Blart, D. Jacquemin and F. Odobel, ChemSusChem, 2017, 10, 2618 CrossRef.
- Y. Ren, D. Zhang, J. Suo, Y. Cao, F. T. Eickemeyer, N. Vlachopoulos, S. M. Zakeeruddin, A. Hagfeldt and M. Grätzel, Nature, 2023, 613, 60 CrossRef CAS PubMed.
- E. Benazzi, J. Mallows, G. H. Summers, F. A. Black and E. A. Gibson, J. Mater. Chem. C, 2019, 7, 10409 RSC.
- K. E. Dalle, J. Warnan, J. J. Leung, B. Reuillard, I. S. Karmel and E. Reisner, Chem. Rev., 2019, 119, 2752 CrossRef CAS.
- A. Moinel, M. Brochnow, C. Aumaître, E. Giannoudis, J. Fize, C. Saint-Pierre, J. Pécaut, P. Maldivi, V. Artero, R. Demadrille and M. Chavarot-Kerlidou, Sustainable Energy Fuels, 2022, 6, 3565 RSC.
- T. Bouwens, T. M. A. Bakker, K. Zhu, J. Hasenack, M. Dieperink, A. M. Brouwer, A. Huijser, S. Mathew and J. N. H. Reek, Nat. Chem., 2023, 15, 213 CrossRef CAS PubMed.
- S. Wrede and H. Tian, Phys. Chem. Chem. Phys., 2020, 22, 13850 RSC.
- D. Xiong, Z. Xu, X. Zeng, W. Zhang, W. Chen, X. Xu, M. Wang and Y. B. Cheng, J. Mater. Chem., 2012, 22, 24760 CAS.
- Z. Yu, I. R. Perera, T. Daeneke, S. Makuta, Y. Tachibana, J. J. Jasieniak, A. Mishra, P. Bäuerle, L. Spiccia and U. Bach, NPG Asia Mater., 2016, 8, e305 CrossRef.
- Z. Huang, M. He, M. Yu, K. Click, D. Beauchamp and Y. Wu, Angew. Chem., Int. Ed., 2015, 54, 6857 CrossRef CAS PubMed.
- C. J. Wood, G. H. Summers, C. A. Clark, N. Kaeffer, M. Braeutigam, L. R. Carbone, L. D’Amario, K. Fan, Y. Farré, S. Narbey, F. Oswald, L. A. Stevens, C. D. J. Parmenter, M. W. Fay, A. La Torre, C. E. Snape, B. Dietzek, D. Dini, L. Hammarström, Y. Pellegrin, F. Odobel, L. Sun, V. Artero and E. A. Gibson, Phys. Chem. Chem. Phys., 2016, 18, 10727 RSC.
- D. Dini, Y. Halpin, J. G. Vos and E. A. Gibson, Coord. Chem. Rev., 2015, 304–305, 179 CrossRef CAS.
- M. Bonomo, G. Naponiello, I. Venditti, V. Zardetto, A. Di Carlo and D. Dini, J. Electrochem. Soc., 2017, 164, H137 CrossRef CAS.
- K. S. Keremane, Y. Pellegrin, A. Planchat, D. Jacquemin, F. Odobel and A. Vasudeva Adhikari, J. Phys. Chem. C, 2022, 126, 12383 CrossRef CAS.
- C. Y. Lin, J. Y. Lin, C. C. Wan and T. C. Wei, Electrochim. Acta, 2011, 56, 1941 CrossRef CAS.
- D. F. Bruggeman, T. M. A. Bakker, S. Mathew and J. N. H. Reek, Chem. – Eur. J., 2021, 27, 218 CrossRef CAS.
- L. Li, E. A. Gibson, P. Qin, G. Boschloo, M. Gorlov, A. Hagfeldt and L. Sun, Adv. Mater., 2010, 22, 1759 CrossRef CAS.
- F. Wu, L. Zhu, S. Zhao, Q. Song and C. Yang, Dyes Pigm., 2016, 124, 93 CAS.
- Y. Hao, C. J. Wood, C. A. Clark, J. A. Calladine, R. Horvath, M. W. D. Hanson-Heine, X.-Z. Sun, I. P. Clark, M. Towrie, M. W. George, X. Yang, L. Sun and E. A. Gibson, Dalton Trans., 2016, 45, 7708 RSC.
- L. Zhu, H. B. Yang, C. Zhong and C. M. Li, Dyes Pigm., 2014, 105, 97 CrossRef CAS.
- F. A. Black, C. A. Clark, G. H. Summers, I. P. Clark, M. Towrie, T. Penfold, M. W. George and E. A. Gibson, Phys. Chem. Chem. Phys., 2017, 19, 7877 RSC.
- P. Qin, J. Wiberg, E. A. Gibson, M. Linder, L. Li, T. Brinck, A. Hagfeldt, B. Albinsson and L. Sun, J. Phys. Chem. C, 2010, 114, 4738 CAS.
- L. Tian, T. Törndahl, J. Lin, P. B. Pati, Z. Zhang, T. Kubart, Y. Hao, J. Sun, G. Boschloo and H. Tian, J. Phys. Chem. C, 2019, 123, 26151 CrossRef CAS.
- L. D’Amario, G. Boschloo, A. Hagfeldt and L. Hammarström, J. Phys. Chem. C, 2014, 118, 19556 CrossRef.
- Q. Liu, L. Wei, S. Yuan, X. Ren, Y. Zhao, Z. Wang, M. Zhang, L. Shi and D. Li, J. Mater. Sci., 2015, 50, 6668 CrossRef CAS.
- L. Wei, L. Jiang, S. Yuan, X. Ren, Y. Zhao, Z. Wang, M. Zhang, L. Shi and D. Li, Electrochim. Acta, 2016, 188, 309 CrossRef CAS.
- M. Zannotti, E. Benazzi, L. A. Stevens, M. Minicucci, L. Bruce, C. E. Snape, E. A. Gibson and R. Giovannetti, ACS Appl. Energy Mater., 2019, 2, 7345 CrossRef CAS.
- Z. Huang, G. Natu, Z. Ji, M. He, M. Yu and Y. Wu, J. Phys. Chem. C, 2012, 116, 26239 CrossRef CAS.
- E. A. Gibson, A. L. Smeigh, L. Le Pleux, L. Hammarström, F. Odobel, G. Boschloo and A. Hagfeldt, J. Phys. Chem. C, 2011, 115, 9772 CrossRef CAS.
- E. A. Gibson, L. Le Pleux, J. Fortage, Y. Pellegrin, E. Blart, F. Odobel, A. Hagfeldt and G. Boschloo, Langmuir, 2012, 28, 6485 CrossRef CAS.
- K. A. Click, D. R. Beauchamp, B. R. Garrett, Z. Huang, C. M. Hadad and Y. Wu, Phys. Chem. Chem. Phys., 2014, 16, 26103 RSC.
- S. Sumikura, S. Mori, S. Shimizu, H. Usami and E. Suzuki, J. Photochem. Photobiol., A, 2008, 199, 1 CrossRef CAS.
- R. Brisse, R. Faddoul, T. Bourgeteau, D. Tondelier, J. Leroy, S. Campidelli, T. Berthelot, B. Geffroy and B. Jousselme, ACS Appl. Mater. Interfaces, 2017, 9, 2369 CrossRef CAS PubMed.
- A. J. Frank, N. Kopidakis and J. van de Lagemaat, Coord. Chem. Rev., 2004, 248, 1165 CrossRef CAS.
- X. Y. Yu, J. Y. Liao, K. Q. Qiu, D. B. Kuang and C. Y. Su, ACS Nano, 2011, 5, 9494 CrossRef CAS.
- M. Raïssi, Y. Pellegrin, F. X. Lefevre, M. Boujtita, D. Rousseau, T. Berthelot and F. Odobel, Sol. Energy, 2020, 199, 92 CrossRef.
- R. Kern, R. Sastrawan, J. Ferber, R. Stangl and J. Luther, Electrochim. Acta, 2002, 47, 4213 CrossRef CAS.
- Q. Wang, J.-E. Moser and M. Grätzel, J. Phys. Chem. B, 2005, 109, 14945 CrossRef CAS PubMed.
- C. Richter, M. Beu and D. Schlettwein, Phys. Chem. Chem. Phys., 2015, 17, 1883 RSC.
- X. Miao, K. Pan, Y. Liao, W. Zhou, Q. Pan, G. Tian and G. Wang, J. Mater. Chem. A, 2013, 1, 9853 RSC.
- G. Schlichthörl, N. G. Park and A. J. Frank, J. Phys. Chem. B, 1999, 103, 782 CrossRef.
- L. M. Peter and K. G. U. Wijayantha, Electrochim. Acta, 2000, 45, 4543 CrossRef CAS.
- L. M. Peter, Chem. Rev., 1990, 90, 753 CrossRef CAS.
- L. Dloczik, O. Ileperuma, I. Lauermann, L. M. Peter, E. A. Ponomarev, G. Redmond, N. J. Shaw and I. Uhlendorf, J. Phys. Chem. B, 1997, 101, 10281 CrossRef CAS.
- G. Franco, J. Gehring, L. M. Peter, E. A. Ponomarev and I. Uhlendorf, J. Phys. Chem. B, 1999, 103, 692 CrossRef CAS.
- J. van de Lagemaat and A. J. Frank, J. Phys. Chem. B, 2000, 104, 4292 CrossRef CAS.
- J. Halme, Phys. Chem. Chem. Phys., 2011, 13, 12435 RSC.
- T. Oekermann, D. Zhang, T. Yoshida and H. Minoura, J. Phys. Chem. B, 2004, 108, 2227 CrossRef CAS.
- Z. Huang, G. Natu, Z. Ji, P. Hasin and Y. Wu, J. Phys. Chem. C, 2011, 115, 25109 CrossRef CAS.
- M. Bonomo, D. Di Girolamo, M. Piccinni, D. P. Dowling and D. Dini, Nanomaterials, 2020, 10, 1 CrossRef PubMed.
- S. Lyu, J. Massin, M. Pavone, A. B. Muñoz-García, C. Labrugère, T. Toupance, M. Chavarot-Kerlidou, V. Artero and C. Olivier, ACS Appl. Energy Mater., 2019, 2, 4971 CrossRef CAS.
- D. Ameline, S. Diring, Y. Farre, Y. Pellegrin, G. Naponiello, E. Blart, B. Charrier, D. Dini, D. Jacquemin and F. Odobel, RSC Adv., 2015, 5, 85530 RSC.
- P. Qin, H. Zhu, T. Edvinsson, G. Boschloo, A. Hagfeldt and L. Sun, J. Am. Chem. Soc., 2008, 130, 8570 CrossRef CAS.
- L. Zhu, H. Yang, C. Zhong and C. M. Li, Chem. – Asian J., 2012, 7, 2791 CrossRef CAS PubMed.
- M. Bonomo, D. Di Girolamo, M. Piccinni, D. P. Dowling and D. Dini, Nanomaterials, 2020, 10, 1 CrossRef.
- J. Cui, J. Lu, X. Xu, K. Cao, Z. Wang, G. Alemu, H. Yuang, Y. Shen, J. Xu, Y. Cheng and M. Wang, J. Phys. Chem. C, 2014, 118, 16433 CrossRef CAS.
- M. Bonomo, D. Gatti, C. Barolo and D. Dini, Coatings, 2018, 8, 232 CrossRef.
- C.-H. Chang, Y.-C. Chen, C.-Y. Hsu, H.-H. Chou and J. T. Lin, Org. Lett., 2012, 14, 4726 CrossRef CAS.
- T. Daeneke, Z. Yu, G. P. Lee, D. Fu, N. W. Duffy, S. Makuta, Y. Tachibana, L. Spiccia, A. Mishra, P. Bäuerle and U. Bach, Adv. Energy Mater., 2015, 5, 1401387 CrossRef.
- K. Zhu, N. R. Neale, A. Miedaner and A. J. Frank, Nano Lett., 2007, 7, 69 CrossRef CAS PubMed.
- M. K. Nazeeruddin, A. Kay, I. Rodicio, R. Humphry-Baker, E. Müller, P. Liska, N. Vlachopoulos and M. Grätzel, J. Am. Chem. Soc., 1993, 115, 6382 CrossRef CAS.
- J. Bisquert and F. Fabregat-santiago, J. Phys. Chem. C, 2009, 113, 17278 CrossRef CAS.
- R. Wang, Y. Kuwahara, K. Mori, C. Louis, Y. Bu and H. Yamashita, J. Mater. Chem. A, 2020, 8, 21613 RSC.
- Z. Hongjun, A. Hagfeldt and G. Boschloo, J. Phys. Chem. C, 2007, 111, 17455 CrossRef.
- D. Klotz, D. S. Ellis, H. Dotan and A. Rothschild, Phys. Chem. Chem. Phys., 2016, 18, 23438 RSC.
- X. L. Zhang, Z. Zhang, F. Huang, P. Bäuerle, U. Bach and Y.-B. Cheng, J. Mater. Chem., 2012, 22, 7005 RSC.
- P. A. DeSario, J. J. Pietron, D. H. Taffa, R. Compton, S. Schünemann, R. Marschall, T. H. Brintlinger, R. M. Stroud, M. Wark, J. C. Owrutsky and D. R. Rolison, J. Phys. Chem. C, 2015, 119, 17529 CrossRef CAS.
- L. D’Amario, R. Jiang, U. B. Cappel, E. A. Gibson, G. Boschloo, H. Rensmo, L. Sun, L. Hammarström and H. Tian, ACS Appl. Mater. Interfaces, 2017, 9, 33470 CrossRef PubMed.
- G. Natu, P. Hasin, Z. Huang, Z. Ji, M. He and Y. Wu, ACS Appl. Mater. Interfaces, 2012, 4, 5922 CrossRef CAS.
- Z. Liu, D. Xiong, X. Xu, Q. Arooj, H. Wang, L. Yin, W. Li, H. Wu, Z. Zhao, W. Chen, M. Wang, F. Wang, Y.-B. Cheng and H. He, ACS Appl. Mater. Interfaces, 2014, 6, 3448 CrossRef CAS PubMed.
- I. Hod, Z. Tachan, M. Shalom and A. Zaban, Phys. Chem. Chem. Phys., 2013, 15, 6339 RSC.
- L. Le Pleux, A. L. Smeigh, E. Gibson, Y. Pellegrin, E. Blart, G. Boschloo, A. Hagfeldt, L. Hammarström and F. Odobel, Energy Environ. Sci., 2011, 4, 2075 RSC.
- J. van de Lagemaat, N. G. Park and A. J. Frank, J. Phys. Chem. B, 2000, 104, 2044 CrossRef CAS.
- D. Zhang, M. Stojanovic, Y. Ren, Y. Cao, F. T. Eickemeyer, E. Socie, N. Vlachopoulos, J.-E. Moser, S. M. Zakeeruddin, A. Hagfeldt and M. Grätzel, Nat. Commun., 2021, 12, 1777 CrossRef CAS.
- L. Favereau, Y. Pellegrin, L. Hirsch, A. Renaud, A. Planchat, E. Blart, G. Louarn, L. Cario, S. Jobic, M. Boujtita and F. Odobel, Adv. Energy Mater., 2017, 7, 1601776 CrossRef.
- M. Zhu, X. Li, W. Liu and Y. Cui, J. Power Sources, 2014, 262, 349 CrossRef CAS.
- S. Hyung Kang, N. R. Neale, K. Zhu, A. F. Halverson, Y. Yan and A. J. Frank, RSC Adv., 2013, 3, 13342 RSC.
Footnote |
| † Electronic supplementary information (ESI) available. See DOI: https://doi.org/10.1039/d4ya00271g |
| This journal is © The Royal Society of Chemistry 2024 |