 Open Access Article
Tuning the ion conductivity of Zr-based metal–organic framework ionogels by linker functionalization†
Antonija
Ferbezar
a,
Roman
Zettl
 a,
Katharina
Hogrefe
a,
Harald
Fitzek
b,
Bernhard
Gadermaier
a,
Katharina
Hogrefe
a,
Harald
Fitzek
b,
Bernhard
Gadermaier
 a,
H. Martin R.
Wilkening
 ac and
Ilie
Hanzu
 *ac
*ac
aInstitute of Chemistry and Technology of Materials, Graz University of Technology (NAWI Graz), Stremayrgasse 9, 8010 Graz, Austria. E-mail: hanzu@tugraz.at
bGraz Centre for Electron Microscopy (FELMI-ZFE), Steyrergasse 17, 8010 Graz, Austria
cAlistore – ERI European Research Institute, CNRS FR3104, Hub de l’Energie, Rue Baudelocque, F-80039 Amiens, France
First published on 19th April 2024
Abstract
Solid-state ion conductors have improved significantly in the past decade. Envisioned applications range from metal anode batteries and fuel cells to sensors and medical technologies. The choice of solid electrolytes is, however, relatively limited and it remains challenging to find new systems that can be tuned and processed easily. Here, we investigate solid ion conductors based on the UiO-66 metal–organic framework (MOF) structure. Three synergistic approaches are used for the realization of MOF-based solid ion conductors: post-synthetic modifications by lithium alkoxide grafting on the [Zr6O4(OH)4]12+ cluster site, the use of alternate linkers with additional functionality and the incorporation of an ionic liquid in the porous structure that leads to the formation of an ionogel. Depending on the exact configuration and composition used, the overall ionic conductivity can be improved by up to 6 orders of magnitude. Our results show that MOF-based ion conductors are complex systems in which several ions, such as Li+, protons and ionic liquids species, are the mobile charge carriers. Establishing the ionic species responsible for conduction constitutes one of the aims of this investigation. For instance, high total ionic conductivities of up to 0.5 mS cm−1 at 293 K are recorded, with protons likely having a major contribution. Thus, our work demonstrates the versatility of the MOF-based solid ion conductors and opens the path towards advanced electrochemical applications.
Introduction
Significant research efforts were dedicated over the past few years to solid-state batteries (SSBs) and solid electrolytes; the interest in this research area continues to grow. Batteries equipped with solid electrolytes are expected to enable the use of metallic lithium in advanced batteries, a breakthrough that could not be achieved so far with liquid electrolytes, in spite of more than 40 years of research.1 The use of lithium anodes is seen as a key requirement for next generation batteries with high specific energy for the automotive industry. Solid electrolytes act as both the separator and the electrolyte in SSBs. They may improve safety for applications such as electric vehicles, especially at elevated temperatures.2 Despite all the advantages, SSBs would require significant improvements before becoming the ideal battery for automotive or large-scale stationary applications. The difficulty in finding fast ion conductors showing a good interface compatibility with the electrodes limits the battery performance in terms of cycle life and capacity.2,3A successful compromise between liquid and solid electrolytes is offered by the class of quasi-solid electrolytes, namely ionogel electrolytes.4 Ionogels are a new group of hybrid materials, consisting of an ionic liquid (IL) immobilized in a solid structure. Ionic liquids are salts whose melting points are below 100 °C. They typically consist of large organic cations and smaller inorganic or organic anions. The composition of ionic liquids may vary significantly and consequently, their physical and chemical properties such as polarity, density, viscosity, and thermal and chemical stability may also vary as well. Ionic liquids are non-flammable and thermally stable, and they show high ion conductivity and have a reasonable electrochemical potential window. Nevertheless, if ionic liquids alone are used as electrolytes, similar risks as with liquid electrolytes, such as leakage, dendrite growth and short circuits cannot be avoided.
Depending on the solid component, ionogel electrolytes can be divided into polymeric materials and inorganic materials, such as non-metal oxides,5 metal oxides,6,7 ionic liquid-tethered nanoparticles8 and metal–organic frameworks.4,9–11 A critical overview of organic polymer matrices for battery applications was given by Osada et al.12 Here, instead of using a classical polymer, we investigate metal–organic frameworks serving as a porous non-conductive solid-state matrix for the immobilization of ionic liquids.
Metal–organic frameworks (MOFs) are a class of synthetic porous materials, also called coordination polymers, that have been investigated in the past few decades for applications ranging from gas separation and adsorption properties to catalysis and bio-catalysis by sensitive enzyme encapsulation.13,14 They consist of metal ions or metal clusters which are connected by multi-dentate organic linkers. The inorganic and organic building blocks crystallize into a three-dimensional network, whose structure, geometry and properties may vary depending on the preparation method.
A special property of MOFs is the pores, which can vary in size and functionality on modifying the organic linkers. Thanks to their porous nature, MOFs have an extraordinarily high specific surface area.15 Therefore, MOFs are able to host small molecules in the pores and are very well suited for storage, transport and separation of gases, catalysis and drug delivery; for example. MOFs were also proposed for application as solid electrolytes in batteries.16–18 The use of MOFs impregnated with ionic liquids as solid electrolytes is, however, a very recent development.19–21
In this work, a new win–win combination of solid and liquid ion conductors is investigated and demonstrated as a solid-state ion conductor. This material consists of a highly conductive ionic liquid embedded in a thermally and mechanically stable lithium alkoxide-grafted MOF. We focus on the influence of the MOF linker on electric conductivity and ion transport properties of the considered ionogels, and we carefully conduct an electrical relaxation study. In order to establish structural details and study ion dynamics, the materials were investigated by Fourier transform infrared spectroscopy (FTIR), conductivity spectroscopy and nuclear magnetic resonance (NMR) techniques. In addition to establishing the ion conduction properties and trends, we also reveal in this report the nature of mobile ionic species.
Results and discussion
Structure and conductivity of ionogels
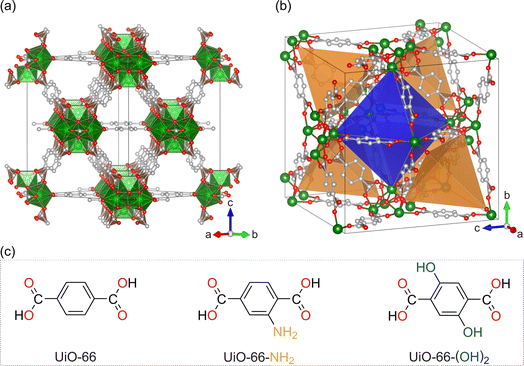
The structural model of the MOFs belonging to the UiO-66 family is presented in Fig. 1. We shall note that the MOFs prepared, namely UiO-66, UiO-66-NH2 and UiO-66-(OH)2, are isostructural and crystallize with a cubic symmetry (space group Fm![[3 with combining macron]](https://www.rsc.org/images/entities/char_0033_0304.gif) m). As shown in Fig. 1a and b, the UiO-66 structure presents channels with the smallest aperture of an approximate triangular shape. Also, the materials have four large octahedral cavities and eight tetrahedral cavities per unit cell. All tetrahedral cavities share a face with the octahedral cavity. Depending on the linker used, as shown in Fig. 1c, amine or hydroxyl functional groups may be lining the inner cavities of the MOFs as in the case of UiO-66-NH2 and UiO-66-(OH)2, respectively. Grafting of lithium alkoxide is likely to occur on the Zr cluster.17 The grafting site, and thus the location of lithium alkoxide, is at the inner side of the cavity apices.
m). As shown in Fig. 1a and b, the UiO-66 structure presents channels with the smallest aperture of an approximate triangular shape. Also, the materials have four large octahedral cavities and eight tetrahedral cavities per unit cell. All tetrahedral cavities share a face with the octahedral cavity. Depending on the linker used, as shown in Fig. 1c, amine or hydroxyl functional groups may be lining the inner cavities of the MOFs as in the case of UiO-66-NH2 and UiO-66-(OH)2, respectively. Grafting of lithium alkoxide is likely to occur on the Zr cluster.17 The grafting site, and thus the location of lithium alkoxide, is at the inner side of the cavity apices.
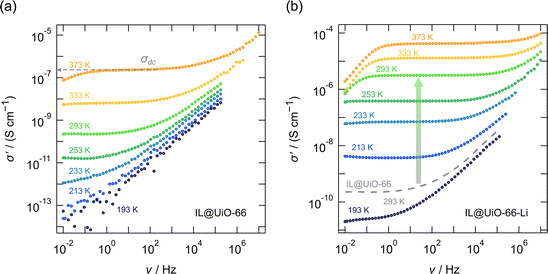
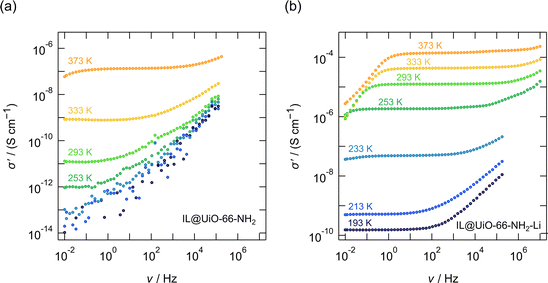
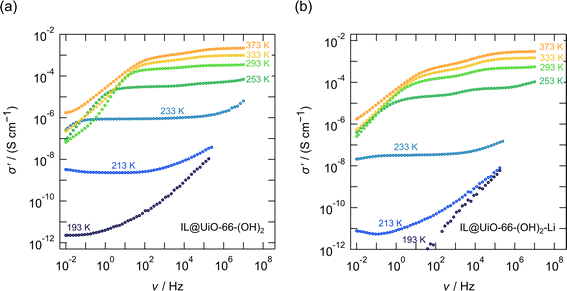
In Fig. 2 and 3, as well as in Fig. 6 the conductivity isotherms σ′(ν) of the investigated MOF ion conductors are shown. Each figure allows a direct comparison between reference MOF ionogels that contained no lithium, and MOF ion conductors that were grafted with lithium 3-methyl-3-pentoxide to which EMIM-FSI ionic liquid was added. There is clear proof of ion transport in all the samples, as shown for instance in Fig. 2b and 3b; see Table 3 for the compositions and the abbreviations of sample names used.
In order to investigate the influence of the grafted lithium alkoxide, that is, lithium 3-methyl-3-pentoxide, on the conductivity of the ionogel, an additional measurement was carried out on a reference ionogel prepared by embedding the ionic liquid EMIM-FSI into the activated pristine UiO-66 structure that was not grafted with lithium alkoxide. We see in Fig. 2a that the conductivity σdc(ν → 0) of the pure UiO-66 MOF sample, which contains 30 wt% ionic liquid only, is generally poor. At 293 K the overall conductivity of IL@UiO-66 turned out to be only 2.2 × 10⁻¹⁰ S cm−1. Indeed, the only mobile charge carriers are the EMIM+ and FSI− species, although mobile, long range transport of ionic liquid species alone is poor in this material.
The situation changes significantly for the lithium alkoxide grafted MOF, namely UiO-66-Li. Adding the same amount of EMIM-FSI ionic liquid improves the conductivity by more than 4 orders of magnitude to 3.2 × 10⁻⁶ S cm−1. Conductivities in the order of μS cm−1, at 293 K, may still be considered poor. The significant improvement shows, however, the validity of the lithium alkoxide grafting concept. Most likely, the small Li+ ions in the material are relatively mobile. They seem to dominate the overall ionic conductivity in IL@UiO-66-Li.
The same investigation was conducted on the UiO-66-NH2 MOF, featuring the 2-amino-terephthalic linker. The results are shown in Fig. 3. The conductivity of IL@UiO-66-NH2, where only the EMIM-FSI ionic liquid may provide mobile ionic species, is poorer than that of the IL@UiO-66 analogue. At 293 K the conductivity of IL@UiO-66-NH2 is 1.2 × 10⁻¹¹ S cm−1 which is one order of magnitude lower than that of IL@UiO-66. Probably, this decrease can be explained if we consider the interaction of the FSI− anion with the protons of the amine group of the linker. Nevertheless, the conductivity of Li-alkoxide grafted material (i.e. IL@UiO-66-NH2-Li) increases significantly to 1.25 × 10⁻⁵ S cm−1 at 293 K, which is 6 orders of magnitude higher than the conductivity of IL@UiO-66-NH2.
Ionic liquid–MOF interactions
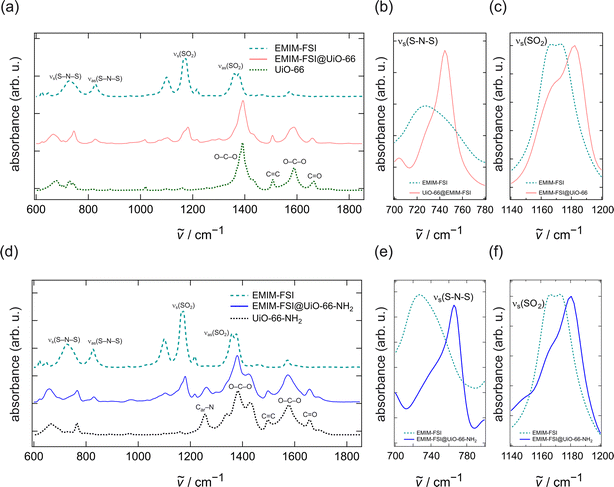
We investigated the interactions between the ionic liquid species and the MOFs by Fourier transform infrared (FTIR) spectroscopy measured in the attenuated total reflection (ATR) configuration. The results are shown in Fig. 4.UiO-66 shows strong bands at 1390 and 1580 cm−1, which are attributed to the asymmetric and the symmetric stretching vibrations of the O–C–O bonds in the benzene-dicarboxylic acid linker. The band at 1665 cm−1 reflects the C![[double bond, length as m-dash]](https://www.rsc.org/images/entities/char_e001.gif) O bond stretching vibrations of the linker. The weak band at 1500 cm−1 corresponds to the C
O bond stretching vibrations of the linker. The weak band at 1500 cm−1 corresponds to the C![[double bond, length as m-dash]](https://www.rsc.org/images/entities/char_e001.gif) C bond in the benzene ring. Considering the ionic liquid, the spectrum of the FSI− anion reveals (i) absorption bands at 725 and 825 cm−1 showing the symmetric and asymmetric S–N–S stretching vibrations and (ii) bands at 1165 and 1367 cm−1 corresponding to the SO2 symmetric and asymmetric stretching vibrations, respectively. Fig. 4d shows an additional absorption band at 1255 cm−1 (Car–N) originating from the amino group attached to the benzene-dicarboxylic acid linker.
C bond in the benzene ring. Considering the ionic liquid, the spectrum of the FSI− anion reveals (i) absorption bands at 725 and 825 cm−1 showing the symmetric and asymmetric S–N–S stretching vibrations and (ii) bands at 1165 and 1367 cm−1 corresponding to the SO2 symmetric and asymmetric stretching vibrations, respectively. Fig. 4d shows an additional absorption band at 1255 cm−1 (Car–N) originating from the amino group attached to the benzene-dicarboxylic acid linker.
Fig. 4a compares the FTIR–ATR spectra of pure EMIM-FSI with those of EMIM-FSI immobilized in the pores of UiO-66. The spectra of the FSI− species reveal a blue shift of the s(SO2) and s(S–N–S) vibrations, as shown in Fig. 4b and c. This shift suggests that most of the ionic liquid is located in the pores of the MOF.22 Had this not been the case, the blue shift would not have occurred, or, had the ionic liquid been only partially adsorbed, some of the original signal would remain unchanged. While we cannot eliminate the possibility of having some ionic liquid on the surface of MOF particles, these results show a strong interaction between the FSI− anion and the MOF structure, very likely with the Zr-cluster of the UiO-66 structure.
With respect to the pure ionic liquid spectrum, the FTIR spectrum of the IL@UiO-66-NH2 ionogel also shows a shift of the s(S–N–S) and s(SO)2 vibrations towards higher wave numbers. The blue shift of the relevant bands proves the confinement of the ionic liquid in the pores of UiO-66 and UiO-66-NH2 as well as the successful synthesis of the ionogel.
In addition, we note that the blue shift of the S–N–S vibration of the FSI− anion that is confined in the UiO-66-NH2 structure is larger than the blue shift of FSI− being confined in a simple UiO-66 framework. Indeed, for pure EMIM-FSI, the S–N–S vibration is centred at 727.1 cm−1. It shifts to a wave number of 744.5 cm−1 for the IL@UiO-66 sample and to 765.7 cm−1 for the IL@UiO-66-NH2 sample. These changes constitute direct proof of the stronger interaction of the ionic liquid with the amine-functionalized MOF.
Since the anions have stronger interactions with the amine-functionalized framework that contains them, anion mobility is reduced. Consequently, the overall conductivity of IL@UiO-66-NH2 is lower than the conductivity of IL@UiO-66, as confirmed experimentally and shown in Fig. 2a and 3a and the related discussion on ionic conductivity.
Interestingly, while the conductivity, σdc of the IL@UiO-66-NH2 material degrades with respect to that of the IL@UiO-66 sample, the opposite trend is seen for the lithiated, Li-alkoxide grafted materials. Indeed, the conductivity of IL@UiO-66-NH2-Li is 1.25 × 10⁻⁵ S cm−1 at 293 K which is 6 orders of magnitude higher than the conductivity of IL@UiO-66-NH2 and one order of magnitude higher than that of IL@UiO-66-Li, which is the compound that does not present the amine-functionalized linker.
Li+ ion dynamics
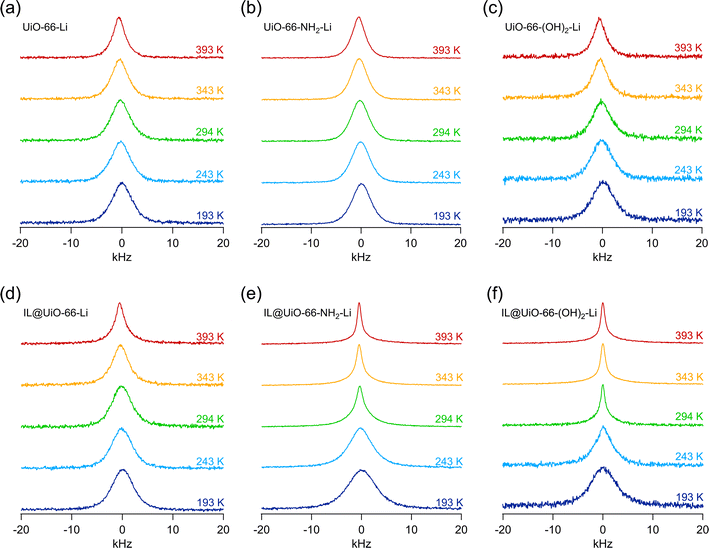
As the difference in ionic conductivity might be related to a difference in diffusivity of Li+, we carried out nuclear magnetic resonance (NMR) measurements. It is well known that the 7Li NMR line width correlates with the temperature dependent diffusivity of the lithium ions in the material.23 The narrower the 7Li NMR line, the more effectively the Li+ exchange processes are able to average the various homonuclear and heteronuclear interactions causing broad NMR lines at low temperatures. Motional narrowing of the NMR line can be used to estimate the mean Li+ jump rates.24,25Variable-temperature 7Li NMR lines measured at temperatures ranging from 193 K to 393 K are shown in Fig. 5. For the materials that do not contain any ionic liquid, as shown in Fig. 5a–c, the 7Li NMR lines show little narrowing, if any, with increasing temperature. This result indicates that in the pure lithium alkoxide grafted materials Li+ dynamics are rather poor on the NMR time scale in this temperature range. It is very likely that the adjacent Li+ sites are separated by a high potential energy barrier. Indeed, in the structure of the UiO-66 MOFs, the Zr-clusters are separated by large, empty cavities, as shown in Fig. 1a and b. Thus, the exchange of Li+ in the structure of pure grafted MOFs is very likely hindered and the distance between adjacent Li+ positions is large, leading to a low probability of successful Li+ jump processes. While the exact cause of slow Li+ transport in pure lithium alkoxide grafted materials exceeds the scope of this investigation, it is certain that these materials are very poor Li+ conductors, as shown in Fig. S4.†
The situation changes significantly when ionic liquid guest species, in this case EMIM-FSI, are incorporated into the pores of the grafted MOFs. In two out of three cases, significant motional narrowing of the 7Li NMR lines takes place with increasing temperature, as shown in Fig. 5d–f, see and compare the 7Li NMR lines of IL@UiO-66-NH2-Li and IL@UiO-66-(OH)2-Li recorded at T = 294 K with that of IL@UiO-66-Li. For the IL@UiO-66-NH2-Li and IL@UiO-66-(OH)2-Li samples, there is a significant improvement of Li+ jump rates at room temperature and above. The increase in Li+ jump rates as directly seen by 7Li NMR is caused by the presence of the EMIM-FSI guest species in the pores that very likely enables better Li+ transport.
We can imagine at least two mechanisms rationalizing the increase in the Li+ jump rate in the presence of guest EMIM-FSI ionic liquid species. First, EMIM-FSI may provide new paths for ion motion. Indeed, the presence of an ionic liquid species in the MOF cavities and channels will, more likely than not, modify the potential energy landscape of the MOF internal surface, possibly enabling ion jumps that were only occurring with a low probability within the empty UiO-66 structure. Second, the FSI− anions are expected to strongly interact with the Li+ species in an electrostatic manner. A dynamic equilibrium between the Li+ bonded to the MOF and the Li+ bonded to the ionic liquid species is likely to be established. Considering that the Li–FSI ionic associates are electrically neutral and free to move, it is not surprising that Li+ may be rendered more mobile by including an ionic liquid species in the pores of the MOF. Thus, a vehicular Li+ transport, with the guest FSI− species being the vehicle, might be responsible for the increase in both ionic conductivity and Li+ jump rates as probed by NMR.
The case of IL@UiO-66-Li and UiO-66-Li is peculiar. Because there is no significant difference between these two samples with respect to the width of 7Li NMR lines, we can conclude that in both cases the Li+ jump rates are lower than that in the rigid lattice regime, which corresponds to a fully broadened NMR line. The presence of ionic liquid does not appear to significantly influence the Li+ jump rates. We shall, however, note that the IL@UiO-66-Li material has the lowest Arrhenius pre-exponential factor (σ0) in the high temperature domain, as shown in Table 1. The pre-exponential factor corresponds to the intercept of the linear Arrhenius line with the vertical axis, as shown in Fig. 8a. The σ0 pre-factor includes several parameters such as the attempt frequency of the ion jump but also a migration entropy term and ion transport correlation effects. Of course, at any measured temperature, the effective ion jump rate is much smaller than what would correspond to σ0; only a few of the jump attempts are successful.
| Sample | σ dc/S cm−1 (293 K) | σ dc/S cm−1 (373 K) | log10[σ0/S cm−1] (high T) | log10[σ0/S cm−1] (low T) |
|---|---|---|---|---|
| UiO-66-Li | 9.34 × 10⁻¹² | 1.60 × 10⁻⁷ | 11.2(4) | — |
| UiO-66-NH2-Li | 4.95 × 10⁻⁹ | 5.21 × 10⁻⁶ | 10.3(3) | — |
| IL@UiO-66-(OH)2 | 3.43 × 10⁻⁴ | 2.12 × 10⁻³ | 3.0(1) | 21.8(1.2) |
| IL@UiO-66-Li | 3.15 × 10⁻⁶ | 4.28 × 10⁻⁵ | 2.8(2) | 12.5(1.7) |
| IL@UiO-66-NH2-Li | 1.25 × 10⁻⁵ | 1.43 × 10⁻⁴ | 3.0(2) | 16.0(2) |
| IL@UiO-66-(OH)2-Li | 5.08 × 10⁻⁴ | 2.94 × 10⁻³ | 4.0(3) | 35.5(1) |
Ion conduction involves both short range and long range ion transport. By AC impedance measurements, long range ion transport is usually probed, while NMR is also sensitive to short range transport. For instance, in the studied materials, we may have faster ion transport within the cavities of the MOFs, which would be observed in NMR as an ion jump. In the same time, there could be much slower ion transport between adjacent MOF cavities and thus a slower long range transport appearing as a lower AC conductivity. If after the inclusion of ionic liquid guest species, the rate limiting step of long range Li+ transport is still given by the slow ion transport between cavities and if jump rates within the cavity are only little influenced by the ionic liquid guest molecules, it is possible to see only a marginal change in ionic jump rates by NMR. While the above results point towards complex ion dynamics in MOF ion conductor materials, a more detailed understanding of the described effects would require a dedicated NMR relaxometry study.
Proton ion conduction
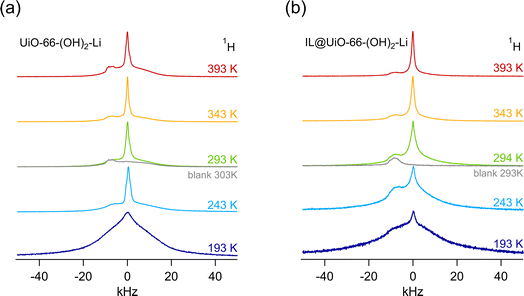
The case of the di-hydroxy functionalized linker is in turn different from both preceding cases, as shown in Fig. 6. First, we note that the conductivity of IL@UiO-66-(OH)2 is the highest among the three investigated samples; at 293 K a conductivity of 3.4 × 10⁻⁴ S cm−1 is obtained. This behaviour is probably not only related to the presence of the ionic liquid, and it is very likely that there are other mobile ionic species, such as protons, that participate in ionic conduction. We may recall that the protons on the hydroxy functional groups have an acidic character and the high conductivity might not necessarily be related to the transport of ionic liquid species, but likely to the transport of protons, for which we may expect a much higher mobility.In addition, we see that in this case, there is not much improvement in conductivity when a lithium alkoxide grafted MOF is used. The improvement from 3.4 × 10⁻⁴ S cm−1 for the IL@UiO-66-(OH)2 sample to 5.1 × 10⁻⁴ S cm−1 for the IL@UiO-66-(OH)2-Li material is marginal. Because the conductivity is not influenced significantly by the presence of the Li+ species, it is likely that σdc is dominated by protons. Variable-temperature 1H NMR line width measurements do indeed confirm this assumption. As shown in Fig. 7, 1H NMR line widths are significantly narrower at higher temperatures where the highest ion conductivities are also recorded, as shown in Fig. 6. At low temperatures (193 K) the NMR spectra of both samples are composed of a broad and narrowed line. A change to a narrow NMR line occurs between 243 and 253 K, with all 1H species mobile on the NMR time scale at higher temperatures. This feature is in agreement with the kink in the Arrhenius lines, as shown in Fig. 8a. Thus, 1H NMR spectroscopy clearly identifies the protons of the hydroxyl groups on the linker as one of the main charge carriers governing the ionic conductivities in IL@UiO-66-(OH)2 and IL@UiO-66-(OH)2-Li materials. Table 2 summarizes the conductivities of the lithium containing MOF ion conductors at 293 K.
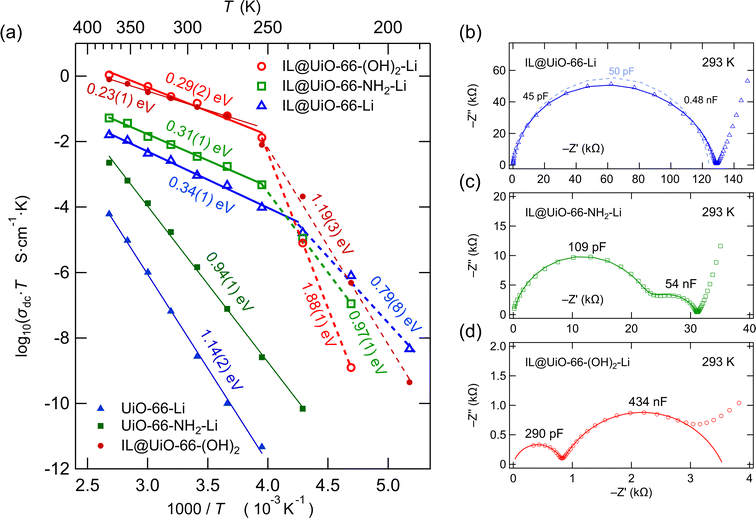 | ||
| Fig. 8 (a) Arrhenius plot showing the temperature behavior of the ionic conductivity σdc of the MOF samples. At high temperatures relatively low activation energies are found. In the low temperature regime, ion conduction is characterized by significantly higher activation energies. (b) Nyquist plot of the impedance response of the IL@UiO-66-Li sample. The dotted line is a fit with one time constant, while the solid line is a fit of the impedance data with two time constants. See the text for further explanation. (c) Nyquist plot of the impedance response of the IL@UiO-66-NH2-Li sample showing a bulk process and electrical relaxation governed by grain boundary regions. The solid line represents a simulation of the impedance response with a suitable equivalent circuit, as shown in Fig. S1 of the ESI.† (d) Nyquist plot of the impedance response of the IL@UiO-66-(OH)2-Li sample showing two distinct relaxation processes. The solid line is a simulation of the impedance data from 200 MHz to 5 Hz. See the text for further explanation. | ||
| Sample | σ dc (293 K) (S cm−1) | Bulk | Grain boundary | ||||
|---|---|---|---|---|---|---|---|
| Q b (pF sab−1) | a b | R b (kΩ) | Q gb (nF sagb−1) | a gb | R gb (kΩ) | ||
| a Fitted with one RQ unit, as shown in Fig. 8b. | |||||||
| IL@UiO-66-Li | 3.15 × 10⁻⁶ | 45 | 0.95 | 78.06 | 0.48 | 0.88 | 49.73 |
| 50a | 0.92a | 124.1a | — | — | — | ||
| IL@UiO-66-NH2-Li | 1.25 × 10⁻⁵ | 110 | 0.89 | 22.76 | 54 | 0.77 | 8.42 |
| IL@UiO-66-(OH)2-Li | 5.08 × 10⁻⁴ | 290 | 0.86 | 0.817 | 434 | 0.73 | 2.73 |
The conductivity Arrhenius plots of the lithium containing samples are shown in Fig. 8a. For all the samples we see two conduction regimes characterized by a change in activation energy with a transition temperature of around 250 K. Above the transition temperature, the materials show relatively low activation energies, ranging from 0.29(2) to 0.34(1) eV, with similar values for the three samples. At low temperatures, we observe significant differences between IL@UiO-66-(OH)2-Li and the other two lithium containing samples.
Although IL@UiO-66-Li presents a low activation energy of 0.34(1) eV, we see no significant 7Li NMR line motional narrowing. It is thus certain that charge carriers other than Li+ contribute to the σdc. While Li+ itself is almost immobile, it triggers the transport of other species, very likely the ionic liquid species. It seems that a combination of ionic liquid and Li+ species is needed to increase the σdc, although Li+ are not always the majority charge carriers in these ion conductors.
Bulk and grain boundary dielectric relaxation
We have looked into more detail on the impedance of the samples at 293 K (20 °C). As ionic conductivity at room temperature is a technologically relevant parameter, we analyzed the impedance data by constructing complex plane plots and simulated the location curves with appropriate equivalent circuits. The Nyquist plots of IL@UiO-66-Li, IL@UiO-66-NH2-Li and IL@UiO-66-(OH)2-Li are shown in Fig. 8b, c and d. In principle, ion transport in a polycrystalline material is characterized by a transport process taking place in the bulk region of the materials and a transport process taking place at the grain boundaries, where disturbance of the crystalline lattice, or the presence of a secondary (inter-) phase, may alter the ion transport properties. It is possible to distinguish between these two processes by using the capacitance values, as shown by Irvine et al.26As the pressed pellets consisted of polycrystalline MOF powder, we tried to fit the impedance data with a simple equivalent circuit consisting of two parallel RQ units connected in series, one corresponding to the bulk and the other corresponding to the grain boundary electrical relaxation processes, as shown in Fig. S1† for the equivalent circuit schematics. Table 2 lists the results of the simulations carried out.
In general, for sample pellets having a thickness in the order of 1 mm, we see capacitances in the pico-Farad range for the bulk processes, although we note that they are higher than what is usually seen in microcrystalline ceramics. Thus, we deal with values ranging from 45 to 290 pF. Here, the investigated samples are in fact nanocrystalline materials. Hence, the capacitances of the bulk processes are generally higher for nanocrystalline materials. From X-ray diffraction measurements, conducted to confirm successful MOF synthesis, we estimated the average crystallite size by using the Scherrer equation, as shown in Fig. S2 and Table S2 of the ESI.† With an average crystallite size of 45 nm, it is not surprising that the bulk electric relaxation capacitance of IL@UiO-66-Li is in the order of 45–50 pF.
For the IL@UiO-66-NH2-Li sample, although the crystallite size slightly increased to 50 nm, a more than double bulk capacitance (110 pF) is found. A key difference in this case is, however, the presence of the polar amine group on the benzene ring of the di-carboxylic acid linker. An additional polar group in the material, that is, the additional electric dipole present at the amine-substituted aromatic ring, will influence the response to the alternating electric field. The dielectric relaxation time will change, and thus, the apparent capacitance will also vary. We briefly note that the rotation of the 2-amino-benzene ring of the 2-amino-terephthalic acid around the fixed carboxylic unit bonds requires an activation energy of 53 kJ mol−1 (0.55 eV).27 The torsion of the 2-amino-benzene dipole around the fixed carboxylic units can very likely participate in capacitive energy storage and increase the bulk capacitance of the material.
In the case of IL@UiO-66-(OH)2-Li, we see a further relative increase in the bulk capacitance to 290 pF. Hydroxyl groups are polar as well and we may see a similar effect as for the amine-substituted linker. In addition, let us note that the crystallite size of UiO-66-(OH)2 is only 20 nm. As the length of one MOF cubic unit cell is slightly larger than 2 nm, the material will show properties that are determined to a larger extent by the surface states, which may also explain the high capacitance of 290 pF.
Coming back to IL@UiO-66-Li, the distinction between the bulk and the grain boundary electrical relaxation is difficult. It appears that the two processes are highly convoluted. Therefore, we tried to use a simpler equivalent circuit, consisting of a simple RQ unit, to simulate the impedance response. This model is, however, a poorer fit to the data, as shown in the dotted line in Fig. 8b. In spite of the heavily convoluted response of the IL@UiO-66-Li material, it would be highly plausible to consider bulk and grain boundary contributions in a solid polycrystalline material.
To shed more light on the impedance response of IL@UiO-66-Li and to identify the number of time constants needed to reproduce the response, we looked at the imaginary part of the electric modulus (M′′) and at the imaginary part of impedance (−Z′′) as a function of frequency. Plots of M′′(ν) and −Z′′(ν) are known to reveal small capacitive and high resistive contributions, respectively.26 Unfortunately, in the representation of the imaginary part of the electric modulus with respect to the frequency (see Fig. S3 of the ESI†) no second contribution appears, irrespective of choosing a linear (Fig. S3a†) or logarithmic (Fig. S3b†) axis scale. However, the electric modulus is known to be highly sensitive to low (bulk) capacitances, while higher capacitance contributions cannot be seen in this representation. Because the capacitance of the, so-assigned, grain boundary is approximately 10 times higher (0.48 nF) than the bulk capacitance, it is very unlikely that an effect can be seen in the modulus representation, as shown in Fig. S3 of the ESI.†
In a further attempt to distinguish between bulk and grain boundary processes, in particular for the IL@UiO-66-Li material, the real part of the relative permittivity  and the imaginary part of the impedance (−Z′′) were plotted as a function of frequency, as shown in Fig. 9. While we can clearly distinguish between the two contributions for the IL@UiO-66-NH2-Li and IL@UiO-66-(OH)2-Li materials in both representations, it is difficult to make such a distinction for IL@UiO-66-Li. Nevertheless, some very small changes in both the −Z′′ and the
  plots hint towards a grain boundary relaxation process, as shown by the gray ellipse and the vertical arrow in Fig. 9. As
  is also a measure of the material’s ability to store electrical energy, the differences are significant between bulk and grain boundary processes.
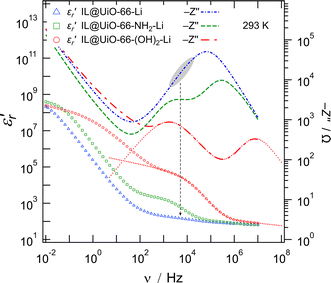 | ||
| Fig. 9 Left axis: The real part of the relative electrical permittivity of the lithium containing samples with respect to the frequency on a logarithmic scale. Right axis: The imaginary part of the impedance with a changed sign plotted against frequency on a logarithmic scale. The dotted lines represent a simulated impedance and permittivity response between 200 MHz and 5 Hz based on the fitted data shown in Fig. 8d. | ||
At the high frequency limit, these systems may display their static permittivity  , although the limited frequency range used (maximum frequency of 10 MHz) does not allow a definite statement. By extrapolating the curves up to 200 MHz, we find
  values in the order of 55–60. These values are 4 to 5 times higher than those commonly observed for ionic liquids at similar frequencies.28
Conclusions
This work demonstrates the versatility and the complexity of the ionogel systems as well as the possibility to adjust their properties by simple modifications of the MOF linkers. The conductivity of UiO-66-based ionogels varies significantly with the nature of the functional group on the aromatic ring of the MOF linker. The amine-substituted linker shows a greatly improved Li+ ionic conductivity, by 6 orders of magnitude, when lithium alkoxide was grafted on the structure. While the best conductivities are achieved with hydroxyl-functionalized linkers, protons contribute to the total ionic conductivity along lithium ions. The σdc conductivity of the hydroxyl-functionalized ionogel reaches 0.5 mS cm−1 at 298 K, albeit protons are very likely the major charge carriers. Both the Zr-cluster and the amine group interact strongly with the FSI− anion of the ionic liquid, as proven by the clearly measurable blue shifts of absorption bands in FTIR spectra. In addition, the interaction of ionic liquid with the amine-functionalized MOF seems to be stronger than that for the plain UiO-66 material. These materials and methods pave the way towards the development of high performance ionogel solid ion conductors for advanced electrochemical energy storage.Experimental
All reagents were purchased from commercial suppliers and used without further purification. The complete list of chemicals and solvents can be found in Table S1 of the ESI.†Synthesis of UiO-66, UiO-66-NH2 and UiO-66-(OH)2
UiO-66, UiO-66-NH2 and UiO-66-(OH)2 were synthesized using the same procedure, as proposed by Katz et al.15 and scaled up to 50 mL. For each MOF, a 100 mL screw-cap Duran glass bottle was used as the reaction vessel. ZrCl4 was pre-dissolved in N,N-dimethylformamide (DMF) and HCl (DMF![[thin space (1/6-em)]](https://www.rsc.org/images/entities/char_2009.gif) :
:![[thin space (1/6-em)]](https://www.rsc.org/images/entities/char_2009.gif) HCl = 5
HCl = 5![[thin space (1/6-em)]](https://www.rsc.org/images/entities/char_2009.gif) :
:![[thin space (1/6-em)]](https://www.rsc.org/images/entities/char_2009.gif) 1, volume ratio) under ultrasonic treatment for 15 minutes. The dicarboxylic acid linkers, namely benzene-dicarboxylic acid, 2-amino-benzene-dicarboxylic acid and 2,5-dihydroxy-benzene-dicarboxylic acid, were also pre-dissolved in 33.3 mL DMF in 15 minutes under ultrasonic treatment. The molar ratio in the ZrCl4
1, volume ratio) under ultrasonic treatment for 15 minutes. The dicarboxylic acid linkers, namely benzene-dicarboxylic acid, 2-amino-benzene-dicarboxylic acid and 2,5-dihydroxy-benzene-dicarboxylic acid, were also pre-dissolved in 33.3 mL DMF in 15 minutes under ultrasonic treatment. The molar ratio in the ZrCl4![[thin space (1/6-em)]](https://www.rsc.org/images/entities/char_2009.gif) :
:![[thin space (1/6-em)]](https://www.rsc.org/images/entities/char_2009.gif) linkers was 1
linkers was 1![[thin space (1/6-em)]](https://www.rsc.org/images/entities/char_2009.gif) :
:![[thin space (1/6-em)]](https://www.rsc.org/images/entities/char_2009.gif) 1.4. The reaction mixtures were sonicated for 10 minutes, and the closed bottles were placed in a pre-heated cabinet at 80 °C overnight. The corresponding MOF precipitated overnight. The MOFs were separated by centrifugation and each MOF was washed three times with 15 ml DMF.
1.4. The reaction mixtures were sonicated for 10 minutes, and the closed bottles were placed in a pre-heated cabinet at 80 °C overnight. The corresponding MOF precipitated overnight. The MOFs were separated by centrifugation and each MOF was washed three times with 15 ml DMF.
After washing, the MOF particles were dried in a muffle furnace at 120 °C overnight. UiO-66 and UiO-66-NH2 were activated under vacuum (1 × 10⁻³ mbar) at 300 °C for 4 hours, whereas UiO-66-(OH)2 was activated at the same temperature for 5 h. The purpose of activation is to remove the remaining solvent and linker molecules from the pores as well as dehydration of the cluster core. Small amounts of the MOFs were taken for the XRD and BET analysis. The BET analysis was performed after degassing at 150 °C (UiO-66 and UiO-66-NH2) and 100 °C (UiO-66-(OH)2) and required solvent exchange to avoid any contamination of the BET instrument with DMF. For this, a further washing process with methanol was carried out to remove any adsorbed DMF.
Synthesis of lithium 3-methyl-3-pentoxide
The 1 M lithium 3-methyl-3-pentoxide solution was synthesized according to the patent of Schwindeman et al.29 The reaction was carried out in an argon atmosphere. The molar ratio of lithium metal to alcohol was 1.9![[thin space (1/6-em)]](https://www.rsc.org/images/entities/char_2009.gif) :
:![[thin space (1/6-em)]](https://www.rsc.org/images/entities/char_2009.gif) 1. 2.614 g of lithium metal foil was cut into small pieces and scratched with a scalpel to remove the passive layer from the surface. They were placed in 175.2 mL THF with 24.8 mL 3-methyl-3-pentanol in a round flask that was closed using Teflon sealing rings. The mixture was heated under reflux at temperatures between 68 and 70 °C. The reaction started when H2 evolution was observed. After 30 minutes the solution became yellow. As long as the gas evolution took place, the reaction mixture continued to be heated. Finally, after four days the reaction was complete, the reaction mass was filtered to remove unreacted lithium, and the lithium alkoxide solution was subsequently stored in a glovebox.
1. 2.614 g of lithium metal foil was cut into small pieces and scratched with a scalpel to remove the passive layer from the surface. They were placed in 175.2 mL THF with 24.8 mL 3-methyl-3-pentanol in a round flask that was closed using Teflon sealing rings. The mixture was heated under reflux at temperatures between 68 and 70 °C. The reaction started when H2 evolution was observed. After 30 minutes the solution became yellow. As long as the gas evolution took place, the reaction mixture continued to be heated. Finally, after four days the reaction was complete, the reaction mass was filtered to remove unreacted lithium, and the lithium alkoxide solution was subsequently stored in a glovebox.
Grafting
The grafting of 3-methyl-3-pentoxide on the MOFs was carried out as follows. In an Ar-filled glovebox, 250 mg of the MOF and 25 mL of 1 M alkoxide solution were placed in a Schlenk tube. Since the reaction has to take place in the absence of air, a small piece of lithium metal was placed in a Schlenk-type female joint cap to act as a scavenger for water that might slowly enter the reaction tube. The closed Schlenk tube was taken out of the glovebox and the reaction was performed in a fume hood. Three Schlenk tubes (one for each activated MOF) were fixed on a retort stand, covered with aluminium foil to prevent heat loss, and immersed in an oil bath. The reaction was carried out by heating at 60 °C for seven days.During the reaction time, the color of the solutions changed from pale yellow to red (UiO-66-alkoxide), intense yellow (UiO-66-NH2-alkoxide) and orange (UiO-66-(OH)2-alkoxide), respectively. After seven days, the Schlenk tubes were transferred back to the glovebox and the suspensions were transferred into glass vials. The suspensions were separated by centrifugation for 10 minutes at 2500 rpm. The clear solutions were decanted and the sedimented product was washed with dry THF in the glovebox and centrifuged again for 10 minutes. The washing process with THF was repeated four times. The products were dried in a vacuum at 80 °C for three hours and afterwards at 120 °C for one hour. Very small amounts of each powder were taken for the XRD analysis to verify if the crystalline structure remained after the grafting process.
Preparation of ionogels
One ionogel was prepared from each of the three activated pristine MOFs and each of the grafted products by the addition of EMIM-FSI ionic liquid (IL). Direct mixing of the MOF with the ionic liquid was not possible because of the large difference in volume and consequently poor distribution of EMIM-FSI in the sample. In order to achieve an even distribution, for 70 mg of MOF, 30 mg of ionic liquid (i.e. 21.6 μl, the density of EMIM-FSI is 1.39 g cm−3) was diluted in 1.5 mL dimethyl carbonate before the respective MOF was added. The suspension was agitated thoroughly and left in a glovebox for the next 4 days. Then, dimethyl carbonate was evaporated and the sample was dried under vacuum. Dimethyl carbonate is volatile, and thus, it was easily removed from the mixture during vacuum drying at 100 °C.The particles did not show any change in colour, but the consistency of the powder changed after treatment with the ionic liquid. The MOFs soaked with EMIM-FSI were pressed in the Ar-filled glovebox into 5 mm diameter pellets, about 1 mm thick, by using a force of 0.25 tons. In the glovebox, the pellets were also sputtered on both sides with 100 nm gold, using a Leica EM SCD050 sputter coater. The sputtered gold contacts as blocking electrodes for Li ions. The exact abbreviations and compositions of the samples are shown in Table 3.
| Abbreviation | Composition | ||
|---|---|---|---|
| Activated MOF wt% | Grafted MOF wt% | EMIM-FSI wt% | |
| UiO-66-Li | — | 100 | — |
| IL@UiO-66 | 70 | — | 30 |
| IL@UiO-66-Li | — | 70 | 30 |
| UiO-66-NH2-Li | — | 100 | — |
| IL@UiO-66-NH2 | 70 | — | 30 |
| IL@UiO-66-NH2-Li | — | 70 | 30 |
| UiO-66-(OH)2-Li | — | 100 | — |
| IL@UiO-66-(OH)2 | 70 | — | 30 |
| IL@UiO-66-(OH)2-Li | — | 70 | 30 |
Impedance, NMR and FTIR measurements
Impedance measurements were carried out in coin cells, which were also assembled and crimped in the glovebox, in order to keep the samples free from moisture and air. The stray capacitance in the coin-cell measuring configuration was separately determined to be in the order of 10 pF. The determination of stray capacitances was performed by a method that we developed and described in a separate published report.30 A Concept 80 impedance spectrometer (Novocontrol) equipped with an Alpha-A impedance analyzer in combination with an active ZGS sample cell was used. Frequencies covered a range from 107 to 10−2 Hz; the amplitude of the applied AC voltage was 0.1 V and the temperature domain was between 193 K and 373 K. Conductivity isotherms were recorded every 20 K. Conductivity data points for the calculation of the activation energy were taken from the DC plateaus of the conductivity isotherms.Variable-temperature 7Li NMR lines were recorded with a Bruker spectrometer (Avance III 300). A 7.0 T cryomagnet field strength results in a resonance frequency of 116.59 MHz for the 7Li nucleus. The lines were recorded under static conditions, with 90° pulse lengths ranging from 2 to 3 μs and a recycle delay of 10 s. 128 free induction decays were accumulated to achieve an acceptable signal-to-noise ratio. Prior to the NMR measurements, Duran tubes were filled with the various samples and fire sealed to keep them free of moisture and air.
Fourier transform infrared spectroscopic measurements were carried out on a Tensor 27 spectrometer from Bruker configured in attenuated total reflection (ATR) measuring mode.
Conflicts of interest
There are no conflicts to declare.Acknowledgements
The authors thank Brigitte Bitschnau and Veronika Pregartner for X-ray diffraction measurements and Raffaele Riccò for BET measurements. This research received funding from Land Steiermark through the Zukunftsfonds Steiermark (project Hybrid-Solarzellenbatterie, grant no. 1341) and from the FFG (K-project Safe Battery, grant no. 856234, project SolaBat, grant no. 853627 and project SAM4SIB, grant no. FO999903691). The Deutsche Forschungsgemeinschaft (DFG) (FOR 1227 MoLiFe, project LIDINAM, grant HA6966/1-2) is also acknowledged.References
- J. Zheng, M. S. Kim, Z. Tu, S. Choudhury, T. Tang and L. A. Archer, Regulating electrodeposition morphology of lithium: towards commercially relevant secondary Li metal batteries, Chem. Soc. Rev., 2020, 49, 2701–2750 RSC.
- M. Du, K. Liao, Q. Lu and Z. Shao, Recent advances in the interface engineering of solid-state Li-ion batteries with artificial buffer layers: challenges, materials, construction, and characterization, Energy Environ. Sci., 2019, 12, 1780–1804 RSC.
- W. Zhao, J. Yi, P. He and H. Zhou, Solid-State Electrolytes for Lithium-Ion Batteries: Fundamentals, Challenges and Perspectives, Electrochem. Energy Rev., 2019, 2, 574–605 CrossRef CAS.
- N. Chen, H. Zhang, L. Li, R. Chen and S. Guo, Ionogel Electrolytes for High-Performance Lithium Batteries: A Review, Adv. Energy Mater., 2018, 8, 1702675 CrossRef.
- Y. Lu, K. Korf, Y. Kambe, Z. Tu and L. A. Archer, Ionic-Liquid-Nanoparticle Hybrid Electrolytes: Applications in Lithium Metal Batteries, Angew. Chem., Int. Ed., 2014, 53, 488–492 CrossRef CAS PubMed.
- F. Wu, N. Chen, R. Chen, Q. Zhu, J. Qian and L. Li, “Liquid-in-Solid” and “Solid-in-Liquid” Electrolytes with High Rate Capacity and Long Cycling Life for Lithium-Ion Batteries, Chem. Mater., 2016, 28, 848–856 CrossRef CAS.
- W. S. Chi, D. K. Roh, S. J. Kim, S. Y. Heo and J. H. Kim, Hybrid electrolytes prepared from ionic liquid-grafted alumina for high-efficiency quasi-solid-state dye-sensitized solar cells, Nanoscale, 2013, 5, 5341 RSC.
- S. S. Moganty, N. Jayaprakash, J. L. Nugent, J. Shen and L. A. Archer, Ionic-Liquid-Tethered Nanoparticles: Hybrid Electrolytes, Angew. Chem., Int. Ed., 2010, 49, 9158–9161 CrossRef CAS PubMed.
- N. A. Khan, Z. Hasan and S. H. Jhung, Ionic Liquids Supported on Metal-Organic Frameworks: Remarkable Adsorbents for Adsorptive Desulfurization, Chem.–Eur. J., 2014, 20, 376–380 CrossRef CAS PubMed.
- A. Ferbezar, R. Zettl, H. Fitzek, B. Gadermaier and I. Hanzu, Ion conduction in Na+ containing ionogels based on the UiO-66 metal organic framework, Electrochim. Acta, 2022, 434, 141212 CrossRef CAS.
- R. Zettl and I. Hanzu, The Origins of Ion Conductivity in MOF-Ionic Liquids Hybrid Solid Electrolytes, Front. Energy Res., 2021, 9, 714698 CrossRef.
- I. Osada, H. de Vries, B. Scrosati and S. Passerini, Ionic-Liquid-Based Polymer Electrolytes for Battery Applications, Angew. Chem., Int. Ed., 2016, 55, 500–513 CrossRef CAS PubMed.
- K. Liang, C. J. Coghlan, S. G. Bell, C. Doonan and P. Falcaro, Enzyme encapsulation in zeolitic imidazolate frameworks: a comparison between controlled co-precipitation and biomimetic mineralisation, Chem. Commun., 2016, 52, 473–476 RSC.
- W. Liang, F. Carraro, M. B. Solomon, S. G. Bell, H. Amenitsch, C. J. Sumby, N. G. White, P. Falcaro and C. J. Doonan, Enzyme Encapsulation in a Porous Hydrogen-Bonded Organic Framework, J. Am. Chem. Soc., 2019, 141, 14298–14305 CrossRef CAS PubMed.
- M. J. Katz, Z. J. Brown, Y. J. Colón, P. W. Siu, K. A. Scheidt, R. Q. Snurr, J. T. Hupp and O. K. Farha, A facile synthesis of UiO-66, UiO-67 and their derivatives, Chem. Commun., 2013, 49, 9449 RSC.
- B. M. Wiers, M.-L. Foo, N. P. Balsara and J. R. Long, A Solid Lithium Electrolyte via Addition of Lithium Isopropoxide to a Metal–Organic Framework with Open Metal Sites, J. Am. Chem. Soc., 2011, 133, 14522–14525 CrossRef CAS PubMed.
- R. Ameloot, M. Aubrey, B. M. Wiers, A. P. Gómora-Figueroa, S. N. Patel, N. P. Balsara and J. R. Long, Ionic Conductivity in the Metal-Organic Framework UiO-66 by Dehydration and Insertion of Lithium tert -Butoxide, Chem.–Eur. J., 2013, 19, 5533–5536 CrossRef CAS PubMed.
- R. Zettl, S. Lunghammer, B. Gadermaier, A. Boulaoued, P. Johansson, H. M. R. Wilkening and I. Hanzu, High Li+ and Na+ Conductivity in New Hybrid Solid Electrolytes based on the Porous MIL-121 Metal Organic Framework, Adv. Energy Mater., 2021, 11, 2003542 CrossRef CAS.
- Z. Wang, H. Zhou, C. Meng, W. Xiong, Y. Cai, P. Hu, H. Pang and A. Yuan, Enhancing Ion Transport: Function of Ionic Liquid Decorated MOFs in Polymer Electrolytes for All-Solid-State Lithium Batteries, ACS Appl. Energy Mater., 2020, 3, 4265–4274 CrossRef CAS.
- V. Nozari, C. Calahoo, J. M. Tuffnell, P. Adelhelm, K. Wondraczek, S. E. Dutton, T. D. Bennett and L. Wondraczek, Sodium Ion Conductivity in Superionic IL-Impregnated Metal-Organic Frameworks: Enhancing Stability Through Structural Disorder, Sci. Rep., 2020, 10, 3532 CrossRef CAS PubMed.
- A. Singh, R. Vedarajan and N. Matsumi, Modified Metal Organic Frameworks (MOFs)/Ionic Liquid Matrices for Efficient Charge Storage, J. Electrochem. Soc., 2017, 164, H5169–H5174 CrossRef CAS.
- N. Chen, Y. Li, Y. Dai, W. Qu, Y. Xing, Y. Ye, Z. Wen, C. Guo, F. Wu and R. Chen, A Li+ conductive metal organic framework electrolyte boosts the high-temperature performance of dendrite-free lithium batteries, J. Mater. Chem. A, 2019, 7, 9530–9536 RSC.
- K. Hogrefe, N. Minafra, W. G. Zeier and H. M. R. Wilkening, Tracking Ions the Direct Way: Long-Range Li+ Dynamics in the Thio-LISICON Family Li4MCh4 (M = Sn, Ge; Ch = S, Se) as Probed by 7Li NMR Relaxometry and 7Li Spin-Alignment Echo NMR, J. Phys. Chem. C, 2021, 125, 2306–2317 CrossRef CAS PubMed.
- D. Prutsch, et al., Nanostructured Ceramics: Ionic Transport and Electrochemical Activity, Z. Phys. Chem., 2017, 231, 1361–1405 CrossRef CAS.
- A. Kuhn, S. Narayanan, L. Spencer, G. Goward, V. Thangadurai and M. Wilkening, Li self-diffusion in garnet-type Li7La3Zr2O12 as probed directly by diffusion-induced 7Li spin-lattice relaxation NMR spectroscopy, Phys. Rev. B: Condens. Matter Mater. Phys., 2011, 83, 094302 CrossRef.
- J. T. S. Irvine, D. C. Sinclair and A. R. West, Electroceramics: Characterization by Impedance Spectroscopy, Adv. Mater., 1990, 2, 132–138 CrossRef CAS.
- A. Gonzalez-Nelson, S. Mula, M. Simenas, S. Balčiūnas, A. R. Altenhof, C. S. Vojvodin, J. Banys, R. W. Schurko, F.-X. Coudert and M. van der Veen, Emergence of Cooperative Rotor Dynamics in Metal–Organic Frameworks via Tuned Steric Interactions, J. Am. Chem. Soc., 2021, 143, 12053–12062 CrossRef CAS PubMed.
- M.-M. Huang, Y. Jiang, P. Sasisanker, G. W. Driver and H. Weingartner, Static Relative Dielectric Permittivities of Ionic Liquids at 25 °C, J. Chem. Eng. Data, 2011, 56, 1494–1499 CrossRef CAS.
- J. A. Schwindeman, B. Troy Dover, R. C. Morrison and C. W. Kamienski, Preparation of lithium alkoxides, US Pat., US5276219A, 1994 Search PubMed.
- A. Komar, D. Wilmer, H. M. R. Wilkening and I. Hanzu, Accounting for stray capacitances in impedance measuring cells — a mandatory step in the investigation of solid ion conductors, Solid State Ionics, 2023, 393, 116169 CrossRef CAS.
Footnote |
| † Electronic supplementary information (ESI) available: UiO-66_Supp_Info.pdf: list of chemicals, solvents and suppliers, equivalent circuit schematics, X-ray diffraction data, lattice parameters, crystallite size (Scherrer), BET surface area, imaginary part of electric modulus and imaginary part of impedance plots, conductivity isotherms of grafted MOFs, nitrogen adsorption isotherms at 77 K and pore size distribution plots. See DOI: https://doi.org/10.1039/d3ta06986a |
| This journal is © The Royal Society of Chemistry 2024 |

