 Open Access Article
Creative Commons Attribution 3.0 Unported Licence
Emergence of preferential flow paths and intermittent dynamics in emulsion transport in porous media†
Michael
Izaguirre
 a and
Shima
Parsa
 *b
*b
aCenter for Imaging Science, Rochester Institute of Technology, Rochester, NY, USA
bSchool of Physics and Astronomy, Rochester Institute of Technology, Rochester, NY, USA. E-mail: Shima.Parsa@rit.edu
First published on 29th February 2024
Abstract
We investigate the dynamics of emulsions within a two-dimensional porous medium using an integrated experimental approach that combines pore-level dynamics of single emulsions and bulk transport properties of the medium. Using an on-chip microfluidic drop-maker, we precisely control the concentration and sizes of emulsions injected into the medium. The dynamics of emulsion droplets are highly intermittent despite a small average velocity over the trajectory of an individual emulsion. At low concentrations, emulsions predominantly flow through pores with higher local velocities including pores smaller than the size of emulsion droplets, leading to trapping of emulsions and a decrease in medium porosity. Preferential pathways for the emulsions emerge within the medium once the porosity of the medium decreases significantly, from 55% to 36%. At constant injection flow rates and low concentrations of monodisperse emulsions, these pathways remain the only paths of transport of emulsions within the medium. Introducing a slight polydispersity in emulsion sizes unveiled additional transport pathways. Our pore-level measurements reveal that the average velocity of emulsions scales with the inverse residence time of an emulsion, and this scaling separates the emulsions into distinct groups along the emergent preferential pathways.
1 Introduction
Transport of emulsions in porous media is a subject of significant interest in industrial, medical, and environmental applications including many food products, drug delivery, and immiscible displacement.1–6 The diversity and heterogeneity of most natural and environmental porous materials lead to heterogeneous flow distribution which significantly impacts the transport of droplets of emulsions in a medium.7 Furthermore, the transport properties of porous media can undergo dynamic alterations as a result of the flow and retention of materials inside the pores.8–10 Growth of biofilms in filters,2,11 transport of water-based emulsion in personal care product,12,13 or oil recovery3,8,9,14 are some of the examples in which the properties of the medium change in response to the flow of an immiscible phase. Earlier research shows that although the changes in bulk transport properties such as medium permeability and interstitial flow velocity are not considerably large upon the flow of individual droplets, the local and pore-scale flow can change dramatically leading to anomalous flow behavior locally.8,9,15,16 The transport properties of a single droplet of emulsion in porous media are dictated by the droplet sizes and network properties such as pore size distribution and medium wettability.1,4,15,17,18 Hence, the dynamics of a droplet can be described by the balance of the viscous, interfacial, and drag forces. Only two non-dimensional numbers Capillary number (ratio of viscous to interfacial forces) and Weber number (ratio of drag to interfacial forces) are used to describe the dynamics of droplets with small deformations.1,19–22 However, the collective dynamics of a group of emulsions in a complex network of pores are affected by the fluctuations in local flow due to the droplet–droplet and droplet–pore structure interactions.18 The collective transport of high concentration of emulsions in a medium with random pinning sites shows that dynamics of the droplets sharply transition from a creeping regime to flow along smectic rivers and in groups.23 The deformation of droplets in these experiments was negligible and the majority of the droplets never squeeze through small pores and only pin on the surfaces. Furthermore, measurements of bulk transport of large quantities of polydisperse droplets stabilized by a surfactant and injected into a three-dimensional porous medium show that mostly small droplets appear in effluent and large droplets remain trapped in the medium due to the large pressure required to deform the large emulsion droplets.15,17,18,24 Nevertheless, the pore-level and collective dynamics of droplets in a network of pores, and the impact of trapping and re-mobilization of droplets on pore-level and macro-scale transport properties remain to be examined at the pore-scale. One of the challenges in accurate experimental investigation is tracking and precise object detection in an environment where the interfaces of droplets are in contact and droplets deform based on pore sizes.In this paper, we quantify the pore-level dynamics of monodisperse emulsions flowing through a two-dimensional (2D) porous medium experimentally. By incorporating a microfluidics drop-maker on the same chip as the 2D porous medium, we control the concentration and sizes of the injected emulsions precisely. In these experiments, we track individual droplets as they flow into the medium using optical microscopy and a long-range recording mode while monitoring the bulk pressure gradient across the medium. By employing advanced image analysis and object tracking, we track individual emulsions as they flow through the medium. We show that at low concentrations, emulsions flow through pores with higher local velocities without being selective about the size of the pores they encounter, and this lack of selectivity can lead to the emulsions becoming trapped. Once a significant number of pores are filled with droplets, newly injected emulsions continuously flow through a few remaining open paths. We show that the average velocity of the droplets that flow through the medium scale with the inverse of the total time of residence in the medium and is proportional to the path lengths of the droplets independent of the distribution of sizes of the emulsions.
2 Experimental method
We generate emulsions and characterize the dynamics of emulsions in 2D micromodel of porous media using microfluidics, fluorescent microscopy, and bulk transport properties of the medium. One of the challenges in studying emulsions in porous media is to control the size, concentration, and injection frequency of emulsions.18,25 This is mainly due to the density contrast between the dispersed phase (emulsions) and the continuous phase. To overcome this challenge, we leverage the capabilities of microfluidics in producing well-controlled monodisperse emulsions.21,26–28 We design an on-chip drop-maker in series with a 2D porous medium as shown in Fig. 1a. This design allows us to control the injection frequency and concentration of emulsions in a porous medium.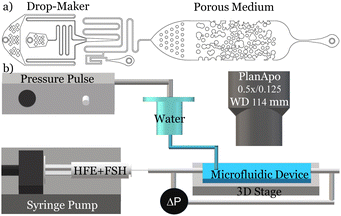 | ||
| Fig. 1 (a) 2D drawing of the drop-maker and porous medium on one chip. (b) Schematic of the experimental setup. | ||
2.1 Microfluidics 2D porous media
To generate monodisperse droplets and inject them into a porous medium in a laminar flow condition, we design the microfluidic drop-maker to operate in the dripping regime.27 The drop-maker consists of an inlet for the dispersed fluid (water and 0.1 w% fluorescein sodium salt) at the center, and two inlets for the continuous phase on either side. The continuous phase is a fluorinated oil HFE750 (engineering fluid by 3 M) with 5 w% surfactant FSH oil (by Krytox). The interfacial tension between the dispersed phase and the continuous phase is γ = 26 mN m−1. In the dripping regime, the droplet sizes are proportional to the inlet geometry.13 At equilibrium, where the inner phase fluid is protruding out of the inlet and into the outer phase, the pressure inside the droplet Pd is balanced by the pressure in the outer fluid (P0) and the capillary pressure, . Here, Rd is the radius of the droplet. The droplet snaps off once the pressure inside the droplet exceeds the outer pressure. The radius of the droplet is Rd > 2R, in a channel with radius R and circular cross-section.29–33
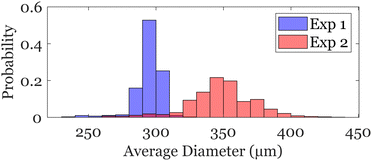
Here, the water inlet is a rectangular channel with dimensions of 84 μm × 200 μm, entering an area measuring 1050 μm × 200 μm, as shown in Fig. 1a. The two oil inlets each have dimensions of 115 μm × 200 μm. The entire channel spans 1100 μm in length and 200 μm in height, tapering down to a 325 μm wide channel before entering the porous medium. We use a syringe pump to inject the continuous phase at a constant flow rate of 5 mL h−1. However, to control the generation of individual droplets precisely, we use a pneumatic pump as shown in the schematic of the experimental setup in Fig. 1b. The viscous pressure of the flow of the continuous phase is balanced by a constant pressure, provided by the hydrostatic pressure of the closed water column. The pneumatic pump applies an additional pulse of pressure to the closed water column at 174 kPa for a duration of 200 ms. This method robustly produces monodisperse emulsion droplets with an average diameter of 295 ± 7 μm with a narrow distribution as shown in Fig. 2. The corresponding capillary and Weber number of the dropmaker in these experiments are Ca = 3 × 10⁻³ and We = 1.5 × 10⁻³. The radii of the emulsions match our prediction of Rd > 2R. The snap-off and monodispersity of the droplets in our experiments are assisted by the hydrophobic coating (aquapel) of all surfaces.34 However, small variations in pulses result in a slightly more polydisperse distribution of droplet sizes. For example, we find that multiple consecutive pulses result in a wider distribution of droplet sizes of 350 ± 10 μm as shown in Fig. 2. We continuously monitor the pressure gradient across the medium using a pressure transducer (Omega-PX409) and apply variational mode decomposition to the signal to eliminate the high-frequency noise of the transducer.35
We design and fabricate 2D porous media using standard soft lithography and microfluidics techniques.36 To obtain a pattern of random pore size distribution, we use a 2D micrograph of a three-dimensional glass bead-pack imaged by a confocal microscope.7 We further enhance the pore size heterogeneity by imposing a gradient in pore size distribution with a larger porosity at the inlet compared to the porosity downstream. This gradient in porosity represents the heterogeneity of natural and geological porous structures.37 We quantify the porosity and pore size distribution of the 2D porous medium using a novel algorithm that utilizes Voronoi tessellation and skeletonization.38–41 The pore size distribution in the medium has an average pore size of 403 μm and varies between 150 and 1150 μm as shown in Fig. 3.
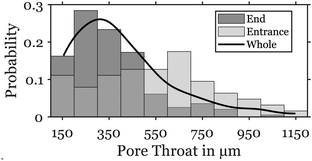 | ||
| Fig. 3 Probability distribution of the pore sizes in the medium (solid line), the 1/3 entrance to the medium (light gray), and the 2/3 end of the medium (dark gray). | ||
To ensure that the emulsion droplets are small enough to enter the medium, the physical dimensions of the porous medium are proportionally adjusted to allow some passage of the droplets. In these experiments, we utilize a microfluidics 3D printer (CADworks3D Pr110-385 nm). Using this cutting-edge resin-based 3D printer, boasting an XY resolution of 40 × 40 μm2 and a Z resolution of 5 μm, we fabricate microfluidic master-molds with a variety of dimensions. To achieve smooth surfaces on the master-mold, which is critical for the performance of our microfluidic devices, we optimize the printing settings for a commercial powder-base resin with low light dispersion. By controlling the UV-exposure and curing time, the edges and surfaces are smooth. The master-molds are then filled with polydimethylsiloxane (PDMS) and cured at 60 °C before plasma cleaning and bonding to a glass slide.
2.2 Pore-scale imaging
To quantify the dynamics of emulsion within the porous medium, we use a widefield optical microscope (Axiozoom) and a long-range-record camera (FasTec IL5). The camera is operated at 50 Hz with a resolution of 2500 × 1000 pixels at 16 bits, providing a high dynamic range. The microfluidic porous medium is illuminated with a collimated RGB backlight LED providing a high contrast image where emulsions can be identified.We characterize the dynamics of emulsions at the pore-level and across the entire model porous medium utilizing a modified particle tracking algorithm that accounts for objects in close contact and with highly intermittent kinematics. While most particle tracking methods are optimized to identify sparse objects,42 emulsions trapped in a porous medium are in close contact with each other and are squeezed into a solid structure and can be slightly deformed, see Fig. 4. Here, we first subtract the solid background while applying a drift correction on all images to enhance the accuracy of object detection. Using a circular hough transform, we identify individual droplets within the medium as shown in Fig. 4. Once all droplets are identified, we employ a global nearest-neighbor (GNN) tracking method under Sensor Fusion and Tracking Toolbox in MATLAB R2023. The GNN tracker uses the global nearest-neighbor assignment algorithm to match its detection to identified tracks based on predicted position, velocity, and acceleration. The GNN tracker forms a cost matrix by calculating the distance between each detection and existing tracks. Using this cost matrix, it categorizes the detected objects into either assigned pairs with tracks or unassigned, subsequently updating or initializing tracks as appropriate. Since our detection method is highly accurate, we assign a high cost to new tracks created outside the spatial area in which new emulsions are introduced into the field of view. We overcome the natural challenge of tracking objects that are constantly trapped and mobilized by using an Interacting multiple-model filter. The high-resolution imaging and enhanced edge detection are crucial in successfully applying the GNN tracker to the highly intermittent dynamics of emulsion. See ESI† of Fig. S4 providing a dynamic visual representation of the emulsion transport through the porous medium.
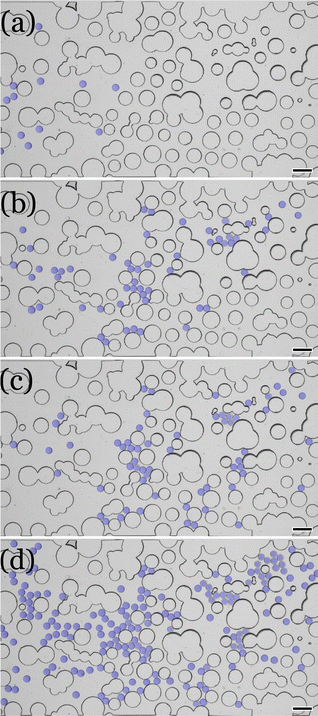 | ||
| Fig. 4 Transport of individual droplets injected into a 2D porous medium as a function of time (a) 5 s, (b) 25 s, (c) 42.5 s, (d) 62.5 s. Blue circles mark the emulsions. Scale bar is 1 mm. | ||
3 Results
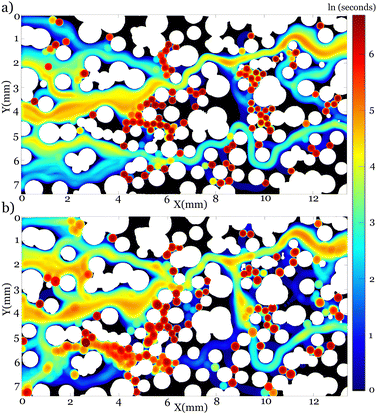
The dynamics of emulsions in porous media are highly intermittent despite the tendency of the droplets to travel at the center of the pores. As single droplets enter the porous medium, they flow through paths with a higher average velocity. In these experiments, we form and inject the droplets at low concentrations and distribute their points of entry into the medium in the cross-sectional direction, Fig. 4a. The low concentration of emulsion is crucial to avoid a yield stress behavior.41 The emulsions flowing into a porous medium, naturally follow the streamlines with larger velocities. However, there is no feedback mechanism that would prohibit their entry to a pore or a pore throat smaller than the diameter of the droplet. Interestingly, in a porous medium with a random distribution of pore sizes, a considerable number of high-velocity paths flow through small pores. Hence, we observe a substantial number of emulsions getting trapped in the medium during the injection of the first batches of emulsions as seen in Fig. 4b. While a few emulsions find their way to the outlet, more than 65% of the emulsions are trapped following their predecessors as seen in Fig. 4c. A droplet trapped in a pore does not completely block the flow of the continuous phase in this area and the continuous phase passes around the droplet. Consequently, the changes in the local flow within the first few seconds of these experiments do not lead to a change in the global flow, as opposed to pore blocking seen in experiments focusing on conformance control in oil recovery.9,43 Additionally, our continuous measurement of the pressure drop across the medium confirms that the bulk flow is not affected by a few trapped emulsions in the medium. Trapping of a few droplets in the medium changes the medium porosity from 55% in Fig. 4a to 49% in Fig. 4c. Despite the considerable change in porosity, the pressure gradient across the medium increases only from 1400 Pa to 1450 Pa, further confirming the presence of a flow around individual emulsions and through the pores. Further injection of emulsions into the medium results in substantial clogging of individual pores in the medium as seen in Fig. 4d. Considering that the volumetric flow rate is held constant throughout this experiment, one expects that flow should be redirected to other open pores. Once the porosity of the medium decreases to 36% and many pores are filled with emulsions, newly injected emulsions follow paths that were not explored earlier and find their way to the medium outlet. Interestingly, we find that some entire paths are filled with emulsions (seen in the center of Fig. 4d) before the flow of emulsions is diverted. Finally, a tortuous path is formed which is followed by newly injected emulsions. We do not observe clogging of the entire medium at the constant injection flow rate and the concentration of the droplets remains to be below a jamming transition.44 Moreover, the balance between viscous and capillary forces does not change dramatically to mobilize a large number of droplets.45,46To quantify the emerging flow paths within the medium, we track individual emulsions and superimpose the paths taken by these emulsions as shown in Fig. 5. A few preferential paths are formed in the medium and the subsequently injected emulsions continue flowing along these paths. While only a few tortuous paths are established in the flow of monodisperse emulsions (Fig. 5a), additional paths are explored by introducing a slight polydispersity in the emulsion sizes (Fig. 5b). Interestingly, in the experiment with larger and polydisperse emulsions, large droplets squeeze through the pores and create small perturbations in the flow of subsequent trailing droplets. Hence, droplets are more likely to switch paths as shown in Fig. 5b.
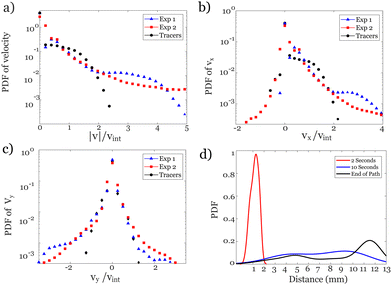
To quantify the variability of the velocities of the emulsions, we calculate the probability density function (PDF) of the velocities in different experiments as shown in Fig. 6a. The PDF of the magnitude of the velocities of emulsions has an exponential decay with a long stretched tail indicating the presence of rare events with very large velocities compared to the interstitial velocity. The interstitial velocity is vint = q/ϕ, where q is the volumetric flow rate per cross-sectional area and ϕ is the medium porosity. The distributions of velocities of emulsions have similarities with the PDF of the velocities of the flow of a single-phase continuous fluid, measured in identical but separate experiments using 1 μm tracer particles particle image velocimetry (PIV).7,9 However, the tail of the PDF of the velocities of droplets stretches to much larger velocities (5 × vint) than that of the single-phase flow (3 × vint).
Comparing the PDF of velocities of droplets with a single-phase flow confirms the intermittency in the dynamics of droplets where trapping, re-mobilization, squeezing and bursts through pore throats are common. The dynamics of emulsions in these experiments exhibit unique features reminiscent of transport in a porous medium: (1) emulsions only pass through certain areas and some pores within the medium are never explored by the droplets, as seen in Fig. 5. (2) Trapping and accumulation of emulsions within the porous structure result in changes in the medium permeability, leading to an increase in the viscous forces. The latter effect, only observable in pore-level measurements,9,10,43 can significantly change the flow in neighboring pores and consequently affect the global flow. Despite the finite size of the emulsions, and an expected slower velocities than fluid elements (represented as tracers), we find that the PDF of magnitude of the velocities of emulsions has an average comparable to a single phase flow in agreement with the constant flow driven experiment.
The PDF of velocities of emulsions in the direction of the imposed flow, Fig. 6b, has a positive average, 〈vx〉 = 270 μm s−1, consistent with the direction of flow. The significant negative tail in the polydisperse experiments (Exp2) is due to the tortuous path taken by droplets in this experiment. The PDF of vy of emulsions has a slightly higher probability in the downward (vy < 0) than the upward direction, aligning with the most common paths observed in Fig. 5. The average dynamics of droplets in these experiments (Exp1: monodisperse and Exp2: polydisperse) are independent of the distribution of droplet sizes. The average velocity is dominated by the large number of droplets experiencing slow dynamics. However, the rare events with large velocities and bursts of motion are more probable in the experiments with more variable sizes of emulsions.
Additional insights into the preferential paths of the droplets can be drawn by comparing the trajectory of a droplet with a fluid element as it enters the medium. The path of a droplet is determined by the local stress (proportional to the velocity gradient) on the surface of the droplet, while the path of a fluid element is dictated by the fluid velocities. Hence, the trajectory of an emulsion droplet deviates from a fluid element due to the finite size of a droplet. The departure of the trajectory of a droplet from fluid elements increases with time as shown in Fig. 6d. We quantify the distribution of the deviation between the location of the tracers and the emulsions entering the medium at the same initial position. The locations of the tracers are determined by integrating their trajectory using the flow velocity field (from PIV) and a fourth order Runge–Kutta integration scheme.42 The emulsions closely follow the path taken by a tracer for the first few seconds but the location of the center of the droplet quickly departs from the fluid element. After only 10 seconds the distance between the location of the droplets and fluid elements is distributed evenly across the medium. The distribution of the distances shifts towards larger values and closer to the length of the medium by the time either the emulsion or the fluid element reaches the end of their paths. The distribution is converted into a smooth function using MATLAB Kernel smoothing function estimate for univariate and bivariate data.
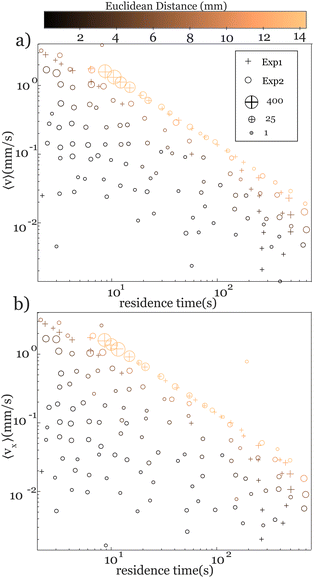
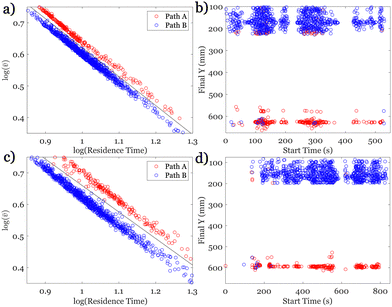
Our understanding of emulsion transport in porous media can be further enhanced by quantifying the dependence of the average velocity of the emulsions on the time of travel through the medium, which we refer to as residence time. As shown in Fig. 7, the average velocities of all emulsions that pass through the medium scale with the inverse residence time of the emulsions, 〈v〉 ∼ 1/(resident time). We measure the residence time of each individual emulsion as it traverses the medium. Emulsions that pass through the medium quickly have a short residence time, while those that become trapped have a much longer residence time. The longest residence time recorded in our experiments is 800 seconds, comparable to the duration of the experiment, and belongs to an emulsion droplet trapped in the medium. The scaling of 〈v〉 with inverse resident time holds for all emulsions that exit the medium, represented by the light color of the symbols in Fig. 7a. The color of the symbols represents the value of the Euclidean distance along the trajectory of the emulsions, defined based on the initial and final locations of each emulsion droplet along its path. The longest Euclidean distance within the 2D porous medium corresponds to the diagonal of the medium (13.2 mm). Interestingly, the scaling of the average velocity is independent of the distribution of the sizes of the emulsions (Exp1, Exp2). Moreover, the longitudinal component of the velocity scales with the residence time similar to those with the average velocity, 〈vx〉 ∼ 1/(resident time). We attribute the 〈vx〉 scaling to the dominance of the longitudinal direction in the transport of emulsions within the medium. The transverse velocity, 〈vy〉, is an order of magnitude smaller than the longitudinal component in these experiments. The average velocities of the emulsions that are permanently trapped in the medium, or those that do not leave the medium for the duration of the experiment, are smaller than the velocities of emulsions of similar residence time that pass through the medium. Therefore, as illustrated in Fig. 7, the average velocities of the emulsions that remain within the medium consistently fall below the reference line that encompasses those that pass through it. We observe that droplets with longer Euclidean paths, or equivalently those closer to passing through the medium, are more likely to have an average velocity that approaches the population following the scaling with inverse residence time. Throughout the experiments, we extracted over 6 million positional updates and their corresponding velocities. Therefore, in Fig. 7, we aggregate numerous data points into a single symbol for better visualization. The symbol's size corresponds to the logarithmic scale of the data point count.
The scaling of average velocity with inverse residence time of emulsions is described with a simple dimensional argument  . We find that the corresponding length scale is the path length of the trajectory of the emulsions. Here, the emulsions are more likely to take either preferential paths identified in Fig. 5. We identify the emulsions with the paths they take and show that in the monodisperse experiments where emulsions continuously follow two distinct paths, the emulsions on the longer path have a slightly smaller average velocity. Nevertheless, the average velocities of all emulsions are distinctly split into two groups as shown in Fig. 8a. This observation is further confirmed by the location of the exit point of the emulsions as shown in Fig. 8b. Moreover, similar separation of path lengths and exit points are observed for the polydisperse emulsions as seen in Fig. 8c and d. Observation of the distinct paths and exit points in this medium provides clear evidence of the emergence of preferential paths independent of the emulsion sizes. These paths emerge as a consequence of the solid pore structure modified by the trapping of emulsions.
4 Conclusions
In the present study, we successfully investigate the pore-level dynamics of monodisperse emulsions navigating a two-dimensional porous medium. By leveraging the versatility of microfluidic techniques, we control the concentration and sizes of emulsions, in addition to the injection rate of emulsions, by integrating an on-chip drop-maker driven by an external pneumatic pulse. We find that at low concentrations, emulsions flow through pores with higher local velocities and independent of the pore sizes, leading to trapping of emulsions in pores smaller than the emulsion sizes. This leads to a 35% reduction in the porosity of the medium. Few preferential and highly tortuous flow paths emerge within the medium after this reduction in porosity, along which low-concentrations emulsions continue to flow. Our measurements of the pore-level velocities of the emulsions show a highly intermittent dynamic consisting of trapping and subsequent mobilization of emulsions within the porous structure. Nevertheless, we find that the average velocities of all emulsions that flow through the medium scale with the inverse residence time of the emulsions and is distinguished by the flow paths emulsions take within the medium. This emergent scaling holds for slightly polydisperse emulsions.The introduction of a slight polydispersity in the emulsions enhances the transport of emulsions despite the larger sizes of the droplets revealing more fluctuations in transport paths. Independent of the distribution of droplet sizes, trapped emulsions within the porous structure play a pivotal role in defining preferential transport paths, showcasing the interaction intricacies between the droplets and the porous network. Although the current experiments are focused on the dynamics of low concentrations of emulsions in porous media at a moderately slow flow rate, corresponding to a small Reynolds number, in the laminar regime, the approach serves as a foundational method for characterizing emulsion dynamics in a variety of flow regimes. The formation and persistence of preferential flow paths and droplet–droplet interactions at higher flow rates where the local flow can be highly unstable remains to be explored. These findings and the associated experimental methodology have the potential to drive advancements in areas such as soil remediation, drug delivery, and oil spill cleanup.
Author contributions
M. I. performed the experiments, data analysis, and prepared the original draft of the manuscript. S. P. supervised the experiment, curated data, and edited the final manuscript.Conflicts of interest
There are no conflicts to declare.Acknowledgements
We thank M. Bijarchi and M. L. Jimenez Olivares for stimulating discussions on the experimental design. We acknowledge the support provided by the National Science Foundation under grant CBET-2301243, and the donors of ACS Petroleum Research Fund under Doctoral New Investigator Grant PRF 62556-DNI9.Notes and references
- A. Perazzo, G. Tomaiuolo, V. Preziosi and S. Guido, Adv. Colloid Interface Sci., 2018, 256, 305–325 CrossRef CAS PubMed.
- D. L. Kurz, E. Secchi, R. Stocker and J. Jimenez-Martinez, Environ. Sci. Technol., 2023, 57, 5666–5677 CrossRef CAS PubMed.
- W. Lei, C. Xie and T. Wu, et al. , Sci. Rep., 2019, 9, 1453 CrossRef PubMed.
- V. Santannaa, F. Curbelob, T. C. Dantasc, A. D. Netoc, H. Albuquerque and A. Garnicab, J. Pet. Sci. Eng., 2009, 66, 117–120 CrossRef.
- W.-B. Bartels, H. Mahani, S. Berg and S. Hassanizadeh, Fuel, 2019, 236, 338–353 CrossRef CAS.
- Y. Li and A. Abbaspourrad, Colloids Surf., B, 2022, 220, 112930 CrossRef CAS.
- K. Alim, S. Parsa, D. A. Weitz and M. P. Brenner, Phys. Rev. Lett., 2017, 119, 144501 CrossRef PubMed.
- S. Parsa, E. Santanach-Carreras, L. Xiao and D. A. Weitz, Phys. Rev. Fluids, 2020, 5, 022001 CrossRef.
- S. Parsa, A. Zareei, E. Santanach-Carreras, E. J. Morris, A. Amir, L. Xiao and D. A. Weitz, Phys. Rev. Fluids, 2021, 6, L082302 CrossRef.
- S. S. Datta, I. Battiato, M. A. Fernø, R. Juanes, S. Parsa, V. Prigiobbe, E. Santanach-Carreras, W. Song, S. L. Biswal and D. Sinton, Lab Chip, 2023, 23, 1358–1375 RSC.
- J. A. Moore-Ott, S. Chiu, D. B. Amchin, T. Bhattacharjee and S. S. Datta, eLife, 2022, 11, e76380 CrossRef CAS PubMed.
- H. A. Benson and A. C. Watkinson, Transdermal and Topical Drug Delivery: Principles and Practice, 2012 Search PubMed.
- S. Barkley, S. J. Scarfe, E. R. Weeks and K. Dalnoki-Veress, Soft Matter, 2016, 12, 7398–7404 RSC.
- V. A. Lifton, Lab Chip, 2016, 16, 1777–1796 RSC.
- R. D. Carvalho, O. J. Venturini, E. I. Tanahashi, F. Neves and F. A. França, Exp. Therm. Fluid Sci., 2009, 33, 1065–1086 CrossRef CAS.
- A. Zareei, D. Pan and A. Amir, Phys. Rev. Lett., 2022, 128, 234501 CrossRef CAS PubMed.
- L. Yu, B. Ding, M. Dong and Q. Jiang, Ind. Eng. Chem. Res., 2018, 57, 14795–14808 CrossRef CAS.
- V. R. Guillen, M. I. Romero, M. da Silveira Carvalho and V. Alvarado, Int. J. Multiphase Flow, 2012, 43, 62–65 CrossRef CAS.
- F. P. Bretherton, J. Fluid Mech., 1961, 10, 166–188 CrossRef.
- H. A. Stone, Annu. Rev. Fluid Mech., 1994, 26, 65–102 CrossRef.
- S. Battat, D. A. Weitz and G. M. Whitesides, Lab Chip, 2022, 22, 530–536 RSC.
- A. Mandal and A. Bera, Pet. Sci., 2015, 12, 273–281 CrossRef CAS.
- M. Le Blay, M. Adda-Bedia and D. Bartolo, Proc. Natl. Acad. Sci. U. S. A., 2020, 117, 13914–13920 CrossRef CAS PubMed.
- A. Z. Zinchenko and R. H. Davis, J. Fluid Mech., 2013, 725, 611–663 CrossRef.
- S. Cobos, M. S. Carvalho and V. Alvarado, Int. J. Multiphase Flow, 2009, 35, 507–515 CrossRef CAS.
- T. G. Mason, J. Bibette and D. A. Weitz, J. Colloid Interface Sci., 1996, 179, 439–448 CrossRef CAS.
- A. S. Utada, A. Fernandez-Nieves, H. A. Stone and D. A. Weitz, Phys. Rev. Lett., 2007, 99, 094502 CrossRef PubMed.
- L. Shang, Y. Cheng and Y. Zhao, Chem. Rev., 2017, 117, 7964–8040 CrossRef CAS PubMed.
- S. Barkley, E. R. Weeks and K. Dalnoki-Veress, Eur. Phys. J. E: Soft Matter Biol. Phys., 2015, 38, 138 CrossRef PubMed.
- R. Dangla, E. Fradet, Y. Lopez and C. N. Baroud, J. Phys. D: Appl. Phys., 2013, 46, 114003 CrossRef.
- R. Dangla, S. Kayi and C. Baroud, Proc. Natl. Acad. Sci. U. S. A., 2013, 110, 853–858 CrossRef CAS PubMed.
- J. Roof, Soc. Pet. Eng. J., 1970, 10, 85–90 CrossRef.
- K. van Dijke, R. de Ruiter, K. Schroën and R. Boom, Soft Matter, 2010, 6, 321–330 RSC.
- S. Nawar, J. K. Stolaroff, C. Ye, H. Wu, D. T. Nguyen, F. Xin and D. A. Weitz, Lab Chip, 2020, 20, 147–154 RSC.
- M. Izaguirre, L. Nearhood and S. Parsa, Fluids, 2022, 7, 174 CrossRef CAS.
- G. Whitesides, Nature, 2006, 442, 368–373 CrossRef CAS PubMed.
- J. Bear, Dynamics of Fluids in Porous Media, Courier Corporation, 1975 Search PubMed.
- B. Delaunay, Bull. Acad. Sci. URSS, Cl. Sci. Math. Nat., 1934, 6, 793–800 Search PubMed.
- D. Lee and B. Schachter, Int. J. Comput. Inf. Sci., 1980, 9, 219–242 CrossRef.
- T.-C. Lee, R. L. Kashyap and C.-N. Chu, Comput. Vision, Graph. Image Proces., 1994, 56, 462–478 Search PubMed.
- N. Waisbord, N. Stoop, D. M. Walkama, J. Dunkel and J. S. Guasto, Phys. Rev. Fluids, 2019, 4, 063303 CrossRef.
- S. Parsa, J. S. Guasto, M. Kishore, N. T. Ouellette, J. P. Gollub and G. A. Voth, Phys. Fluids, 2011, 23, 043302 CrossRef.
- L. Zhang, A. Abbaspourrad, S. Parsa, J. Tang, F. Cassiola, M. Zhang, S. Tian, C. Dai, L. Xiao and D. A. Weitz, ACS Appl. Mater. Interfaces, 2020, 12, 34217–34225 CrossRef CAS PubMed.
- H. Péter, A. Libál, C. Reichhardt and C. J. Reichhardt, Sci. Rep., 2018, 8, 10252 CrossRef PubMed.
- R. T. Armstrong, A. Georgiadis, H. Ott, D. Klemin and S. Berg, Geophys. Res. Lett., 2014, 41, 55–60 CrossRef.
- R. Hilfer and P. E. Øren, Transp. Porous Media, 1996, 22, 53–72 CrossRef CAS.
Footnote |
| † Electronic supplementary information (ESI) available. See DOI: https://doi.org/10.1039/d3sm01465g |
| This journal is © The Royal Society of Chemistry 2024 |

