Synthesis and photocatalytic activity of LaTiO2N using titanium oxide nanosheet/La3+ hybrids as a precursor†
Xiong
Tao
a,
Tatsuki
Tsugawa
a,
Kazuto
Hatakeyama
 ab and
Shintaro
Ida
 *abc
*abc
aGraduate School of Science and Technology, Kumamoto University, 2-39-1 Kurokami, Chuo-ku, Kumamoto, 860-8555, Japan. E-mail: ida-s@kumamoto-u.ac.jp
bInstitute of Industrial Nanomaterials (IINa), Kumamoto University, 2-39-1 Kurokami, Chuo-ku, Kumamoto, 860-8555, Japan
cCenter for Energy Systems Design (CESD), Kyushu University, 744 Motooka, Nishi-ku, Fukuoka 819–0395, Japan
First published on 21st February 2024
Abstract
LaTiO2N, which has attracted attention as a promising candidate for photocatalytic water splitting, was synthesized through a method that utilized a titania nanosheet/La3+/La(OH)3 hybrid system as a precursor. Through FE-SEM and HAADF-STEM measurements with atomic resolution, it has been revealed that LaTiO2N possesses a nano-particle morphology characterized by highly crystalline particles in the size range of 5–20 nm, which aggregate to form larger nano-particles with sizes ranging from 50 to 100 nm. The BET surface area of the LaTiO2N was 30.3 m2 g−1. Compared to the photocatalytic O2 evolution activity in the presence of the sacrificial agent of LaTiO2N synthesized from La2Ti2O7, the LaTiO2N synthesized from the titania nanosheet/La3+/La(OH)3 hybrids exhibited three times higher O2 evolution activity (AQY: 1.3%) under light irradiation with a wavelength of 420 nm.
1. Introduction
Photocatalytic overall water splitting is one of the most promising technologies to produce H2 and O2 from water using solar energy.1–3 Ever since the discovery of photoelectrochemical water splitting using the TiO2–Pt system,4 various photocatalysts such as TiO2,5 SrTiO3,6 WO3,7 TaON,8 Ta3N5,9 BiVO4 (ref. 10) and LaTiO2N11 have been reported. The oxynitride LaTiO2N with a bandgap of around 2.1 eV is considered as one of the candidate materials for a photocatalyst expected to provide high efficiency in solar hydrogen production.12 However, realizing practical applications of solar H2 production using the current LaTiO2N is still a challenge.Several factors can influence the activity of powdered photocatalysts, including surface area, crystallinity, morphology, electron transfer distance, defects and their proportion, cocatalyst and so on.13 Because the photocatalytic reaction is conducted by dispersing powdered materials into a solution, the high surface area is one of the essential factors for the outstanding photocatalytic activity.14,15 In general, the synthesis method and precursor reagent are known to strongly influence the surface area of a semiconducting powder.16–18 The commonly employed synthesis method for LaTiO2N originates from La2Ti2O7, involving a nitridation process at high temperature under ammonia flow conditions.19 During this process, the N3− ions from NH3 replace the O2− ions in La2Ti2O7, imparting a dark color to LaTiO2N and enhancing its light absorption. Consequently, the band gap width narrows to 2.1 eV, and LaTiO2N responds to visible light (λ > 420 nm).18,20 However, the La2Ti2O7 (the precursor of LaTiO2N) synthesized using the polymerized complex method or traditional calcination method, with or without flux, exhibits a dense and bulk morphology. This results in the subsequent LaTiO2N possessing a low surface area, despite the formation of a porous structure during the nitridation process.12,19
In order to improve the surface area of LaTiO2N, we propose a synthetic method utilizing titania nanosheets as precursors. The titania nanosheets can be synthesized by exfoliating layered titanium oxide compounds (H0.72Ti1.82O4) in a tetrabutylammonium hydroxide (TBAOH) aqueous solution, and the resulting titania [Ti1.82O4]0.72− nanosheets exhibit a negative charge in the solution. Therefore, upon adding an aqueous solution containing La3+, to the nanosheet dispersion solution, electrostatic interactions lead to the formation of a layered compound (La3+/Ti1.82O4 nanosheet) with high specific surface area, where La3+ is adsorbed on the nanosheet or intercalated between the nanosheet layers. Although the La/Ti (0.24/1.82) ratio in this layered structure does not correspond to LaTiO2N (La/Ti = 1/1), adjusting the amount of La3+ added to match the mol quantity of Ti in the titania nanosheets results in the simultaneous precipitation of La(OH)3 along with the layered structure. In this study, we attempted the synthesis of LaTiO2N with a high specific surface area by subjecting the hybrid structure [La3+/Ti1.82O4 nanosheet/La(OH)3] (La![[thin space (1/6-em)]](https://www.rsc.org/images/entities/char_2009.gif) :
:![[thin space (1/6-em)]](https://www.rsc.org/images/entities/char_2009.gif) Ti = 1
Ti = 1![[thin space (1/6-em)]](https://www.rsc.org/images/entities/char_2009.gif) :
:![[thin space (1/6-em)]](https://www.rsc.org/images/entities/char_2009.gif) 1) of the La3+/Ti1.82O4 nanosheet and La(OH)3 to heat treatment in ambient air and subsequently annealing in an ammonia atmosphere. In comparison to LaTiO2N synthesized from La2Ti2O7, the LaTiO2N synthesized from titania nanosheets showed a higher BET surface area (30.3 m2 g−1). Additionally, the LaTiO2N exhibited three times higher photocatalytic O2 evolution activity (AQY: 1.3%) under light irradiation with a wavelength of 420 nm.
1) of the La3+/Ti1.82O4 nanosheet and La(OH)3 to heat treatment in ambient air and subsequently annealing in an ammonia atmosphere. In comparison to LaTiO2N synthesized from La2Ti2O7, the LaTiO2N synthesized from titania nanosheets showed a higher BET surface area (30.3 m2 g−1). Additionally, the LaTiO2N exhibited three times higher photocatalytic O2 evolution activity (AQY: 1.3%) under light irradiation with a wavelength of 420 nm.
2. Materials and methods
2.1. Materials and reagents
Titanium oxide (anatase) (TiO2, CAS: 13463-67-7), cesium carbonate (Cs2CO3, CAS: 534-17-8), lanthanum nitrate hexahydrate (La(NO3)3·6H2O, CAS: 10277-43-7), hydrochloric acid and 10% tetraethyl ammonium hydroxide (TBAOH) were purchased from FUJIFILM Wako Reagent (Tokyo, Japan). All chemicals were of analytical grade and used as received.2.2. Preparation of LaTiO2N samples
Titanium oxide nanosheets were synthesized according to the previous literature.21 Typically, 0.01 mol TiO2 and 0.01 mol Cs2CO3 were ground adequately in an agate mortar. Then the mixture was placed in an alumina crucible with a loose cover for calcining for 2 hours at 400 °C. Next, the calcined product was ground adequately again and calcined for 20 hours at 1100 °C. This heating process was carried out again after grinding once more. The obtained white sample was washed with deionized water until the supernatant was neutral (pH value is 7), and dried at 60 °C overnight.In order to exchange the Cs+ cation with protons, 0.5 g of the dried sample was treated with 0.1 M HCl for one week, with the acid solution being refreshed every day. The proton exchanged sample was washed with deionized water and then exfoliated to titanium oxide nanosheets with 0.025 M TBAOH aqueous solution for one week in a 100 rpm shaker. 50 mL titanium oxide nanosheet colloid solution was stirred with a drop of La(NO3)3·6H2O, a white precipitate was immediately formed, and then that solution was heated at 200 °C until the water was absolutely evaporated (in this treatment, the chemical composition ratio of La/Ti was controlled to 1/1). Next, the remaining product was placed in an alumina oxide crucible with a loose cover for calcining for 2 hours at 500 °C, then ground adequately again and nitrided for 8–15 hours at 850–1000 °C under an NH3 flow rate of 150 mL min−1. As a comparison sample, LaTiO2N was prepared by calcining La2Ti2O7 at 950 °C for 15 h under an NH3 flow rate of 150 mL min−1. La2Ti2O7 was prepared from TiO2 and La2O3 using a traditional solid state method.
2.3. Cocatalyst loading and photocatalytic reaction
CoOx was deposited on LaTiO2N as the cocatalyst to improve the water oxidation performance. The CoOx loading experiment was carried out by a wet-impregnation process.22 Typically, 0.05 g sample was mixed with 1 mL of 1 mg mL−1 Co2+ solution for 2 hours with stirring after a temporary sonication (300 W), then the solution was evaporated and the residue was placed into an alumina oxide boat to carry out the following reduction process at 700 °C under a highly pure NH3 flow of 150 mL min−1. At last, the Co species were reduced to Co metal, and a following oxidation process in air at 200 °C was necessary to convert the Co metal to CoOx.A photocatalytic O2 evolution test was carried out in a circulating batch reactor connected with a gas chromatography analysis instrument (SHIMADZU, GC-8A) under a vacuum device (−80 kPa). The loss of light energy was minimized as much as possible, using a reactor with a lid made of high-purity quartz. At the same time, a cooling platform with stirring function was provided below the reactor, and the temperature was controlled at 5 °C throughout the experiment to ensure a constant temperature. In order to remove the influence of the oxygen in solution or air, a process of vacuuming was performed five times to remove the oxygen as much as possible. Lastly, an amount of Ar gas was supplied into the reactor until the pressure in the reactor became −80 kPa. A LED lamp (the wavelength of light is 420 nm) was used as the light source, and the light power of the LED lamp has been checked before the irradiation. When AgNO3 was used as the electron sacrificial reagent, 10 mg LaTiO2N sample and 10 mg La2O3 (La2O3 played a role as a pH value buffer reagent) were dispersed into 10 mL AgNO3 solution (0.05 M) for vigorously stirring in the dark for 30 min to ensure the powder dispersed equally into the solution, then the irradiation was started and the amount of evolved oxygen was analyzed with the gas chromatography analysis instrument. When Na2S2O8 was used as the electron sacrificial reagent, 10 mg LaTiO2N sample and 238 mg Na2S2O8 (0.1 M) were dispersed into 10 mL NaOH solution (1 M), and the subsequent experiment steps were the same as above.
For the photocatalytic H2 evolution test, the LaTiO2N sample was loaded with 1% Pt as the cocatalyst. The Pt loading process was carried out by photo-deposition reduction. Typically, 50 mg sample was mixed with 0.5 mg Pt4+ in 10% methanol for 30 min by stirring after a temporary sonication (300 W), then this solution was irradiated under a Xe lamp (500 W) for 10 minutes. Under the irradiation, Pt4+ was reduced to Pt and deposited on the surface of LaTiO2N. Photocatalytic H2 evolution reaction was performed as follows: 10 mg LaTiO2N sample was dispersed into 10% methanol solution, and the subsequent experiment steps were the same as for the above O2 evolution experiment.
The apparent quantum yield (AQY) was determined by the following formula:
 | (1) |
2.4. Characterization and analysis
The crystal structure was determined using a powder X-ray diffractometer (XRD, Rigaku) with Cu Kα (1.5406 Å) as the X-ray source in the 2θ range of 10°–80° at a scanning speed of 5° min−1. The chemical states of elements on the surface were analyzed by X-ray photoelectron spectroscopy (K-Alpha, Thermo). The SEM images and element mapping images were obtained by scanning electron microscopy (SU8000, Hitachi). The STEM images were collected using a transmission electron microscope (JEM-ARM200F NEOARM, JEOL). The thickness of the nanosheet was measured using an atomic force microscope (Nanocute, Hitachi).3. Results and discussion
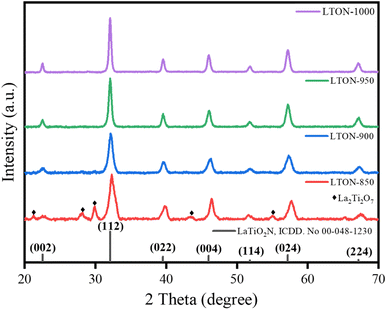
LaTiO2N was synthesized following the process shown in Fig. 1. The titanium oxide nanosheet was exfoliated using a previously reported method.21 Firstly, H0.72Ti1.82O4 was formed through the proton exchange process of Cs0.72Ti1.82O4. The protonated form was exfoliated into nanosheets in TBAOH aqueous solution.23 The AFM image of the exfoliated titanium oxide nanosheet is shown in Fig. S1 (ESI).† The thickness of 1.75 nm indicates that the exfoliated titanium oxide nanosheet has an ultrathin thickness. However, the thickness was slightly greater than the theoretical thickness of the monolayer titanium oxide nanosheet. This is mainly due to the TBA+ ion adsorbed on the nanosheet. The titania [Ti1.82O4]0.72− nanosheets exhibit a negative charge in the solution. Therefore, upon adding an aqueous solution containing La3+, to the nanosheet-dispersed TBAOH aqueous solution, electrostatic interactions led to the formation of a layered compound (La3+0.24/Ti1.82O4 nanosheet) with high specific surface area, where La3+ is adsorbed on the nanosheet or intercalated between the nanosheet layers.24 In addition, in this reaction, the aqueous lanthanum nitrate solution was added to the nanosheet-dispersed TBAOH solution with the La/Ti ratio of the entire system adjusted to 1/1. Therefore, the remaining La3+ that did not react with titanium oxide reacts with OH− and precipitates as La(OH)3. The above reaction results in the formation of a hybrid structure consisting of La3+0.24/Ti1.82O4 nanosheet and La(OH)3 hybrids, and the Ti/La ratio in this hybrid structure is 1/1. Next, the La3+0.24/Ti1.82O4 nanosheet and La(OH)3 hybrids were heated at 500 °C to decompose the TBAOH that was physically adsorbed on or inside the sample. The heat treatment resulted in the formation of the amorphous lanthanum titanium compound without a layered structure (Fig. S2, ESI†). The amorphous structure is considered to be different from the amorphous intermediate structure synthesized by the polymerization complexation method.25 And after that heating process, in order to obtain a homogeneous La–Ti–O compound, the product needs to be ground again. After the grinding and followed nitride process, the dark LaTiO2N samples (LTON) were formed.26,27Fig. 2 shows the XRD patterns of the LaTiO2N synthesized at different nitridation temperatures (LTON-850, LTON-900, LTON-950 and LTON-1000 represent the samples nitrided at 850 °C, 900 °C, 950 °C and 1000 °C, respectively). The XRD patterns for LTON-900, LTON-950 and LTON-1000 perfectly matched the standard LaTiO2N. However, when the nitriding temperature was 850 °C, La2Ti2O7 was clearly present as an impurity, indicating that high temperature is favorable for the nitriding process. As for the effect of nitriding time on LTON, LTON-950-5 h, LTON-950-8 h and LTON-950-15 h represent samples nitrided at 950 °C for 5, 8 and 15 hours respectively, and all samples had the same XRD pattern of standard LaTiO2N (Fig. S3, ESI†).
The FE-SEM images (Fig. 3) revealed that LTON-850, LTON-900, LTON-950, and LTON-1000 all exhibited a nanoparticle morphology. The La3+/titanium oxide nanosheet hybrid prepared by electrostatic interaction exhibited a stacked nanosheet morphology after the water evaporated (Fig. S4, ESI†). However, after heating at 500 °C for 2 hours, a drastic change in morphology occurred; the stacked nanosheets transformed into a nanoparticle morphology (Fig. S4, ESI†). The high temperature likely caused the destruction of the nanosheets, and the resulting lanthanum titanium compound could no longer maintain the stacked nanosheet structure. Meanwhile, the nitriding time had little influence on the morphology of LTON (Fig. S5, ESI†). From the XRD patterns, the Scherrer formula28 (formula (2)) could relatively accurately express the crystallite size of the LTON. The calculated crystallite sizes of LTON-850, LTON-900, LTON-950 and LTON-1000 were 9.2, 13.1, 18.6 and 22.5 nm, respectively, indicating that the crystallite size of the samples increased with higher nitriding temperature. The crystallite sizes of LTON-950-5 h and LTON-950-15 h were 17.6 and 21.4 nm, respectively, indicating that a longer nitride process time also resulted in larger crystals. The N, O, Ti and La element distribution of LTON-950 was determined by STEM EDS mapping, and the results are shown in Fig. S6 (ESI†), it was found that the element ratio of N to Ti was 1![[thin space (1/6-em)]](https://www.rsc.org/images/entities/char_2009.gif) :
:![[thin space (1/6-em)]](https://www.rsc.org/images/entities/char_2009.gif) 1, which corresponds to the theoretical ratio in LaTiO2N.
1, which corresponds to the theoretical ratio in LaTiO2N.
D = Kλ/(β![[thin space (1/6-em)]](https://www.rsc.org/images/entities/char_2009.gif) cos cos![[thin space (1/6-em)]](https://www.rsc.org/images/entities/char_2009.gif) θ) θ) | (2) |
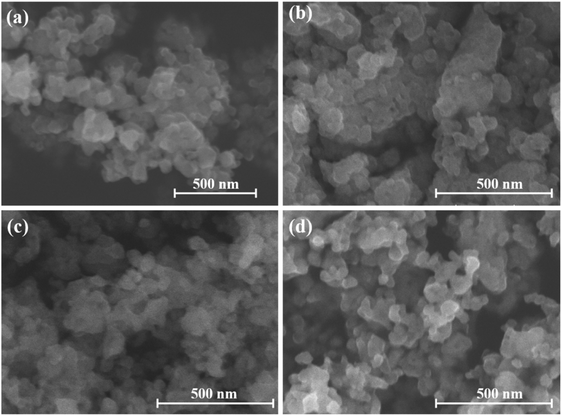 | ||
| Fig. 3 FESEM image of the synthesized LTON under different temperature conditions (850 °C (a), 900 °C (b), 950 °C (c) and 1000 °C (d)). | ||
The BET surface area is an important parameter, and in most cases, the photocatalyst with high surface area exhibits high photocatalytic activity. As shown in Fig. S7 (ESI),† the N2 adsorption–desorption isotherms and mean pore size were determined. All samples showed IV type isotherms with H3 type hysteresis loop. LTON-950 exhibited the largest BET surface area of 30.3 m2 g−1, while the samples LTON-900 and LTON-1000 showed lower BET surface areas of 25.4 and 17.5 m2 g−1, respectively (Table 1). The LTON-1000 showed lower BET surface area than LTON-950, indicating that high temperature was not conducive to obtaining a sample with a larger surface area. The mean pore size of samples exhibited an upward trend, increasing from 34.6 nm to 44.8 nm with higher nitridation temperatures. Meanwhile, LaTiO2N prepared from La2Ti2O7 has a high purity and crystallinity, its morphology was an obviously large bulk, and the BET surface area and mean pore size are 16.8 m2 g−1 and 22.3 nm, respectively (Fig. S8, ESI†).
| Sample | BET surface area (m2 g−1) | Mean pore size (nm) |
|---|---|---|
| LTON-900 | 25.4 | 34.6 |
| LTON-950 | 30.3 | 40.9 |
| LTON-1000 | 17.5 | 44.8 |
Fig. 4 shows the UV-vis light absorption spectra of the synthesized samples. The precursor of LTON-950 showed a light absorption edge at 330 nm, limited to the ultraviolet light range. The color of LTON-950 was black after the nitridation process of its white precursor (A-LTO) (Fig. 4(a)), whereas the color of LTON synthesized from La2Ti2O7 was orange, and its light absorption edge was <618 nm. In contrast, LTON-950 exhibited a light absorption edge extending into the near-infrared region. Regarding the band gap of LTON-950, it exhibited a narrower band gap and a wider absorption edge, which may have originated from various defects (e.g., O species, etc.) or the presence of Ti3+.26,29,30 The nitride temperature and time had less influence on the light absorption edge and band gap of LTON (Fig. S9, ESI†).
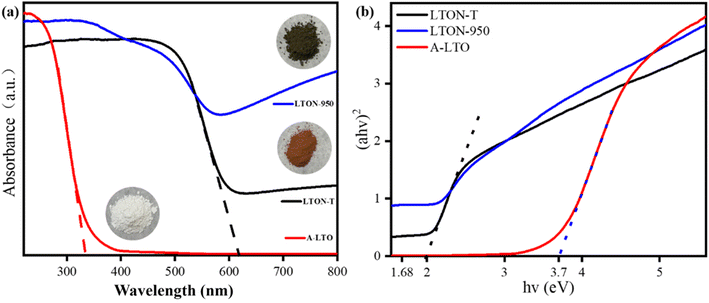 | ||
| Fig. 4 (a) UV-vis light absorption spectra of the synthesized samples and (b) Kubelka–Munk transformation of diffuse reflectance data of the synthesized samples. | ||
The valence states and element ratios were determined by XPS analysis (Fig. 5), and the Ti 2p3/2 high-resolution spectra revealed that all samples exhibited Ti4+ (peak position is 458.1 eV) and Ti3+ peaks (peak position is 456.9 eV), respectively. Under high temperature, the ammonia demonstrated high reduction ability, which could reduce Ti4+ to Ti3+.31–33 Meanwhile, the characteristics of reduced Ti3+ would emerge in the LTON with a black color and a wider light absorption edge. The ratios of Ti4+ to Ti3+ were 2.97 (LTON-850), 2.35 (LTON-900), 1.17 (LTON-950) and 1.16 (LTON-1000), respectively, indicating that higher temperatures (850 °C to 950 °C) led to more reduction of Ti4+ to Ti3+. However, at a higher temperature (1000 °C), the ratio of Ti3+/Ti4+ did not further increase. Similarly, the ratios of Ti4+ to Ti3+ were 1.27 (LTON-950-5 h) and 1.07 (LTON-950-15 h) (Fig. S10, ESI†), respectively, indicating that the longer nitriding time would also lead to more reduction of Ti4+ to Ti3+, and the color of LTON-950-15 h would be darker than that of LTON-950-5 h.20,34 The N 1s high-resolution XPS spectra (Fig. 5) indicated two nitrogen states in all samples except for LTON-1000. One nitrogen state clearly exhibited a negative valence at N3− in LaTiO2N with a peak position at 395.5 eV.26 The other nitrogen state had a positive valence, possibly associated with nitric nitrogen, with a peak position at 404.0 eV.35 La(NO3)3 was used as the La3+ additive, however, the NO3− might remain in the synthesized LTON when the nitride temperature is lower than 950 °C. The ratios of N to Ti in all samples were collected to analyze the amount of nitrogen in LaTiO2N, and the specific ratios were 0.36 (LTON-850), 0.46 (LTON-900), 0.65 (LTON-950) and 0.78 (LTON-1000), respectively. Obviously, the amount of nitrogen increased with nitride temperatures. Additionally, with longer nitride times, the amount of nitrogen also increased (the ratios of N to Ti were 0.62 and 0.74 for LTON-950-5 h and LTON-950-15 h, respectively). This suggests that N was more likely to replace O at higher temperatures and longer durations.
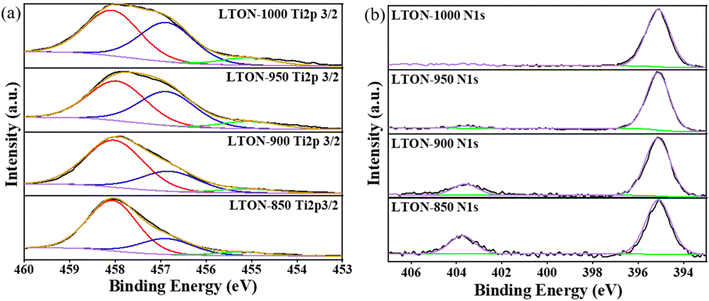 | ||
| Fig. 5 XPS spectra for (a) Ti2p and (b) N 1s of the synthesized LTON under different temperature conditions (850–1000 °C). | ||
In general, the particle size of LTON increases at higher temperature and the BET surface area decreases. However, the XPS spectra show N 1s peaks around 404.0 eV (Fig. 5). The N 1s peaks around 404.0 eV are attributed to N in the nitrite system and are considered to be a burnt residue of the release agent (TBAOH). This peak tended to disappear at higher nitriding temperatures, and as no XRD pattern attributed to the nitrite material was observed in XRD, it can be assumed that the nitrite compounds with an amorphous structure adhere to the surface. The amorphous nitrite compounds may interfere with the pore structure of the LTON, resulting in a smaller BET surface area. It can be assumed that the highest BET specific surface area of LTON was obtained during heat treatment at 950 °C, when the pore expansion due to the decomposition of nitrite compounds with an amorphous structure and the grain growth of LTON due to heat treatment were balanced.
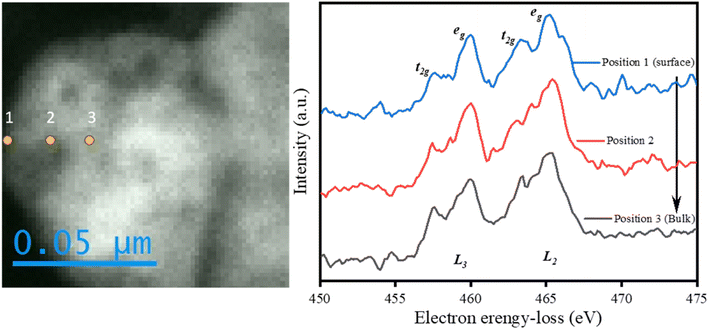
From the XPS data, it was found that the ratio of Ti4+/Ti3+ on the surface (0–3 nm) of LTON-950 was 1.17, and in order to investigate the chemical state for titanium inside of LTON-950, EELS spectra of Ti L2 and L3 at different depths from the surface to the bulk were collected to characterize the integral LTON. The results are shown in Fig. 6. There were obviously one t2g and one eg orbitals present in the L2 and L3 edges, respectively. The two t2g orbitals and two eg orbitals were owing to the 2p core hole spin–orbit coupling of the Ti 3d of octahedral TiOxNy units in LaTiO2N due to crystal field splitting. Combining the two eg orbital peaks at 460.0 eV and 465.3 eV, it was indicated that the value of Ti is +4 from the surface (0–10 nm) to the bulk of LTON. From the high-resolution XPS and EELS spectra, Ti3+ is primarily present on the surface (0–3 nm).36,37
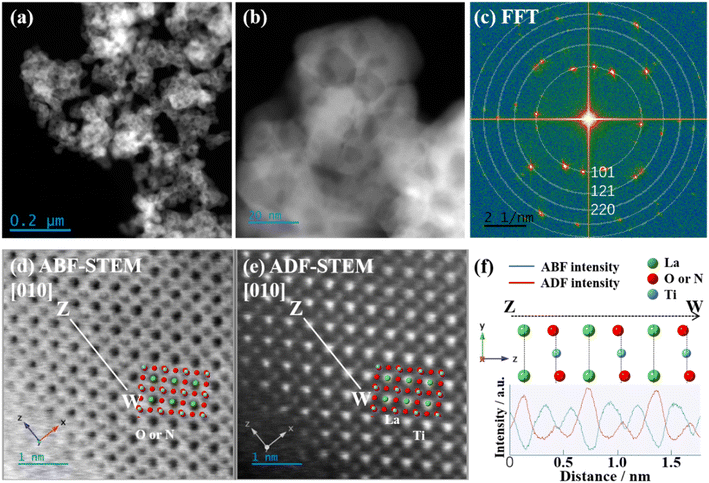
Fig. 7(a) shows an HAADF-STEM image of LTON-950. The observed aggregated particle size (around 100 nm) from the STEM image is consistent with that from the FE-SEM image. Fig. 7(b) shows a magnified HAADF-STEM image of LTON-950. Nanoplate-like particles with a size from 10 to 20 nm were observed, corresponding to the size estimated from the Scherrer formula using the XRD pattern. The FFT image calculated from the STEM image (Fig. 7(b)) exhibits some spot patterns as shown in Fig. 7(c). All obtained d-spaces also align with the d-spaces in the XRD pattern (Fig. 2), indicating the absence of impurity phases in the small aggregated nanoparticles. Atomic resolution ABF and HAADF-STEM images were successfully obtained as shown in Fig. 7(d) and (e). The inset theoretical structure images of the [010] face of LaTiO2N is well overlapped with ABF and HAADF-STEM images. Fig. 7(f) shows the cross-section profiles along the Z–W line in the STEM images. In the Z–W line on the ABF image, the brightest spots represent O and N elements, whereas in the HAADF-STEM image, the brightest spots represent La (atomic number 57) element, and the middle bright spots represent Ti (atomic number: 24) element. It was found that high crystallinity was maintained at the edge parts (outermost surface).
Regarding photocatalytic activity, at first, we evaluated the photocatalytic H2 evolution activity of LaTiO2N synthesized in this study and compared it with LaTiO2N obtained from La2Ti2O7, which was conducted under 420 nm light irradiation with Pt loaded in a 10 vol% methanol sacrificial environment. The results revealed hydrogen evolution rates of approximately 0.1 μmol h−1 for both samples within the first hour. However, as detailed below, the photocatalytic O2 evolution activity exceeded 1 μmol h−1 in the presence of the sacrificial agent. Consequently, our study primarily focused on investigating the photocatalytic activity of LaTiO2N for oxygen production.
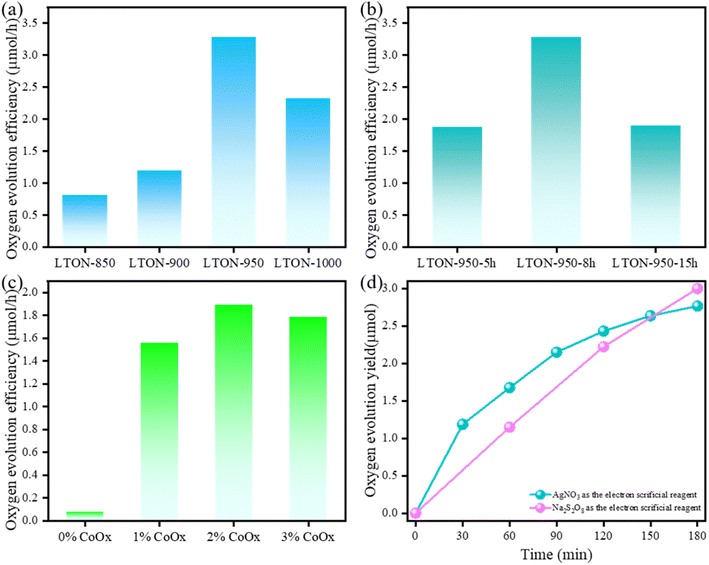
Fig. 8(a) shows the photocatalytic O2 evolution activity of LaTiO2N loaded with 2 wt% CoOx prepared at different nitridation temperatures. Notably, LTON-950 exhibited the highest photocatalytic performance for water oxidation from 0.05 M AgNO3 aqueous solution, reaching 3.28 μmol h−1, with an AQY of 1.3% at 420 nm. Meanwhile, in the visible-light region, LTON exhibited low oxygen evolution efficiency when the wavelength is longer than 550 nm (Fig. S11, ESI†). In contrast, LTON-850 demonstrated a lower oxygen evolution rate of 0.81 μmol h−1, less than a quarter of the performance observed in the best sample (LTON-950). The presence of un-nitrided portions and the impurity (La2Ti2O7) in LTON-850 may account for its diminished photocatalytic performance. It should be noted that, in comparison to the photocatalytic O2 evolution activity (0.91 μmol h−1) of LaTiO2N synthesized from La2Ti2O7, the present LaTiO2N obtained from the titania nanosheet exhibited three times higher O2 evolution activity. Such high photocatalytic activity can be attributed to the high specific surface area and high crystallinity. We speculate that the use of highly crystalline titania nanosheets as intermediates contributed to the synthesis of LaTiO2N, which exhibits high crystallinity even at nanosize.
As for LTON-900 and LTON-1000, they exhibited oxygen evolution rates of 1.19 μmol h−1 and 2.32 μmol h−1, respectively. The nitrogen content in LTON-900 was lower than that in LTON-950, indicating that higher temperatures were conducive to nitridation, and an increased nitrogen content might enhance photocatalytic performance. Despite LTON-1000 having a high nitridation rate, its surface area was considerably lower than that of LTON-950. Nitridation time also proved critical for LTON's photocatalytic performance (Fig. 8(b)); LTON-950-5 h and LTON-950-15 h exhibited oxygen evolution efficiencies of 1.87 μmol h−1 and 1.89 μmol h−1, respectively. Both excessively short and long nitriding times adversely impacted the oxygen evolution efficiency of the samples.
It is generally known that the amount of catalyst strongly affects the oxygen evolution efficiency of LTON. In this study, CoOx was used as a cocatalyst for O2 evolution. Fig. 8(c) shows the relationship between the loading amount of CoOx and the photocatalytic oxygen evolution activity using LTON-950-15 h. When there was no CoOx loaded on the LTON, there was almost no oxygen generated. In contrast, when there was CoOx as the cocatalyst loaded on the surface of LTON, the O2 evolution activity was increased, and the oxygen evolution efficiency was 1.56 μmol h−1 (1%wt CoOx loading), 1.89 μmol h−1 (2 wt% CoOx loading) and 1.79 μmol h−1, respectively, indicating that 2 wt% CoOx was the best amount of cocatalyst. As for LTON, the amount of loaded CoOx might have had little influence on the oxygen evolution efficiency, however, the presence or absence of the cocatalyst had a crucial impact on the oxygen evolution efficiency.
The impact of the electron sacrificial reagent was investigated using LTON-950-15 h loaded with 2 wt% CoOx. AgNO3 and Na2S2O8 were used as sacrificial reagents for O2 evolution. The results are shown in Fig. 8(d). During the first 30 minutes, the oxygen evolution rate in the AgNO3 solution (2.58 μmol h−1) far exceeded that in Na2S2O8 (1.16 μmol h−1). However, after irradiation for 30 minutes, the situation reversed, with mean oxygen evolution efficiencies of 0.59 μmol h−1 in AgNO3 and 0.93 μmol h−1 in Na2S2O8. Additionally, the total amount of oxygen evolution over the entire 3 hours in AgNO3 (2.77 μmol) was lower than that in Na2S2O8 (3.00 μmol). In the case of reaction in AgNO3 aqueous solution, silver deposits on the surface of LaTiO2N as the reaction progresses. On the other hand, in the case of the reaction in Na2S2O8 aqueous solution, Na2S2O8 is reduced to SO42− after receiving two electrons.38 Therefore, no inhibitory species were formed on the surface of samples in Na2S2O8, resulting in relatively constant oxygen evolution efficiency during the irradiation process. Nevertheless, the reduction process of each S2O82− to SO42− requires two electrons, which is more challenging compared to Ag+ that only requires one electron. This could be a possible reason for the larger oxygen evolution of samples in AgNO3 than in Na2S2O8 during the first 30 minutes of irradiation.39
On the relationship between defects and photocatalytic activity, in this system, the oxygen vacancies were the main defects, which originated from the reduction on Ti4+ during the nitridation process. From Fig. 5(a), the high-resolution XPS of Ti 2p3/2 showed the ratios of Ti3+ to Ti4+ were increased from 0.34 (850 °C) to 0.86 (1000 °C), which indicated that the oxygen vacancy concentrations were also increased. From the background absorption of the UV-vis absorption spectrum (Fig. S9(a)†) and the XPS spectrum (Fig. 5(a)), the oxygen vacancy concentrations were estimated in the following order: LTON-850 < LTON-900 < LTON-950 < LTON-1000. However, the LTON-950 showed the highest activity. These results indicate that the defect concentration has little effect on the photocatalytic activity in this system.
Defects, carrier concentration and mobility are important factors influencing photocatalytic activity, but BET surface area may also be an important factor for photocatalytic activity. Indeed, in the case of oxide or oxynitride nanosheet photocatalysis, the restacked nanosheets with a high BET surface area showed higher photocatalytic activity than the parent layered compounds with a low BET surface area.40–43 On the other hand, in the case of the photocatalyst with few defects, the photocatalytic activity is not so much dependent on particle size, as recombination is suppressed even with large crystal sizes.44,45 Thus, photocatalytic activity is rarely determined by a single factor. However, if oxygen defects and other defects in the crystal act strongly as recombination sites, the BET specific surface area may strongly affect the photocatalytic activity. In the case of the sample reported here, TEM analysis showed high crystallinity, but UV-vis spectra showed absorption in the long wavelength region, suggesting the presence of oxygen defects and other defects derived from chemical species such as Ti3+. It can be assumed that samples with a larger BET specific surface area are more likely to suppress intra-bulk recombination. Therefore, in the present study, LaTiO2N with a larger surface area showed higher catalytic activity than LaTiO2N with a smaller surface area.
4. Conclusions
LaTiO2N was successfully synthesized from a titania nanosheet/La3+ hybrid system as a precursor. The nitridation time and temperature played a crucial role in influencing the morphology, BET surface area, nanoparticle size, and the ratio of reduced Ti4+. The optimally synthesized LTON (LTON-950) displayed a small nanoparticle morphology with a high BET surface area of 30.3 m2 g−1. In comparison to traditional LaTiO2N, LTON-950 exhibited a threefold increase in oxygen evolution efficiency under the irradiation of 420 nm light. The AQY for O2 evolution was 1.3% @ 420 nm. In this study, it has been demonstrated that the utilization of highly crystalline nanosheets as intermediates could potentially lead to the synthesis of oxynitrides with high crystallinity and a large surface area.Author contributions
Xiong Tao: methodology, software, validation, formal analysis, investigation, writing – original draft. Kazuto Hatakeyama: formal analysis. Ida Shintaro: conceptualization, investigation, funding acquisition, supervision, writing – review & editing.Conflicts of interest
The authors declare that they have no known competing financial interests or personal relationships that could have appeared to influence the work reported in this paper.Acknowledgements
This research work was partially supported by KAKENHI Grant Number 23K17959 and KAKENHI 23H00314.References
- X. Guan, S. Zong and S. Shen, Homojunction photocatalysts for water splitting, Nano Res., 2022, 15(12), 10171–10184, DOI:10.1007/s12274-022-4704-9.
- K. Maeda and K. Domen, Photocatalytic Water Splitting: Recent Progress and Future Challenges, J. Phys. Chem. Lett., 2010, 1(18), 2655–2661, DOI:10.1021/jz1007966.
- X. Tao, X. Hu, Z. Wen, Y. Ming, J. Li, Y. Liu and R. Chen, Highly efficient Cr(VI) removal from industrial electroplating wastewater over Bi2S3 nanostructures prepared by dual sulfur-precursors: Insights on the promotion effect of sulfate ions, J. Hazard. Mater., 2021, 424, 127423, DOI:10.1016/j.jhazmat.2021.127423.
- T. Su, Q. Shao, Z. Qin, Z. Guo and Z. Wu, Role of Interfaces in Two-Dimensional Photocatalyst for Water Splitting, ACS Catal., 2018, 8(3), 2253–2276, DOI:10.1021/acscatal.7b03437.
- J. Gao, J. Xue, S. Jia, Q. Shen, X. Zhang, H. Jia, X. Liu, Q. Li and Y. Wu, Self-Doping Surface Oxygen Vacancy-Induced Lattice Strains for Enhancing Visible Light-Driven Photocatalytic H2 Evolution over Black TiO2, ACS Appl. Mater. Interfaces, 2021, 13(16), 18758–18771, DOI:10.1021/acsami.1c01101.
- K. Domen, S. Naito, M. Soma, T. Onishi and K. Tamaru, Photocatalytic Decomposition of Water Vapour on an NiO–SrTiO3 Catalyst, J. Chem. Soc., Chem. Commun., 1980,(12), 543–544, 10.1039/C39800000543.
- Y. Yang, J. Chen, X. Liu, M. Qiu, L. Liu and F. Gao, Oxygen vacancy-mediated WO3 nanosheets by etched {200} facets and the efficient visible-light photocatalytic oxygen evolution, New J. Chem., 2019, 43(41), 16391–16395, 10.1039/c9nj04286e.
- K. Maeda, R. Abe and K. Domen, Role and Function of Ruthenium Species as Promoters with TaON-Based Photocatalysts for Oxygen Evolution in Two-Step Water Splitting under Visible Light, J. Phys. Chem. C, 2011, 115(7), 3057–3064, DOI:10.1021/jp110025x.
- E. Nurlaela, S. Ould-Chikh, I. Llorens, J.-L. Hazemann and K. Takanabe, Establishing Efficient Cobalt-Based Catalytic Sites for Oxygen Evolution on a Ta3N5 Photocatalyst, Chem. Mater., 2015, 27(16), 5685–5694, DOI:10.1021/acs.chemmater.5b02139.
- J. Yang, D. Wang, X. Zhou and C. Li, A theoretical study on the mechanism of photocatalytic oxygen evolution on BiVO4 in aqueous solution, Chem, 2013, 19(4), 1320–1326, DOI:10.1002/chem.201202365.
- A. Kasahara, K. Nukumizu, T. Takata, J. N. Kondo, M. Hara, H. Kobayashi and K. Domen, LaTiO2N as a Visible-Light (≤600 nm)-Driven Photocatalyst (2), J. Phys. Chem. B, 2002, 107(3), 791–797, DOI:10.1021/jp026767q.
- F. Zhang, A. Yamakata, K. Maeda, Y. Moriya, T. Takata, J. Kubota, K. Teshima, S. Oishi and K. Domen, Cobalt-modified porous single-crystalline LaTiO2N for highly efficient water oxidation under visible light, J. Am. Chem. Soc., 2012, 134(20), 8348–8351, DOI:10.1021/ja301726c.
- K. Takanabe, Photocatalytic Water Splitting: Quantitative Approaches toward Photocatalyst by Design, ACS Catal., 2017, 7(11), 8006–8022, DOI:10.1021/acscatal.7b02662.
- S. Singla, S. Sharma, S. Basu, N. P. Shetti and T. M. Aminabhavi, Photocatalytic water splitting hydrogen production via environmental benign carbon based nanomaterials, Int. J. Hydrog. Energy, 2021, 46(68), 33696–33717, DOI:10.1016/j.ijhydene.2021.07.187.
- J.-W. Zhang, S. Gong, N. Mahmood, L. Pan, X. Zhang and J.-J. Zou, Oxygen-doped nanoporous carbon nitride via water-based homogeneous supramolecular assembly for photocatalytic hydrogen evolution, Appl. Catal. B: Environ., 2018, 221, 9–16, DOI:10.1016/j.apcatb.2017.09.003.
- M. J. Sampaio, Z. Yu, J. C. Lopes, P. B. Tavares, C. G. Silva, L. Liu and J. L. Faria, Light-driven oxygen evolution from water oxidation with immobilised TiO2 engineered for high performance, Sci. Rep., 2021, 11(1), 21306, DOI:10.1038/s41598-021-99841-5.
- Y. Li, X. Cheng, X. Ruan, H. Song, Z. Lou, Z. Ye and L. Zhu, Enhancing photocatalytic activity for visible-light-driven H2 generation with the surface reconstructed LaTiO2N nanostructures, Nano Energy, 2015, 12, 775–784, DOI:10.1016/j.nanoen.2015.02.003.
- A. E. Maegli, S. Pokrant, T. Hisatomi, M. Trottmann, K. Domen and A. Weidenkaff, Enhancement of Photocatalytic Water Oxidation by the Morphological Control of LaTiO2N and Cobalt Oxide Catalysts, J. Phys. Chem. C, 2013, 118(30), 16344–16351, DOI:10.1021/jp4084162.
- A. Kasahara, K. Nukumizu, T. Takata, J. N. Kondo, M. Hara, H. Kobayashi and K. Domen, LaTiO2N as a Visible-Light (≤600 nm)-Driven Photocatalyst (2), J. Phys. Chem. B, 2002, 107(3), 791–797, DOI:10.1021/jp026767q.
- R. Okada, K. Katagiri, Y. Masubuchi and K. Inumaru, Preparation of LaTiO2N Using Hydrothermally Synthesized La2Ti2O7 as a Precursor and Urea as a Nitriding Agent, Eur. J. Inorg. Chem., 2019,(9), 1257–1264, DOI:10.1002/ejic.201801526.
- W. You and K. Xiang, Controllable synthesis of ultrathin monolayer titanate nanosheet via osmotic swelling to exfoliation of layered titanate, Ceram. Int., 2021, 47(13), 19169–19179, DOI:10.1016/j.ceramint.2021.03.264.
- X. Sun, G. Liu and X. Xu, Defect management and efficient photocatalytic water oxidation reaction over Mg modified SrNbO2N, J. Mater. Chem. A, 2018, 6(23), 10947–10957, 10.1039/c8ta00767e.
- S. Ida, K. Sato, T. Nagata, H. Hagiwara, M. Watanabe, N. Kim, Y. Shiota, M. Koinuma, S. Takenaka, T. Sakai, E. Ertekin and T. Ishihara, A Cocatalyst that Stabilizes a Hydride Intermediate during Photocatalytic Hydrogen Evolution over a Rhodium-Doped TiO2 Nanosheet, Angew. Chem. Int. Ed., 2018, 57(29), 9073–9077, DOI:10.1002/anie.201803214.
- K. Awaya, Y. Koyanagi, K. Hatakeyama, J. Ohyama, L. Guo, T. Masui and S. Ida, Catalytic Toluene Combustion over Metastable Layered Manganese Cobalt Oxide Nanosheet Catalysts, Ind. Eng. Chem. Res., 2021, 60(47), 16930–16938, DOI:10.1021/acs.iecr.1c03339.
- P. A. Fuierer and R. E. Newnham, La2Ti2O7 Ceramics, J. Am. Ceram. Soc., 1991, 74(11), 2876–2881, DOI:10.1111/j.1151-2916.1991.tb06857.x.
- N. G. Sarda, M. Omune, T. Hayashi, A. Chan, S. Kataoka, K.-I. Murai, G. I. N. Waterhouse and T. Moriga, Structural and optical properties of perovskite-type LaTiO2N synthesized using urea or thiourea as co-nitriding agents, J. Eur. Ceram. Soc., 2015, 35(12), 3311–3317, DOI:10.1016/j.jeurceramsoc.2015.02.019.
- D. Li, W. Li, C. Fasel, J. Shen and R. Riedel, Sinterability of the oxynitride LaTiO2N with perovskite-type structure, J. Alloys Compd., 2014, 586, 567–573, DOI:10.1016/j.jallcom.2013.10.071.
- J. Pang, Q. Han, W. Liu, Z. Shen, X. Wang and J. Zhu, Two basic bismuth nitrates: [Bi6O6(OH)2](NO3)4·2H2O with superior photodegradation activity for rhodamine B and [Bi6O5(OH)3](NO3)5·3H2O with ultrahigh adsorption capacity for methyl orange, Appl. Surf. Sci., 2017, 422, 283–294, DOI:10.1016/j.apsusc.2017.06.022.
- S. Ida and T. Ishihara, Recent Progress in Two-Dimensional Oxide Photocatalysts for Water Splitting, J. Phys. Chem. Lett., 2014, 5(15), 2533–2542, DOI:10.1021/jz5010957.
- K. Qi, S.-y. Liu and M. Qiu, Photocatalytic performance of TiO2 nanocrystals with/without oxygen defects, Chin. J. Catal., 2018, 39(4), 867–875, DOI:10.1016/s1872-2067(17)62999-1.
- J. Wang, P. Yang and B. Huang, Self-doped TiO2−x nanowires with enhanced photocatalytic activity: Facile synthesis and effects of the Ti3+, Appl. Surf. Sci., 2015, 356, 391–398, DOI:10.1016/j.apsusc.2015.08.029.
- G. L. Georgiev, T. Sultana, R. J. Baird, G. Auner, G. Newaz, R. Patwa and H. Herfurth, XPS study of laser fabricated titanium/KaptonFN interfaces, Appl. Surf. Sci., 2008, 254(22), 7173–7177, DOI:10.1016/j.apsusc.2008.05.294.
- L. Fang, J. Chen, M. Zhang, X. Jiang and Z. Sun, Introduction of Ti3+ ions into heterostructured TiO2 nanotree arrays for enhanced photoelectrochemical performance, Appl. Surf. Sci., 2019, 490, 1–6, DOI:10.1016/j.apsusc.2019.05.326.
- K. Kawashima, M. Hojamberdiev, H. Wagata, K. Yubuta, S. Oishi and K. Teshima, Chloride Flux Growth of La2TiO5 Crystals and Nontopotactic Solid-State Transformation to LaTiO2N Crystals by Nitridation Using NH3, Cryst. Growth Des., 2014, 15(1), 333–339, DOI:10.1021/cg501397x.
- B. M. Hutton and D. E. Williams, Assessment of X-ray photoelectron spectroscopy for analysis of particulate pollutants in urban air, Analyst, 2000, 125(10), 1703–1706, 10.1039/b005872f.
- T. Autthawong, Y. Chimupala, M. Haruta, H. Kurata, T. Kiyomura, A. S. Yu, T. Chairuangsri and T. Sarakonsri, Ultrafast-charging and long cycle-life anode materials of TiO2-bronze/nitrogen-doped graphene nanocomposites for high-performance lithium-ion batteries, RSC Adv., 2020, 10(71), 43811–43824, 10.1039/d0ra07733j.
- S. B. Lee, W. Sigle and M. Rühle, Investigation of grain boundaries in abnormal grain growth structure of TiO2-excess BaTiO3 by TEM and EELS analysis, Acta Mater., 2002, 50(8), 2151–2162, DOI:10.1016/s1359-6454(02)00059-9.
- E. Nurlaela, T. Shinagawa, M. Qureshi, D. S. Dhawale and K. Takanabe, Temperature Dependence of Electrocatalytic and Photocatalytic Oxygen Evolution Reaction Rates Using NiFe Oxide, ACS Catal., 2016, 6(3), 1713–1722, DOI:10.1021/acscatal.5b02804.
- E. Nurlaela, H. Wang, T. Shinagawa, S. Flanagan, S. Ould-Chikh, M. Qureshi, Z. Mics, P. Sautet, T. Le Bahers, E. Cánovas, M. Bonn and K. Takanabe, Enhanced Kinetics of Hole Transfer and Electrocatalysis during Photocatalytic Oxygen Evolution by Cocatalyst Tuning, ACS Catal., 2016, 6(7), 4117–4126, DOI:10.1021/acscatal.6b00508.
- T. Oshima, O. Ishitani and K. Maeda, Non-Sacrificial Water Photo-Oxidation Activity of Lamellar Calcium Niobate Induced by Exfoliation, Adv. Mater. Interfaces, 2014, 1, 1400131, DOI:10.1002/admi.201400131.
- S. Ida, Y. Okamoto, M. Matsuka, H. Hagiwara and T. Ishihara, Preparation of Tantalum-Based Oxynitride Nanosheets by Exfoliation of a Layered Oxynitride, CsCa2Ta3O10−xNy, and Their Photocatalytic Activity, J. Am. Chem. Soc., 2012, 134(38), 15773–15782, DOI:10.1021/ja3043678.
- H. Suzuki, O. Tomita, M. Higashi and R. Abe, Two-step photocatalytic water splitting into H2 and O2 using layered metal oxide KCa2Nb3O10 and its derivatives as O2 evolving photocatalysts with IO3−/I− or Fe3+/Fe2+ redox mediator, Catal. Sci. Technol., 2015, 5, 2640, 10.1039/C5CY00128E.
- C.-W. Hsu, T. Ideta, K. Awaya, M. Tsushida, T. Sato, K. Yanagisawa, K. Kimoto, K. Hatakeyama, M. Koinuma and S. Ida, Preparation of Multifunctional Metal Oxynitride 2D Crystals and Oriented Transparent Free-Standing Oxynitride Films, Chem. Mater., 2021, 33(15), 6068–6077, DOI:10.1021/acs.chemmater.1c01500.
- K. Kawashima, M. Hojamberdiev, H. Wagata, K. Yubuta, J. J. M. Vequizo, A. Yamakata, S. Oishi, K. Domen and K. Teshima, NH3-Assisted Flux-Mediated Direct Growth of LaTiO2N Crystallites for Visible-Light-Induced Water Splitting, J. Phys. Chem. C, 2015, 119(28), 15896–15904, DOI:10.1021/acs.jpcc.5b03718.
- R. Wang, H. He, L. Shi, D. Du, G. Lin, C. Zhang and X. Xu, Photocarrier Transport in Mesoporous Single-Crystalline LaTiO2N for High-Efficiency Photocatalytic Water Splitting, Adv. Energy Mater., 2023, 2302996, DOI:10.1002/aenm.202302996.
Footnote |
| † Electronic supplementary information (ESI) available. See DOI: https://doi.org/10.1039/d3se01684f |
| This journal is © The Royal Society of Chemistry 2024 |


