 Open Access Article
Evaluation of green chemistry metrics for sustainable recycling of platinum group metals from spent automotive catalysts via bioleaching†
Salman
Karim
 ,
Han Mei
Saw
and
Yen-Peng
Ting
 *
*
Department of Chemical and Biomolecular Engineering, National University of Singapore, Singapore 117585, Singapore. E-mail: chetyp@nus.edu.sg
First published on 6th March 2024
Abstract
This work evaluates sustainability indicators of the biorecovery of platinum group metals (PGM) from spent automotive catalysts (SAC) with due consideration of the environment and efficiency and forms the basis for the evaluation of environmental sustainability. Green chemistry metrics have been quantified for all the processes involved in the bioextraction of PGM from SAC under different experimental conditions. Three different cyanogenic (hydrogen cyanide forming-HCN) bacteria namely Pseudomonas fluorescens, Bacillus megaterium, and Chromobacterium violaceum were used in two-step bioleaching. These bacteria produce cyanide as a secondary metabolite that forms water-soluble complexes with PGM. Bioleaching experiments were performed at different pulp densities (i.e., 0.5% w/v, 1% w/v, 2% w/v, and 4% w/v) to examine their effects on PGM extraction and green metrics. For green metrics calculations, metal and cyanide limiting reactions were performed and four different boundary conditions were defined. Boundary conditions were defined based on the limiting reactants, desired metals, and chemical reactions. Furthermore, green metrics were calculated for an individual metal (i.e., platinum, palladium, or rhodium) and for the overall bioleaching process. This is the first study that reports an in-depth analysis of the environmental sustainability of the PGM biorecovery process by quantifying the green metrics under diverse experimental conditions.
Introduction
The concept of green chemistry evolved in the early 1990s in response to growing concerns about the environmental and health impacts of traditional chemical processes and products.1 The need for developing more sustainable and environmentally friendly alternatives stimulated the development of the principles and practices of green chemistry. Since then, the concept of green chemistry has gained momentum and recognition globally. Over the years, green chemistry has continued to evolve, with new methodologies, tools, and metrics developed to assess and improve the environmental sustainability of chemical processes. Green chemistry metrics refer to a set of quantitative measures and indicators used to evaluate the environmental performance and sustainability of chemical processes and products.1 These metrics provide a systematic way to assess and compare the impact of chemical reactions, processes, and materials on human health and the environment. Table 1 summarizes a list of commonly used green chemistry metrics reported in the literature. These metrics aim to promote the design and development of chemical processes that minimize or eliminate hazardous substances, reduce waste generation, conserve resources, and improve overall environmental sustainability.| Sr. No. | Green metrics | Acronym | Formula | Ref. |
|---|---|---|---|---|
| 1 | Percentage yield | Y |

|
7 |
| 2 | Effective mass yield | YE |

|
8 |
| 3 | Percentage conversion | C |

|
7 |
| 4 | Selectivity | S |

|
7 |

|
||||
| 5 | Atom economy | AE |

|
7 and 9 |
| 6 | Atom utilization | AU |

|
9–11 |
| 7 | Stoichiometric factor | SF |

|
11 and 12 |

|
||||
| 8 | Reaction mass efficiency | RME | Kernel RME (%) = Atom economy × yield | 13 |

|
13 and 14 | |||

|
9, 12 and 14 | |||
| 9 | E-Factor | EF |

|
12, 14 and 15 |
| 10 | Carbon efficiency | CE |

|
9, 11 and 16 |
| 11 | Mass intensity | MI |

|
9, 11 and 16 |
| 12 | Process mass intensity | PMI | PMI = E-factor + 1 | 13 and 15 |

|
15 | |||
| 13 | Mass productivity | MP |

|
12 and 16 |
| 14 | Solvent intensity | SI |

|
15 |
The application of green chemistry metrics in the recycling of precious metals facilitates a circular economy to ensure a continuous and sustainable supply of these metals for future needs. In a circular economy, materials never become waste. Products and materials are kept in circulation through processes like maintenance, reuse, refurbishment, remanufacture, recycling, and composting. In the context of recovering and recycling spent automotive catalysts, establishing a circular economy also reduces the environmental burden of mining new raw materials and reduces the dumping of solid waste in landfills.
Platinum group metals (PGM) such as platinum (Pt), palladium (Pd), and rhodium (Rh) have many valuable characteristics such as high densities, melting points, and conductivities. Properties such as superior catalytic activity, high resistance to oxidation and corrosion, and thermoelectric stability make these metals suitable for many applications in, for instance, automotive, chemical, petroleum, electronics, biomedical, and jewellery industries. In the automotive industry, PGM is used in vehicle exhaust systems to curb the emission of harmful gases. Indeed, automotive catalytic converters are the leading use for PGM, accounting for 63.4% of the global consumption of PGM.2 Furthermore, the enforcement of stricter emission regulations and the adoption of emerging clean technologies such as fuel cells would lead to a multifold increase of the use of PGM in the future. A study on the future sustainable utilization of PGM showed that the primary production of PGM created higher environmental impact than from secondary production.3 Another study on the life cycle of PGM reported that extraction would peak in the period 2020–2050 and that market supply would reach its maximum in 2070–2080.4 This rise in PGM demand may be associated with its increasing use in conventional applications such as automobile emission control and in the growth of the hydrogen economy.
Spent automotive catalysts (SAC) have the potential to be the principal secondary resource of PGM, since autocatalysts consume a major portion of the global production of PGM (50% of produced platinum, 80% of rhodium, and 80% of palladium).5 Currently, the most prevalent methods for PGM recovery from SAC are pyrometallurgical and hydrometallurgical processes.6 The former requires elevated temperatures and high energy consumption, while the latter requires harsh conditions and toxic chemicals, causing them to be costly and resulting in large amounts of hazardous solid and liquid waste.6
In contrast, biorecovery processes for metal recovery are generally more environmentally benign.17 Biometallurgical processes, such as bioleaching, have low energy requirements and need simple processing steps.18,19 Prospective future recovery approaches are likely to emphasize economic and environmental imperatives instead of merely increasing the recovery rate.
To date, there has been little data available on the assessment and quantification of environmental sustainability in the precious metal industry. Studies have not quantified green chemistry metrics for the primary and secondary supply of PGM. Nonetheless, it is recognized that the secondary supply of PGM is pivotal for the sustainable utilization of PGM not only due to its lower impact on the environment but also to meet future increasing demands.6 There is a lack of published work that comprehensively evaluates the green metrics of the bioleaching process in depth. For instance, a study on gold biorecovery from sulfidic ores calculated several green metrics (including percentage yield, conversion, selectivity, stoichiometric factor, atom economy, reaction mass efficiency, and process mass intensity).20 Unfortunately, the work ignored all other metals present in the substrate (i.e., copper, silver, and zinc) which interfere with gold extraction by consuming biogenic-cyanide generated by the bacterium (Bacillus megaterium). In our present study, we not only applied different boundary conditions to overcome these limitations by considering the metals of interest (i.e., PGM) and side reactions but also considered the pretreatment process in evaluating the green chemistry metrics of the bioleaching of PGM. The boundary conditions were defined for each metric depending on the experimental conditions (either metal-limiting or cyanide-limiting reactions). The consideration of green chemistry principles together with industrial perspectives thus allows for a more complete evaluation of a process in terms of feasibility and environmental sustainability.
The study aims to evaluate the environmental sustainability of the bioleaching of PGM from SAC using green chemistry metrics. The metrics evaluated in this study include percentage yield, effective mass yield, percentage conversion, selectivity, atom economy, atom utilization, stoichiometric factor, reaction mass efficiency, E-factor and carbon efficiency. Process metrics such as mass intensity, process mass intensity, mass productivity and solvent intensity were also calculated. To the best of our knowledge, this is the first study that reports an in-depth evaluation of the green chemistry metrics for the biorecovery of PGM.
Experimental section
Materials and methods
Two batch types of SAC (provided by Environmental Solutions (Asia) Pte Ltd and ground to particle size <45 μm) were used in this study. Two-step bioleaching was carried out using three cyanide-forming bacteria: Pseudomonas fluorescens (ATCC BAA-477), Bacillus megaterium (ATCC 14581), and Chromobacterium violaceum (a metabolically engineered strain) as described previosuely.17–19 In brief, monocultures of bacteria were grown in Luria–Bertani (LB)-Miller broth (Tryptone 10 g, Yeast extract 5 g, Sodium chloride 10 g) via repeated preculture and molecular biology grade glycine of 99.6% purity was added in all bacterial cultures as a precursor for hydrogen cyanide (HCN). 5% w/v of D (+) anhydrous glucose of 99% purity was added to the LB-Miller broth for all bacterial cultures as an additional energy source for the bacteria. In two-step bioleaching, batch monocultures of wild and engineered strains were first grown at optimal pH in the absence of SAC to reduce the toxic effects of SAC on the bacteria; upon reaching the mid-logarithmic phase, glycine was added at pre-determined concentrations. Upon reaching maximum cyanide production, the pH of the cultures was adjusted to pre-determined values, followed by the addition of a predetermined amount of SAC. For P. fluorescens and B. megaterium, the bioleaching experiments were conducted at pH 9 and pulp densities of 0.5, 1, and 2% w/v. For C. violaceum, the bioleaching experiments were conducted at pH 9.3 and pulp densities of 0.5, 1, 2, and 4% w/v. All bioleaching experiments were carried out for six days after SAC addition at 30 °C and at 150 rpm. To enhance bioleaching efficiency, ultrasonic-assisted nitric acid pretreatment of SAC was carried out to remove base metals as described previously.6,17–19 In brief, pretreatment was carried out at 80% ultrasound power (96 W, nitric acid concentration 8.5 M, ultrasound duration 80 minutes, ultrasound frequency 37 kHz, and temperature 70 °C). All reagents used were of analytical grade. Aqueous solutions were prepared using ultrapure water (Milli-Q® Reference Water Purification System (Merck)). All glassware, micropipette tips, and Eppendorf tubes used for biological experiments were autoclaved at 121 °C for 20 min.Analytical techniques
Bacterial growth, pH, free cyanide ion concentration, and metal content of untreated, pretreated, and bioleached samples were measured as described previously.17–19 All experiments were conducted in triplicate.Green metrics calculations
The amount of PGM per kilogram of pretreated SAC is given in the ESI (Table S1†). In biological cyanidation, bacteria produce cyanide as a secondary metabolite from glycine by oxidative decarboxylation (eqn (1)). | (1) |
The cyanide ion in solution forms chemically stable complexes with PGM (eqn (2)–(4)) which are water-soluble, thus resulting in the biodissolution of these metals.19
| 2Pt + 8CN− + 2H2O + O2 ↔ 2[Pt(CN)4]2−+4OH− | (2) |
| 2Pd + 8CN− + 2H2O + O2 ↔ 2[Pd(CN)4]2− + 4OH− | (3) |
| 4Rh + 24CN− + 6H2 O + 3O2 ↔ 4[Rh(CN)6]3− + 12OH− | (4) |
The mole ratio of CN![[thin space (1/6-em)]](https://www.rsc.org/images/entities/char_2009.gif) :
:![[thin space (1/6-em)]](https://www.rsc.org/images/entities/char_2009.gif) Pt, CN
Pt, CN![[thin space (1/6-em)]](https://www.rsc.org/images/entities/char_2009.gif) :
:![[thin space (1/6-em)]](https://www.rsc.org/images/entities/char_2009.gif) Pd, and CN
Pd, and CN![[thin space (1/6-em)]](https://www.rsc.org/images/entities/char_2009.gif) :
:![[thin space (1/6-em)]](https://www.rsc.org/images/entities/char_2009.gif) Rh is 4
Rh is 4![[thin space (1/6-em)]](https://www.rsc.org/images/entities/char_2009.gif) :
:![[thin space (1/6-em)]](https://www.rsc.org/images/entities/char_2009.gif) 1, 4
1, 4![[thin space (1/6-em)]](https://www.rsc.org/images/entities/char_2009.gif) :
:![[thin space (1/6-em)]](https://www.rsc.org/images/entities/char_2009.gif) 1, and 6
1, and 6![[thin space (1/6-em)]](https://www.rsc.org/images/entities/char_2009.gif) :
:![[thin space (1/6-em)]](https://www.rsc.org/images/entities/char_2009.gif) 1, respectively. The mass-based calculations are given in the ESI (Table S2†).
1, respectively. The mass-based calculations are given in the ESI (Table S2†).
Determining the limiting reactant
The limiting reactant was determined using the theoretical mole ratio from stoichiometric equations and the results are given in Table 2. To determine the limiting reactant, the theoretical number of moles of cyanide required to completely react with all the PGM (Pt, Pd, and Rh) present in the SAC were calculated by summing up A1, A2 and A3 in Table 2. Following that, the difference between the number of moles of free cyanide available in the system and the theoretical number of moles of cyanide required for complete reaction with the PGM was calculated. Metal was a limiting reactant if the difference was positive as there was sufficient cyanide present in the system. Cyanide was a limiting reactant if the difference was negative.Apportioning of cyanide and setting of boundary conditions
The total number of moles of free cyanide available during bioleaching was apportioned equally amongst Pt, Pd, and Rh (Table 3) (see the ESI for a detailed explanation of the cyanide apportioning†). Table 3, Part 1 shows the free cyanide available to Pt, Pd, and Rh for all metal-limiting and cyanide-limiting reactions except for the case when the percentage yield of Rh is equal to 100% for the cyanide-limiting reactions. Table 3, Part 2 shows the free cyanide available to Pt, Pd, and Rh for cyanide-limiting reactions when the percentage yield of Rh is equal to 100% (fixed at 99% and named “Rh99”, see the ESI for details†). Table 4 shows the list of the metal-limiting and cyanide-limiting reactions during bioleaching.| Metal limiting reactions | Cyanide limiting reactions | |
|---|---|---|
| Percentage yield of Rh < 100% | Percentage yield of Rh = 100% | |
| P. fluorescens at 0.5% w/v pulp density | P. fluorescens at 1% w/v pulp density | P. fluorescens at 2% w/v pulp density |
| B. megaterium at 0.5% w/v pulp density | B. megaterium at 1% w/v pulp density | B. megaterium at 2% w/v pulp density |
| C. violaceum at 0.5% w/v pulp density | C. violaceum at 4% w/v pulp density | |
| C. violaceum at 1% w/v pulp density | ||
| C. violaceum at 2% w/v pulp density | ||
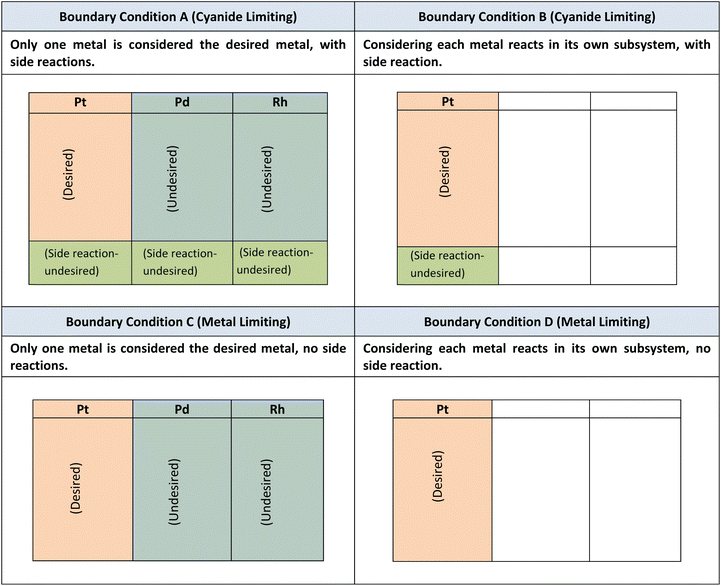
The leaching of Pt, Pd, and Rh from the SAC occurs simultaneously with that of the biogenic cyanide. As cyanide is a common reactant among the three simultaneous chemical reactions (eqn (2)–(4)), the green chemistry metrics for each individual metal cannot be accurately determined. For instance, if the metrics for Pt are calculated using eqn (2), Pd and Rh will be considered as side reactants or unwanted products, which is not the case. Therefore, boundary conditions (BCs) have been defined for each metric (and are given in Table 5). Boundary condition A applies when it is cyanide-limiting, and only one metal is desired, and all others are considered side reactions. Boundary condition B applies when cyanide is limiting, and each metal reacts in its own subsystem, with side reactions occurring. Boundary condition C applies when it is metal-limiting, and only one metal is considered the desired metal, and there are no side reactions. Boundary condition D applies when it is metal-limiting, and each metal reacts in its own subsystem with no side reaction occurring. When cyanide is considered a common reactant for all three metals, only boundary conditions A and C were applied for cyanide and metal limiting reactions, respectively. When cyanide is apportioned amongst PGM, boundary conditions B and D were applied for cyanide and metal limiting reactions, respectively. Boundary conditions B and D are more favourable than boundary conditions A and C, respectively, as they facilitate the comparison of the greenness of the process with respect to individual metals.
It must be noted that boundary conditions are only considered for green metrics for individual metals. For overall equations, all three metal-cyanide complexes are considered desirable and any side reactions with other interfering metals (such as Cu, Zn, Fe, and Ti) are considered undesirable. Boundary conditions A and B are considered when emphasis is placed on cyanide (since cyanide is the limiting reactant). Boundary condition C is used for comparisons between different metals without the consideration of side reactions. Boundary condition D is used when the emphasis is placed on the PGM (where metal is the limiting reactant).
Results and discussion
Percentage recovery of Pt, Pd, and Rh
The percentage recovery of Pt, Pd, and Rh achieved during the two-step bioleaching is given in Table 6. C. violaceum produced higher biogenic cyanide and resulted in higher PGM recovery. Overall, higher PGM recovery was achieved at a low pulp density. At a high pulp density, the inhibitory effect of the SAC on the growth of bacteria is greater, which results in a rapid decline in live cell counts, low cyanide production, and low PGM recovery.| Bacteria | Metal | Pulp density (0.5% w/v) | Pulp density (1% w/v) | Pulp density (2% w/v) | Pulp density (4% w/v) |
|---|---|---|---|---|---|
| P. fluorescens | Pt | 44 | 38 | 30 | N.A |
| P. fluorescens | Pd | 54 | 44 | 36 | N.A |
| P. fluorescens | Rh | 96 | 91 | 83 | N.A |
| B. megaterium | Pt | 40 | 35 | 28 | N.A |
| B. megaterium | Pd | 51 | 41 | 32 | N.A |
| B. megaterium | Rh | 94 | 86 | 77 | N.A |
| C. violaceum | Pt | 69 | 62 | 42 | 30 |
| C. violaceum | Pd | 74 | 69 | 49 | 34 |
| C. violaceum | Rh | 99 | 96 | 84 | 62 |
Green metrics for bioleaching
The green metrics were calculated in the bioleaching experiments under metal-limiting and cyanide-limiting reactions. The metrics were calculated for individual metals as well as for all three metals. The metrics for individual metals were included as they give insights into the metrics calculations with respect to each metal instead of all three PGM together. For overall equations, the boundary condition was always such that all the metal–cyanide complexes are considered desirable. The metrics for metal-limiting and cyanide-limiting reactions are defined and given in Tables 7 and 8, respectively. The calculated metrics for the bioleaching at different pulp densities are given in Tables S3–S6.†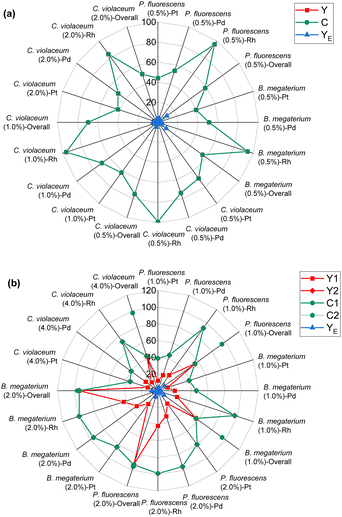 | ||
| Fig. 1 Green metrics for the percentage yield (Y), percentage conversion (C), and effective mass yield (YE) of (a) metal limiting reactions and (b) cyanide limiting reactions. | ||
The percentage yields Y1 and Y2 are calculated for cyanide-limiting reactions, based on different boundary conditions A and B respectively. Y2 measures the efficiency of the reaction of a specific metal without considering the reaction of the other two (undesired) PGM. Thus, the percentage yield Y2 is always higher than Y1 because the value of the denominator of Y2 is smaller than that of Y1.
For cyanide-limiting reactions, percentage conversion was calculated using two methods. In the first method, similar to metal-limiting reactions, only one metal was considered as the desired product. However, the participation of cyanide in side-reactions cannot be ignored, since the total cyanide consumed in the process differs from the number of moles of cyanide consumed in the PGM–cyanide complexes. An example would be for P. fluorescens at the pulp density 1% w/v where the number of moles of cyanide consumed in the PGM–cyanide complex was 6.73 × 10⁻⁵ moles while the number of moles that was consumed in the process was 1.17 × 10⁻⁴ moles. Therefore, percentage conversion (C1) was calculated to gain insights into the conversion of cyanide for each individual metal. In the second method, percentage conversion (C2) was calculated for the overall reaction since the cyanide left in the system is empirically measured at the end of the experiment. C2 measures the overall conversion of cyanide in the system using the empirical number of moles of cyanide left in the system and the number of moles of free cyanide initially present in the system. Therefore, emphasis is given on the use of C2 in subsequent calculations as it accounts for the presence of side reactions for cyanide.
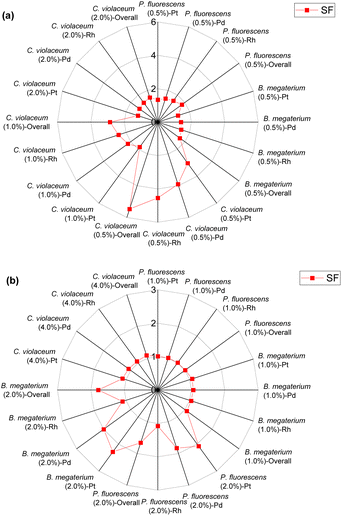 | ||
| Fig. 4 Green metrics for the stoichiometric factor (SF) of (a) metal limiting reactions and (b) cyanide limiting reactions. | ||
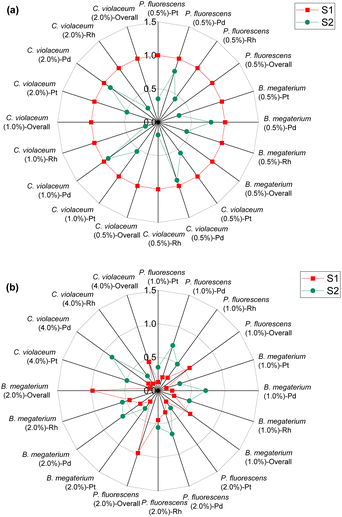
For metal-limiting reactions, the stoichiometric factor decreased at higher pulp density for a given metal and bacteria. The stoichiometric factor is the lowest at 1.25 for Pt when C. violaceum at the pulp density 2% w/v was used for metal-limiting reactions (see Table S4†). For a fixed pulp density, B. megaterium has the lowest stoichiometric factor in metal-limiting reactions, since the bacterium produces the lowest cyanide among the three bacteria. For cyanide-limiting reactions, the stoichiometric factor is higher at higher pulp densities for a specific metal and bacteria. The stoichiometric factor is the lowest at 1.01 for Rh when P. fluorescens at pulp density 1% w/v was used for cyanide-limiting reactions (see Table S5†). This is the opposite of metal-limiting reactions because PGM is non-limiting and more PGM is available at higher pulp densities.
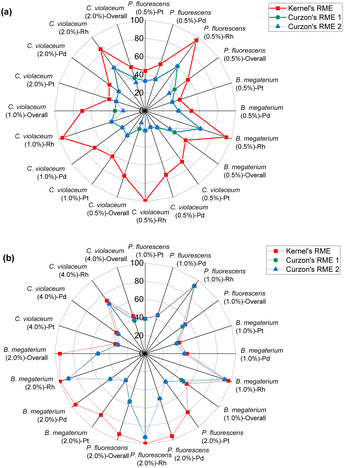 | ||
| Fig. 5 Green metrics for the reaction mass efficiency (RME) of (a) metal limiting reactions and (b) cyanide limiting reactions. | ||
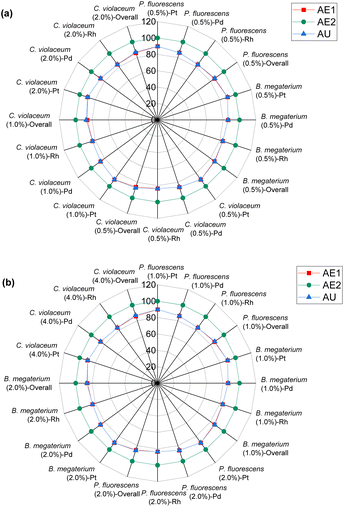
Kernel's RME was 99% for Rh when C. violaceum at a pulp density of 0.5% w/v was used for metal-limiting reactions (see Table S4†) and 96.4% for Rh when B. megaterium at a pulp density of 1% w/v was used for cyanide-limiting reactions (see Table S5†). The trend for Kernel's RME is the same as that for Y for metal-limiting reactions and that for Y2 for cyanide-limiting reactions which follows boundary conditions D and B, respectively. This is because Kernel's RME is dependent on atom economy and percentage yield and AE2 are constant at 100% across all metals, bacteria, and pulp density.
Curzon's RME considers stoichiometric excess of the reagents with Kernel's RME. As Curzon's RME considers cyanide that was split among the PGM, it follows boundary condition B. Curzon's RME 1 and Curzon's RME 2 are similar for individual metals. However, Curzon's RME 2 underestimates the overall value for metal-limiting reactions. This could be caused by an underestimation of Y and/or an overestimation of SF. This shows that there is a possibility that the formula of Y may not be best suited for calculating the yield for the overall reaction since the three different metals were being considered. For cyanide-limiting reactions, RME 2 slightly overestimates the overall value. This could be caused by an overestimation of Y2, an overestimation of AE2 and/or an underestimation of SF. This could also show that the overall stoichiometric factor which considers the three different PGM may not be accurate. For metal-limiting reactions, the overall Curzon's RME1 was the highest for B. megaterium at 40.2% at a pulp density of 0.5% w/v (see Table S3†). For cyanide-limiting reactions, the overall Curzon's RME1 was the highest for P. fluorescens at 55.1% at a pulp density of 2% w/v (see Table S6†). Curzon's RME generally increases with an increase in pulp density for a given bacterium. For metal-limiting reactions, this shows that the decrease in the stoichiometric factor outweighs the decrease in percentage yield. For cyanide-limiting reactions, this shows that the increase in the percentage yield outweighs the increase in the stoichiometric factor.
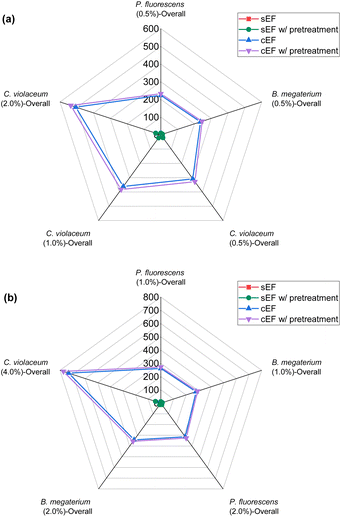 | ||
| Fig. 6 Green metrics for the E-factor (EF) of (a) metal limiting reactions and (b) cyanide limiting reactions. | ||
For sEF, only the unreacted PGM and cyanide are considered waste. The sEF was calculated for all metal and cyanide limiting reactions. The three lowest sEFs were 0.35% when C. violaceum at a pulp density of 1% w/v was used, 0.39% when C. violaceum at a pulp density of 0.5% w/v was used, and 0.53% P. fluorescens at a pulp density of 0.5% w/v was used (see Tables S3 and S4†). There seems to be no obvious trend in the sEF. This could be because of increasing metal residue and decreasing residual cyanide with increasing pulp density. A separate calculation was performed to determine the sEF for ultrasonic-assisted nitric acid pretreatment followed by bioleaching. The values of these metrics considering pretreatment are much higher. With the addition of the mass of nitric acid, the sEF increases with increasing pulp density for a given bacteria, since more acid is required to treat a larger mass of SAC.
The cEF was calculated with the SAC residue which may contain some heavy metals that are not environmentally benign. The masses of glycine and the solvent which is essentially water were not included to prevent skewing the results since they are not environmentally harmful. The cEF increases with increasing pulp density for a specific bacterium. The lowest cEF is 222.70% for P. fluorescens at a pulp density of 0.5% w/v followed by 235.84% for B. megaterium at pulp density 0.5% w/v (see Table S3†). Similar to sEF, a second cEF metric was calculated to include the mass of nitric acid used during pretreatment. The lowest cEF while accounting for pretreatment is 231.85% for P. fluorescens at a pulp density of 0.5% w/v followed by 245.53% for B. megaterium at a pulp density of 0.5% w/v (see Table S3†).
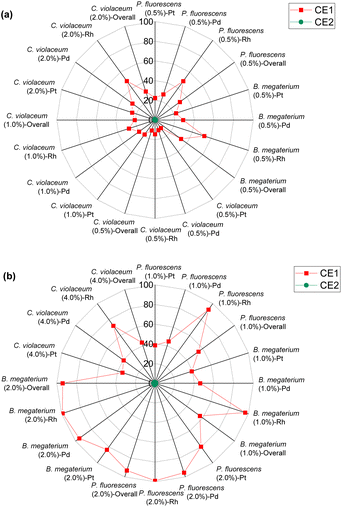 | ||
| Fig. 7 Green metrics for the carbon efficiency (CE) of (a) metal limiting reactions and (b) cyanide limiting reactions. | ||
For metal-limiting reactions, the overall CE1 was highest at 32.67% when B. megaterium at a pulp density of 0.5% w/v was used followed by 31.16% P. fluorescens at the same pulp density was used (see Table S3†) and C. violaceum at a pulp density of 2% w/v was used (see Table S4†). This is because B. megaterium produces the least cyanide amongst the three bacteria. Carbon efficiency increases with increasing SAC amounts for metal-limiting reactions since more PGM is available to react with the cyanide, forming the desired metal–cyanide complex. The results of CE1, which accounts for cyanide, are exactly the same as for Y2 for cyanide-limiting reactions as the equations are similar. This metric which accounts for cyanide follows boundary condition B as the number of moles of cyanide which were split among individual PGM was considered for this green metric. CE2 accounts for glycine instead of cyanide. Since the number of moles of glycine were not split to each individual PGM, the boundary condition A applies for CE2. The results for carbon efficiency are generally the highest for Rh, followed by that for Pd and Pt for a specific bacteria and pulp density.
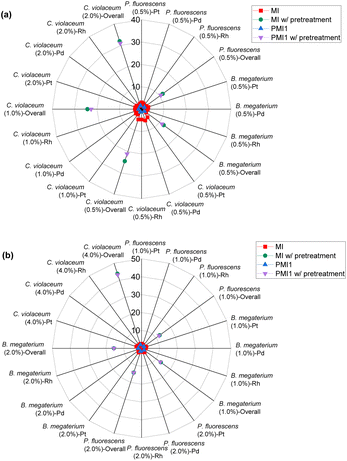 | ||
| Fig. 8 Green metrics for the mass intensity (MI) and process mass intensity (PMI) of (a) metal limiting reactions and (b) cyanide limiting reactions. | ||
MI is calculated based on the definition of mass intensity while PMI1 is calculated based on the fact that PMI1 is equal to sEF +1 (see Table 1). However, PMI1 slightly underestimates MI. An explanation would be that MI does not account for side reactions of CN, hence, overestimating the mass of reagents used to produce the desired metal-cyanide complexes. Another possible explanation is that E-factor could be underestimating the waste produced by the system. This underestimation could indicate that the PGM may have participated in side-reactions such as sorption on bacterial surface, which would reduce the percentage yield and increase the E-factor. The lowest overall MI is 1.81 for P. fluorescens at a pulp density of 2% w/v and 1.93 for B. megaterium at the same pulp density (see Table S6†). MI generally decreases with increasing pulp density for a specific bacterium. This could be because the mass of the metal–cyanide complexes increases more than proportionately to the increase in the mass of PGM since the mass of cyanide in the system for a specific bacteria is similar regardless of pulp density. The trend in the results of PMI1 follows the trend of the E-factor.
A separate metric for MI was calculated to account for the mass of nitric acid used in the pretreatment step. The lowest MI while considering pretreatment is 11.64 for P. fluorescens at a pulp density of 0.5% w/v (see Table S3†), 12.18 for B. megaterium at the same pulp density (see Table S3†) and 12.47 for P. fluorescens at pulp density 1% w/v (see Table S5†). The values of MI while considering pretreatment for C. violaceum are relatively higher than that with P. fluorescens and B. megaterium at each pulp density because the SAC sample (SAC batch II) used for C. violaceum required slightly more nitric acid for optimized pretreatment. As the number of moles of cyanide used in the calculation is the number of moles of cyanide that was split for each individual PGM, MI follows boundary condition B.
As PMI1 utilizes the value calculated from E-factor, only the overall PMI1 can be calculated. PMI2 gives higher values compared to MI and PMI1 as it accounts for the solvent used in the system. The lowest PMI2 values were 16![[thin space (1/6-em)]](https://www.rsc.org/images/entities/char_2009.gif) 507.98 for P. fluorescens at a pulp density of 2% w/v followed by 18
507.98 for P. fluorescens at a pulp density of 2% w/v followed by 18![[thin space (1/6-em)]](https://www.rsc.org/images/entities/char_2009.gif) 020.30 for B. megaterium at the same pulp density (see Table S6†) and 19
020.30 for B. megaterium at the same pulp density (see Table S6†) and 19![[thin space (1/6-em)]](https://www.rsc.org/images/entities/char_2009.gif) 250.40 for C. violaceum at a pulp density of 4% w/v (see Table S5†). Generally, PMI2 decreases with increasing pulp density, since mass of the PGM-cyanide complexes produced increases, thus increasing the denominator. The numerator remains relatively constant across all experiments since the mass of the PGM and cyanide used in the system is much lower than the mass of the solvent which is 100 g. A second metric for PMI2 was calculated to incorporate the effect of nitric acid in the pretreatment process. As the mass of the nitric acid used is relatively small compared to the mass of water, the aforementioned trend in the results of PMI2 without accounting for pretreatment remains the same.
250.40 for C. violaceum at a pulp density of 4% w/v (see Table S5†). Generally, PMI2 decreases with increasing pulp density, since mass of the PGM-cyanide complexes produced increases, thus increasing the denominator. The numerator remains relatively constant across all experiments since the mass of the PGM and cyanide used in the system is much lower than the mass of the solvent which is 100 g. A second metric for PMI2 was calculated to incorporate the effect of nitric acid in the pretreatment process. As the mass of the nitric acid used is relatively small compared to the mass of water, the aforementioned trend in the results of PMI2 without accounting for pretreatment remains the same.
Metrics correlation
The preceding discussion has examined numerous green chemistry metrics in the bioleaching of SAC for PGM recovery. A cross comparison of these metrics under different operating conditions (Tables S3–S6†) is summarised in Tables S7 and S8.† Percentage yield (Y) and conversion (C) are related and may show similar results under certain conditions; the former focuses on the efficiency of the chemical reaction to produce the desired product, whereas the latter highlights the extent a reactant has been transformed into the product. For metal-limiting reactions, the desired products are monometallic compounds, where the amount of reactant consumed is equivalent to the amount converted to products in the absence of by-products with the metal. This is consistent with the boundary condition D used for metal-limiting reactions. The focus of the green metric calculations shifts to cyanide for cyanide-limiting reactions. The calculations of Y2 and C1 are similar as they consider the amount of cyanide consumed in the metal products while ignoring the participation of cyanide in the side reactions. It is consistent with the formula for carbon efficiency since the sole consideration for carbon in the chemical reaction is from the cyanide.Since atom economy considers the proportion of atoms from the reactants that end up in the final product i.e., the efficiency of atom usage in a chemical reaction, a higher percentage yield is often indicative of a more atom-efficient process, thus establishing a direct relationship between these two metrics. A comparison between the stoichiometric factor and atom economy reveals how well stoichiometry aligns with the efficient use of atoms. Atom utilization provides a similar assessment as atom economy but may consider atoms used in by-products or unconverted reactants (see boundary conditions in Table 5). Thus, both these metrics give insights into the overall efficiency of atom utilization in a process. A detailed cross-comparison unveils the balance between atom efficiency and the comprehensive utilization of all reactant atoms, shedding light on the broader environmental impact of the reaction. A higher atom economy coupled with high selectivity signifies a process that not only efficiently uses atoms but also minimizes the formation of by-products, thus contributing to a greener and more sustainable process.
E-Factor shares a fundamental connection with PMI, since both are related to waste generation; a cross-comparison reveals the efficiency of the process in minimizing waste generation and managing material resources effectively. Comparing atom utilization and E-factor can help evaluate the environmental impact of unused atoms in by-products and waste. E-Factor can be cross-compared with percentage conversion to elicit the environmental impact associated with the degree of conversion. Higher conversions may influence the E-factor and, consequently, the overall environmental sustainability of the process. E-Factor can also be cross-compared with percentage yield. This analysis provides a nuanced understanding of how the efficiency of the process in producing the desired product relates to the overall waste generated, offering insights into the overall environmental sustainability of the reaction.
The relationship between RME and PMI can be explored to understand how efficiently the reactants mass is converted to products mass. High RME coupled with lower PMI may indicate a process with reduced environmental impact since reactants are converted to products more efficiently. Another important correlation is between YE and MI which provides insights into the efficiency of the process in terms of both yield and overall mass. This is because YE considers the yield in relation to the total mass processed while MI assesses the overall mass of the process.
The relation between SF and RME reveals how well the stoichiometry aligns with the efficient conversion of reactants into products i.e., the overall efficiency of resource utilization. Understanding this relationship is crucial for optimizing reactions towards greener chemistry, ensuring that the stoichiometric balance contributes to higher RME. Similarly, C and RME measure the effectiveness of converting reactants into desired products. Comparing these metrics can provide insights into how efficiently the converted material contributes to the final product. The utilization of carbon-containing resources in the process and the ratio of desired product to undesired by-products are correlated to give the overall carbon efficiency and selectivity. A comparison shows the impact of S on the overall CE of the reaction. This cross-comparison provides valuable insights into the relationship between product selectivity and the judicious utilization of carbon-containing resources, crucial for the environmental sustainability of chemical processes.
CE can be compared with AU to evaluate the carbon footprint in relation to the comprehensive use of atoms in the reaction. This comparison provides insights into how efficiently carbon resources are utilized, considering both desired products and by-products. The relation between Y and S highlights the efficiency of the process in producing the desired product while minimizing by-products. CE and PMI provide useful insights to assess the environmental impact of the process in terms of carbon utilization and overall mass.
Exploration of the relationships amongst these green metrics provides nuanced insights into the connections among these metrics, facilitating a more holistic understanding of the environmental sustainability aspects of chemical processes.
Conclusions
This study assesses the environmental sustainability of a biometallurgical process for PGM recovery from SAC. Pioneering in its scope, it holistically examines green chemistry metrics in bioleaching with P. fluorescens, B. megaterium, and C. violaceum under different conditions. SAC composition, pulp density, pretreatment, cyanide concentration, limiting reagent, and bioleaching efficiency significantly impact these metrics.Assumptions were made for cyanide–PGM reactions, and defining boundary conditions, metrics were calculated for individual and simultaneous Pt, Pd, and Rh recovery under metal and cyanide limitations. High atom economy and effective mass yield show bioleaching as an atom efficient and green process for the recovery without the use of hazardous solvents. Reaction mass efficiency highlights Rh recovery as the most efficient and green process compared to Pt and Pd recovery.
High selectivity and atom utilization, coupled with low E-factor and mass intensity values, show yield efficiency and reduced waste in bioleaching. By eliminating the need for harmful reagents and minimizing the generation of wastewater and by-products, along with lower energy consumption, bioleaching is shown to be a green and sustainable approach for PGM recovery.
Different boundary conditions due to the complexity of the chemical reactions in the system were examined to evaluate the green metrics. This introduces a challenge by limiting a comprehensive comparative analysis amongst the different metrics, and thus constrains a holistic assessment of the environmental sustainability of the process. To address this, a correlational study was conducted which involved analyzing multiple cross-comparisons under various operating conditions. The correlational study captures the synergies and conflicts amongst the different metrics, thus summarising some of the complex environmental factors associated with the biometallurgical process.
This study focuses on environmental and efficiency indicators. Future work should be extended to include energy and economic indicators for a more comprehensive techno-economic analysis. This will provide a more complete and robust tool for developing sustainable recycling processes.
Author contributions
Salman Karim: conceptualization, methodology, investigation, software, formal analysis, writing – original draft, and writing – review and editing. Han Mei Saw: methodology, investigation, and writing – original draft. Yen-Peng Ting: conceptualization, supervision, project administration, funding acquisition, and writing – review and editing.Conflicts of interest
The authors declare that they have no known competing financial interests or personal relationships that could have appeared to influence the work reported in this paper.Acknowledgements
Salman Karim gratefully acknowledges the National University of Singapore (NUS) for providing a research scholarship. The spent automotive catalyst used in this work was kindly provided by Environmental Solutions (Asia) Pte Ltd. This work was supported by a grant (R-279-000-495-114) from the Academic Research Fund of the Ministry of Education, Singapore.References
- P. Anastas and N. Eghbali, Chem. Soc. Rev., 2010, 39, 301–312 RSC.
- D. Xun, H. Hao, X. Sun, Z. Liu and F. Zhao, J. Cleaner Prod., 2020, 266, 121942 CrossRef.
- M. Saurat and S. Bringezu, J. Ind. Ecol., 2008, 12, 754–767 CrossRef CAS.
- H. U. Sverdrup and K. V. Ragnarsdottir, Resour., Conserv. Recycl., 2016, 114, 130–152 CrossRef.
- A. Fornalczyk and M. Saternus, Metalurgija, 2011, 50, 261–264 CAS.
- S. Karim and Y.-P. Ting, Resour., Conserv. Recycl., 2021, 170, 105588 CrossRef CAS.
- C. R. McElroy, A. Constantinou, L. C. Jones, L. Summerton and J. H. Clark, Green Chem., 2015, 17, 3111–3121 RSC.
- T. Hudlicky, D. A. Frey, L. Koroniak, C. D. Claeboe and L. E. Brammer Jr., Green Chem., 1999, 1, 57–59 RSC.
- A. D. Curzons, D. J. C. Constable, D. N. Mortimer and V. L. Cunningham, Green Chem., 2001, 3, 1–6 RSC.
- R. A. Sheldon, C. R. Acad. Sci., Ser. IIc: Chim., 2000, 3, 541–551 CrossRef CAS.
- M. Tobiszewski, M. Marć, A. Gałuszka and J. Namieśnik, Molecules, 2015, 20, 10928–10946 CrossRef CAS PubMed.
- G. J. Ruiz-Mercado, R. L. Smith and M. A. Gonzalez, Ind. Eng. Chem. Res., 2012, 51, 2309–2328 CrossRef CAS.
- A. P. Dicks and A. Hent, Green Chemistry Metrics: A Guide to Determining and Evaluating Process Greenness, Springer Cham, 1st edn, 2015 Search PubMed.
- J. Andraos, Org. Process Res. Dev., 2005, 9, 519–519 CrossRef CAS.
- R. A. Sheldon, Green Chem., 2017, 19, 18–43 RSC.
- D. J. C. Constable, A. D. Curzons and V. L. Cunningham, Green Chem., 2002, 4, 521–527 RSC.
- S. Karim and Y.-P. Ting, J. Environ. Chem. Eng., 2023, 11, 110987 CrossRef CAS.
- S. Karim and Y.-P. Ting, J. Cleaner Prod., 2020, 120199, DOI:10.1016/j.jclepro.2020.120199.
- S. Karim and Y.-P. Ting, Bioresour. Technol. Rep., 2022, 18, 101069 CrossRef CAS.
- F. Faraji, J. Wang, H. Mahandra and A. Ghahreman, ACS Sustainable Chem. Eng., 2021, 9, 236–245 CrossRef CAS.
Footnote |
| † Electronic supplementary information (ESI) available. See DOI: https://doi.org/10.1039/d3gc03918h |
| This journal is © The Royal Society of Chemistry 2024 |


