 Open Access Article
Creative Commons Attribution 3.0 Unported Licence
Chain-length dependent organisation in mixtures of hydrogenous and fluorous ionic liquids†
Naomi S.
Elstone
 a,
Emily V.
Shaw
a,
Karina
Shimizu
a,
Emily V.
Shaw
a,
Karina
Shimizu
 *b,
Joshua
Lai
 a,
Bruno
Demé
c,
Paul D.
Lane
 d,
Matthew L.
Costen
 d,
Kenneth G.
McKendrick
 d,
Sarah
Youngs
e,
Sarah E.
Rogers
 e,
Jose N.
Canongia Lopes
 b,
Duncan W.
Bruce
 *a and
John M.
Slattery
 *a
*a
aDepartment of Chemistry, University of York, Heslington, York YO10 5DD, UK. E-mail: john.slattery@york.ac.uk; duncan.bruce@york.ac.uk
bCentro de Química Estrutural, Institute of Molecular Sciences, Instituto Superior Técnico, Universidade de Lisboa, Av. Rovisco Pais, Lisboa 1049 001, Portugal. E-mail: karina.shimizu@tecnico.ulisboa.pt
cInstitut Laue-Langevin, Grenoble 38000, France
dInstitute of Chemical Sciences, School of Engineering and Physical Sciences, Heriot-Watt University, Edinburgh EH14 4AS, UK
eISIS Neutron and Muon Source, Harwell Campus, Didcot OX11 0QX, UK
First published on 5th April 2024
Abstract
As part of an ongoing study of the structure and properties of mixtures of ionic liquids in which one component has a hydrocarbon chain and the other a semiperfluorocarbon chain, we now report a study of the mixtures [C8MIM]1−x[C10MIM-F17]x[Tf2N], [C10MIM]1−x[C8MIM-F13]x[Tf2N] and [C10MIM]1−x[C10MIM-F17]x[Tf2N], where [C8MIM][Tf2N] is 1-methyl-3-octylimidazolium bis(trifluoromethylsulfonyl)imide, [C10MIM][Tf2N] is 1-decyl-3-methylimidazolium bis(trifluoromethylsulfonyl)imide, [C8MIM-F13][Tf2N] is 1-(1H,1H,2H,2H-perfluorooctyl)-3-methylimidizolium bis(trifluoromethylsulfonyl)imide and [C10MIM-F17][Tf2N] is 1-(1H,1H,2H,2H-perfluorodecyl)-3-methylimidizolium bis(trifluoromethylsulfonyl)imide. The mixtures were investigated using small-angle X-ray (SAXS) and neutron (SANS) scattering complemented by molecular dynamics simulations (with viscosity and surface tension measurements also possible for the mixtures [C10MIM]1−x[C8MIM-F13]x[Tf2N]). Unlike previous studies of [C8MIM]1−x[C8MIM-F13]x[Tf2N], where no strong evidence of alkyl/fluoroalkyl chain segregation or triphilic behaviour was seen (Elstone et al., J. Phys. Chem. B, 2023, 127, 7394–7407), these new mixtures show the formation of small aggregates of varying sizes of each component, even though all were co-miscible across the full range of compositions. Thus, while a clear polar non-polar peak (PNPP) was observed at large or small values of x, at intermediate compositions the small-angle neutron scattering at low q was dominated by scattering from these small aggregates, while at other compositions, there was little or no evidence of the PNPP. The origins of this behaviour are discussed in terms of inter-chain interactions.
Introduction
The preparation of mixtures of ionic liquids (ILs) represents a time- and cost-effective way to generate families of materials whose properties can be tuned by simply changing the proportion of each component.1,2 This offers some significant advantages to the alternative approach of synthesising many individual, bespoke ILs to access a range of liquids with different properties. The field of supported ionic liquid phase (SILP) catalysis is one where mixtures of ILs have the possibility to have significant impact.3–7 SILPs are generally prepared by coating the surface of porous, solid supports such as silica with an IL film containing a catalyst, which can be either a homogeneous or a nanoparticle system.8–16 In both cases, the solvent environment around the active site(s) of the catalyst and the gas/liquid interface (where gaseous reagents are employed) will have a profound effect on reactivity, and both naturally depend upon the properties of the IL in which the catalyst is dissolved/suspended. As such, methods to prepare, understand and tune the behaviour of IL mixtures will provide important approaches to allow the rational design of more effective SILP catalyst systems.We have reported previously on the surface and bulk composition of alkyl-functionalised imidazolium ILs and their mixtures (1) using a combination of reactive-atom scattering (RAS) in conjunction with laser-induced fluorescence (RAS-LIF),17–23 and with mass spectrometry (RAS-MS) along with surface tension to characterise the gas–liquid interface.24–28 Small-angle neutron (SANS) and X-ray (SAXS) scattering alongside viscometry and conductivity were then employed to characterise the bulk material.22,25,29,30 These studies were complemented by molecular dynamics (MD) simulations, which in each case brought valuable additional understanding. Thus, for example, it was possible to demonstrate the preference of long-chain ILs to concentrate at the gas–liquid or vacuum–liquid interface when dissolved in a short-chain host,22 and percolation behaviour as a function of chain length was established for a wide range of mixtures.29 Similar behaviour in related mixtures has been explored in detail by others using SAXS,31–33 second harmonic generation,34 NMR spectroscopy,35 angle-resolved XPS,36 X-ray reflectivity,37 and combinations of other techniques.38–41 Other recent studies on IL mixture systems have explored concepts such as hydrogen-bonding in protic IL mixtures,42 machine learning for IL mixture property prediction,43 and the pressure-dependent properties of IL mixtures.44
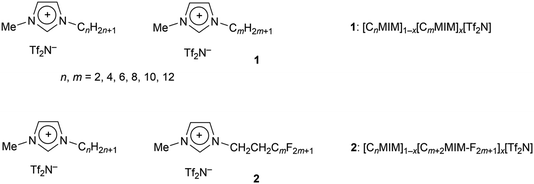
More recently, our attention has turned to binary mixtures where one component has a hydrocarbon chain and the other a fluorocarbon chain (Fig. 1).23,30 Interest in such mixtures arises from preliminary observations that show preferential location of fluorocarbons at the surface, combined with the possibilities offered by local organisation given the predisposition of at least longer hydrocarbon and fluorocarbon chains to de-mix in the bulk,26,45 and at the vacuum–liquid interface.46–48 Recent work has shown that these effects can be applied to metal complexes of relevance to SILP systems to affect surface enrichment, which may prove beneficial in catalysis.28,49,50 As part of our studies in the area, we recently reported on a combined viscometry, SANS, SAXS and MD study of the binary mixtures 2 (n = 8), which we found to be miscible continuously across the range of compositions.26,30 Although hinted at in previous data on a related system,45 observed no strong evidence for triphilic behaviour, i.e. segregation of fluoroalkyl and alkyl chains, behaviour in these mixtures like that seen in related ILs.51–53 This may have been due to the length of the fluoroalkyl chains – only six of the carbon atoms in the chain were fluorinated, as a C2H4 unit is included in between the fluoroalkyl chain and the imidazolium ring to aid the synthesis of these salts. It has been recognised in previous work that so called ‘fluorous’ effects are often stronger with increasing fluoroalkyl chain length.54 Therefore, in order to investigate the effect of chain length on such mixtures, we now report an analogous study using longer-chain-length materials (2) in which both chains are the same overall length (n = 10, m = 8) or where they differ by two carbon atoms (n = 8, m = 8 and n = 10, m = 6), plus some limited data where n = 12, m = 10.
Results
Synthesis
The ILs were prepared as described previously,23,26,30 as shown in Fig. 2, and full details are given in the ESI.† The hydrogenous bromide salts were prepared in yields that were very close to quantitative, while anion metathesis showed yields >90% after rigorous purification and drying. In order to minimise side reactions, which are promoted at higher temperatures, the quaternisation reactions to prepare the intermediate semiperfluoroalkyl iodides were run at moderate temperatures (60 °C) with long reaction times of around 3 weeks. Yields were nonetheless good at >70%. Metathesis to the [Tf2N]− salts was performed in a similar way to the hydrogenous materials, although with lower isolated yields (typically ca. 60%) and the final products invariably retained some amber colouration after purification. Despite this, the products showed no evidence of iodine/iodide impurities, based on AgNO3 tests, combustion analysis results were within the expected tolerance for C, H and N and NMR spectra showed no evidence of impurities, within the sensitivity of the technique. Presumably, a very low concentration of a coloured impurity with a large molar absorption coefficient in the visible region is present that does not otherwise affect the analytical data, or in our experience the scattering and physical property data for these materials.Mixtures prepared for study
Studies were undertaken on the mixtures [C10MIM]1−x[C10MIM-F17]x[Tf2N], [C8MIM]1−x[C10MIM-F13]x[Tf2N] and [C10MIM]1−x[C8MIM-F13]x[Tf2N] over the compositional range where x = 0, 0.05, 0.2, 0.35, 0.5, 0.65, 0.8, 0.95 and 1. [C10MIM]1−x[C8MIM-F13]x[Tf2N] mixtures were liquid at room temperature for all of these compositions, while mixtures of [C10MIM]1−x[C10MIM-F17]x[Tf2N] and [C8MIM]1−x[C10MIM-F13]x[Tf2N] with the highest proportion of [C10MIM-F17][Tf2N] tended to be solid at room temperature. Thus, the higher melting point of [C10MIM-F17][Tf2N] precluded accurate measurement of its density with the vibrating tube densitometer used for the other ILs, which in turn precluded determination of surface tension via the pendant drop method, which requires the density of the liquid to be known. Likewise, instrumental constraints meant that viscosity data could not be acquired across the full compositional range in these mixtures.Surface tension and viscosity for the mixtures [C10MIM]1−x[C8MIM-F13]x[Tf2N]
A shown in Fig. 3, the viscosity of [C8MIM-F13][Tf2N] (1083 cP at 25 °C) is significantly higher than that of [C10MIM][Tf2N] (120 cP at 25 °C). The relationship between composition and viscosity for mixtures of these two ILs is not linear, rather it broadly follows the logarithmic form of the Arrhenius mixing rule, albeit with some deviation.55 Interestingly, and in common with data from [C8MIM]1−x[C8MIM-F13]x[Tf2N] mixtures,30 the deviation from the Arrhenius mixing rule is negative, such that the increased viscosity of the fluoro component is somehow damped compared to what would be expected based on the simple mixing relationship. This is compared with data from [C12MIM]1−x[C2MIM]x[Tf2N] mixtures, where the deviation from the Arrhenius mixing rule was in fact positive.22 This was discussed in previous work in terms of the formation of more organised non-polar domains with increasing x in [C12MIM]1−x[C2MIM]x[Tf2N], which resist sheer stress, and disruption of ion packing when rigid fluoroalkyl chains are introduced in [C8MIM]1−x[C8MIM-F13]x[Tf2N], which does the opposite.22,30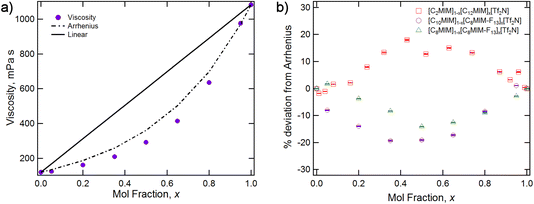 | ||
| Fig. 3 (a) Viscosity measured at 25 °C for the mixture series [C10MIM]1−x[C8MIM-F13]x[Tf2N], showing the actual data, the Arrhenius fit and the hypothetical linear relationship with composition. (b) Percentage deviation from Arrhenius model for [C10MIM]1−x[C8MIM-F13]x[Tf2N] and related mixtures.30 | ||
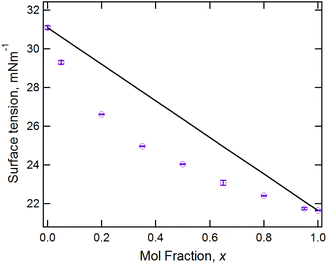
Fig. 4 shows the surface tension data for the [C10MIM]1−x[C8MIM-F13]x[Tf2N] mixtures and reveals both the lower surface tension of the fluorinated IL and, through the non-linear variation with composition, the fact that the fluorinated component preferentially accumulates at the air–liquid interface. Once more, this is similar to the behaviour reported for the mixture series [C8MIM]1−x[C8MIM-F13]x[Tf2N]. Measurement of the density as a function of composition showed that the variation in density is linear, based on composition, for these mixtures (Table S1†).
Scattering experiments
Scattering experiments were performed on all IL mixture systems, at 20 °C for [C10MIM]1−x[C8MIM-F13]x[Tf2N] and 60 °C for the other mixture systems, due to the higher melting points of some compositions. Small-angle neutron scattering (SANS) measurements were carried out on beamline D16 at the ILL in Grenoble and full experimental details are contained in the ESI.† Small-angle X-ray scattering (SAXS) measurements were carried out on a Bruker D8 Discover diffractometer equipped with a bespoke temperature-controlled, bored-graphite rod furnace, custom built at the University of York. Cu-Kα (λ = 0.154![[thin space (1/6-em)]](https://www.rsc.org/images/entities/char_2009.gif) 056 nm) radiation was used, generated from a 1 μS microfocus source. As described previously, X-ray and neutron scattering data for ILs often display three key features in different regions of the scattering vector q.56 At higher q (around 1.3 to 1.4 Å−1) the so called contact peak (CP) is related to nearest-neighbour correlations.30 At intermediate values of q (around 0.8 to 0.9 Å−1) the charge-ordering peak (COP) is often interpreted in terms of cation–anion–cation and anion–cation–anion correlations. In addition, in ILs containing ions with sufficiently long (typically > C6) alkyl chains, an additional peak, the polar non-polar peak (PNPP) is often seen at lower q (around 0.4 Å−1, but strongly dependent on chain length). This is indicative of the formation of a local bilayer structure in the IL with short-range order resulting from separation of the polar (anion and cationic headgroup) and non-polar (alkyl chain) components, and accompanies the formation of a percolated structure. This nanostructure in ILs has been known for some time and is often studied using small-angle scattering and molecular dynamics (MD) simulations.57–62
056 nm) radiation was used, generated from a 1 μS microfocus source. As described previously, X-ray and neutron scattering data for ILs often display three key features in different regions of the scattering vector q.56 At higher q (around 1.3 to 1.4 Å−1) the so called contact peak (CP) is related to nearest-neighbour correlations.30 At intermediate values of q (around 0.8 to 0.9 Å−1) the charge-ordering peak (COP) is often interpreted in terms of cation–anion–cation and anion–cation–anion correlations. In addition, in ILs containing ions with sufficiently long (typically > C6) alkyl chains, an additional peak, the polar non-polar peak (PNPP) is often seen at lower q (around 0.4 Å−1, but strongly dependent on chain length). This is indicative of the formation of a local bilayer structure in the IL with short-range order resulting from separation of the polar (anion and cationic headgroup) and non-polar (alkyl chain) components, and accompanies the formation of a percolated structure. This nanostructure in ILs has been known for some time and is often studied using small-angle scattering and molecular dynamics (MD) simulations.57–62
[C10MIM]1−x[C10MIM-F17]x[Tf2N]
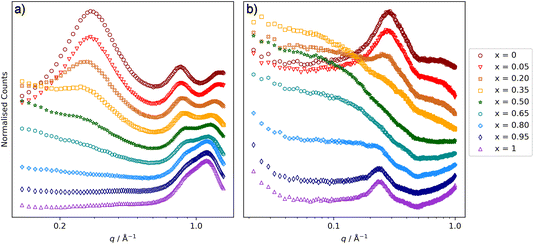
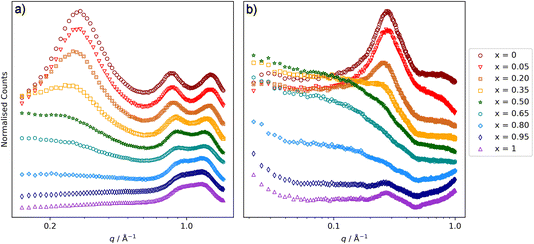
Considering the [C10MIM]1−x[C10MIM-F17]x[Tf2N] mixtures first (Fig. 5), the SAXS data show a CP for all mixtures at q ≈ 1.3 Å−1, which moves to lower q as the proportion of the fluorinated component increases. Thus, for pure [C10MIM][Tf2N] it is centred at q = 1.34 Å−1 corresponding to a length scale of 4.7 Å, while for pure [C10MIM-F17][Tf2N] it has moved to q = 1.15 Å−1, which corresponds to a length scale of 5.5 Å. The mixtures also show a COP in the SAXS data around 0.8 Å−1 and as the proportion of [C10MIM-F17][Tf2N] increases, the COP moves to higher q, from 0.83 Å−1 (7.6 Å) to 0.91 Å−1 (6.9 Å). These trends were also observed in the study of [C8MIM]1−x[C8MIM-F13]x[Tf2N] mixtures and will be discussed in the context of this work below.30The PNPP is at lower values of q than both the CP and the COP and, while this is observed in the SAXS data at higher proportions of [C10MIM][Tf2N] in the mixture, it gradually disappears as x increases, as there is effectively no contrast arising from the scattering length densities (SLDs) of the fluorocarbon chains (X-ray SLD ∼13.7 × 10⁻⁶ Å−2) compared with the ionic components (X-ray SLD ∼13.2 × 10⁻⁶ Å−2) of the system.30 Due to the differences in neutron and X-ray SLDs, we previously observed that in SANS experiments the PNPP was visible at all compositions of [C8MIM]1−x[C8MIM-F13]x[Tf2N]. However, in the present case the PNPP was observed at the highest proportions of [C10MIM][Tf2N] and for pure [C10MIM-F17][Tf2N], but not at intermediate concentrations (Fig. 5b).
Closer examination of the SANS data shows significant differences to those reported previously for [C8MIM]1−x[C8MIM-F13]x[Tf2N] mixtures. For the shorter-chain system, very little low-q (below the PNPP) scattering was observed.30Fig. 5b shows that there is a good deal of scattering at low q for the [C10MIM]1−x[C10MIM-F17]x[Tf2N] mixtures. Indeed, it is likely that this is important in understanding the behaviour of the PNPP and differences in the liquid structure with increasing alkyl and fluoroalkyl chain lengths in general. We considered whether these differences might relate to the temperature of the experiments, so collected the SANS data at 20 °C, to match the temperature used for the previous measurements on the shorter-chained system (see ESI† for details, Fig. S40 and S41†). This showed that the temperature change had a negligible effect upon the scattering features, with data being well fitted using the same parameters, so changes are likely to be due to differences in liquid structure.
The low-q data were fitted to various scattering models to better understand the system. The form of the scattering at low-q is consistent with scattering from discrete scattering ‘objects’, e.g. spherical aggregates, with different SLDs to the bulk liquid. There is a significant variation in the intensity of the scattering from these objects across the compositions, with the strongest scattering observed around x = 0.35. In order to account for both the low-q scattering and the PNPP present in the data three fitting methodologies were attempted: (1) A combination of spherical scattering objects for the low-q data and a Lorentzian peak for the PNPP; (2) an Ornstein–Zernike model for the low-q data in combination with a Lorentzian peak for the PNPP; (3) the Teubner Strey model, which was developed to describe scattering in microemulsions that can form discrete scattering objects, bicontinuous networks or lamellar structures, depending on composition.63Fig. 6 shows the three models applied to three mixtures with different compositions (x = 0.2, 0.5 and 0.8), chosen to demonstrate different scattering characteristics (full fitting information can be found in the ESI, pages S8–S18†). The combination of the spherical model and Lorentzian peak gave the best fit across the whole compositional range and the parameters extracted from these fits are shown along with the peak positions in Table 1, noting that the position of the PNPP has been fixed to the position corresponding to the closest pure IL when its position could not be clearly identified in the mixtures. In our previous fitting of SANS data for [C2MIM]1−x[C12MIM]x[Tf2N] mixtures,22 the Teubner Strey and Ornstein–Zernike/Lorentzian peak models also fitted the data well across the whole compositional range. For the [C10MIM]1−x[C10MIM-F17]x[Tf2N] system, however, these models proved less satisfactory (see ESI for details, pages S8–S16†). The Ornstein–Zernike/Lorentzian peak model fits are similar, but not quite as good, as the sphere/Lorentzian peak model. The Teubner Strey fits are able to describe either the low-q scattering, or the PNPP, but in compositions where both are present, do not capture the balance between them well. As such, only the sphere/Lorentzian peak model parameters will be discussed further.
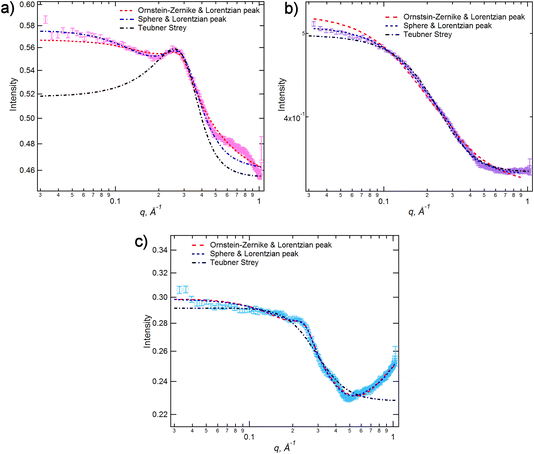 | ||
| Fig. 6 SANS data for [C10MIM]1−x[C10MIM-F17]x[Tf2N] with different models applied for (a) x = 0.2, (b) x = 0.5 and (c) x = 0.8. | ||
| x | Radius (Å) | PNPP (Å) | COP (Å) | CP (Å) |
|---|---|---|---|---|
| [C10MIM][Tf2N] | — | 22 ± 1 | 7.6 ± 0.1 | 4.69 ± 0.04 |
| 0.05 | — | 22 ± 2 | 7.6 ± 0.2 | 4.72 ± 0.04 |
| 0.2 | 12.0 ± 0.3 | 22 ± 2 | 7.5 ± 0.2 | 4.99 ± 0.08 |
| 0.35 | 12.0 ± 0.4 | 22 ± 2 | 7.3 ± 0.1 | 5.15 ± 0.08 |
| 0.5 | 10.8 ± 0.1 | 22 ± 2 | 7.3 ± 0.2 | 5.19 ± 0.09 |
| 0.65 | 7.8 ± 0.2 | 23 ± 1 | 7.1 ± 0.1 | 5.37 ± 0.05 |
| 0.8 | 7.7 ± 0.1 | 26 ± 1 | 7.0 ± 0.1 | 5.46 ± 0.05 |
| 0.95 | 7.6 ± 0.6 | 26 ± 1 | 7.0 ± 0.1 | 5.51 ± 0.10 |
| [C10MIM-F17][Tf2N] | — | 26 ± 1 | 6.9 ± 0.2 | 5.46 ± 0.09 |
The data in Table 1 quantify the changes in the CP, COP and PNPP positions described above. In addition, for compositions where 0.2 ≤ x ≤ 0.95, the radius of the scattering objects that describe the low-q scattering is seen to decrease in size with increasing x, from 12.0 to 7.6 Å. For reference, the length of a fully extended C10H21 alkyl chain is ∼13 Å and of a C8F17 chain is ∼12 Å, and so the diameter of the scattering objects is on the order of two chains, with some interdigitation and/or folding. However, the necessity to fix the position of the PNPP to that observed in one of the pure components gives uncertainty in its value in the mixtures. The interpretation of this will be discussed further in the discussion section below.
[C10MIM]1−x[C8MIM-F13]x[Tf2N] and [C8MIM]1−x[C10MIM-F17]x[Tf2N]
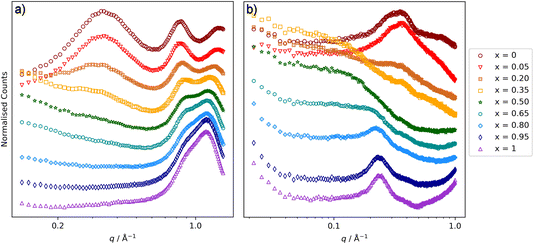
It was reported recently that the presence of significant low-q scattering was not observed in [C8MIM]1−x[C8MIM-F13]x[Tf2N] mixtures,30 which is a significant difference to the behaviour described above. Therefore, in order to investigate the relationship between increases in chain length in either of the components of the mixture, and the impact of this on the presence of low-q scattering from chain–chain aggregates, mixtures with combinations of C8 and C10 chain lengths were explored. SAXS and SANS data for [C8MIM]1−x[C10MIM-F17]x[Tf2N] mixtures are shown in Fig. 7 and the peak positions and fitted parameters are shown in Table 2. These mixtures show similar features to those seen in the [C10MIM]1−x[C10MIM-F17]x[Tf2N] mixtures in terms of variation of both the CP (moves to lower q, from 1.33 (4.7 Å) to 1.15 (5.5 Å) Å−1, with increasing x) and the COP (moves from 0.83 (7.6 Å) to 0.91 (6.9 Å) Å−1 with increasing x). These are consistent with similar changes in the polar network and chain–chain correlations in the mixtures, which appear to be insensitive to aliphatic chain length. The PNPP for [C8MIM][Tf2N] is weaker in intensity than that seen in [C10MIM][Tf2N], as the C8 chains are relatively short and the polar/non-polar separation is not as well established compared to cations with longer alkyl chains. The low-q scattering, fitted above as spherical scattering objects in the [C10MIM]1−x[C10MIM-F17]x[Tf2N] mixtures, is still present when the aliphatic chain length is reduced from C10 to C8. The size of the scattering objects follows a broadly similar pattern, again suggesting aggregates that are approximately two chains in diameter. Further discussion follows below.| x | Radius (Å) | PNPP (Å) | COP (Å) | CP (Å) |
|---|---|---|---|---|
| [C8MIM][Tf2N] | — | 18 ± 1 | 7.6 ± 0.1 | 4.72 ± 0.04 |
| 0.05 | — | 18 ± 1 | 7.6 ± 0.2 | 4.80 ± 0.04 |
| 0.2 | 13.7 ± 0.4 | 20 ± 1 | 7.4 ± 0.1 | 4.99 ± 0.04 |
| 0.35 | 10.8 ± 0.7 | — | 7.2 ± 0.1 | 5.24 ± 0.04 |
| 0.5 | 8.1 ± 0.2 | — | 7.2 ± 0.1 | 5.37 ± 0.09 |
| 0.65 | 6.8 ± 0.2 | — | 7.1 ± 0.1 | 5.46 ± 0.04 |
| 0.8 | 5.9 ± 0.4 | 27 ± 1 | 7.0 ± 0.1 | 5.42 ± 0.05 |
| 0.95 | — | 26 ± 1 | 6.9 ± 0.2 | 5.46 ± 0.05 |
| [C10MIM-F17][Tf2N] | — | 26 ± 1 | 6.9 ± 0.2 | 5.46 ± 0.09 |
SAXS and SANS data for [C10MIM]1−x[C8MIM-F13]x[Tf2N] mixtures are shown in Fig. 8 and the peak positions and fitted parameters are shown in Table 3.
| x | Radius (Å) | PNPP (Å) | COP (Å) | CP (Å) |
|---|---|---|---|---|
| [C10MIM][Tf2N] | — | 22 ± 1 | 7.6 ± 0.1 | 4.69 ± 0.04 |
| 0.05 | — | 22 ± 1 | 7.5 ± 0.1 | 4.72 ± 0.07 |
| 0.2 | 13.7 ± 0.4 | 24 ± 1 | 7.3 ± 0.1 | 4.80 ± 0.04 |
| 0.35 | 7.5 ± 0.2 | 26 ± 1 | 7.1 ± 0.1 | 4.91 ± 0.04 |
| 0.5 | 6.8 ± 0.1 | — | 7.0 ± 0.1 | 4.99 ± 0.04 |
| 0.65 | 7.4 ± 0.2 | — | 6.9 ± 0.1 | 5.03 ± 0.08 |
| 0.8 | 7.3 ± 0.2 | — | 6.7 ± 0.1 | 5.07 ± 0.04 |
| 0.95 | 8.9 ± 0.2 | 22 ± 1 | 6.6 ± 0.1 | 5.15 ± 0.08 |
| [C8MIM-F13][Tf2N] | — | 22 ± 1 | 6.6 ± 0.1 | 5.11 ± 0.08 |
Changes in the CP and COP positions are similar to those described above. However, given the lack of significant low-q scattering in [C8MIM]1−x[C8MIM-F13]x[Tf2N] mixtures,30 it was surprising to see that the scattering data for [C10MIM]1−x[C8MIM-F13]x[Tf2N] more closely resembled those where the two chain lengths are C10, than where they are both C8. Thus, for 0.20 ≤ x ≤ 0.80 there is significant low-q scattering that is similar in form to that described above and was also fitted using a spherical scattering object model. This suggests that the origin of this organisation of these liquids is not simply a function of the length of the fluoroalkyl chain. When considering the sphere radii in Table 3, there are trends similar to those found in the other liquids reported here. However, in the case of the [C10MIM]1−x[C8MIM-F13]x[Tf2N] mixtures, the chain–chain aggregates represented by the spherical scattering objects are smaller at higher values of x than in mixtures containing the C10H4F17 chains. This is discussed in more detail below.
MD simulations of the bulk
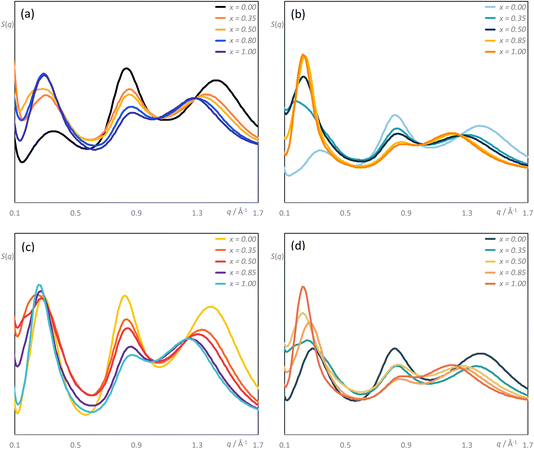
Details of the MD simulations are found in the ESI† and calculations were carried out for the three series under investigation, namely [C8MIM]1−x[C10MIM-F17]x[Tf2N], [C10MIM]1−x[C8MIM-F13]x[Tf2N] and [C10MIM]1−x[C10MIM-F17]x[Tf2N]. In addition, the data obtained from the simulations of [C8MIM]1−x[C8MIM-F13]x[Tf2N], published previously,30 were considered further to provide comparative data in relation to aggregation behaviour. These latter data were obtained at the slightly lower simulation temperature of 300 K, but it is not believed that this has a significant bearing on the comparisons made.Fig. 9 illustrates the structure factor functions, S(q), for the [C8MIM]1−x[C10MIM-F17]x[Tf2N], [C10MIM]1−x[C8MIM-F13]x[Tf2N] and [C10MIM]1−x[C10MIM-F17]x[Tf2N] mixtures at 333 K, and [C8MIM]1−x[C8MIM-F13]x[Tf2N] mixtures at 300 K, for 0 ≤ x ≤ 1. The analysis focuses primarily on the low-q regions of the S(q) functions (0.1 < q < 1.7 Å−1) to capture the structural features at the intermolecular level, specifically the PNPP, COP, and CP. The precise q-values of these primary peaks were determined through the deconvolution of their respective S(q) functions, noting that the very broad PNPP observed in some mixtures required up to four Gaussian curves for this. The deconvolution results are presented in Table S6.†
The q-values of the PNPP for all new mixtures with a component with a C10 chain (Table S6†) represent characteristic distances of approximately 25 Å, indicating localised segregation between the polar and non-polar domains. The distance in the mixtures tends to be slightly greater than that of either pure component, with the effective distance greater in the pure fluorinated component. Likewise, the data show that the COP spacing decreases (ca 7.5 to 7.3 Å) and the CP spacing increases (ca 4.6 to ca 5.2 Å) as the proportion of the fluorinated component in the mixture increases. This overall behaviour has a direct parallel in the behaviour of the [C8MIM]1−x[C8MIM-F13]x[Tf2N] mixtures and the details will be discussed below. Pleasingly, there is good agreement between the spacings for the CP and the COP obtained from both experiment and theory, as illustrated in Fig. S43.†
As noted above, the major difference in the data presented here compared with the previous study of the mixtures [C8MIM]1−x[C8MIM-F13]x[Tf2N] is the presence of significant low-q scattering. MD trajectories were therefore analysed thoroughly to identify possible aggregation patterns within the non-polar domains of the different systems, starting with mixtures where the chain length of just one component was increased. The baselines for these comparisons are represented by the pure materials [C8MIM][Tf2N] and [C8MIM-F13][Tf2N], data which show each to be percolated (Fig. 10a and b, respectively). Thus, in this figure and those that follow, the y-axis represents the probability of finding a chain belonging to an aggregate of a particular size na, illustrating the distribution of chain–chain aggregates in the mixtures. The y-axis is normalised by the total number of corresponding monomers in the MD simulation box. Note that aggregation data were not reported in the earlier publication of the study of the [C8MIM]1−x[C8MIM-F13]x[Tf2N] mixtures.30
On addition of [C8MIM-F13][Tf2N] to give [C8MIM]0.65[C8MIM-F13]0.35[Tf2N] (Fig. 11a), the alkyl chains remain close to percolation with a cluster of aggregates around na ≈ 0.7; a number of smaller aggregates is observed in addition to this. At this composition, the fluorocarbon chains form a range of rather small aggregates (Fig. 11b). By the time the mixture has an equimolar composition, the situation has changed and now it is the hydrocarbon chains that are behaving as small aggregates, while the fluorocarbon chains are significantly concentrated into large aggregates around na ≈ 0.7 en route to percolation (Fig. 11c and d), which is established by x = 0.8 (Fig. S44b†). If the longer-chain [C10MIM-F17][Tf2N] is now used, at x = 0.35 both the hydrocarbon and fluorocarbon chains are dispersed in the medium across a range of aggregate sizes up to around na ≈ 0.6 and the form of the distribution is remarkably similar (Fig. 12a and b). However, once the mixture is equimolar in composition then [C10MIM-F17][Tf2N] is all but percolated with a very small number of very small aggregates, while all of the hydrocarbon chains are concentrated also into very small aggregates (Fig. 12c and d).
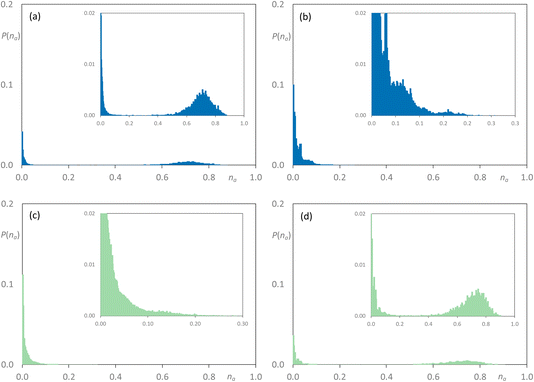 | ||
| Fig. 11 Discrete probability distribution function, P(na), for [C8MIM]1−x[C8MIM-F13]x[Tf2N]: [C8MIM] chains at (a) x = 0.35; (c) x = 0.5; [C8MIM-F13] chains at (b) x = 0.35; (d) x = 0.5. | ||
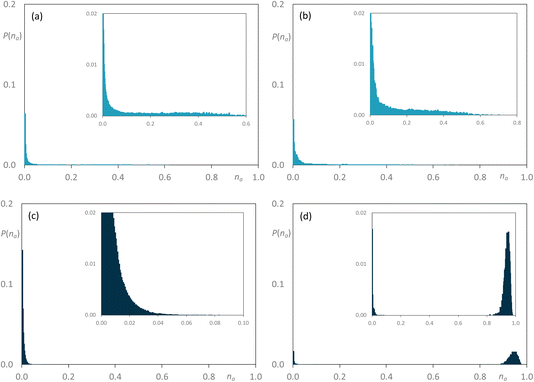 | ||
| Fig. 12 Discrete probability distribution function, P(na), for [C8MIM]1−x[C10MIM-F17]x[Tf2N]: [C8MIM] chains at (a) x = 0.35; (c) x = 0.5; [C10MIM-F17] chains at (b) x = 0.35; (d) x = 0.5. | ||
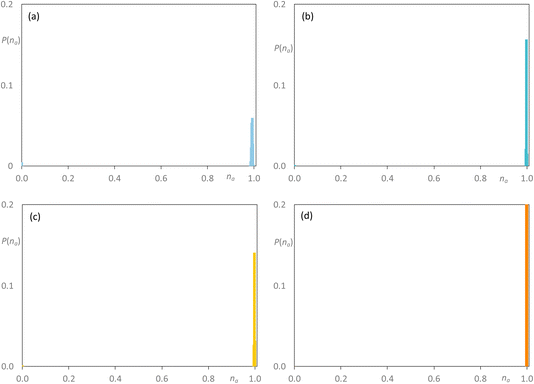
Now adding [C8MIM-F13][Tf2N] to [C10MIM][Tf2N] at 35 mol%, the percolated nature of [C10MIM][Tf2N] largely remains with a small proportion of very small clusters also seen, while the fluorocarbon chains are shown to be arranged in very small aggregates (Fig. 13a and b). However, at the equimolar composition, the situation is very similar indeed to that observed for [C8MIM]0.5[C8MIM-F13]0.5[Tf2N], where both chain types are contained in a range of aggregates of varying size up to na ≈ 0.6–0.7, with a slightly greater proportion of larger hydrocarbon-based aggregates (Fig. 13c and d). Once more, the fluorous component is effectively percolated at x = 0.85 (Fig. S44d†). Then finally considering the mixtures [C10MIM]1−x[C10MIM-F17]x[Tf2N], at x = 0.35 the hydrocarbon chains remain percolated, while the fluorocarbon chains form a range of aggregates with a probability that falls off from a high value for small aggregates to close to zero by na ≈ 0.5 (Fig. 14a and b). However, in the equimolar mixture it is evident that the fluorocarbon chains are close to full percolation, while the hydrocarbon chains are forming a range of aggregates up to around na ≈ 0.4 (Fig. 14c and d).
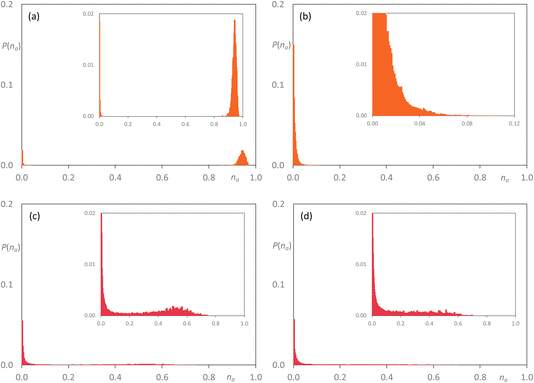 | ||
| Fig. 13 Discrete probability distribution function, P(na), for [C10MIM]1−x[C8MIM-F13]x[Tf2N]: [C10MIM] chains at (a) x = 0.35; (c) x = 0.5; [C8MIM-F13] chains at (b) x = 0.35; (d) x = 0.5. | ||
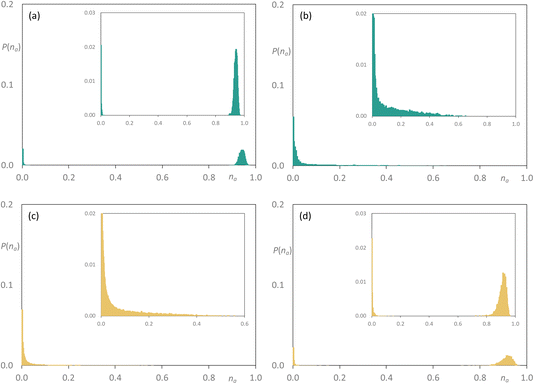 | ||
| Fig. 14 Discrete probability distribution function, P(na), for [C10MIM]1−x[C10MIM-F17]x[Tf2N]: [C10MIM] chains at (a) x = 0.35; (c) x = 0.5; [C10MIM-F17] chains at (b) x = 0.35; (d) x = 0.5. | ||
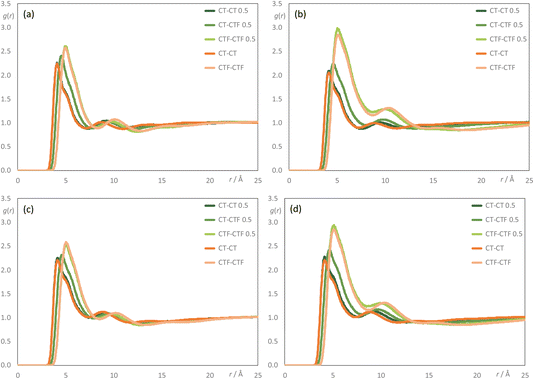
To understand the aggregation behaviour better, pair radial distribution functions – g(r) – were examined considering interactions between the terminal carbon atoms of the alkyl chains (CT and CTF for the hydrogenated and fluorinated chains, respectively). These are displayed in Fig. 15. For [C8MIM]1−x[C8MIM-F13]x[Tf2N] mixtures (Fig. 15a), the probability of finding a ‘mixed’ CT–CTF pair is the simple average of the probabilities of finding ‘pure’ CT–CT or CTF–CTF pairs, whereas this is not the case for all of the mixtures [C8MIM]1−x[C10MIM-F17]x[Tf2N] (Fig. 15b) and [C10MIM]1−x[C8MIM-F13]x[Tf2N] (Fig. 15c). At first sight and given the relatively inflexible nature of the perfluorocarbon segment, this may be attributable to the unequal chain lengths, but the fact that the observation persists for [C10MIM]1−x[C10MIM-F17]x[Tf2N] (Fig. 15d) suggests an alternative observation. This is that the fluorinated chains of the [C10MIM-F17]+ cation have a higher probability of being found in close contact with each other than do the alkyl chains on the other component i.e. that there is some preferential aggregation of the fluorous chains when they are longer than C8.
Discussion
It has been noted before that ILs with chain lengths greater than around C6![[thin space (1/6-em)]](https://www.rsc.org/images/entities/char_2009.gif) 60–62,64 form nanostructured liquids with both polar (ionic) and non-polar (alkyl or fluoroalkyl) percolated domains. The question posed by the current study is what happens to this nanostructure when these ILs are mixed, and in particular what is the impact of both the alkyl and fluoroalkyl chain lengths on the liquid structure? The [C8MIM]1−x[C8MIM-F13]x[Tf2N] system, discussed above and in a previous publication,30 showed little evidence of low-q scattering, rather a PNPP was observed for all compositions, with the lengthscale of the PNPP increasing only slightly with x, as fluoroalkyl chains are slightly longer than their alkyl equivalents. This is consistent with little or no triphilic behaviour i.e. little or no preferential separation of the alkyl and fluoroalkyl chains, consistent with the observed radial distribution function g(r), reproduced again in Fig. 15a. This is supported by aggregate analysis showing a transition between an effectively percolated alkyl chain network and a percolated fluoroalkyl chain network as a function of composition (Fig. 11). Thus, the alkyl and fluoroalkyl chains are generally well mixed in [C8MIM]1−x[C8MIM-F13]x[Tf2N] mixtures, consistent with the absence of low-q X-ray or neutron scattering.
60–62,64 form nanostructured liquids with both polar (ionic) and non-polar (alkyl or fluoroalkyl) percolated domains. The question posed by the current study is what happens to this nanostructure when these ILs are mixed, and in particular what is the impact of both the alkyl and fluoroalkyl chain lengths on the liquid structure? The [C8MIM]1−x[C8MIM-F13]x[Tf2N] system, discussed above and in a previous publication,30 showed little evidence of low-q scattering, rather a PNPP was observed for all compositions, with the lengthscale of the PNPP increasing only slightly with x, as fluoroalkyl chains are slightly longer than their alkyl equivalents. This is consistent with little or no triphilic behaviour i.e. little or no preferential separation of the alkyl and fluoroalkyl chains, consistent with the observed radial distribution function g(r), reproduced again in Fig. 15a. This is supported by aggregate analysis showing a transition between an effectively percolated alkyl chain network and a percolated fluoroalkyl chain network as a function of composition (Fig. 11). Thus, the alkyl and fluoroalkyl chains are generally well mixed in [C8MIM]1−x[C8MIM-F13]x[Tf2N] mixtures, consistent with the absence of low-q X-ray or neutron scattering.
When considering the new mixtures described here, it is first worth noting similarities between these and the [C8MIM]1−x[C8MIM-F13]x[Tf2N] system. Thus, the CP moves to lower q as the proportion of fluorinated IL increases in all mixtures, with the lengthscale associated with this peak changing from 4.7 to ∼5.3 Å. As noted previously, this occurs because the CP contains information not only related to nearest neighbour anion–cation distances, as previously assumed, but crucially also on lateral chain–chain correlations. The lengthscale of these correlations is greater in systems containing fluoroalkyl rather than alkyl chains, as the fluorinated chains are bulkier (i.e. C–F bonds are longer than C–H bonds and F is larger than H).30 In addition, the COP shows similar behaviour in all of these mixtures, moving to higher q with increasing proportion of the fluorinated IL, with associated changes in lengthscale from around 7.5 to 6.8 Å. As described before,30 this is linked to the increased rigidity of the fluoroalkyl chains, which leads to the population of fewer gauche conformations in the fluoroalkyl chains (Fig. S45†). In turn, this allows for more efficient packing of the ions and a corresponding tightening of the ion–ion distances in the polar network within the ILs.
While there are then similarities in the medium- and wide-angle scattering for all of the mixtures under consideration, in the new mixtures, which contain C10 or C10-F17 chains, the scattering at lower q is quite different. Thus, while all three new mixture systems show a PNPP reflection when the mixtures are rich in either the alkyl or fluoroalkyl IL, at intermediate compositions there is significant low-q scattering and a PNPP is not observed.
Considering first the [C8MIM]1−x[C10MIM-F17]x[Tf2N] mixtures, it can be seen that increasing the length of the fluoroalkyl chain segment from C6 to C8 leads to changes in scattering (Fig. 7 and Table 2) and the observation of aggregation in the MD simulations (Fig. 12 and 15b). Fig. 12a and b show that when 35 mol% of [C10MIM-F17][Tf2N] is present in the mixture, there is no percolation of either alkyl or fluoroalkyl chains, rather the different chains form aggregates within the mixture over a range of sizes. This is consistent with the observation of significant low-q scattering that was modelled as spherical scattering objects with radii of around 8 Å (the approximate length of a C8F17 chain), assuming that this is a time averaged picture where small aggregates are most common. However, it is important to note that these aggregates will be composed of ILs in bilayer organisation, but the wide range of sizes will reduce the effective correlation length between them, effectively broadening the PNPP and making it difficult to observe experimentally. This is reflected to an extent in the structure factor calculations, for while a PNPP is observed therein, the broader peaks are consistent with the fact that they were better modelled by the use of two rather than one Gaussian function (see ESI† for details). Note also that the S(q) calculations did not attempt to incorporate features from low-q scattering.
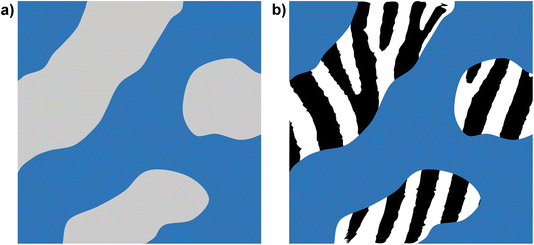
It is important to note that these mixtures still contain polar (ion) and non-polar (chain) domains, and the scattering and MD simulation data can be rationalised in terms of the degree of homogeneity of the non-polar domains. Thus, in [C8MIM]1−x[C8MIM-F13]x[Tf2N] mixtures, the alkyl and fluoroalkyl chains are well mixed in the non-polar domains leading to a relatively homogenous non-polar sub phase. When [C10MIM-F17]+ ions are introduced in [C8MIM]1−x[C10MIM-F17]x[Tf2N] mixtures, there is some segregation of the alkyl and fluoroalkyl chains, which leads to the observation of small aggregates that indicate inhomogeneity in the non-polar sub phase, although evidently this is insufficient to promote demixing. In terms of scattering, the non-polar domains in the IL mixtures no longer approximate a uniform SLD, rather they contain regions of differing SLDs making the observation of a simple, discrete PNPP difficult. In a simple model, this can be thought of as introducing ‘patchiness’ or ‘stripiness’ to the non-polar parts of the mixtures (Fig. 16). With increasing x in [C8MIM]1−x[C10MIM-F17]x[Tf2N] the fluoroalkyl chains percolate by x = 0.5 (Fig. 12d) and we see a PNPP begin to emerge (Fig. 7) at larger x, although the presence of small alkyl chain aggregates means that low-q scattering persists until the mixture is almost purely composed of [C10MIM-F17][Tf2N].
This behaviour is reflected also in the radial distribution functions and Fig. 15b shows that while the probability of finding self interactions between the terminal carbons of hydrogenated chains (CT–CT) and the probability of finding self interactions between the terminal carbons of fluorinated chains (CTF–CTF), appear essentially independent of composition, the probability of finding interactions between the terminal carbons of chains of different types (CT–CTF) is not linear with composition (as it is in the [C8MIM]1−x[C8MIM-F13]x[Tf2N] mixtures) and remains appreciably lower than the probability of CTF–CTF interactions. This is consistent with the observations from both scattering data and aggregation analysis.
Consideration of the various data for the [C10MIM]1−x[C10MIM-F17]x[Tf2N] mixtures (Table 1, Fig. 5, 14 and 15d) shows that the behaviour can be rationalised in the same way. Aggregate analysis for this system (Fig. 14) shows that the percolated sub-phase formed from the C10 alkyl chains is more resistant to disruption than that formed by the C8 alkyl chains (Fig. 12) as the C10 chain network remains percolated at x = 0.35, whereas it had disappeared at this composition in the [C8MIM]1−x[C10MIM-F17]x[Tf2N] system. Nonetheless, significant C10H4F17 chain aggregates are observed at this composition (Fig. 14b). This system can also be described as having a non-uniform distribution of the two chain types within a non-polar network leading to low-q scattering that can be described by spherical aggregates with average diameters of around two C8F17 chains (Table 1).
The final mixture system to consider is [C10MIM]1−x[C8MIM-F13]x[Tf2N]. If the above effects were simply driven by preferential interactions between the longer fluoroalkyl chains we would perhaps expect the [C10MIM]1−x[C8MIM-F13]x[Tf2N] system to behave similarly to [C8MIM]1−x[C8MIM-F13]x[Tf2N]. However, things are not so simple. Thus, there is significant low-q scattering from the [C10MIM]1−x[C8MIM-F13]x[Tf2N] mixtures (Fig. 8 and Table 3) and the aggregate analyses also differ (Fig. 13). As above, the C10 alkyl chains remain percolated at x = 0.35, but small C6F13 aggregates are seen. By x = 0.5 neither the alkyl nor fluoroalkyl chains are percolated, instead both form predominantly small aggregates, but with a significant distribution of larger aggregates, reminiscent of the results from [C8MIM]0.65[C10MIM-F17]0.35[Tf2N] (Fig. 12a and b). This is consistent with the radial distribution functions (Fig. 15), which do not show such a strong preference for CTF–CTF interactions over their CT–CT equivalents. As such, these data are similar to those for the [C8MIM]1−x[C8MIM-F13]x[Tf2N] mixtures.
The contrast between this system and the [C8MIM]1−x[C8MIM-F13]x[Tf2N] mixtures can then be rationalised by the stronger tendency of the C10 alkyl chains to associate with each other than the C8 alkyl chains. This leads to a greater resistance to disruption of the C10 non-polar network and, when disrupted, a greater tendency for C10 aggregates to form. As with the systems above, this leads to a non-uniform distribution of chains in the non-polar sub phase, leading to ‘stripiness’ in the SLDs and thus to low-q scattering arising from these aggregates, which are time averaged to approximate spherical scattering objects.
Conclusions
Previous studies of the mixtures [C8MIM]1−x[C8MIM-F13]x[Tf2N] had shown a smooth evolution of liquid structure across the range of compositions, as evidenced by X-ray and neutron scattering data. When at least one of the chain lengths increases to contain ten carbon atoms, this situation changes. While reflections in the mid- and low-angle show systematic changes in the COP (decreases in size with x) and the CP (increases in size with x), respectively, for all mixtures studied, at low angle the PNPP is lost, with this region being dominated by scattering from small scattering objects, fitted as spheres. Analysis shows that these are composed of fluorocarbon chain segments dispersed in a hydrocarbon background, which matches data from MD simulations showing, in particular in the [C8MIM]1−x[C10MIM-F17]x[Tf2N] and [C10MIM]1−x[C8MIM-F13]x[Tf2N] mixtures, formation of a large number of aggregates across a range of sizes. While all of the pure components are percolated, this is disrupted by the addition of the other component and the re-formation of a percolated network of the added chain depends upon the combination of chain lengths. Thus, a well-percolated mixture of fluorocarbon chains is found at x = 0.5 for [C10MIM-F17][Tf2N] mixed with either [C8MIM][Tf2N] or [C10MIM][Tf2N]. With [C8MIM-F13][Tf2N], percolation is fairly well developed in mixtures with [C8MIM][Tf2N] at x = 0.5, whereas in [C10MIM][Tf2N] it is not re-established until x = 0.85. However, while [C10MIM-F17][Tf2N] disrupts the percolation in [C8MIM][Tf2N] by x = 0.35, it does not do so in [C10MIM][Tf2N] until x = 0.5.Taken together, the data can be understood with reference to an extensive computational study of hydrocarbon/fluorocarbon mixing by Pollice and Chen.54 They showed that inter-chain HH interactions, while weak, have a close to ideal geometry for interaction, while inter-chain FF interactions, while stronger, have a non-ideal geometry. Inter-chain HF interactions also have a very non-ideal geometry, but are intermediate in strength. As such, they found that one HH and one FF interaction were generally preferred over two HF interactions. Clearly this will be influenced by the chain length and so can start to account for the observed immiscibility of longer chain hydrocarbons and fluorocarbons around room temperature (shorter chain components are immiscible at sub-ambient temperatures).
Of course, intermolecular interactions in the IL mixtures under consideration here, also have a strong electrostatic component and so the potential immiscibility of the different ILs is appreciably modulated compared to pure hydrocarbons and fluorocarbons. However, the way in which percolation is disrupted and the observation by both scattering and MD simulation of aggregates in the mixtures shows that the inter-chain interactions have a clear influence on the behaviour. Returning to the physical properties of the mixtures, surface-tension measurements on [C10MIM]1−x[C8MIM-F13]x[Tf2N] mixtures highlight that the [C8MIM-F13]+ ions are clearly enriched at the gas–liquid interface. However, there is no evidence of a CMC in the system – it is different from the behaviour of a surfactant in water. As we have seen before for alkyl/fluoroalkyl IL mixtures, the viscosity of the mixtures is lower than would be expected based on simple Arrhenius-type mixing. This is even more pronounced than the changes seen for [C8MIM]1−x[C8MIM-F13]x[Tf2N] mixtures and suggests that addition of the fluorocarbon-functionalised cations disrupt the IL structure in such a way as to allow for increased ion mobility. Such understanding is crucial as predictive capability in mixture properties continues to evolve.
Data availability
The datasets corresponding to this work have been deposited and are available at DOI: 10.5291/ILL-DATA.9-11-2147.Experimental and computational methods
All experimental and computational methodologies are described in the ESI.†Conflicts of interest
The authors declare no conflicts of interest.Author contributions
The study was conceived by JMS, DWB and NSE. Grant funding was secured by MLC, PDL, KGM, JMS and DWB, while the beam-time allocation was secured by NSE, SER, JMS and DWB. ILs were prepared by NSE and EVS, while the perdeuterated precursors were prepared by SY. Experimental work was undertaken by NSE, PDL, EVS, JL and JMS and simulations were carried out by KS. Data interpretation was done by NSE, EVS, KS, BD, JNCL, MLC, KGM, JMS and DWB and the manuscript was written and edited by NSE, KS, NM, SER, BD, JNCL, MLC, KGM, JMS and DWB.Acknowledgements
The authors thank the EPSRC (NSE: EP/T031174/1, PDL: EP/T03114X/1 & EP/T021675/1) and the University of York Wild Scholars Fund (JL) for support, the ILL for beam-time (9-11-2147) and the ISIS Deuteration Facility (SY) for some deuterated precursors. KS and JNCL thank Fundação para a Ciência e Tecnologia, FCT/MCTES (Portugal) for financial support through CEEC contract (IST-ID/100/2018 to KS), and through projects UIDB/00100/2020 and LA/P/0056/2020.References
- H. Niedermeyer, J. P. Hallett, I. J. Villar-Garcia, P. A. Hunt and T. Welton, Chem. Soc. Rev., 2012, 41, 7780–7802 RSC.
- G. Chatel, J. F. B. Pereira, V. Debbeti, H. Wang and R. D. Rogers, Green Chem., 2014, 16, 2051–2083 RSC.
- A. Riisager, R. Fehrmann, M. Haumann and P. Wasserscheid, Eur. J. Inorg. Chem., 2006, 695–706 CrossRef CAS.
- A. Riisager, R. Fehrmann, M. Haumann and P. Wasserscheid, Top. Catal., 2006, 40, 91–102 CrossRef CAS.
- T. Selvam, A. Machoke and W. Schwieger, Appl. Catal., A, 2012, 445, 92–101 CrossRef.
- M. Abai, M. P. Atkins, A. Hassan, J. D. Holbrey, Y. Kuah, P. Nockemann, A. A. Oliferenko, N. V. Plechkova, S. Rafeen, A. A. Rahman, R. Ramli, S. M. Shariff, K. R. Seddon, G. Srinivasan and Y. R. Zou, Dalton Trans., 2015, 44, 8617–8624 RSC.
- J. M. Marinkovic, A. Riisager, R. Franke, P. Wasserscheid and M. Haumann, Ind. Eng. Chem. Res., 2019, 58, 2409–2420 CrossRef CAS.
- L. Offner-Marko, A. Bordet, G. Moos, S. Tricard, S. Rengshausen, B. Chaudret, K. L. Luska and W. Leitner, Angew. Chem., Int. Ed., 2018, 57, 12721–12726 CrossRef CAS PubMed.
- D. Geier, P. Schrnitz, J. Walkowiak, W. Leitner and G. Francio, ACS Catal., 2018, 8, 3297–3303 CrossRef CAS.
- J. Brunig, Z. Csendes, S. Weber, N. Gorgas, R. W. Bittner, A. Limbeck, K. Bica, H. Hoffmann and K. Kirchner, ACS Catal., 2018, 8, 1048–1051 CrossRef.
- S. More, S. Jadhav, R. Salunkhe and A. Kumbhar, Mol. Catal., 2017, 442, 126–132 CrossRef CAS.
- S. G. Khokarale, E. J. Garcia-Suarez, R. Fehrmann and A. Riisager, ChemCatChem, 2017, 9, 1824–1829 CrossRef CAS.
- J. Zhao, S. C. Gu, X. L. Xu, T. T. Zhang, Y. Yu, X. X. Di, J. Ni, Z. Y. Pan and X. N. Li, Catal. Sci. Technol., 2016, 6, 3263–3270 RSC.
- K. L. Luska, P. Migowski, S. El Sayed and W. Leitner, ACS Sustainable Chem. Eng., 2016, 4, 6186–6192 CrossRef CAS.
- O. D. Pavel, P. Goodrich, L. Cristian, S. M. Coman, V. I. Parvulescu and C. Hardacre, Catal. Sci. Technol., 2015, 5, 2696–2704 RSC.
- K. L. Luska, P. Migowski, S. El Sayed and W. Leitner, Angew. Chem., Int. Ed., 2015, 54, 15750–15755 CrossRef CAS PubMed.
- C. Waring, P. A. J. Bagot, J. M. Slattery, M. L. Costen and K. G. McKendrick, J. Phys. Chem. A, 2010, 114, 4896–4904 CrossRef CAS PubMed.
- C. Waring, P. A. J. Bagot, J. M. Slattery, M. L. Costen and K. G. McKendrick, J. Phys. Chem. Lett., 2010, 1, 429–433 CrossRef CAS.
- M. A. Tesa-Serrate, B. C. Marshall, E. J. Smoll, S. M. Purcell, M. L. Costen, J. M. Slattery, T. K. Minton and K. G. McKendrick, J. Phys. Chem. C, 2015, 119, 5491–5505 CrossRef CAS.
- S. M. Purcell, M. A. Tesa-Serrate, B. C. Marshall, D. W. Bruce, L. D’Andrea, M. L. Costen, J. M. Slattery, E. J. Smoll, T. K. Minton and K. G. McKendrick, Langmuir, 2016, 32, 9938–9949 CrossRef CAS PubMed.
- M. A. Tesa-Serrate, E. J. Smoll, L. D’Andrea, S. M. Purcell, M. L. Costen, D. W. Bruce, J. M. Slattery, T. K. Minton and K. G. McKendrick, J. Phys. Chem. C, 2016, 120, 27369–27379 CrossRef CAS.
- D. W. Bruce, C. P. Cabry, J. N. C. Lopes, M. L. Costen, L. D’Andrea, I. Grillo, B. C. Marshall, K. G. McKendrick, T. K. Minton, S. M. Purcell, S. Rogers, J. M. Slattery, K. Shimizu, E. Smoll and M. A. Tesa-Serrate, J. Phys. Chem. B, 2017, 121, 6002–6020 CrossRef CAS PubMed.
- S. M. Purcell, P. D. Lane, L. D’Andrea, N. S. Elstone, D. W. Bruce, J. M. Slattery, E. J. Smoll, S. J. Greaves, M. L. Costen, T. K. Minton and K. G. McKendrick, J. Phys. Chem. B, 2022, 126, 1962–1979 CrossRef CAS PubMed.
- B. H. Wu, J. M. Zhang, T. K. Minton, K. G. McKendrick, J. M. Slattery, S. Yockel and G. C. Schatz, J. Phys. Chem. C, 2010, 114, 4015–4027 CrossRef CAS.
- C. P. Cabry, L. D’Andrea, K. Shimizu, I. Grillo, P. X. Li, S. Rogers, D. W. Bruce, J. N. C. Lopes and J. M. Slattery, Faraday Discuss., 2018, 206, 265–289 RSC.
- E. J. Smoll, M. A. Tesa-Serrate, S. M. Purcell, L. D’Andrea, D. W. Bruce, J. M. Slattery, M. L. Costen, T. K. Minton and K. G. McKendrick, Faraday Discuss., 2018, 206, 497–522 RSC.
- E. J. Smoll, S. M. Purcell, L. D’Andrea, J. M. Slattery, D. W. Bruce, M. L. Costen, K. G. McKendrick and T. K. Minton, J. Phys. Chem. Lett., 2019, 10, 156–163 CrossRef CAS PubMed.
- E. J. Smoll, X. M. Chen, L. M. Hall, L. D’Andrea, J. M. Slattery and T. K. Minton, J. Phys. Chem. C, 2020, 124, 382–397 CrossRef CAS.
- C. P. Cabry, L. D’Andrea, N. S. Elstone, S. Kirchhecker, A. Riccobono, I. Khazal, P. X. Li, S. E. Rogers, D. W. Bruce and J. M. Slattery, Phys. Chem. Chem. Phys., 2022, 24, 15811–15823 RSC.
- N. S. Elstone, K. Shimizu, E. V. Shaw, P. D. Lane, L. D’Andrea, B. Demé, N. Mahmoudi, S. E. Rogers, S. Youngs, M. L. Costen, K. G. McKendrick, J. C. Lopes, D. W. Bruce and J. M. Slattery, J. Phys. Chem. B, 2023, 127, 7394–7407 CrossRef CAS PubMed.
- C. C. Weber, N. J. Brooks, F. Castiglione, M. Mauri, R. Simonutti, A. Mele and T. Welton, Phys. Chem. Chem. Phys., 2019, 21, 5999–6010 RSC.
- D. Pontoni, M. DiMichiel and M. Deutsch, J. Mol. Liq., 2020, 300, 112280 CrossRef CAS.
- D. Pontoni, M. DiMichiel and M. Deutsch, J. Mol. Liq., 2021, 338, 116587 CrossRef CAS.
- R. Costa, C. M. Pereira, A. F. Silva, P. F. Brevet and E. Benichou, J. Phys. Chem. B, 2020, 124, 3954–3961 CrossRef CAS PubMed.
- M. E. Di Pietro, F. Castiglione and A. Mele, J. Phys. Chem. B, 2020, 124, 2879–2891 CrossRef CAS PubMed.
- B. S. J. Heller, C. Kolbeck, I. Niedermaier, S. Dommer, J. Schatz, P. Hunt, F. Maier and H.-P. Steinrück, ChemPhysChem, 2018, 19, 1733–1745 CrossRef CAS PubMed.
- F. Wu, W. V. Karunaratne and C. J. Margulis, J. Phys. Chem. C, 2019, 123, 4914–4925 CrossRef CAS.
- T. Cosby, U. Kapoor, J. K. Shah and J. Sangoro, J. Phys. Chem. Lett., 2019, 10, 6274–6280 CrossRef CAS PubMed.
- I. J. Villar-Garcia, S. Fearn, N. L. Ismail, A. J. S. McIntosh and K. R. J. Lovelock, Chem. Commun., 2015, 51, 5367–5370 RSC.
- M. Chakraborty, T. Ahmed, R. S. Dhale, D. Majhi and M. Sarkar, J. Phys. Chem. B, 2018, 122, 12114–12130 CrossRef CAS PubMed.
- L. F. Lepre, M. C. Gomes, A. A. H. Padua, R. A. Ando and M. C. C. Ribeiro, J. Phys. Chem. B, 2019, 123, 6579–6587 CrossRef CAS PubMed.
- B. Golub, D. Ondo, V. Overbeck, R. Ludwig and D. Paschek, Phys. Chem. Chem. Phys., 2022, 24, 14740–14750 RSC.
- Y. Q. Chen, S. L. Ma, Y. Lei, X. D. Liang, X. Y. Liu, G. M. Kontogeorgis and R. Gani, AIChE J., 2024, 70, e18392 CrossRef CAS.
- Z. W. Zhai, U. Paap, A. Gezmis, F. Maier, H. P. Steinrueck and T. M. Koller, J. Mol. Liq., 2023, 386, 122388 CrossRef CAS.
- O. Holloczki, M. Macchiagodena, H. Weber, M. Thomas, M. Brehm, A. Stark, O. Russina, A. Triolo and B. Kirchner, ChemPhysChem, 2015, 16, 3325–3333 CrossRef CAS PubMed.
- B. S. J. Heller, M. Lexow, F. Greco, S. Shin, G. Partl, F. Maier and H. P. Steinruck, Chem. – Eur. J., 2020, 26, 1117–1126 CrossRef CAS PubMed.
- B. S. J. Heller, U. Paap, F. Maier and H. P. Steinruck, J. Mol. Liq., 2020, 305, 112783 CrossRef CAS.
- T. M. Koller, F. D. Lenahan, P. S. Schmidt, T. Klein, J. Mehler, F. Maier, M. H. Rausch, P. Wasserscheid, H. P. Steinrück and A. P. Fröba, Int. J. Thermophys., 2020, 41, 24 CrossRef.
- D. Hemmeter, D. Kremitzl, P. S. Schulz, P. Wasserscheid, F. Maier and H. P. Steinrück, Chem. – Eur. J., 2023, 29, e202204023 CrossRef PubMed.
- D. Hemmeter, U. Paap, N. Wellnhofer, A. Gezmis, D. Kremitzl, P. Wasserscheid, H. P. Steinrück and F. Maier, ChemPhysChem, 2023, 24, e202300612 CrossRef CAS PubMed.
- A. Riccobono, R. R. Parker, A. C. Whitwood, J. M. Slattery, D. W. Bruce, I. Pibiri and A. Pace, Chem. Commun., 2018, 54, 9965–9968 RSC.
- A. Riccobono, G. Lazzara, S. E. Rogers, I. Pibiri, A. Pace, J. M. Slattery and D. W. Bruce, J. Mol. Liq., 2021, 321, 114758 CrossRef CAS.
- A. Riccobono, A. C. Whitwood, R. R. Parker, S. Hart, A. Pace, J. M. Slattery, I. Pibiri and D. W. Bruce, CrystEngComm, 2022, 24, 7852–7860 RSC.
- R. Pollice and P. Chen, J. Am. Chem. Soc., 2019, 141, 3489–3506 CrossRef CAS PubMed.
- S. Arrhenius, Z. Phys. Chem., 1887, 1, 285 CrossRef.
- K. Shimizu, C. E. S. Bernardes and J. N. C. Lopes, J. Phys. Chem. B, 2014, 118, 567–576 CrossRef CAS PubMed.
- J. N. C. Lopes, M. F. C. Gomes and A. A. H. Padua, J. Phys. Chem. B, 2006, 110, 16816–16818 CrossRef CAS PubMed.
- H. V. R. Annapureddy, H. K. Kashyap, P. M. De Biase and C. J. Margulis, J. Phys. Chem. B, 2010, 114, 16838–16846 CrossRef CAS PubMed.
- H. K. Kashyap, J. J. Hettige, H. V. R. Annapureddy and C. J. Margulis, Chem. Commun., 2012, 48, 5103–5105 RSC.
- A. Triolo, O. Russina, H. J. Bleif and E. Di Cola, J. Phys. Chem. B, 2007, 111, 4641–4644 CrossRef CAS PubMed.
- R. Hayes, G. G. Warr and R. Atkin, Chem. Rev., 2015, 115, 6357–6426 CrossRef CAS PubMed.
- Y. L. Wang, B. Li, S. Sarman, F. Mocci, Z. Y. Lu, J. Y. Yuan, A. Laaksonen and M. D. Fayer, Chem. Rev., 2020, 120, 5798–5877 CrossRef CAS PubMed.
- M. Teubner and R. Strey, J. Chem. Phys., 1987, 87, 3195–3200 CrossRef CAS.
- J. N. A. C. Lopes and A. A. H. Padua, J. Phys. Chem. B, 2006, 110, 3330–3335 CrossRef PubMed.
Footnote |
| † Electronic supplementary information (ESI) available: Experimental and computational details. Key spectroscopic data. See DOI: https://doi.org/10.1039/d4fd00047a |
| This journal is © The Royal Society of Chemistry 2024 |

