 Open Access Article
A machine learning-based nano-photocatalyst module for accelerating the design of Bi2WO6/MIL-53(Al) nanocomposites with enhanced photocatalytic activity†
Xiuyun
Zhai
 *a and
Mingtong
Chen
b
aCollege of Intelligent Manufacturing, Hunan University of Science and Engineering, Yongzhou, 425100, Hunan, China. E-mail: cqfbb2008@shu.edu.cn
bPublic Experimental Teaching Center, Panzhihua University, Panzhihua, 617000, Sichuan, China
First published on 6th June 2023
Abstract
It is a great challenge to acquire novel Bi2WO6/MIL-53(Al) (BWO/MIL) nanocomposites with excellent catalytic activity by the trial-and-error method in the vast untapped synthetic space. The degradation rate of Rhodamine B dye (DRRhB) can be used as the main parameter to evaluate the catalytic activity of BWO/MIL nanocomposites. In this work, a machine learning-based nano-photocatalyst module was developed to speed up the design of BWO/MIL with desirable performance. Firstly, the DRRhB dataset was constructed, and four key features related to the synthetic conditions of BWO/MIL were filtered by the forward feature selection method based on support vector regression (SVR). Secondly, the SVR model with radical basis function for predicting the DRRhB of BWO/MIL was established with the key features and optimal hyperparameters. The correlation coefficients (R) between predicted and experimental DRRhB were 0.823 and 0.884 for leave-one-out cross-validation (LOOCV) and the external test, respectively. Thirdly, potential BWO/MIL nanocomposites with higher DRRhB were discovered by inverse projection, the prediction model, and virtual screening from the synthesis space. Meanwhile, an online web service (http://1.14.49.110/online_predict/BWO2) was built to share the model for predicting the DRRhB of BWO/MIL. Moreover, sensitivity analysis was brought into boosting the model's explainability and illustrating how the DRRhB of BWO/MIL changes over the four key features, respectively. The method mentioned here can provide valuable clues to develop new nanocomposites with the desired properties and accelerate the design of nano-photocatalysts.
1 Introduction
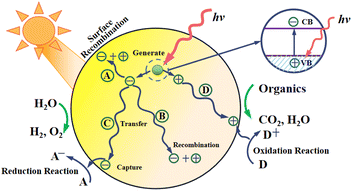
Against the background of the energy crisis and environmental pollution worldwide, photocatalysts have been widely paid attention and developed1,2 due to their distinct advantages of energy conservation, high efficiency, green environmental protection, etc.3–5 They can capture solar energy to completely decompose organic pollutants into CO2 and H2O, decompose H2O into O2 and H2, etc. The Bi2WO6/MIL-53(Al) (BWO/MIL) composites that we studied are a type of nanomaterial6–10 as well as a novel kind of visible-light photocatalyst whose morphology and size affect the specific surface area and the number of surface active sites, subsequently impacting the visible-light catalytic activity. Therefore, the key to the preparation of efficient visible-light photocatalysts is to adjust their morphologies and sizes by selecting different preparation methods and suitable surfactants.The photocatalytic principle is shown in Fig. 1. The photocatalyst is excited to produce photogenerated electron–hole pairs under irradiation of light (hv). The electrons jump from the top of the valence band (VB) to the bottom of the conduction band (CB). During migration to the surface under electric field or through diffusion, some photogenerated carriers recombine and then release absorbed energy in the forms of heat or light. The electrons and holes that migrate to the surface of the catalyst can react with the adsorbed substances on the surface by reduction and oxidation, and finally, further thermal and catalytic reactions are carried out.
Photocatalysis technology has been applied in many frontier fields, such as environmental purification,11,12 self-cleaning materials,13 advanced new energy,14,15 cancer treatment,16 high-efficiency antibacterial agents,17etc. Especially, the visible-light photocatalysts have become part of mainstream research in the environmental protection field18–20 because they can utilize approximately 50% solar energy, well above the nano-semiconductor materials.21 Among them, Bi2WO6 is gaining more and more attention for its many important assets, such as low cost, non-toxicity, narrow band gap and high physicochemical stability.22–25 In spite of the many advantages, it has intrinsic limitations and disadvantages that affect its photocatalytic activity, such as high combination rate of photogenerated electrons and holes, along with a narrow photoabsorption region.26,27 Constructing heterojunctions is an effective way to resolve the above problems.28–30 MIL-53(Al), an Al-based metal–organic framework (MOF), is an excellent catalyst support due to its large specific surface area and high thermal stability.31,32 Hu et al. reported that the formation of the BWO/MIL heterojunction could enhance the degradation of Rhodamine B (RhB) dye in water under visible-light irradiation.22 This is mainly because the formation of heterojunctions can improve the separation efficiency of photogenerated carriers. In the process of combining MOFs with Bi2WO6, MOFs serve as both semiconductors with different CB or VB structures and the carriers for the Bi2WO6 nanomaterials, thus forming effective composite photocatalysts. However, it is difficult to achieve the controllable synthesis of BWO/MIL because there are many factors impacting the photocatalytic activity of BWO/MIL. Considering the existence of multiple experimental parameters and the wide compositions, the number of potential BWO/MIL nanocomposites is far greater than that of synthesized BWO/MILs. The traditional trial-and-error method which completely depends on experiments can't meet the urgent requirements of the novel material development with rapid growth.
The computational methods that can efficiently accelerate material design have attracted more and more attention, which mainly include first-principles calculations,33,34 molecular dynamics,35 finite element method36 and machine learning (ML).37,38 Though the first three methods can promote the development of new materials to a certain extent, it proves costly to quickly discover new photocatalysts with ideal performance, considering the highly time-consuming and excessive computation costs caused by too many experimental factors. In recent years, material design with the assistance of ML has become a hot research topic and an alternative approach to the trial-and-error method, and it can greatly shorten the development cycle of materials with high performance.38–40 ML is an interdisciplinary subject involving probability theory, statistics, convex analysis, algorithm complexity theory, and so on. It specializes in studying how computers simulate or realize human learning behaviors for acquiring relative knowledge or skills, reorganizing existing knowledge to continuously improve their own performance.41,42 It is the core of artificial intelligence (AI), and its application scope is very extensive and covers nearly all sectors of AI.43–45 A ML-based alloy design system to facilitate the rational design of high-entropy alloys with enhanced hardness was developed by Yang et al.46 Lamoureux et al. reviewed how cutting-edge data infrastructures and ML methods were being used to address problems in computational heterogeneous catalysis.47 Raccuglia et al. reported that the ML model they developed outperformed traditional human strategies and successfully predicted the formation conditions for new templated inorganic products.48 Despite all this, most ML models lack interpretation and prevent researchers from acquiring more material design mechanisms. Furthermore, it is still a difficult problem to fulfill the inverse design of ideal materials from performance to synthetic conditions, and most experimental researchers are often not good at using the developed prediction models they are interested in because of their lack of in-depth understanding of ML methods.
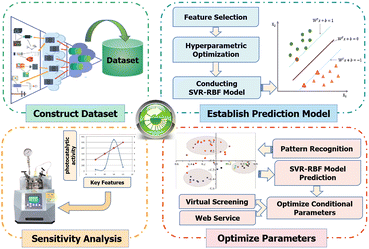
In our work, a ML-based nano-photocatalyst module (MLM-BWO/MIL) for accelerating the design of BWO/MIL with enhanced photocatalytic activity was constructed in four steps, namely, constructing a dataset, establishing the model, optimization of synthesis conditions, and sensitivity analysis (SA). The BWO/MIL dataset was formed by assembling the experimental condition parameters and composition ratio from the related reference. Then, the forward feature selection method based on support vector regression (FFS-SVR)49 was employed to find the key features to establish the prediction model of BWO/MIL performance. Furthermore, the support vector regression (SVR)50 model with radical basis function (RBF), the inverse projection based on Fisher method, and virtual screening were employed to search for the optimal parameters of BWO/MIL synthesis. A web service to easily utilize the model is provided for readers without requiring understanding of the ML principle. Furthermore, SA was used to explain the changes of the target variable with the key features, help guide the subsequent experiments, and discover the mechanism of BWO/MIL synthesis.
The contributions and novelties of our work are as follows: (1) The BWO/MIL nanocomposites are a novel kind of visible-light nano-photocatalysts attracting the attention of researchers. For the first time, a dataset of BWO/MIL nanocomposites was established by collecting relevant literature, which can be conveniently used for subsequent extensions of BWO/MIL experiments and data mining of nano-photocatalytic materials. (2) To our knowledge, detailed research on the ML-based nano-photocatalyst module for developing BWO/MIL with enhanced photocatalytic activity is new. (3) Just four features (CHN, Sur, Thyd and Rm) were recognized as the key factors affecting photocatalytic performance and the inputs of the SVR-RBF model for predicting the DRRhB of BWO/MIL, which can greatly reduce the complexity of the model and save computational time. (4) Five promising samples with likely higher performance were discovered via our MLM-BWO/MIL. (5) An online web service (http://1.14.49.110/online_predict/BWO2) was established to quickly and effectively predict the DRRhB of BWO/MIL, which can help to save significant time and cost of synthetic experiments of BWO/MIL. Moreover, all researchers who are interested in BWO/MIL nanocomposites don't need to be familiar with ML technology to access and utilize the service freely.
2 Material and methods
2.1 The formation of MLM-BWO/MIL
A MLM-BWO/MIL for speeding up the design of BWO/MIL nanocomposites with enhanced photocatalytic activity was constructed by the following steps (shown in Fig. 2): construct dataset, establish prediction model, optimize experimental parameters and conduct SA.| No. | Meanings | Features |
|---|---|---|
| 1 | Reagent for pH adjustment | R pH |
| 2 | Cooling method | C M |
| 3 | Drying method | D M |
| 4 | Concentration of HNO3 (mol L−1) | C HN |
| 5 | Surfactant | S ur |
| 6 | Surfactant dosage (g) | D sur |
| 7 | pH | V pH |
| 8 | Stirring time (h) | T stir |
| 9 | Hydrothermal temperature (°C) | T hyd |
| 10 | Hydrothermal time (h) | T hy |
| 11 | Solvent of Na2WO4·2H2O | S ol |
| 12 | Drying temperature (°C) | T dry |
| 13 | Mole ratio of Bi2WO6 to MIL-53(Al) | R m |
(a) First, 2 mmol Bi(NO3)3·5H2O in 25 mL HNO3 was dissolved at the molar concentration of CHN M, and then stirred continuously at room temperature to fully dissolve Bi(NO3)3·5H2O, yielding the Bi(NO3)3 solution.
(b) 1 mmol Na2WO4·2H2O and Dsur g Sur were dissolved in 20 mL Sol solution to obtain Na2WO4 solution.
(c) 1/Rm mmol of the MIL-53(Al) was uniformly mixed with Na2WO4 solution, then ultrasonically dispersed for 30 min, and added with Bi(NO3)3 solution drop by drop under stirring.
(d) The pH of the mixed solution was adjusted to VpH with RpH solution, then magnetically stirred for Tstir hours.
(e) The obtained mixture was transferred into a 100 mL autoclave with PTFE lining, placed into an oven at Thyd °C, and reacted for Thy hours.
(f) After being cooled to room temperature by CM, the reaction product was centrifuged, washed twice with secondary distilled water, washed once with absolute ethanol, placed in an oven at Tdry °C and dried for 10 h by DM.
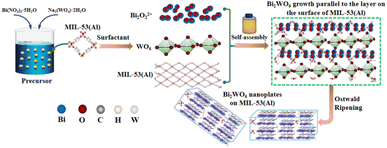
The growth of BWO/MIL is a typical Ostwald aging51 and self-assembly process. Based on the analysis of the preparation process and characterization results of BWO/MIL, its phase formation mechanism (shown in Fig. 3) is described as follows. Two kinds of tiny crystal nuclei (WO6 and Bi2O22+) are formed in the precursor fluid, grown in parallel on the surface of MIL-53(Al), and gradually matured to form two-dimensional Bi2WO6 nanosheets with hydrothermal temperature and pressure increasing and with the assistance of the surfactants. The heterojunction generated at the contact interface between Bi2WO6 and MIL-53(Al) can effectively inhibit the recombination of photogenerated electron–hole pairs of the BWO/MIL photocatalyst, and then improve the catalytic activity.
The dataset was established by collecting the experimental data of BWO/MIL synthesis from ref. 52, which is a graduate student's dissertation. The mechanism of photocatalytic degradation of BWO/MIL is also provided in ref. 52. The degradation rate of RhB dye (DRRhB) (listed in Table S1 of ESI†) is as the target variable of the dataset. Thirteen features (shown in Table 1), including the twelve experimental parameters and one composition ratio of BWO/MIL (Rm), served as the candidate inputs of the prediction model. The meanings of values for the five features (RpH, CM, DM, Sur and Sol) are explained in Table S2.† Before modeling, two samples (No. 5 and 27) were basically without photocatalytic activity due to their very low DRRhB and were deleted from the dataset. Then, the dataset with 53 samples was divided into two parts: the training set, which included 45 samples for modeling, and the testing set, comprised by the remaining samples for validation and marked by asterisks in Table S1.†
The RBF parameters of SVR were optimized by cross-validation and grid research techniques before building the model. Cross-validation was conducted to avoid the overfitting problem. The SVR-RBF model53 was established for predicting the DRRhB of BWO/MILs with the optimal feature subset. The independent testing set was used to validate the generality of the SVR-RBF model.
2.2 Inverse projection of pattern recognition
Inverse projection (IP) of pattern recognition refers to mapping of the designed sample points from the two-dimensional space back to the multi-dimensional space, where the experimental condition for material synthesis can be found. A discriminant function related to the known samples and their categories needs to be set up to complete IP. Fisher discriminant analysis54,55 was used to determine the weight vector and threshold value in the projection direction by using the given training data, before constructing the discriminant function. Fisher method is a popular method to measure the separation degree between two categories.56 Although it was proposed earlier, it is still being used widely and plays an important part in pattern recognition.57,58 Certain constraints must be introduced to make the result of IP unique. The constraint for linear IP is to take the fixed values (such as mean value or optimal value) as the coordinate values of the design points on other projection vectors, while the constraint for nonlinear IP is found by minimizing the error function of the inverse projection.2.3 Software availability
The ML calculations of our work were performed using the HyperMiner software package59,60 and the Online Computational Platform of Material Data Mining (OCPMDM),61,62 which we developed. HyperMiner can be freely downloaded on the website: http://materials-data-mining.com/home. OCPMDM can be freely used on the website of the Laboratory of Materials Data Mining at Shanghai University: http://materials-data-mining.com/ocpmdm/.3 Results and discussion
In order to seek out the most suitable algorithm for modeling, the results of 10-fold cross-validation of several algorithms, including SVR-RBF, SVR based on linear kernel function (SVR-LKF), SVR based on polynomial kernel function (SVR-PKF), and multiple linear regression (MLR), were compared. The results reflected that SVR-RBF algorithm was more suitable for modeling than the others. Therefore, SVR-RBF was identified as the method to establish the model for predicting DRRhB of BWO/MIL nanocomposites.3.1 Feature selection
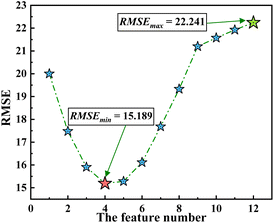
Feature selection is the process of selecting an optimal subset from the original features, which falls into three categories according to formation mode: exhaustive method, heuristic method and random method. The forward feature selection method (FFS)63,64 used in this work is a heuristic method which starts from an empty set and incrementally adds a feature to the target feature subset from the candidate features. The search process of FFS doesn't end until a feature subset close to the optimal solution is obtained. A SVR model is constructed with the features on each pass of the FFS search. Root mean square error (RMSE) of the 10-fold cross-validation is used as the evaluation indicator of the SVR model. The above feature selection approach is termed the FFS-SVR method. Fig. 4 reveals how FFS-SVR and cross-validation were used to search for the optimal feature set. The result illustrated that RMSE showed concave parabola variation with the increase of feature number, and the minimal and maximal RMSEs occur when the feature numbers are 4 and 12, respectively. It was obvious that the feature set including CHN, Sur, Thyd and Rm (highlighted in bold in Table S1†) is best when the RMSE of the model is minimal.3.2 Model establishment
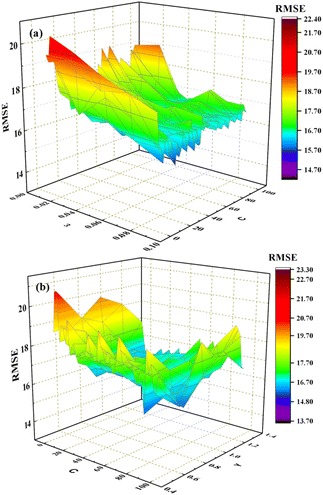
Grid research method and 10-fold cross-validation were employed to optimize the three hyperparameters, and RMSE was used as the evaluation index of the SVR model. The optimization process is shown in Fig. 5, from which the minimum RMSE is 13.724 when C, ε and γ are 29, 0.05 and 1.3, respectively.
 | (1) |
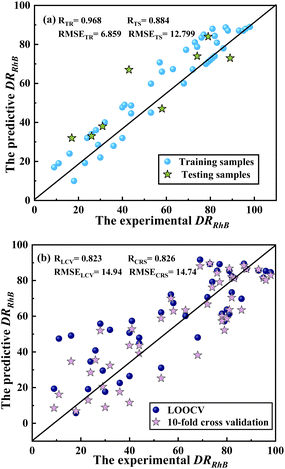
Fig. 6(a) and (b) show the experimental versus the predictive DRRhB of BWO/MILs for the training and testing samples, and the LOOCV and 10-fold cross-validation of the training set, respectively. The subscripts “TR”, “TS”, “LCV” and “CRS” in the figure denote “training”, “testing”, “LOOCV” and “10-fold cross-validation”, respectively. It can be seen from Fig. 6(a) that the sample points, whether in the training set or in the testing set, scatter around the diagonal, illustrating that the model has preferable prediction performance and practicability. The results of the model evaluated by LOOCV and 10-fold cross-validation are shown in Fig. 6(b). The RLCV and RCRS of the training set were 0.823 and 0.826, respectively. There are some deviations between the predictive and the experimental values of some samples. That may be due to some errors in experiments and requiring more data for building a predictive model in the vast synthesis space of BWO/MILs. If more experimental data can be gathered in future work, the deviations will be reduced.
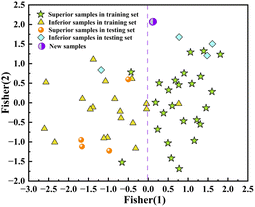
The values of DRRhB in the dataset range from 9 to 98. The maximum of DRRhB can reach 100. The value (55) is close to the median between 9 and 100. Considering unbiased classification, the DRRhB value dividing superior and inferior samples is 55. Samples with greater DRRhB than this value are superior; otherwise, they are inferior. Fig. 7 plots the pattern recognition projection using Fisher method according to the distribution of superior and inferior samples in the training set and the testing set. It can be seen from Fig. 7 that the two classes of samples are clearly distinguished by a purple dotted line apart from four misclassified points. The line is expressed as a linear combination of the key features, which is shown as follows:
| Fisher(1) = 0.295CHN − 0.8559Sur − 0.02086Thyd + 0.3427Rm + 2.704 = −0.037 | (2) |
The superior samples are gathered on the right side of the dotted line in Fig. 7, forming the optimal region in which the newly designed samples with high DRRhB should be distributed. It can be seen from Fig. 7 and eqn (2) that the restraint condition of the discriminant function of new promising samples is Fisher(1) ≥ −0.037. The features and DRRhB of the designed BWO/MILs can be derived by IP and predicted by the constructed SVR-RBF model. Obviously, IP can not only supply a suitable projection for classification to prevent the calculation and experiment with inferior samples, but also help us quickly seek the candidates with high DRRhB in the optimal region.
Moreover, massive amounts of virtual samples were generated to improve the probability of BWO/MIL discovery and the quality of new BWO/MILs. Based on the bound of each feature in the existing dataset, the following restrictions were obeyed when generating the new samples.
① Concentration of HNO3 (CHN) changes from 0.5 mol L−1 to 4.0 mol L−1 in steps of 0.1 mol L−1.
② The value of surfactant (Sur) is 0, 1 or 2.
③ Hydrothermal temperature (Thyd) ranges from 120 °C to 200 °C with steps of 5 °C.
④ Mole ratio of Bi2WO6 to MIL-53(Al) (Rm) ranges from 0.5 to 2 with steps of 0.01.
The IP of pattern recognition and the SVR-RBF model were employed to predict the class and DRRhB of each virtual sample by using the four key features. According to the results of virtual screening, the key features and the Fisher (1) values of the five samples with the top performance are shown in Table S3.† The experimental DRRhB values could likely reach 100 (the maximum value of DRRhB) because the predictive DRRhB values of the samples were already above the highest values (98) in the existing dataset. The two samples with the top DRRhB values among them are shown in Fig. 7 and marked by a purple half-empty circle. Therefore, the above is helpful for experimental researchers to explore the new BWO/MILs with enhanced photocatalytic activity.
4 Sensitivity analyses
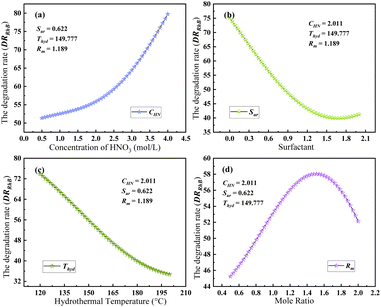
The essence of SA is to explain how the key indicator is affected by changing the values of the relevant variables one by one. Generally, the main parameters are selected for analyses of the sensitivity factors. In this work, the change of DRRhB with one of the key features was observed when the other features were set as their mean values. Fig. 9 shows the SA for the four features (CHN, Sur, Thyd and Rm) based on the SVR-RBF model. Fig. 9(a) illustrates that DRRhB increases with CHN when Sur, Thyd and Rm are 0.622, 149.777 and 1.189, respectively. In Fig. 9(b) and (c), DRRhB decreased with Sur and Thyd increase, respectively. The convex parabolic relationship between DRRhB and Rm is shown in Fig. 9(d). As a whole, Sur and Thyd are more sensitive factors than CHN and Rm because a small change in the two prior parameters could lead to a large change in DRRhB. From the trends of the four graphs in Fig. 9, the larger CHN, the smaller Sur and Thyd, and the appropriate Rm could result in a larger target value (DRRhB). In other words, it is beneficial to obtain a BWO/MIL with high DRRhB in the above adjustment direction of the experimental parameters. Apparently, SA can interpret the relationships between DRRhB and the features, instruct the adjustment direction of experimental parameters, and assist in revealing the mechanism of BWO/MIL synthesis.5 Conclusions
A ML-based photocatalyst module for advancing the design of BWO/MIL nano-photocatalysts with the desired photocatalytic performance was established in four steps, including dataset establishment, constructing the prediction model, optimization of experimental parameters and sensitivity analysis. By using FFS-SVR method, four key features (CHN, Sur, Thyd and Rm) were selected as the inputs of the model for predicting the DRRhB of BWO/MIL. The SVR-RBF model constructed with the key features and the optimal hyperparameters has better predictive performance and robustness, and can meet the requirements of rapid BWO/MIL design. The inverse projection based on Fisher method, SVR-RBF model and virtual screening were used to optimize the synthesis parameters of BWO/MIL and find BWO/MILs with higher DRRhB than the highest value in the existing dataset. A web service (http://1.14.49.110/online_predict/BWO2) based on the SVR-RBF model was constructed to predict the DRRhB of BWO/MILs, and it can be freely shared by all researchers interested in BWO/MILs. Furthermore, sensitivity analysis was introduced to analyze the relationship between DRRhB and the four key features. The MLM-BWO/MIL we constructed could be employed to accelerate the design of BWO/MILs with ideal performance and further promote research on ML-assisted material design. This research paradigm is suitable for accelerating the synthesis and development of new materials, including but not limited to photocatalysts. An online prediction service like those mentioned in the paper can be established when enough historical data for the materials are collected.Author contributions
X. Z. contributed to the writing of the original draft, review and editing, and assisted with the methodology. M. C. contributed to the writing of the original draft and assisted with the formal analysis, visualization, project administration, and investigation.Conflicts of interest
The authors state that there are no conflicts to declare.Acknowledgements
The authors acknowledge the financial supports from Sichuan Science and Technology Program of China (No. 2022YFG0318), Panzhihua Instructional Science and Technology Program of China (No. 2020ZD-G-11) and Panzhihua University Science and Technology Program of China (No. 2021PY009).References
- Y. Yang, H. Y. Tan and B. Cheng, et al., Near-Infrared-Responsive Photocatalysts, Small Methods, 2021, 5(4), 2001042 CrossRef CAS PubMed.
- L. Q. Yang, D. Q. Fan and Z. L. Li, et al., A Review on the Bioinspired Photocatalysts and Photocatalytic Systems, Adv. Sustainable Syst., 2022, 6(5), 2100477 CrossRef CAS.
- S. Ullah, E. P. Ferreira-Neto and A. A. Khan, et al., Supported nanostructured photocatalysts: the role of support-photocatalyst interactions, Photochem. Photobiol. Sci., 2023, 22(1), 219–240 CrossRef CAS PubMed.
- G. Lofrano, F. Ubaldi and L. Albarano, et al., Antimicrobial Effectiveness of Innovative Photocatalysts: A Review, Nanomaterials, 2022, 12(16), 2831 CrossRef CAS PubMed.
- I. Barba-Nieto, U. Caudillo-Flores and M. Fernandez-Garcia, et al., Sunlight-Operated TiO2-Based Photocatalysts, Molecules, 2020, 25(17), 4008 CrossRef CAS PubMed.
- A. Almasian, N. M. Mahmoodi and M. E. Olya, Tectomer grafted nanofiber: Synthesis, characterization and dye removal ability from multicomponent system, J. Ind. Eng. Chem., 2015, 32, 85–98 CrossRef CAS.
- N. M. Mahmoodi, M. Ghezelbash and M. Shabanian, et al., Efficient removal of cationic dyes from colored wastewaters by dithiocarbamate-functionalized graphene oxide nanosheets: From synthesis to detailed kinetics studies, J. Taiwan Inst. Chem. Eng., 2017, 81, 239–246 CrossRef CAS.
- F. Hosseini, S. Sadighian and H. Hosseini-Monfared, et al., Dye removal and kinetics of adsorption by magnetic chitosan nanoparticles: Desalination and Water Treatment, Desalin. Water Treat., 2016, 57(51), 24378–24386 CrossRef CAS.
- S. A. Hosseini, M. Vossoughi and N. M. Mahmoodi, et al., Clay-based electrospun nanofibrous membranes for colored wastewater treatment, Appl. Clay Sci., 2019, 168, 77–86 CrossRef CAS.
- S. R. Mousavi, M. Asghari and N. M. Mahmoodi, Chitosan-wrapped multiwalled carbon nanotube as filler within PEBA thin film nanocomposite (TFN) membrane to improve dye removal, Carbohydr. Polym., 2020, 237, 116128 CrossRef CAS PubMed.
- C. L. Yu, W. Q. Zhou and H. Liu, et al., Design and fabrication of microsphere photocatalysts for environmental purification and energy conversion, Chem. Eng. J., 2016, 287, 117–129 CrossRef CAS.
- S. Yanagida, Nano/microsized TiO2 composite photocatalysts for environmental purification, J. Ceram. Soc. Jpn., 2018, 126(8), 625–631 CrossRef CAS.
- E. Luevano-Hipolito, L. M. Torres-Martinez and L. V. F. Cantu-Castro, Self-cleaning coatings based on fly ash and bismuth-photocatalysts: Bi2O3, Bi2O2CO3, BiOI, BiVO4, BiPO4, Constr. Build. Mater., 2019, 220, 206–213 CrossRef CAS.
- Y. Horiuchi, T. Toyao and M. Takeuchi, et al., Recent advances in visible-light-responsive photocatalysts for hydrogen production and solar energy conversion - from semiconducting TiO2 to MOF/PCP photocatalysts, Phys. Chem. Chem. Phys., 2013, 15(32), 13243–13253 RSC.
- T. Takata and K. Domen, Particulate Photocatalysts for Water Splitting: Recent Advances and Future Prospects, ACS Energy Lett., 2019, 4(2), 542–549 CrossRef CAS.
- M. Padervand, F. Nasiri and S. Hajiahmadi, et al., Ag@Ag2MoO4 decorated polyoxomolybdate/C3N4 nanostructures as highly efficient photocatalysts for the wastewater treatment and cancer cells killing under visible light, Inorg. Chem. Commun., 2022, 141, 109500 CrossRef CAS.
- B. Leng, X. L. Zhang and S. S. Chen, et al., Highly efficient visible-light photocatalytic degradation and antibacterial activity by GaN:ZnO solid solution nanoparticles, J. Mater. Sci. Technol., 2021, 94, 67–76 CrossRef CAS.
- E. J. Li, L. Chen and Q. A. Zhang, et al., Bismuth-Containing Semiconductor Photocatalysts, Prog. Chem., 2010, 22(12), 2282–2289 CAS.
- M. Kitano, K. Tsujimaru and M. Anpo, Hydrogen production using highly active titanium oxide-based photocatalysts, Top. Catal., 2008, 49(1–2), 4–17 CrossRef CAS.
- X. Zhang and J. Fan, Carbon Materials Modified Bismuth Based Photocatalysts and Their Applications, Prog. Chem., 2016, 28(4), 438–449 CAS.
- J. D. Li, W. Fang and C. L. Yu, et al., Ag-based semiconductor photocatalysts in environmental purification, Appl. Surf. Sci., 2015, 358, 46–56 CrossRef CAS.
- L. Hu, Y. Zhang and W. Lu, et al., Easily recyclable photocatalyst Bi2WO6/MOF/PVDF composite film for efficient degradation of aqueous refractory organic pollutants under visible-light irradiation, J. Mater. Sci., 2019, 54(8), 6238–6257 CrossRef CAS.
- D. Q. He, H. C. Liu and Q. Wang, et al., Photo-Induced Charge Transfer on Pt/Bi2WO6 Composite Photocatalysts, J. Nanosci. Nanotechnol., 2020, 20(3), 1838–1844 CrossRef CAS PubMed.
- M. S. Gui, P. F. Wang and D. Yuan, et al., Synthesis and Visible-Light Photocatalytic Activity of Bi2WO6/g-C3N4 Composite Photocatalysts, Chin. J. Inorg. Chem., 2013, 29(10), 2057–2064 CAS.
- T. Chen, L. Z. Liu and C. Hu, et al., Recent advances on Bi2WO6-based photocatalysts for environmental and energy applications, Chin. J. Catal., 2021, 42(9), 1413–1438 CrossRef CAS.
- Y. K. Li, L. Chen and Y. Wang, et al., Advanced nanostructured photocatalysts based on reduced graphene oxide-flower-like Bi2WO6 composites for an augmented simulated solar photoactivity activity, Mater. Sci. Eng., B, 2016, 210, 29–36 CrossRef CAS.
- M. S. Gui, W. D. Zhang and Q. X. Su, et al., Preparation and visible light photocatalytic activity of Bi2O3/Bi2WO6 heterojunction photocatalysts, J. Solid State Chem., 2011, 184(8), 1977–1982 CrossRef CAS.
- J. X. Low, J. G. Yu and M. Jaroniec, et al., Heterojunction Photocatalysts, Adv. Mater., 2017, 29(20), 1601694 CrossRef PubMed.
- X. Li, R. C. Shen and S. Ma, et al., Graphene-based heterojunction photocatalysts, Appl. Surf. Sci., 2018, 430, 53–107 CrossRef CAS.
- J. W. Fu, J. G. Yu and C. J. Jiang, et al., g-C3N4-Based Heterostructured Photocatalysts, Adv. Energy Mater., 2018, 8(3), 1701503 CrossRef.
- A. Karami, R. Shomal and R. Sabouni, et al., Photocatalytic degradation of diclofenac using hybrid MIL-53(Al)@TiO2 and MIL-53(Al)@ZnO catalysts, Can. J. Chem. Eng., 2023, 101(5), 2660–2676 CrossRef CAS.
- F. Martinez, G. Orcajo and D. Briones, et al., Catalytic advantages of NH2-modified MIL-53(Al) materials for Knoevenagel condensation reaction, Microporous Mesoporous Mater., 2017, 246, 43–50 CrossRef CAS.
- B. L. Zhang, Design novel hard materials B3N4via first-principles calculation, J. Alloys Compd., 2016, 663, 862–866 CrossRef CAS.
- Z. S. Lin, X. X. Jiang and L. Kang, et al., First-principles materials applications and design of nonlinear optical crystals, J. Phys. D: Appl. Phys., 2014, 47(25), 253001 CrossRef.
- F. P. Wang, G. Y. Du and X. C. Liu, et al., Molecular dynamics application of cocrystal energetic materials: A review, Nanotechnol. Rev., 2022, 11(1), 2141–2153 CrossRef CAS.
- D. S. Chen, D. I. W. Levin and S. Sueda, et al., Data-Driven Finite Elements for Geometry and Material Design, ACM Trans. Graph., 2015, 34(4), 74 Search PubMed.
- C. Chen, Y. X. Zuo and W. K. Ye, et al., A Critical Review of Machine Learning of Energy Materials, Adv. Energy Mater., 2020, 10(8), 1903242 CrossRef CAS.
- J. Wei, X. Chu and X. Y. Sun, et al., Machine learning in materials science, InfoMat, 2019, 1(3), 338–358 CrossRef CAS.
- Y. Liu, T. L. Zhao and W. W. Ju, et al., Materials discovery and design using machine learning, J. Materiomics, 2017, 3(3), 159–177 CrossRef.
- Y. Liu, B. R. Guo and X. X. Zou, et al., Machine learning assisted materials design and discovery for rechargeable batteries, Energy Stor. Mater., 2020, 31, 434–450 Search PubMed.
- J. M. Bone, C. M. Childs and A. Menon, et al., Hierarchical Machine Learning for High-Fidelity 3D Printed Biopolymers, ACS Biomater. Sci. Eng., 2020, 6(12), 7021–7031 CrossRef CAS PubMed.
- T. G. Dietterich, P. Domingos and L. Getoor, et al., Structured machine learning: the next ten years, Mach. Learn., 2008, 73(1), 3–23 CrossRef.
- N. Kuhl, M. Schemmer and M. Goutier, et al., Artificial intelligence and machine learning, Electron. Mark., 2022, 32(4), 2235–2244 CrossRef.
- P. Ongsulee, Ieee, Artificial Intelligence, Machine Learning and Deep Learning, in 2017 15th International Conference on ICT and Knowledge Engineering, ICT&KE, 2017, pp. 92–97 Search PubMed.
- A. Merkin, R. Krishnamurthi and O. N. Medvedev, Machine learning, artificial intelligence and the prediction of dementia, Curr. Opin. Psychiatry, 2022, 35(2), 123–129 CrossRef PubMed.
- C. Yang, C. Ren and Y. Jia, et al., A machine learning-based alloy design system to facilitate the rational design of high entropy alloys with enhanced hardness, Acta Mater., 2022, 222, 117431 CrossRef CAS.
- P. S. Lamoureux, K. T. Winther and J. A. G. Torres, et al., Machine Learning for Computational Heterogeneous Catalysis, ChemCatChem, 2019, 11(16), 3579–3599 CrossRef.
- P. Raccuglia, K. C. Elbert and P. D. F. Adler, et al., Machine-learning-assisted materials discovery using failed experiments, Nature, 2016, 533(7601), 73–+ CrossRef CAS PubMed.
- J. M. Valente, S. Maldonado and SVR-FFS, A novel forward feature selection approach for high-frequency time series forecasting using support vector regression, Expert Syst. Appl., 2020, 160, 113729 CrossRef.
- S. Feng, H. Y. Zhou and H. B. Dong, Using deep neural network with small dataset to predict material defects, Mater. Des., 2019, 162, 300–310 CrossRef.
- S. Y. Dong, X. H. Ding and T. Guo, et al., Self-assembled hollow sphere shaped Bi2WO6/RGO composites for efficient sunlight-driven photocatalytic degradation of organic pollutants, Chem. Eng. J., 2017, 316, 778–789 CrossRef CAS.
- Y. Zhang, Degradation of aqueous refractory organic pollutants by PMS activated with MnFe2O4/MIL-53(Al) or visible-light photocatalysts composite Bi2WO6/MIL-53(Al) and composite film Bi2WO6/MIL-53(Al)/PVDF, MA thesis, Shanghai University, 2018 Search PubMed.
- X. Zhai and M. Chen, Comparison of Data-driven Prediction Methods for Comprehensive Coke Ratio of Blast Furnace, High Temp. Mater. Process., 2023, 42(1), 20220261 CrossRef CAS.
- Y. Y. Ma, J. W. Wang and X. Y. Luo, et al., Image steganalysis feature selection based on the improved Fisher criterion, Math. Biosci. Eng., 2020, 17(2), 1355–1371 Search PubMed.
- X. Y. Wu, X. Mao and L. J. Chen, et al., Kernel optimization using nonparametric Fisher criterion in the subspace, Pattern Recognit. Lett., 2015, 54, 43–49 CrossRef.
- Y. T. Wang, J. D. Wang and H. Y. Chen, et al., Semi-Supervised Local Fisher Discriminant Analysis Based on Reconstruction Probability Class, Int. J. Pattern Recognit. Artif. Intell., 2015, 29(2), 1550007 CrossRef.
- Q. X. Gao, J. J. Liu and H. J. Zhang, et al., Enhanced fisher discriminant criterion for image recognition, Pattern Recognit., 2012, 45(10), 3717–3724 CrossRef.
- Y. X. Liang, C. R. Li and W. G. Gong, et al., Uncorrelated linear discriminant analysis based on weighted pairwise Fisher criterion, Pattern Recognit., 2007, 40(12), 3606–3615 CrossRef.
- Q. Zhang, X. Y. Zhai and P. Xiong, et al., Prediction and synthesis of novel layered double hydroxide with desired basal spacing based on relevance vector machine, Mater. Res. Bull., 2017, 93, 123–129 CrossRef CAS.
- X. Zhai, M. Chen and W. Lu, Accelerated search for perovskite materials with higher Curie temperature based on the machine learning methods, Comput. Mater. Sci., 2018, 151, 41–48 CrossRef CAS.
- Q. Tao, T. Lu and Y. Sheng, et al., Machine learning aided design of perovskite oxide materials for photocatalytic water splitting, J. Energy Chem., 2021, 60, 351–359 CrossRef CAS.
- Q. Tao, D. Chang and T. Lu, et al., Multiobjective Stepwise Design Strategy-Assisted Design of High-Performance Perovskite Oxide Photocatalysts, J. Phys. Chem. C, 2021, 125(38), 21141–21150 CrossRef CAS.
- F. Macedo, M. R. Oliveira and A. Pacheco, et al., Theoretical foundations of forward feature selection methods based on mutual information, Neurocomputing, 2019, 325, 67–89 CrossRef.
- L. K. Luo, L. J. Ye and M. X. Luo, et al., Methods of forward feature selection based on the aggregation of classifiers generated by single attribute, Comput. Biol. Med., 2011, 41(7), 435–441 CrossRef PubMed.
Footnote |
| † Electronic supplementary information (ESI) available. See DOI: https://doi.org/10.1039/d3na00122a |
| This journal is © The Royal Society of Chemistry 2023 |

