 Open Access Article
Creative Commons Attribution 3.0 Unported Licence
Nanoclay-based conductive and electromagnetic interference shielding properties of silver-decorated polyaniline and its nanocomposites
Revanasiddappa
Moolemane
 *a,
Haridasa
Nayak
 b,
Naveen
Marudhachalam
c,
Anantha Krishnan
Coimbatore Venkatasubramanian
c,
Anirudh Raj
Arunachalam Chandra
c,
Arun
Murugappan Iyyappan
c and
Suresh Babu Naidu
Krishna
 *d
*d
aDepartment of Chemistry PES University Electronic City Campus, Bengaluru, India. E-mail: revanasiddappam@pes.edu
bDepartment of Mechanical Engineering PES University Electronic City Campus, Bengaluru, India
cDepartment of Electronics and Communication Engineering PES University Electronic City Campus, Bengaluru, India
dInstitute for Water and Wastewater Technology, Durban University of Technology, Durban-4000, South Africa. E-mail: sureshk@dut.ac.za
First published on 25th August 2023
Abstract
Polymer composite materials have seen rapid growth in popularity over the past two decades due to their ability to successfully combine the benefits of several different polymer composites into a single product. Conducting polymers (CPs) are more promising materials than other polymers due to their diverse electronic applications, including electromagnetic interference (EMI) shielding, light-emitting diodes, energy storage devices, and the most sophisticated forms of sensors. In this study, the effect of nanoclay on the electrical conductivity, humidity, and EMI shielding properties of silver-decorated polyaniline and its nanocomposites has been investigated. Silver-decorated polyaniline was prepared by using an in situ polymerization technique at 0–5 °C in the presence of ammonium persulphate, which acts as an oxidizing agent. Varied weight% amounts of nano clay were mixed in the conducting silver-decorated polyaniline to obtain their nanocomposite. The synthesized silver-decorated polyaniline and its composites were characterized by using several physical methods, viz., Fourier transform infrared (FT-IR) spectroscopy, X-ray diffraction (XRD) analysis, and scanning electron microscopy (SEM). All these spectral data reveal the structural characteristics, morphology, and uniform distribution of silver and nano clay particles in the conducting polymer composites. The AC electrical conductivity data show that increasing the nanocrystal weight percentage increases its electrical conductivity. The electromagnetic interference shielding effectiveness of silver-decorated polyaniline nano clay composites shows 90% attenuation between −5 and −8.5 dB. Humidity sensitivity showed a linear relationship with increasing nano clay weight in the decorated polyaniline due to the porosity of the nanoclays and specific adsorption of moisture content. Hence, these composites can be used as a promising material for humid sensors, EMI shielding, battery capacitors, and other technological applications.
1. Introduction
Conjugated conducting polymer nanocomposites, such as polyaniline, polythiophene, and polypyrrole incorporated with metal particles, have gained much attention in various fields in recent years. Due to their high surface area-to-volume ratios, these metal nanocomposites exhibit excellent optical and electronic properties.1 Polyaniline conducting polymers embedded with silver nanoparticles have been shown to exhibit efficient electrocatalytic properties,2 and have also been found to be useful in sensor devices3 and fuel cells.4 PANI has gained tremendous importance in the area of conducting polymers due to its decent environmental stability, ease of doping by chemical processes, and flexibility in synthesis, which can be readily obtained by oxidative polymerization chemical reactions of aniline.5 To enhance its mechanical, physical, and electrical properties, such as conductivity, magnetic and optical properties, PANI is often combined with metal particles like silver nanoparticles.6With numerous research efforts put into incorporating additional metal components, noble metal particles have become increasingly important in the field of electrochemical applications.7–11 Two primary parameters play a pivotal role in the conductivity properties of these composites. The first is the polymer's efficiency in charge transfer, and the second is the interchain transport behaviour. Polymers containing different π conjugations in the backbone of the structure have evolved significantly, as they represent the delocalization or movement of electrons. Conjugated systems with very characteristic alternate double bond-bearing conjugated polymeric systems lead to the stabilization of the molecule via delocalized electron density. Additionally, the physical and chemical properties of these aromatic conjugates are mainly driven by π electrons in the molecule.12–15 Very good, enhanced AC conductivity and dielectric properties of PANI have been reported upon mixing with magnetic oxides16 and metaldichalcogens.17 Although many methods have been studied with PANI, there are limited studies reported with noble metal oxides.
Given this insufficient insight, we focused on conducting a detailed study by choosing a nano clay filler with Ag-PANI to form a new Ag-PANI/NC composite and studied its transport properties by measuring AC conductivity, dielectric modulus, and dielectric constant. Nano clay is chosen for its various advantageous properties in our application. Nanoparticles like carbon nanotubes and graphene oxide are known for their exceptional electrical conductivities, making them highly suitable for electromagnetic interference (EMI) applications. When incorporated into a matrix, these nanoparticles form conductive pathways that efficiently absorb electromagnetic (EM) radiation. As a result, the stress generated by the absorbed radiation is effectively distributed throughout the matrix, ensuring its dissipation. This capability of nano clay significantly enhances the overall performance and effectiveness of our application in managing EMI-related issues. In this work we prepared a new composite using in situ chemical polymerization methods and conducted further characterization studies using Fourier transform infrared (FTIR) spectroscopy, X-ray diffraction (XRD), and scanning electron microscopy (SEM). The frequency range between 50 and 106 Hz was applied for the measurement of AC conductivity at room temperature, and the EMI shielding effectiveness was also measured.
2. Experimental
2.1 Materials
Nitric acid (HNO3) and aniline (C6H5NH2) were purchased from S.D. Fine Chemicals, Mumbai, India. Nano clay (NC) with a purity of 99.99% was obtained from Sigma Aldrich, India. Before being used in the synthesis, aniline was double-distilled for the preparation of nanocomposites. Deionized water was used in the complete synthesis of PANI and Ag-PANI/NC composites.2.2. Synthesis of polyaniline and Ag-PANI/NC composites
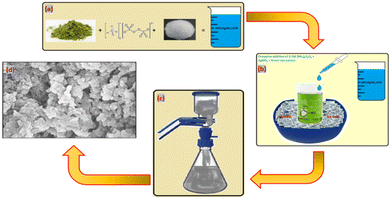
In the process shown in Scheme 1, first, 2 moles of aniline were dissolved in a beaker with the help of 2N hydrochloric acid. To initiate the oxidation process, a mixture consisting of 0.1 moles of (NH4)2S2O8, green tea extract, and silver nitrate was added dropwise to a solution of 2 M aniline in HNO3 while maintaining a controlled temperature using an ice bath. The initial colour of the solution was dark green, indicating the formation of a polyaniline matrix embedded with Ag nanoparticles. The temperature and protonic acid concentration were critical factors affecting the initial colouration during the mixing of reactants. Hydrochloric acid acted as the protonic acid, and the temperature was maintained between 0 and 20 °C with the help of a freezing mixture. During the reaction, the colour of the solution changed from light blue to blue green, then to a coppery tint, before finally precipitating with dark green silver decorated PANI treated with nano clay. The resulting composites were crushed into fine-grained powder and evaporated with acetone until complete evaporation. Circular pellets of the nanocomposites were then made using a hydraulic press with an applied pressure of 70 MPa. Silver paste was applied to either side of the pellets to improve electrical contact.2.3. Characterization of composites
Powder X-ray diffraction spectra of pure PANI and 10% Ag-PANI/NC composites were obtained using a Bruker D8 Advance X-ray diffractometer with a Cu Kα source (λ = 1.541 Å) in the range of 2θ = 05° to 90°. FTIR spectra of the composites were collected using a Frontier PerkinElmer instrument in the range of 250–4000 cm−1. SEM images of the samples were captured using a Zeiss Ultra 60 instrument by loading them onto aluminium tape.2.4. AC conductivity measurements
The samples were ground for approximately an hour using a pestle and mortar. Pellets of Ag-doped polyaniline and its nano clay composites, with a diameter of 13.4 mm and a thickness of 0.4 mm, were obtained by pressing the samples with a hydraulic pressure of around 6 tons. AC readings were then taken in the frequency range of 50–106 Hz using a digital LCR meter (Japan) and a Hioki model 3532-50, which was connected to a programmable computer.2.5. Humidity sensing measurements
At 25 °C, humidity response measurements of synthesized samples were conducted using a Mextech-DT-615 instrument. The synthesized samples were dispersed in m-cresol before being coated onto a Petri dish to produce a thin film with a thickness of 1 μm using a spin coating unit. The film was then placed in a sealed glass chamber that maintained the desired relative humidity environments.3. Results and discussion
3.1. FTIR studies
The FT-IR spectra of nano clay are as shown in Fig. 1(a) with the band at 535 cm−1 indicating metal–O absorption and the band at 3515 indicating O–O stretching frequency, which is consistent with earlier reports.18 In Fig. 1(b), the FT-IR spectra of Ag-PANI are seen which exhibit a characteristic band at 1345 cm−1. This intense and very sharp frequency band denotes the Ag-PANI vibrations, providing evidence to support the metal–polymer stretching frequency. As shown in Fig. 2(c), the characteristic absorption band at 3342 suggests the NH stretching vibrations of Ag-PANI/NC-10%. Minor variations in the band indicate the integrated metal oxide in the composite causing broadness and minor shift in the frequencies. Another frequency band at 535 cm−1 also suggests nano clay incorporation in the composite.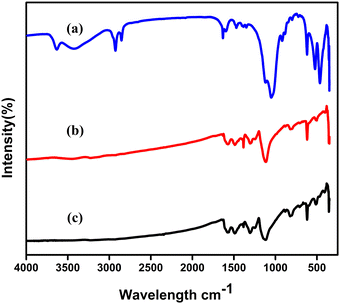 | ||
| Fig. 1 FTIR spectra of (a) nano clay, (b) Ag-PANI, and (c) Ag-PANI/NC composites with varied wt% of NC. | ||
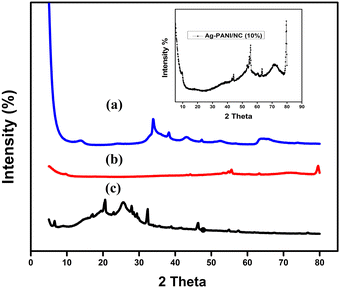 | ||
| Fig. 2 XRD pattern of (a) pure nano clay (b) Ag-PANI, and (c) XRD pattern of Ag-PANI/NC-10% (inset). | ||
3.2. XRD studies
The XRD (X-ray diffraction) spectrum of nano clay (Fig. 2(a)) can provide valuable information about the crystalline structure and phase composition of the material. Nano clay is typically composed of layered silicate minerals, such as montmorillonite or kaolinite, which have a characteristic structure and XRD pattern. Peaks in the 2θ range of 5–10° correspond to the basal spacing of the clay mineral layers. This spacing is determined by the distance between the layers of silicate minerals, which can be affected by factors such as hydration, cation exchange, and intercalation with organic or inorganic compounds. Peaks in the 2θ range of 20–30° correspond to the characteristic reflections of the clay mineral structure, which is composed of stacked layers of silicate minerals. Fig. 2(b), the diffraction pattern of Ag-PANI exhibits Bragg law reflections at 2θ = 20° and 26°.19Fig. 2(c) shows the diffraction pattern of Ag-PANI/NC-10% composite synthesized by chemical polymerization technique. The characteristic peaks of nano clay are visible with noticeable intensity, and the composite displays the same (111) crystal plane as one of the favoured conformations. Most of the peaks indicate the presence of NC in the prepared composite, retaining its crystalline phase, suggesting that nano clay is clearly implanted in the matrix of Ag-PANI chains. It is important to note that with the increase in weight percent of nano clay in the nanocomposite has significant effect. However, the interpretation of the XRD spectrum may require additional information and analysis, such as SEM or TEM imaging, to fully understand the nature and properties of the composite material.3.3. Scanning electron microscopic (SEM) studies
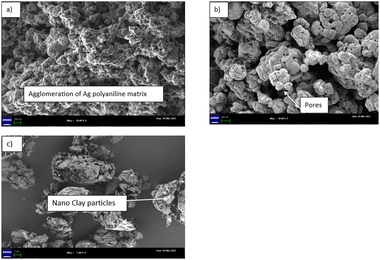
Fig. 3(a) shows Ag-PANI particles in granular shapes with a size of around 100 to 125 nm. Fig. 3(b) represents the morphology of Ag-PANI/NC-10%, which consists of wafer-like shapes with uneven surfaces and sizes in the range of 50 to 200 nm. The aggregated structures in nano clay, which are not compactly packed, lead to an increase in the interstitial distance in the composite. This results in a reduction in the conductivity of the nanocomposite.20Fig. 3(c) shows the morphology of nano clay, which consists of granular non-uniform spherical-like structures with non-uniform surfaces and sizes ranging from 70 to 180 nm. This morphology is suitable for gas and humidity sensing and is also helpful in EMI shielding applications. The recent literature reports a similar type of morphology.3.4. AC conductivity
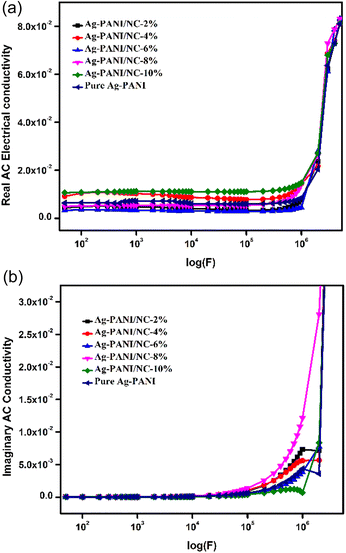
The AC conductivity value in disordered materials can be determined using the formula σ(f) = σ′(f) − σ′′(f), where σ′(f) represents the real part and σ′′(f) represents the imaginary part. Generally, the behaviour of the real part of AC conductivity, σ′(f), in disordered materials follows a certain pattern. Fig. 4(a) shows the results of AC conductivity measurements at varying frequencies (ranging from 50 Hz to 1 MHz) for different composite concentrations (ranging from 2% to 10%). At frequencies between 50 Hz and 1 MHz, the measured conductivity of composites with concentrations from 4% to 8% increased linearly with applied frequency, from 10−10 S m−1 to 10−7 S m−1. The 2% composite showed a different pattern compared to the 4% to 8% composites, exhibiting a much greater increase (∼10-fold) in conductivity (from 10−8 S m−1 to 10−6 S m−1) at a frequency of 104 Hz, and maintained this conductivity level at frequencies up to 1 MHz. Interestingly, the 8% composite demonstrated a distinct conductivity trend, with a higher conductivity level (between 10−7 S m−1 and 10−6 S cm−1) regardless of applied frequency. This suggests that an efficient interstitial arrangement could be the cause of the enhanced conductivity in the 10% composite compared to the other nano clay composites and simple Ag-PANI nanoparticles. Additionally, Fig. 4(b) shows imaginary AC conductivity measurements with variation in applied frequency for NC doped Ag-PANI with 2, 4, 6, 8 and 10 wt% amounts. The conductivity seems to be the same for all doping concentrations until higher frequencies in the imaginary ac conductivity. For higher frequencies, the 8% PANI-Ag exhibits more conductivity than the others. As compared to other doping concentrations, 10% PANI-Ag has the lowest conductivity and a substantial loss. Except for 10% PANI-Ag, the imaginary conductivity appears to be the same at very high frequencies for all concentrations.3.5. Dielectric studies
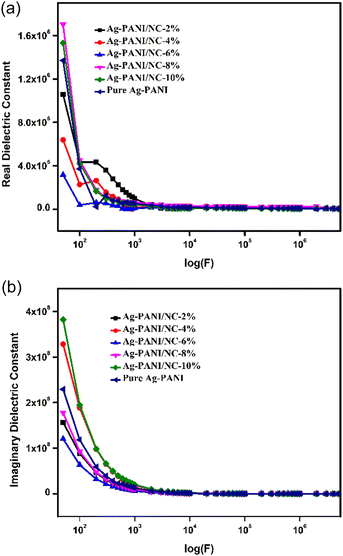
Dielectric constant data were collected for all the composites as a function of applied frequency. Fig. 5(a) shows the change in dielectric constant values for Ag-PANI/NC composites as the applied AC frequency varies. At lower frequencies, particularly at 50 Hz, the dielectric constant for composites with concentrations from 2% to 8% was around 10, with a slight decrease to just under 10 for the 4%, 6%, and 8% composites. Notably, the 8% composite had slightly lower dielectric constant values of around 5, indicating its interfacial arrangement and better charge transfer properties at this concentration. In contrast, the 10% composite exhibited a different behaviour, with a two-fold higher dielectric constant of around 103 at lower frequencies, followed by a very linear decrease as the frequency increased. This gradual decrease in dielectric constant values with increasing applied frequency is typical of conducting polymer nanocomposites, as reported in recent studies.17 Larger permittivity readings at smaller frequencies may be attributed to electrode polarization and space charge polarization effects.21,22 The decrease in dielectric constant values with increasing applied frequencies can be explained using the Maxwell–Wagner polarization model.23,24 The variation in the dielectric constant at different frequencies can be explained by the hopping frequency of charge carriers, which tends to follow the applied frequency and results in higher dielectric constant values. At higher frequencies, the hopping frequency lags behind the applied AC frequency field, resulting in random dipolar orientation and lower dielectric constant values.25Fig. 5(b), the imaginary dielectric constant, also known as the loss factor, is a measure of the energy that is lost as heat when a material is subjected to an electromagnetic field. In the case of composites containing 2%, 4%, 6%, 8%, and 10% of silver-polypyrrole/polyaniline nanocomposites (Ag-PANI/NC), the imaginary dielectric constant varies with the applied frequency. At low frequencies, the imaginary dielectric constant is typically small, indicating that little energy is lost as heat. As the frequency increases, the imaginary dielectric constant typically increases, indicating that more energy is being lost as heat. The rate at which the imaginary dielectric constant increases with frequency depends on the composition of the composite. In general, the imaginary dielectric constant tends to increase as the percentage of Ag-PANI/NC in the composite increases. This is because the presence of Ag-PANI/NC particles increases the number of interfaces in the composite, which in turn increases the amount of energy that is lost as heat. However, the rate at which the imaginary dielectric constant increases with frequency is not necessarily the same for all compositions. For example, at a given frequency, the imaginary dielectric constant for the 2% composite may be lower than that for the 4% composite, but higher than that for the 6% composite. The exact relationship between composition and imaginary dielectric constant will depend on the specific properties of the materials used in the composite and the frequency range over which the measurements are taken.26,27
Consequently, the drop in the dielectric constant and the conductivity with the applied frequency, show that the higher values of the dielectric constant are due to the conduction relaxation as discussed earlier. High dielectric loss at the lower frequencies in all the composites may be correlated to the losses due to DC conduction. The real part of AC conductivity, dielectric constant and dielectric loss all displayed the diminishing trend in the low-frequency region, with the increase in wt% of nano clay. This behaviour indicates the role of conduction charge carriers in the dielectric response. As a result, these findings have broader implications than those of the tendencies identified with lower doping levels.
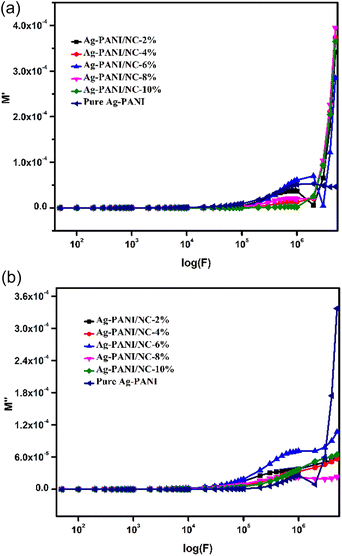
The electrical modulus behaviour was also investigated, by analysing the complex permittivity (ε*) in relation to the electrical modulus (M′ and M′′). This analysis can provide additional insight into the charge transport mechanism in the composites. Fig. 6(a) shows the plot of M′ and M′′ as a function of frequency for Ag-PANI/nano clay composites of different concentrations. The position of the peaks in the electrical modulus plot provides information on the characteristic time scale of the charge carrier dynamics in the composites. The characteristic time scale is related to the hopping frequency of charge carriers, which is associated with the dielectric relaxation mechanism.28,29
| M* = M′ + M′′ | (1) |
 | (2) |
 | (3) |
The changes in the real part of the dielectric modulus (M′) as a function of the logarithm of applied frequency of the composite system are shown in Fig. 6(a). The results of (M′) can be divided into two fractions, as observed from the graph. The first fraction corresponds to the 2%, 4%, 6%, and 8% composites, which exhibit a plateau pattern indicating no variation in the M′ values at the applied frequency range. This suggests that the polarization of the electrode to M′ remains a constant attribute of the nanocomposite materials. The second fraction corresponds to the 10% composite, where there is a linear increase of (M′) with applied frequency, which tends to flatten at higher frequencies. These values can be evaluated in accordance with the conduction phenomenon linked to the short-range mobility of charge carriers, especially ions.
Fig. 6(b) displays the readings for the imaginary part (M′′) of the electrical modulus with variation in the applied frequency logarithm (F). The transport of ions can be observed in the 10% composite, as the imaginary part of the electrical modulus is found to be lower at lower applied frequencies. Imperfections in the crystalline phase can be observed by well-resolved relaxation, which originates in these curves. The graphs clearly show that the peak intensity of M′′ increases with an increase in the frequency logarithm (F), which is attributed to the contribution of nano clay to the relaxation process.
3.6. EMI shielding effectiveness studies
In recent years, there has been significant research focused on enhancing the electromagnetic interference (EMI) shielding performance of conductive polymer composites through the construction of multiple interfaces. These interfaces play a crucial role in improving the overall shielding effectiveness of the materials. Several noteworthy studies have been conducted in this area, shedding light on various techniques and approaches.A new study29 investigates the effect of micro-wrinkles and micro-cracks on the surface of copper-coated carbon nanotubes/polydimethylsiloxane composites on their microwave shielding ability. The findings emphasize the significance of surface shape in improving EMI shielding performance.
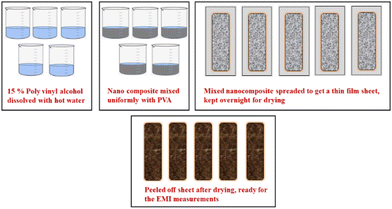
The process for preparing thin films for EMI measurements is schematically shown in Fig. 7. Firstly, a 15% polyvinyl alcohol (PVA) solution was prepared by dissolving approximately 15 g of solid PVA in 100 mL of hot water while continuously stirring. Then, 250 mg of each composite with concentrations of 2%, 4%, 6%, 8%, and 10% were added to the PVA solution with gentle stirring to obtain a uniform solution. The final solution obtained had a semi-viscous consistency. This solution was then spread onto a glass plate to form a thin film and left to air dry overnight. The dried thin films were peeled off from the glass plate and their thickness was measured to be 0.02 micrometres. These films were used to measure SE readings. Similarly, blank PVA and Ag-PANI films were also prepared and their values were recorded similar to the values obtained for the composites.
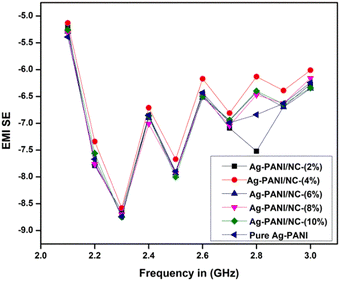
The electromagnetic interference shielding effectiveness of Nano clay-based composites (2 to 10%) was studied in the frequency range of 2.1 GHz to 3.0 GHz (S-band). As shown in Fig. 8, the Ag-PANI-based nano clay composites exhibited shielding effectiveness through both reflection and absorption. The electromagnetic interference shielding effectiveness of all composites showed a wave-like variation with frequency. It is evident that the addition of nano clay to the matrix improved SE in the dynamic frequency range of 2.3 GHz. Moreover, the EMI SE exhibited a significant difference for 10% composites and pure nano clay across the measured frequency range, indicating the effect of nano clay as a filler that aids in higher electrical conductivity, resulting in effective shielding. The AC conductivity and EMI SE results correlated well with the highly conductive behaviour of nano clay. To gain a clear understanding of the loss of applied frequency between the transmitting antenna and the receiving antenna in the waveguide used for the measurements, we applied the free space path loss formula (4).
 | (4) |
3.7. Humidity sensing measurements
Humidity sensing measurements at 25 °C and humidity response measurements of synthesized samples were conducted using a locally fabricated humidity sensing measurement setup. The synthesized samples were dispersed in m-cresol before being coated onto a glass plate to produce a thin film with a thickness of 1 μm using a spin coating unit. The film was then placed in a sealed glass chamber that maintained the desired relative humidity environments.The resistance of the samples shows a non-linear downward trend as the humidity level increases, due to the physisorption of water molecules of pure Ag-PANI (Fig. 9(a)) and composite (Fig. 9(b)). At low relative humidity (RH), water molecules are physisorbed on the favourable kink sites of nano clay layered structure sheets via double hydrogen bonding. In the physical adsorption of the first layer, proton transfer between adjacent hydroxyl groups becomes restricted, resulting in intrinsic conductance. As the RH increases, water molecules are absorbed by single hydrogen bonding on the hydroxyl groups penetrating the interior of nano clay layers. Consequently, water molecules become mobile, and proton hopping between nearby water molecules becomes more prevalent in a graphene sheet, with charge mobility mediated via conductivity.
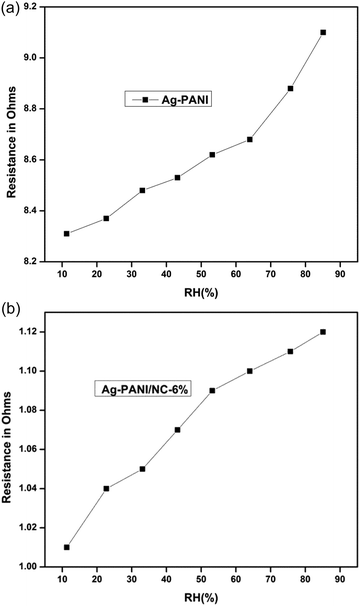 | ||
| Fig. 9 (a) Pure Ag-PANI variation of resistance as a function of % relative humidity. (b) Variation of resistance as a function of % relative humidity 6% Ag-PANI/NC composites. | ||
4. Conclusions
The in situ chemical polymerization method was used to successfully synthesize Ag-PANI/NC composites. The surface morphology and composition were analysed using SEM, while FTIR spectroscopy was used to determine the characteristic frequency for the identification of the composite. The presence of nano clay in the synthesized silver PANI/NC composite was confirmed by the pXRD pattern. The AC conductivity and dielectric properties of the composites were systematically studied and exhibited conducting material behaviour in agreement with the critical applied frequency. The increased conductivity with increasing nano clay concentration at the 10% level indicates the effective interfacial arrangement of the dopant in the composite. The EMI SE results were well correlated with the AC conductivity measurements and revealed the conducting behaviour of nano clay. The conductivity of all the composites increased with applied frequency, and the higher conductivity of the 8% composites suggests that they may have preferential use in higher-frequency operating devices. Ag-PANI/NC composites forming a system of conducting polymer-nano clay composites can be used for device applications in the medium frequency range. Also, the system offers an interesting humidity sensing performance which can be extended to the other rare-earth oxides.Author contributions
Revanasiddappa: conceptualization, data curation, validation. resources, formal analysis, project administration, supervision, writing – original draft, review and editing. Haridasa Nayak: writing original draft, review and editing. M Naveen: investigation, validation. C V Anantha Krishnan: methodology, investigation. A C Anirudh Raj: data curation, validation. Arun Murugappan I: data curation. Suresh Babu Naidu Krishna: data curation, resources, formal analysis, validation, writing – review and editing.Conflicts of interest
There are no conflicts to declare.Acknowledgements
The authors would like to express their gratitude to the management of PES University, Electronic City Campus, Bangalore, and the Vision Group on Science and Technology for their support in carrying out this research work, under the grant PESUIRF/Chemistry-ECC/2020/14 dated 30-09-2020. KSBN would like to thank Durban University of Technology for research fellowship and Director, Institute for Water and Wastewater Technology, Durban University of Technology, Durban, South Africa.References
- K. Vanitha, K. A. Vijayalakshmi, M. Revansidddappa, S. B. Chalvaraju, K. Sadasivam and M. Thirumoorthy, Electrical Conductivity of DC, AC of Polyaniline/NLS FA/Silver Nano Particle with Low Temperature Plasma, J. Xidian Univ., 2023, 17(3), 446–461 Search PubMed.
- C. H. Abdul Kadar, M. Faisal, N. Maruthi, N. Raghavendra, B. P. Prasanna, K. R. Nandan, S. R. Manohara, M. Revanasiddappa and C. K. Madhusudhan, Anticorrosive Polypyrrole/Barium ferrite (PPy/BaFe12O19) composites with tunable electrical response for electromagnetic wave absorption and shielding performance, J. Electron. Mater., 2023, 52(3), 2080–2093 CrossRef.
- B. M. Basavaraja Patel, M. Revanasiddappa, S. Yallappa1 and D. R. Ramaswamy, Iron nanoparticles embedded in polypyrrole and tellurium oxide ternary nanocomposites for electrical conductivity and electromagnetic interference shielding, J. Mater. Sci.: Mater. Electron., 2023, 34, 1–16 CrossRef.
- C. C. Inagaki, M. M. Oliveira and A. J. G. Zarbin, Direct and one-step synthesis of polythiophene/gold nanoparticles films through liquid/liquid interfacial polymerization, J. Colloid Interface Sci., 2018, 516, 498–510 CrossRef CAS PubMed.
- A. T. Mthew, K. B. Akshaya, T. P. Vinod, A. Varghese and L. George, TEMPO-mediated aqueous phase electrooxidation of pyridyl methanol at palladium-decorated PANI on carbon fibre paper electrode, ChemistrySelect, 2020, 5, 3283–3294 CrossRef.
- N. Bouzayen, H. Sadki and M. Mbarek, Synthesis, characterization, DFT and TD-DFT studies of novel carbazolebased copolymer used in high efficient dye-sensitized solar cells, Polym. Test., 2018, 66, 78–86 CrossRef CAS.
- Y. Cai, X. Xue and G. Han, et al., Novel π-conjugated polymer based on an extended thienoquinoid, Chem. Mater., 2018, 30(2), 319–323 CrossRef CAS.
- D. Keles, M. C. Erer and E. Bolayir, et al., Conjugated polymers with benzothiadiazole and benzotriazole moieties for polymer solar cells, Renewable Energy, 2019, 139, 1184–1193 CrossRef CAS.
- Z. M. E. Fahim, S. M. Bouzzine, Y. Ait Aicha, M. Bouachrine and M. Hamidi, The bridged effect on the geometric, optoelectronic and charge transfer properties of the triphenylamine–bithiophene-based dyes: a DFT study, Res. Chem. Intermed., 2018, 44(3), 2009–2023 CrossRef CAS.
- R. Megha, Y. T. Ravikiran, S. C. Vijaya Kumari and S. Thomas, Influence of n-type nickel ferrite in enhancing the AC conductivity of optimized polyaniline-nickel ferrite nanocomposite, Appl. Phys. A: Mater. Sci. Process., 2017, 123, 245 CrossRef.
- S. Manjunatha, T. Machappa, A. Sunilkumar and Y. T. Ravikiran, Tungsten disulfide: An efficient material in enhancement of AC conductivity and dielectric properties of polyaniline, J. Mater. Sci., 2018, 29, 11581 CAS.
- R. Megha, Y. T. Ravikiran, S. C. V. Kumari, H. G. R. Prakash, C. H. V. V. Ramana and S. Thomas, Compos. Interfaces, 2019, 26, 309 CrossRef CAS.
- K. S. Siddiqi and A. Husen, Green synthesis, characterization and uses of Palladium/Platinum nanoparticles, Nanoscale Res. Lett., 2016, 11, 482 CrossRef PubMed.
- F. Koohpeima, M. J. Mokhtarai and S. Khalafi, The effect of silver nanoparticles on composite shear bond strength to dentin with different adhesion protocols, J. Appl. Oral Sci., 2017, 25(4), 367–373 CrossRef CAS PubMed.
- M. K. Nasrabadi, A. E. Moghadam, R. Kumar and N. Nabipour, Electrochemical Performance Improvement of the Catalyst of the Methanol Microfuel Cell Using Carbon Nanotubes, Int. J. Chem. Eng., 2021, 2021, 8894768 Search PubMed.
- G. C. Marjanovic, Recent advances in polyaniline research: Polymerization mechanisms, structural aspects, properties and applications, Synth. Met., 2013, 177, 1 CrossRef.
- H. M. Kim, C. Y. Lee and J. Joo, AC dielectric relaxation of lightly hydrochloric-acid (HCl)-doped polyanilines, J. Korean Phys. Soc., 2020, 36(6), 371–375 Search PubMed.
- S. Sinha, S. K. Chatterjee, J. Ghosh and A. K. Meikap, Analysis of the dielectric relaxation and ac conductivity behaviour of polyvinyl alcohol-cadmium selenide nanocomposite films, Polym. Compos., 2017, 38, 287 CrossRef CAS.
- N. Rezlescu and E. Rezlescu, Dielectric properties of copper containing ferrites, Phys. Status Solidi, 1974, 23, 575 CrossRef CAS.
- I. Sadiq, S. Naseem, M. N. Ashiq, M. A. Khan, S. Niaz and M. U. Rana, Structural and dielectric properties of doped ferrite nanomaterials suitable for microwave and biomedical applications, Prog. Nat. Sci.: Mater. Int., 2015, 25(5), 419–424 CrossRef CAS.
- J. Bao, J. Z. Zhenxing, Y. Longtu and L. Z. Gui, Dielectric behaviour of Mn-substituted Co2Z hexaferrites, J. Magn. Magn. Mater., 2002, 250(131), 40 Search PubMed.
- V. R. Ramani, B. M. Ramani, A. D. Saparia, D. Dhruv and J. H. Markna, Synthesis and optical characterization of CuO nanoparticles on solar borosilicate glass, J. Nano Res., 2016, 37, 68–73 Search PubMed.
- Z. Yua and C. Angb, Maxwell–Wagner polarization in ceramic composites BaTiO3-Ni0.3Zn0.7Fe2.1O4, J. Appl. Phys., 2002, 91(2), 794–797 CrossRef.
- T. A. Hanafy, K. Elbanna and S. Sayed, Dielectric relaxation analysis of biopolymer poly(3-hydroxybutyrate), J Apl Polym Sci, 2011, 21, 3306–3313 CrossRef.
- P. Maji, P. P. Pande and R. B. Choudary, Effect of Zn (NO3)2 filler on the dielectric permittivity and electrical modulus of PMMA, Bull. Mater. Sci., 2015, 38, 417–424 CrossRef CAS.
- N. S. Alghunaim, Effect of CuO nanofiller on the spectroscopic properties, dielectric permittivity and dielectric modulus of CMC/PVP nanocomposites, J. Mater. Res. Technol., 2019, 8, 3596–3602 CrossRef CAS.
- M. Rahaman, T. K. Chaki and D. Khastgir, Development of high-performance EMI shielding material from EVA, NBR, and their blends: effect of carbon black structure, J. Mater. Sci., 2011, 46, 3989–3999 CrossRef CAS.
- A. A. Al-Ghamdi, O. A. Al-Hartomy, F. R. Al-Solamy, N. T. Dishovsky, P. Malinova, N. T. Atanasov and G. L. Atanasova, Correlation between electrical conductivity and microwave shielding effectiveness of natural rubber based composites, containing different hybrid fillers obtained by impregnation technology, Mater. Sci. Appl., 2016, 7, 496–509 CAS.
- Q.-M. He, J.-R. Tao, Y. Yang, D. Yang, K. Zhang and M. Wang, Effect surface micro-wrinkles and micro-cracks on microwave shielding performance of copper-coated carbon nanotubes/polydimethylsiloxane composites, Carbon, 2023, 213, 118–216, DOI:10.1016/j.carbon.2023.118216 , ISSN 0008-6223.
| This journal is © The Royal Society of Chemistry 2023 |

