 Open Access Article
Creative Commons Attribution 3.0 Unported Licence
Investigation of indoor air quality in university residences using low-cost sensors†
Rowshon
Afroz
 ,
Xinyang
Guo
 ,
Chu-Wen
Cheng
 ,
Ariel
Delorme
,
Ryan
Duruisseau-Kuntz
and
Ran
Zhao
,
Ariel
Delorme
,
Ryan
Duruisseau-Kuntz
and
Ran
Zhao
 *
*
Department of Chemistry, University of Alberta, Edmonton, Alberta T6G 2G2, Canada. E-mail: rz@ualberta.ca
First published on 13th January 2023
Abstract
Exposure to air pollutants can cause serious adverse effects on human health; thus, indoor air quality (IAQ) is an important health and safety concern for occupants. A significant fraction of university students live in institution-managed residences. The length of time they spent in the residences, along with the negative impact of air pollutants on their health and academic performance, necessitate the need for continuous monitoring of IAQ in student residences. This study represents the first application of a low-cost sensors (LCS) network in university residences. Four major IAQ parameters (i.e., particulate matter (PM2.5), carbon dioxide (CO2), temperature, and relative humidity) were monitored in five residences in a Canadian university for five months. Questionnaires were used to investigate students' lifestyles and their relationship with air pollutants. The results of this study show that indoor activities, such as cooking and humidifier use, can generate indoor PM2.5 with daily average concentrations higher than the maximum exposure limit recommended by the US Environmental Protection Agency. The study also found that the building ventilation behavior and outdoor temperature affected the indoor CO2 and PM2.5 concentrations. Additionally, a correlation between indoor and outdoor PM2.5 concentrations indicated the impact of outdoor air on indoor air quality. Besides these scientific findings, this study demonstrated that spatiotemporally-resolved, personalized IAQ provided by LCS could benefit the controlling and mitigation of the risks associated with indoor air pollutant exposure. An LCS network can serve as an affordable strategy to monitor students' living environment on university campuses.
Environmental significanceIndoor air pollutants can cause serious health problems. People spend approximately 90% of their time indoors, and this fraction is higher for students living in campus residences. However, the IAQ study at student residences has been absent from the literature. This study used a low-cost air quality sensor network to monitor IAQ in student residences for the first time. Our study found that indoor activities, building ventilation, outdoor air, and weather could influence IAQ. Some of these factors elevated indoor pollutant levels above the recommended daily exposure limits. Thus, our study demonstrated that IAQ monitoring using a low-cost sensor network could help to control pollutant levels and mitigate the risks of exposure. |
1 Introduction
Air pollution is a leading risk factor for human morbidity and mortality.1 According to the world health organization (WHO),2 household air pollution exposure contributes 2 million deaths annually. This number surpasses those due to the use of tobacco, AIDS, tuberculosis, and malaria.3 Air pollution generally consists of a complex mixture of substances that generate adverse effects on human health. The impact of air pollution is not restricted to outdoor areas. The US Environmental Protection Agency (US EPA) states that indoor air can be more polluted than outdoor air, and indoor air quality (IAQ) is one of the top five environmental public health risk factors.4 Numerous species can contribute to the deterioration of IAQ levels, including particulate matter (PM), volatile organic compounds (VOCs), gasses (O3, CO, CO2, NO2, and SO2), and biological particles such as pollen, bacteria, and fungi.5,6 Some research indicates that people spend approximately 90% of their time indoors, which is expected to be even higher for students living in campus residences.7 It is estimated that over 1.6 million full-time students were enrolled in 2018–2019 across Canada, and this number has grown by 18% over the past decade.8 The same report also presented an analysis of the student accommodation of the 13 largest post-secondary institutions in Canada, showing that 11.4% of full-time students were residing in university-run student accommodation, and the percentages are increasing daily. Students in residences are particularly vulnerable to indoor air pollution as they have little control over their living spaces and are unaware of potential risks associated with IAQ. Finding a reliable and low-cost method for measuring IAQ to monitor pollutants and their impacts on students' health is crucial, but there are very few such attempts reported in the literature. For example, the effect of ventilation on IAQ of the student dormitories in China was researched by Yang et al.7 and Li et al.9 Liang et al.,10 studied the biological responses of the dorm students associated with traffic emission using high-resolution metabolomics. There is a lack of studies that performed continuous measurements of IAQ in the actual living spaces of students. Particularly, the measurement of indoor air pollutants at Canadian university student residences has been absent from the literature. Most of Canadian universities experience harsh winter conditions and may face unique challenges in maintaining IAQ during winter months.Traditionally, air pollutant concentration monitoring has relied on expensive government-authorized regulatory monitoring sites, which are often located far from individual sources. Air pollutant concentrations can exhibit significant spatiotemporal variability depending on the origins and features of that environment.11 The existing monitoring instruments cannot capture these variations.12 Continuous, spatiotemporally resolved, and personalized information on indoor pollutants can elucidate the trends of air pollutants in students' living places, which serve as health indicators. The real-time data could also educate the occupants and help them take action and seek resources to control and mitigate those indoor pollutants.1,13 However, efforts to collect comprehensive IAQ data are limited by the cost and size of reference-quality monitors, sample analysis, and data processing. In recent years, low-cost sensors (LCS) have become an alternative that allows continuous air quality measurements on both the community and individual levels.14 These devices are portable, affordable, and user-friendly.1,15 In the last few decades, numerous studies have demonstrated applications and limitations of LCS, such as guidelines for implementing an LCS network, improving the resolution of concentration coverage, air quality monitoring in the indoor environment, and outdoor measurement, e.g., detecting wildfire emissions.7,16,17 LCS needs to be calibrated, and data must be interpreted with care to avoid inaccuracies.18–20 EPA suggested that these sensors cannot be used for regulatory monitoring but for non-regulatory, supplemental, or informational monitoring applications. Nonetheless, air quality monitoring through LCS can provide useful information for a variety of applications, such as assessing the impacts of technology, long-term health impact studies, citizen participation in research, empowering regulatory decision-making through the incorporation of data science techniques, and providing guidance in real-time.21,22
Among the most common indoor pollutants, particles with an aerodynamic diameter smaller than 2.5 μm (PM2.5) and CO2 are frequently monitored. PM2.5 and CO2 have unique sources indoors; and as such, their indoor concentrations serve as effective indicators of IAQ. PM2.5 can travel within the airway and deposit or settle in the tracheobronchial portion of the lungs and even smaller particles in the gas-exchange volume of the lungs. The indoor PM2.5 concentration varies considerably from less than 10 μg m−3 to hundreds of μg m−3, which can cause serious health problems,7,23 ranging from fatigue, headache, and eye irritation to more severe outcomes such as infections, asthma, lung function impairment, lung cancer, and cardiovascular diseases.24,25 In regard to CO2, while being a good indicator of pollutants emitted by humans,26 CO2 has historically been treated as an indicator for ventilation/infiltration rates, which has an impact on IAQ.27,28 Growing evidence shows that exposure to a CO2 concentration of 500–5000 ppm can cause various physiological changes in circulatory and autonomic systems, and numerous unpleasant responses were also reported, including drowsiness, lethargy, stuffiness, and a feeling that the air is stale.29 Impairment of the cognitive performances including decision-making and problem-solving, could begin at 1000 ppm even with short-term exposure.28–31 For university and college students, such symptoms can negatively affect their academic performance.27,31 The concentration and the trend of indoor pollutants are influenced by various factors such as outdoor air, occupancy, occupant behavior patterns, building materials, building practice, ventilation, and air exchange rates.32,33 For these reasons, PM2.5 and CO2 concentrations are expected to vary from building to building, and potentially from unit to unit. Reference-grade instruments cannot offer the coverage required to monitor IAQ in such diverse student residences, while LCS has the potential to fulfill this purpose.
The overall objective of this study was a continuous application of an LCS sensor network to investigate the IAQ of university student residences. The measurement campaign was conducted in five student residence buildings on a Canadian university campus during the winter season for five months. Specifically, the study aimed to address potential sources of indoor pollutants (i.e., occupant's activities, outdoor air, etc.) and the factors influencing indoor pollutant concentration (i.e., occupancy, ventilation system, outdoor temperature, etc.). To our best knowledge, this study will be the first to assess the IAQ of student residences using LCS. These findings will significantly enhance our understanding of the indoor environment of the student residences and help facilitate health-related awareness. Furthermore, this new sensing technology will reduce the monitoring cost and provide the occupants with personalized information on IAQ.
2 Materials and methods
2.1 Sensor configuration
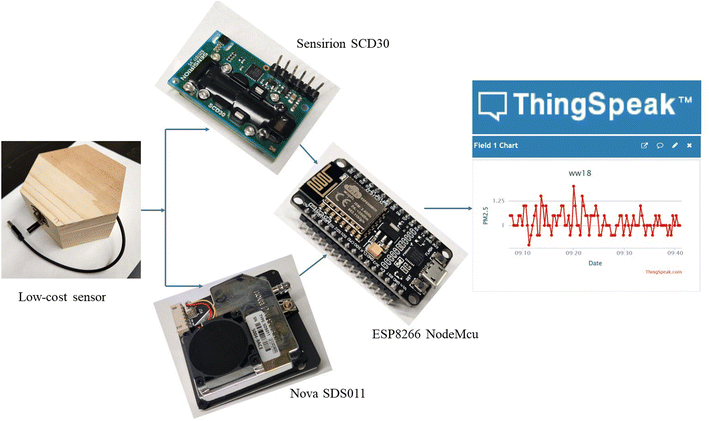
The LCS consists of a PM sensor (Nova SDS011, V1.3), a CO2/temperature/relative humidity (RH) sensor (Sensirion SCD30), and a microcontroller (ESP8266 NodeMcu) (Fig. 1). The details of the choice and the design of the sensor unit will be found in ESI Table S1.† All the components were enclosed inside a small hexagonal wooden box with a length and height of 38.1 × 6.9 cm, making the sensor compact and suitable to fit in a residential environment. According to the manufacturer's information, the SDS011 sensor can measure particles with diameters between 0.3 and 10 μm in the air by using the principle of light scattering.34 A fan is used to draw air into the measurement cavity through an inlet with a flow rate of 20–35 ccm. Light distribution is induced when particles go through the detecting area. The scattered light is transformed into electrical signals, amplified, and processed. The number and diameter of particles can be obtained by analysis because of the signal waveform. Particle counters inside the sensors provide the mass concentration of PM in micrograms per cubic meter (μg m−3), with a measurement range of 0–999.9 μg m−3, and measurement error was a maximum of 15% and ±10 μg m−3 (at 25 °C and 50% RH) with a particle resolution of 0.3 μg m−3. A few previous studies have evaluated the performance of SDS011 sensors against reference instruments under various conditions.35–37Sensirion SCD30 is integrated with CO2, humidity, and temperature measuring capacities on the same sensor module, making it a good fit for compact air quality sensors. The CO2 sensor utilizes nondispersive infrared (NDIR) detection, which is a relatively proven technology for CO2 measurement. The manufacturer claims that the accuracy of the CO2 sensor is ±30 ppm.38 The measurement capacity of Sensirion SCD30 for CO2, Temperature, and RH were 0–40![[thin space (1/6-em)]](https://www.rsc.org/images/entities/char_2009.gif) 000 ppm, −40 °C to 70 °C, and 0–100%, respectively.
000 ppm, −40 °C to 70 °C, and 0–100%, respectively.
The sensor was combined with the Internet of Things (IoT) (Fig. 1) and data management services, which provide real-time data for environmental monitoring.39 In this study, the IAQ data from the sensors were captured for every 30 s. The microcontroller includes the ESP8266 Wi-Fi system-on-chip (SoC) firmware.40 ESP8266 NodeMcu transferred the sensor data to ThingSpeak, an IoT analytics platform service, in real-time. ThingSpeak allows aggregating, visualizing, and analyzing live data streams in the cloud. Real-time data was also made available to each study participant to monitor IAQ in their own residence. Data was then downloaded by the research team and analyzed by Igor Pro 8 (WaveMatrics).
2.2 Sensor quality control
Although the demand for affordable air quality monitoring using LCS has grown exponentially, it is widely known that sensor data quality is highly variable.22 A key consideration for all LCS networks is that the sensors should be well-calibrated, and performance needs to be well-characterized. This process helps to conduct the operation of the sensors efficiently and improves data accuracy. In this study, we conducted careful quality control for sensors before sending them to participants, which included sensor power status, connectivity to Wi-Fi networks, data uploading, and data reliability. In particular, to check the sensor performance, PM sensor calibration was done before (pre-campaign) and after (post-campaign) deployment.For calibrating the SDS011 sensor, all sensors were collocated in an unoccupied office with a research-grade optical particle counter (OPC, GRIMM 11C), which measures particles within a range from 0.25 μm to 32 μm. The room door and window were closed during calibration, and a fan was used to homogenize the air. An ultrasonic humidifier was used to generate the aerosol particles. Particles generated from the ultrasonic humidifier had been studied in detail in one of our previous publications.41 The particles are comprised of common salts and minerals found in drinking water. The size distribution of particles appears unimodal, with a mean diameter of 100 to 200 nm. We chose humidifier particles for calibration because it is a safe and simple way to generate particles with a wide range of concentrations. As will be discussed later, humidifier use has been identified as a major source of particles in student residences. However, we acknowledge that the calibration may not fully represent the entire spectrum of indoor aerosol, as the performance of LCS was found to vary under different conditions (i.e., RH) and emitting sources (i.e., size, density, and refractive index of the PM).42,43 The humidifier was operated in the office until the PM2.5 concentration reached 100 to 150 μg m−3. The ventilation of the office was centrally controlled by the building, with a consistent air exchange rate of 1.8 h−1, as measured in our previous study.44 The natural decay of particles due to ventilation was monitored with both SDS011 sensors and the OPC. As per manufacturer specification, the SDS011 sensor could also measure PM10. However, it has been found that PM10 measurements can be inaccurate compared to the reference instruments, especially if PM distribution shifts towards larger particles.45,46 Herein, we focus only on the PM2.5 data in our study. While PM10, PM1, or ultrafine PM have also been of increasing concern and studied in numerous literature, we did not investigate these in our work.
RH can be a major source of measurement error for PM sensors.41 When the sample particles are hygroscopic in nature, they uptake more water under high RH conditions and can be subsequently treated as larger particles, leading to an overestimation of particle mass concentrations. Furthermore, water uptake can change the refractive index and density of the aerosol, making measurement more complex.15,18,47,48 The manufacturer limits the operating range of the SDS011 sensor in terms of RH to 0−70%. Several studies observed significant positive artifacts in particle number and mass concentrations at RH above 75%.47,49,50 In the current work, we confirmed that the RH was much below 75% and thus excluded any potential impact of RH on the PM2.5 data.
In addition, an inter-comparison of CO2 concentration measurement was done between the sensors to check the consistency and reliability of the SCD30 sensor's data. The experiment was conducted in the same manner in the unoccupied office, with dry ice used as the source of CO2. When all the sensors reported a CO2 concentration of around 3000 ppm, the dry ice tray was removed from the office, and the windows were opened. The natural decay of CO2 concentration was monitored until it reached approximately 580 ppm. The CO2 concentration did not reach the ambient background of approximately 420 ppm (ref. 51) which was assumed due to the recirculation of indoor air from the building. A previous study has found that the SCD30 could underestimate the CO2 concentration measurement under reduced pressure (approximately 85 kPa).1 However, we didn't correct the SCD30 sensor's CO2 data because the atmospheric pressure in Edmonton was 90 to 96 kPa during the study period (December 2021 to April 2022).52 The graph of inter-comparison of SCD30 sensors using dry ice can be found in ESI, Fig. S1.† The inter-comparison study of the RH and temperature measurement were also done during the pre-and post-campaign PM calibration.
2.3 IAQ monitoring with LCS
| Name of the residence | No. of sensor | Study period | Cooking | Ventilation |
|---|---|---|---|---|
| a In addition to the HVAC system in the building, in-suite HRV system is installed in each individual unit. b The building uses perimeter heating, and there are no air ducts in individual units. Air ventilation relies on the window to outdoor and the door to the corridor. | ||||
| Residence A | 8 | December 2021 to March 2022 | Not allowed | HVAC |
| Residence B | 8 | December 2021 to March 2022 | Not allowed | HRV and HVACa |
| Residence C | 8 | December 2021 to March 2022 | Allowed | HVAC |
| Residence D | 5 | December 2021 to March 2022 | Allowed | HVAC |
| Residence E | 7 | March 2022 to April 2022 | Not allowed | NVb |
3 Results and discussion
3.1 LCS sensor performance evaluation
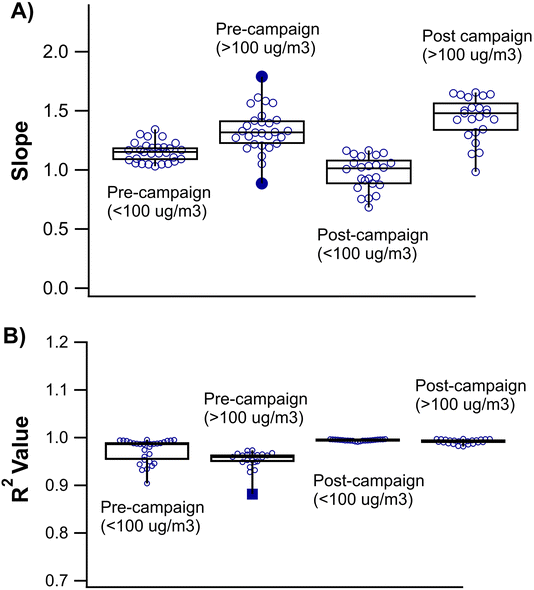
Fig. 2(A) depicts the sensor and OPC-measured PM2.5 data obtained from the pre-campaign calibration. From this graphical figure, it was observed that when PM2.5 < 100 μg m−3, the sensor and OPC measured values agreed with each other, but when PM2.5 > 100 μg m−3, the sensors overestimated PM2.5 values compared to the OPC. A similar disagreement was observed during the post-campaign calibrations (Fig. 2(B)), where a higher PM concentration was used. Calibration at higher PM concentrations also caused an increase in the inter-sensor data variability. Furthermore, Fig. 3(A) and (B) represent the box plot of slope and coefficient of determination (R2) values from the linear regression calibration model for the pre-and post-campaign calibration study. The linear regression model was built for each sensor measurement (y-axis) against the research grade instrument (OPC) (x-axis), with the slope and R2 values obtained from the fitting. The US EPA PM2.5-based testing report recommends slope and R2 as two of the accuracy metrics to evaluate the performance of the sensors, with recommended values of 1.0 ± 0.35 and >0.70, respectively.22,47 In the pre-and post-calibration when PM2.5 was below 100 μg m−3, the slopes were 1.15 ± 0.08 and 0.97 ± 0.14 and were within the US EPA recommended slope range. However, when PM2.5 was above 100 μg m−3, some sensors overestimated the results compared to OPC, thus not meeting the US EPA recommended slope requirements. The slope was found 1.33 ± 0.18 and 1.44 ± 0.18 for pre-and post-campaign calibration, respectively. On the other hand, R2 results for both pre-and post-campaign met the US EPA recommended range. The reason behind the overestimation and higher inter-sensor data variability at PM2.5 beyond 100 μg m−3 is unknown. Previous studies showed that a magnitude of factors could lead to an overestimate of the sensor data, including atmospheric conditions (i.e., RH and temperature), source of aerosol for calibration, the density, morphology, refractive index of the aerosol, and pattern of aerosol size distribution.15,48,49 However, we studied the effect of RH and temperature as described below and assumed that the PM measurement was not affected by these properties. Numerous studies considered different methods for correcting these biases when they faced variable aerosol composition and size.43,48,53 In our study when the sensor data was >100 μg m−3, we applied a sensor-specific correction factor determined from our calibration. Given that the agreement between sensors and OPC was reasonable <100 μg m−3, no correction factor was applied when the data was <100 μg m−3. An example of how the correction factor helps to make the LCS PM data in agreement with OPC PM data when the PM concentration was >100 μg m−3 can be found in the ESI, Fig. S2.† We also operated the SDS011 sensors in the office without the humidifier for 24 hours to measure the limit of detection (LOD) for PM2.5, which was found to be 0.6 μg m−3. The method used to calculate the LOD was adapted from previous literature.54,55 LOD was the lowest concentration above which hourly averaged concentrations exceed their standard deviations by a factor of 3 more than 95% of the time.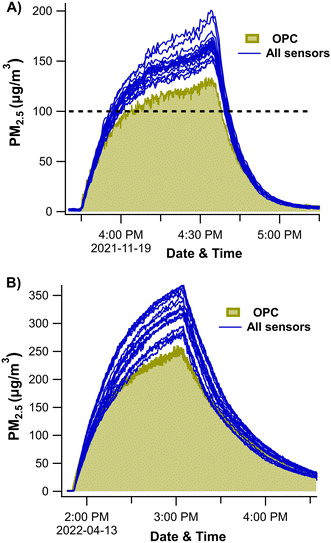 | ||
| Fig. 2 SDS011 sensors and OPC measured PM2.5 concentration for pre-campaign (A) and post-campaign calibration (B). | ||
For the CO2, RH, and temperature data (SCD30 sensor), we did not perform an inter-comparison with reference instruments. Instead, all sensors were collocated in the unoccupied office to check the sensor data precision and reliability.19,35,56,57 Precision of the collocated sample was measured with a coefficient of variations (CV%) for hourly averaged data.19,22,47 (Table 2). Lower CV values indicate more precise measurements of the sensors, with the US EPA recommending a targeted CV of ≤30%.22 The calculated CV values for RH and temperature data for post and pre-campaign were relatively low. Besides that, CV (%) of CO2 concentrations of the collocated sensors (post-campaign only) was found at 7.53%, which is within the US EPA recommendation.
| Parameters | Pre-campaign, CV (%) | Post-campaign, CV (%) |
|---|---|---|
| Temperature | 2.32 | 3.25 |
| RH | 5.38 | 9.98 |
| CO2 | 5.38 | 9.98 |
However, we found that the hourly average temperature in the studied residences was recorded at 26.5 ± 2 °C, which is 2–3 °C higher than the actual temperature and is assumed to be influenced by self-heating and internal conditions within the sensor unit.47 In addition, the hourly averaged RH in the studied residence's room was 10–17%. As will be discussed later in this work, the lower RH resulted from cold outdoor temperatures. However, it is also likely that the internal temperature in sensor units has biased the measured RH low. An overestimation of 2–3 °C temperature could result in a 2–3% underestimation of the RH reading of our sensor.
3.2 Sensor data quality
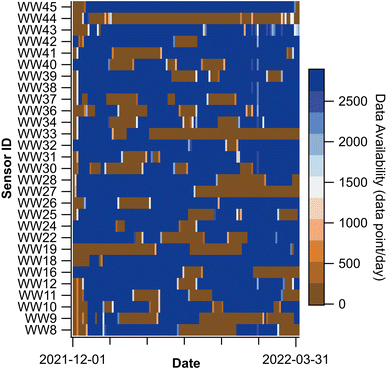
Fig. 4 shows the data availability for 29 sensors (from residences A to D) in the studied period. The color scale represents the number of data points uploaded by each sensor. Although the connectivity of all sensors was verified during calibrations, obtaining complete time series in actual residences was highly challenging since the sensors went offline occasionally. The main reason for data incompleteness was the instability or loss of the residence's Wi-Fi, resulting in the sensor's data collection being interrupted randomly. The data unavailability related to the wireless connection of the sensor was also reported previously in some studies.17,47,57 A reboot of the sensor would usually solve the problem, but we did not have access to the actual residences and had to contact the participants to reboot the sensors, which sometimes took a long time. The data availability of 7 sensors from residence E was >99%. They are excluded from Fig. 4 because sensors were deployed at a different time (Table 1).The other factors that influenced the missing data were (1) Winter break (from the end of December 2021 to the first week of January 2022) and (2) the University's switching to online classes due to COVID-19 (from January 2022 to February 2022). ESI Fig. S3† shows the number and percentage of sensors online at each given time, where a sensor is considered online if the data was recorded for at least 10 hours daily. Many students left their residences during these periods, and Wi-Fi issues forced some sensors offline. As these students were not in place, it was impossible to reboot the sensors for that period. Beyond these two periods, 70–90% of sensors were online for the duration of the investigation (ESI, Fig. S3†).
Besides data availability, a few limitations of our study should be noted here. We had no control over the activities of the participants and had to rely on the questionnaire's feedback to find possible sources. Additionally, we could not track the exact location of sensors in each residence. Although we provided basic instructions upon sensor deployment, it was up to the participants to choose the location of the sensor. Relatedly, we had to assume that the sensor data was representative of IAQ in that specific residence; i.e., the air was well-mixed inside the room. This assumption may not be true if the sensor was located too close to a source or a sink, and if the air mixing is insufficient. Overall, the LCS network was able to collect sufficient and reliable data during the measurement period. However, we could not avoid a certain degree of data loss and uncertainties related to factors beyond our control.
3.3 Factors affecting indoor pollutants
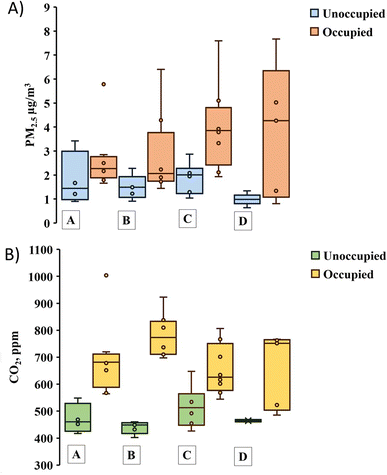
This study explored indoor activities and outdoor parameters that had a profound impact on IAQ, including occupancy and occupant activities, ventilation system (air exchange rate), and outdoor air quality.In addition, CO2 concentrations were found to be 472 and 493 ppm, and 695 and 781 ppm in unoccupied and occupied conditions in residences A and B, respectively. Meanwhile, those in residences C and D were found 515 and 464 ppm (unoccupied) and 655 and 658 ppm (occupied), respectively. The CO2 concentration differences between occupied and unoccupied rooms are mainly because of the exhalation of the occupants. A statistical test (t-test) was also performed to compare the PM2.5 and CO2 concentrations for occupied and unoccupied conditions. Except for the PM2.5 concentrations in residence A, the statistical results of the P value from the t-test founds less than 0.05 which indicates a statistically significant (at 95% confidence level) difference of PM2.5 and CO2 concentrations between occupied and unoccupied conditions in residences A–D (Table S4†). As such, it was believed that the occupants' activities, including their mere presence within the room, are the main driving factor behind the higher PM2.5 and CO2 levels in the occupied space. Moreover, the lower differences and low level of PM2.5 in these two conditions indicate the good ventilation behavior of these four buildings, which is explained further below.
National Ambient Air Standards by US EPA recommended a short-term exposure (24 hour or daily average) limit of PM2.5 at 35 μg m−3, and the long-term exposure limit (annual average) is 12 μg m−3.58 Health Canada does not suggest a specific maximum exposure limit but recommends the indoor PM2.5 to be kept at the minimum and lower than PM2.5 outdoors.59 On the other hand, the maximum daily exposure limit of CO2 recommended by Health Canada for residential occupants is 1000 ppm to protect against health impacts.27,60 In this study, PM2.5 and CO2 concentrations are generally found lower than the 24 h exposure standard, there can be specific sources causing high concentrations which are discussed later.
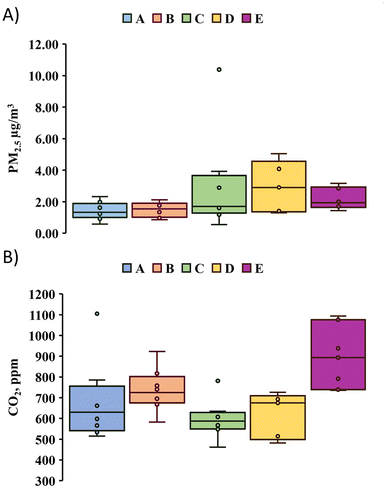 | ||
| Fig. 6 Effect of MV (residence A–D) and NV (residence E) on indoor PM2.5 (A) and CO2 (B) concentration. | ||
On the other hand, CO2 concentration (895 ppm) in residence E was higher than other residences (679, 738, 595, and 618 ppm in residence A, B, C, and D, respectively). Furthermore, the P values for the indoor CO2 concentration of residences A–D compared with residence E were found <0.05 (Table S5†). Overall, the statistical results of the P value indicate the effects of ventilation systems (MV vs. NV) on differences in indoor PM2.5 and CO2 concentration. It was hypothesized that NV led to a slower air exchange rate and caused a higher indoor CO2 concentration in residence E. The decay rate of PM2.5 concentration (generated from the humidifier) in residences B, C, and D was obtained to test this hypothesis. Five humidifier use events were collected from each of these three residences, with the average first order coefficient (K) calculated and presented in Fig. 7. We indeed found a smaller K value in residence E compared to those in B and C, which have a MV system. In residences B and C, The average K values for the five humidifiers using events were found to be 0.86 ± 0.16 h−1 and 0.88 ± 0.19 h−1, respectively. However, K was found to be almost half of those values (0.44 ± 0.06 h−1) in residence E. The P value for K was found 0.002 for both B and C residences with respect to residence E, which statistically proved the slower air exchange and ventilation rate in residence E. These results indicate that the reliance on NV in this residence can lead to the accumulation of indoor pollutants.
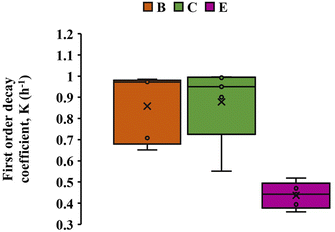 | ||
| Fig. 7 First order decay coefficient (K) of PM2.5 generated from five events of humidifier use in residence B, C, and E. Note that B and C employ MV, while E employs NV. | ||
HVAC/HRV systems offer consistent ventilation and contribute to thermal comfort in the indoor environment.61 The capability of MV to maintain better indoor air quality over NV was studied in several studies. Park et al., mentioned that MV reduced the indoor to outdoor (I/O) ratios of PM concentration by 26% for submicron particles and 65% for fine particles compared with NV.62 Results of this study confirm that MV with filtration can significantly reduce indoor particle levels and maintain good IAQ.
3.3.3.1 Humidifier. As the investigation was carried out during the winter seasons, indoor RH reached as low as 7 ± 3% during the cold weather. We note that this value is likely biased low due to the self-heating of the sensor, as discussed previously. From the questionnaires, we found that participants used a humidifier during the winter to alleviate low humidity-induced discomfort (such as skin drying, irritation of mucous membranes, dry eyes, and static electricity). Different studies showed that the portable humidifier could serve as an indoor PM2.5 emitter.41,65 Our study investigated the sensor data of those who used an ultrasonic humidifier. The time profiles of PM2.5 and RH data recorded from one example sensor over a period of ten days are shown in Fig. 8. The pink shaded area indicates the projected period of humidifier use, as indicated by a sharp increase in both RH and PM2.5. The RH value was down to a minimum of 4% when the occupant was prompted to use a humidifier, which managed to increase the room humidity to approximately 20%. During humidifier usage, the mass concentration of indoor PM2.5 reached 100 to 180 μg m−3, which aligns with findings from existing literature.41 As discussed earlier, a sensor-specific correction factor was applied to the data when PM2.5 concentration reached >100 μg m−3 to avoid a bias observed during calibration. The 24 hour averaged PM2.5 concentrations during these 10 days of humidifier operation were between 15.0 to 49.6 μg m−3, which indicates that humidifier can result in indoor PM2.5 concentrations exceeding the US EPA's acute daily average ambient air quality standard limit of 35 μg m−3.58 The end of humidifier use was followed by a gradual decay of both the PM2.5 concentrations and RH, likely through deposition, air circulation, and ventilation, with PM2.5 eventually reaching its background level (<2.0 μg m−3).
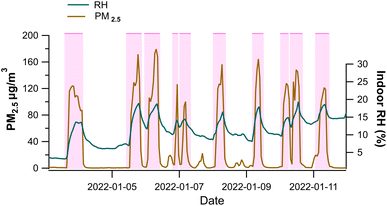 | ||
| Fig. 8 Effect of humidifier on indoor PM2.5 emission. Data from one sensor is shown here as a case study. | ||
According to personal communication with the participant, tap water was used in the humidifier. Lau et al.41 and Guo et al.65 found that suspended and dissolved materials and compounds contained in the charging water of the humidifier could be released as PM2.5. They also found that when using tap water, an ultrasonic humidifier released 22 times more PM2.5 than an evaporative humidifier. Ultrasonic humidifiers produce water droplets as a cool fog and leave dissolved minerals in the mist as ultrafine particles, mostly <1 μm. Elements and ions, including Ca2+, Na+, Mg2+, K+, Cl−, Si4+, Al3+, Fe2+, OH−, CO32−, HCO3−etc.66 and microbial particles could be present in the tap water used for humidification.67–69 There is no WHO or government health-based regulatory guidance or standards limit of the mineral content of tap water because they are unlikely to have adverse health effects when ingested; however, they can potentially cause issues when inhaled into the lungs as aerosol particles or white dust.67,70,71 The US EPA conceptual model (US EPA, 2016) considered the inhalation of treated tap water as an important route of human exposure to contaminants. Student residents should be encouraged to use water with low levels of mineral and other dissolved components to limit inhalation exposure to potentially harmful components. Alternatively, an evaporative humidifier can be used because it does not generate as much PM as an ultrasonic humidifier.41
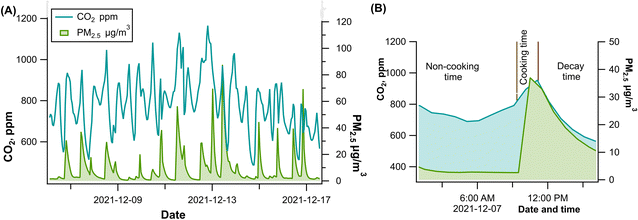
3.3.3.2 Cooking. Several studies reported that cooking is one of the largest indoor PM emission sources.72,73 Cooking emission primarily contributes to the fine particles (PM2.5) and ultrafine particles.74–76 A Health Canada study showed that indoor particle concentration increased 65 times during cooking compared to background levels.74 As such, cooking activity can adversely affect IAQ and occupant health. In this paper, we showcase PM2.5 emission from cooking by presenting data from a participant who cooked regularly. Fig. 9(A) illustrates the PM2.5 time profile from the sensor during a 12 day period. Fig. 9(B), which shows a one-day period, highlights the differences between non-cooking time (12.0 am to 9.30 am) and cooking time (9.30 am to 11.30 am) PM2.5 levels. Results show that the PM sensor detected the start and end of the emissions of PM2.5 from cooking. In the non-cooking period, the room PM2.5 concentration was between 1.0–4.0 μg m−3. Cooking gave rise to hourly averaged concentrations between 28.7 and 87.6 μg m−3, and the maximum daily average was calculated to be 22.1 μg m−3.
We also observed a higher CO2 concentration during the cooking period than the non-cooking time (sleeping time), resulting from the occupant's rapid movement inside the room. According to a study, the body uses more oxygen during fast action and muscles work.77 and produces more CO2. The CO2 level increased to an hourly average concentration of around 1000 ± 150 ppm when the PM2.5 was also at the peak point.
It is important to note that for some participants who cooked, we did not observe a significant increase in PM2.5 during the cooking time and didn't find any significant difference between the non-cooking and cooking hours. It is evident from existing literature that the extent of PM2.5 emission is associated with cooking temperature, methods, type of stove and appliances, types of food, fat, and oil.77–79 Among the different types of cooking methods, frying, deep-frying, roasting, broiling, sauteing, toasting, baking, or burning of food generates these airborne particles.75 Different cooking styles and food may explain the difference in PM2.5 concentrations observed among participants who cooked. With the assistance of real-time IAQ monitoring, the occupants could take necessary mitigation measures such as using the stove venting hood properly, using NV, MV, portable air cleaner, and even adjusting the cooking methods to reduce the indoor PM2.5 level as well as other cooking generated pollutants.72,80,81
Overall, The discussions from this section show that indoor sources, such as humidifiers and cooking, could contribute to an episodic but drastic increase in indoor PM2.5 concentrations. Their impact on the overall average PM2.5 concentration is present but moderate; however, the short-term impact cannot be neglected.
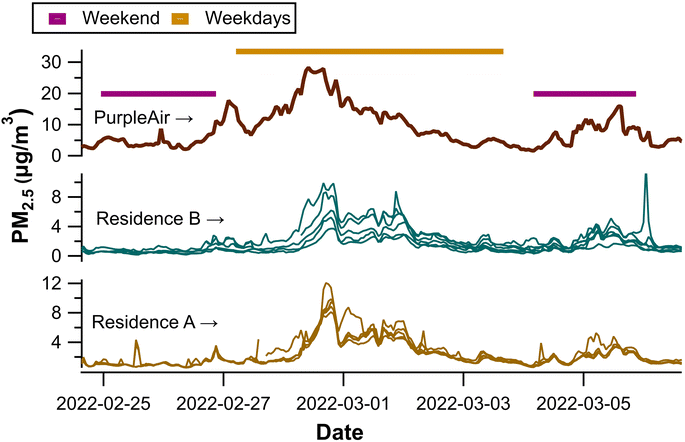 | ||
| Fig. 10 Hourly variations of indoor PM2.5 level with outdoor PM2.5 level, during weekdays and weekends. The outdoor PurpleAir data was treated with corrections recommended by the US EPA.82 | ||
Residences A and B had HRV and HVAC ventilation systems. During the investigation period, the windows were kept open about 4–13% of the day; thus, the effect of NV was considered a negligible contribution to indoor PM2.5. However, based on the weekday's PM2.5 concentration trend, the indoor PM2.5 concentration level was found low compared to the outdoor PM2.5 concentration which indicates the efficient filtration efficiency of both ventilation systems in these two residences.
Overall, we found that outdoor air pollutants can be the major influence on indoor IAQ when there are no significant indoor sources present (e.g., cooking and humidifier use). Building ventilation and filtration systems play a critical role in eliminating air pollutants of outdoor origin. In this study, the MV systems in the two studied buildings were successful in keeping PM2.5 concentration below the recommended daily acute exposure limit.
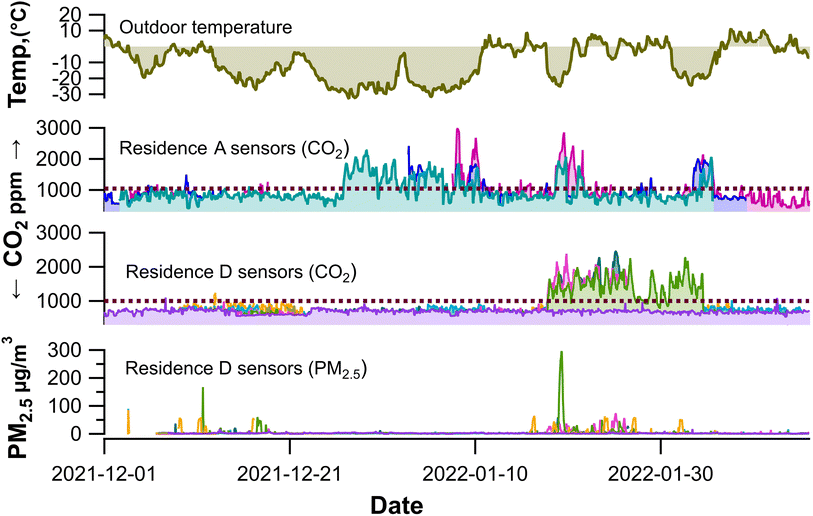
The daily average PM2.5 concentrations during this observation period were not elevated as those of CO2. For residence A, the averaged PM2.5 (23 December to 4 February) was found at 1.8 μg m−3. However, from 17 January to 4 February the indoor PM2.5 concentration in residence D was increased, and average concentrations were recorded at 8.6 μg m−3. It was considered that in residence D, cooking raised the PM2.5 concentration along with insufficient ventilation. The higher PM2.5 in residence D provides an additional indication that indoor air pollutants were trapped inside during this cold period. Besides PM2.5, there are other pollutants indoors, as introduced earlier.6 These pollutants could also accumulate due to insufficient air ventilation rate. Our study shows that extremely cold weather may pose a concern for IAQ in student residences due to less NV (closed windows) and challenges associated with MV systems in cold temperatures. Such challenges may have been common for campuses located in the cold climate zone; however, they may have remained unrecognized due to the lack of affordable IAQ monitoring methods.
4 Conclusions
A major fraction of college and university students spend most of their time in school-managed student residences, and thus exposure to indoor air pollutants must be continuously monitored and managed. In this study, we applied an LCS network to monitor IAQ parameters in university student residences. A total of 36 sensors were deployed in five student residences with a variety of conditions. The sensors were operated in the actual living spaces of study participants for up to five months. This study represents the first application of an LCS network in university residences. Long-term monitoring of IAQ in the actual living spaces of students, conducted simultaneously by multiple sensors, was achieved for the first time. Overall, this study suggests that LCS can offer continuous, spatiotemporally-resolved IAQ data for a fraction of the cost of typical research-grade instruments. However, these inexpensive sensors have limitations and need to be characterized under realistic conditions. As demonstrated in this work, collocation and calibration with a research-grade instrument were able to ensure reasonable data quality.A number of discoveries were made in this study. The data indicated that cooking and humidifier use were the two dominant sources of indoor PM2.5, the concentration of which surpassed the recommended daily exposure limit during such events. Besides that, the study found strong correlations between outdoor and indoor PM2.5. Although the outdoor air was not as significant as a source compared to cooking and humidifier use, events of elevated outdoor pollutants (e.g., wildfire smoke in the summer) can potentially govern IAQ parameters. The building ventilation behavior and outdoor temperature were also found to affect the indoor CO2 and PM2.5 concentrations. In particular, it was observed that the ventilation systems in certain residences faced challenges when the outdoor temperature was approaching −20 °C and lower. Such situations may be common for residences located in cold climate and would not have been noticed without the deployment of LCS. As such, the results of this study underscore the need for basic measures of indoor air pollution control paired with ongoing air monitoring within the residence facility and the importance of future air monitoring studies aimed within these facilities. The LCS network has the potential to fulfill this purpose. It is expected to benefit the students for mitigating the risks of high pollutant exposure and the building management for optimizing the building ventilation and energy consumption.
Conflicts of interest
There are no conflicts to declare.Acknowledgements
This work was supported (in-part) by the University of Alberta Campus Sustainability Grant Program. R. Z. acknowledge funding provided by NSERC Discovery Grant (RGPIN2018-03814). R. A. also thanks Walter and Phyllis Harris Graduate Scholarship in Chemistry for financial support. R. D.-K. thanks Canada Summer Job and Whittock donation for financial support. A. D. Thanks I-STEAM Pathway at the University of Alberta for financial support. The authors are also indebted to the University student residence services for helping in the participant recruitment, IT support, and the building selection process. This work was approved by the University of Alberta Human Research Ethics (Pro00112541).References
- J. Tryner, M. Phillips, C. Quinn, G. Neymark, A. Wilson, S. H. Jathar, E. Carter and J. Volckens, Design and testing of a low-cost sensor and sampling platform for indoor air quality, Build. Environ., 2021, 206, 108398 CrossRef PubMed.
- World Health Organization, Household air pollution and health, https://www.who.int/news-room/fact-sheets/detail/household-air-pollution-and-health, accessed October 24, 2022 Search PubMed.
- P. J. Landrigan, R. Fuller, N. J. Acosta, O. Adeyi, R. Arnold, A. B. Baldé, R. Bertollini, S. Bose-O’Reilly, J. I. Boufford and P. N. Breysse, et al., The Lancet Commission on pollution and health, The Lancet, 2018, 391, 462–512 CrossRef PubMed.
- US EPA, Indoor Air Quality, November 2, 2017, https://www.epa.gov/report-environment/indoor-air-quality, accessed October 9, 2022 Search PubMed.
- J. Saini, M. Dutta and G. Marques, Sensors for indoor air quality monitoring and assessment through internet of things: a systematic review, Environ. Monit. Assess., 2021, 193, 1–32 CrossRef PubMed.
- P. Spiru and P. L. Simona, A review on interactions between energy performance of the buildings, outdoor air pollution and the indoor air quality, Energy Procedia, 2017, 128, 179–186 CrossRef CAS.
- Z. Yang, J. Shen and Z. Gao, Ventilation and air quality in student dormitories in China: a case study during summer in Nanjing, Int. J. Environ. Res. Public Health, 2018, 15, 1328 CrossRef PubMed.
- Student housing market report canada final, https://assets.alignvest.com/f/86523/x/cf825b678e/student-housing-market-report-canada_final.pdf, accessed August 27, 2022 Search PubMed.
- H. Li, X. Li and M. Qi, Field testing of natural ventilation in college student dormitories (Beijing, China), Build. Environ., 2014, 78, 36–43 CrossRef.
- D. Liang, J. L. Moutinho, R. Golan, T. Yu, C. N. Ladva, M. Niedzwiecki, D. I. Walker, S. E. Sarnat, H. H. Chang and R. Greenwald, et al., Use of high-resolution metabolomics for the identification of metabolic signals associated with traffic-related air pollution, Environ. Int., 2018, 120, 145–154 CrossRef CAS PubMed.
- M. Gao, J. Cao and E. Seto, A distributed network of low-cost continuous reading sensors to measure spatiotemporal variations of PM2.5 in Xi’an, China, Environ. Pollut., 2015, 199, 56–65 CrossRef CAS PubMed.
- J. S. Apte, K. P. Messier, S. Gani, M. Brauer, T. W. Kirchstetter, M. M. Lunden, J. D. Marshall, C. J. Portier, R. C. Vermeulen and S. P. Hamburg, High-resolution air pollution mapping with Google street view cars: exploiting big data, Environ. Sci. Technol., 2017, 51, 6999–7008 CrossRef CAS PubMed.
- P. V. Caquilpán, G. G. Aros, A. S. Elgueta, S. R. Díaz, K. G. Sepúlveda and J. C. Sierralta, et al., Advantages and challenges of the implementation of a low-cost particulate matter monitoring system as a decision-making tool, Environ. Monit. Assess., 2019, 191, 1–20 CrossRef PubMed.
- E. G. Snyder, T. H. Watkins, P. A. Solomon, E. D. Thoma, R. W. Williams, G. S. Hagler, D. Shelow, D. A. Hindin, V. J. Kilaru and P. W. Preuss, The changing paradigm of air pollution monitoring, Environ. Sci. Technol., 2013, 47, 11369–11377 CrossRef CAS PubMed.
- D. H. Hagan and J. H. Kroll, Assessing the accuracy of low-cost optical particle sensors using a physics-based approach, Atmos. Meas. Tech., 2020, 13, 6343–6355 CrossRef CAS PubMed.
- A. P. Kaduwela, A. P. Kaduwela, E. Jrade, M. Brusseau, S. Morris, J. Morris and V. Risk, Development of a low-cost air sensor package and indoor air quality monitoring in a California middle school: Detection of a distant wildfire, J. Air Waste Manage. Assoc., 2019, 69, 1015–1022 CrossRef PubMed.
- R. E. Connolly, Q. Yu, Z. Wang, Y.-H. Chen, J. Z. Liu, A. Collier-Oxandale, V. Papapostolou, A. Polidori and Y. Zhu, Long-term evaluation of a low-cost air sensor network for monitoring indoor and outdoor air quality at the community scale, Sci. Total Environ., 2022, 807, 150797 CrossRef CAS PubMed.
- J. Tryner, C. L'Orange, J. Mehaffy, D. Miller-Lionberg, J. C. Hofstetter, A. Wilson and J. Volckens, Laboratory evaluation of low-cost PurpleAir PM monitors and in-field correction using co-located portable filter samplers, Atmos. Environ., 2020, 220, 117067 CrossRef CAS.
- J. Tryner, J. Mehaffy, D. Miller-Lionberg and J. Volckens, Effects of aerosol type and simulated aging on performance of low-cost PM sensors, J. Aerosol Sci., 2020, 150, 105654 CrossRef CAS.
- J. R. Ouimette, W. C. Malm, B. A. Schichtel, P. J. Sheridan, E. Andrews, J. A. Ogren and W. P. Arnott, Evaluating the PurpleAir monitor as an aerosol light scattering instrument, Atmos. Meas. Tech., 2022, 15, 655–676 CrossRef.
- World Health Organization, Regional Office for Europe. The WHO European Health Equity Status Report Initiative: Case Studies, World Health Organization, Regional Office fr Europe, Copenhagen, 2019, https://apps.who.int/iris/handle/10665/346050, accessed July 20, 2022 Search PubMed.
- Performance Testing Protocols, Metrics, and Target Values for Fine Particulate Matter Air Sensors: Use in Ambient, Outdoor, Fixed Site, Non-regulatory Supplemental and Informational Monitoring Applications, https://cfpub.epa.gov/si/si_public_record_Report.cfm?dirEntryId=350785%26Lab=CEMM, accessed July 27, 2022 Search PubMed.
- H. Li, J. Cai, R. Chen, Z. Zhao, Z. Ying, L. Wang, J. Chen, K. Hao, P. L. Kinney and H. Chen, et al., Particulate matter exposure and stress hormone levels: a randomized, double-blind, crossover trial of air purification, Circulation, 2017, 136, 618–627 CrossRef CAS PubMed.
- H. M. Strosnider, H. H. Chang, L. A. Darrow, Y. Liu, A. Vaidyanathan and M. J. Strickland, Age-specific associations of ozone and fine particulate matter with respiratory emergency department visits in the United States, Am. J. Respir. Crit. Care Med., 2019, 199, 882–890 CrossRef CAS PubMed.
- R. Pérez-Padilla, A. Schilmann and H. Riojas-Rodriguez, Respiratory health effects of indoor air pollution, The International Journal of Tuberculosis and Lung Disease, 2010, 14, 1079–1086 Search PubMed.
- O. Seppänen, W. Fisk and M. J. Mendell, Association of ventilation rates and CO2 concentrations with health and other responses in commercial and institutional buildings, Indoor Air, 1999, 9, 226–252 CrossRef PubMed.
- B. Du, M. C. Tandoc, M. L. Mack and J. A. Siegel, Indoor CO2 concentrations and cognitive function: a critical review, Indoor Air, 2020, 30, 1067–1082 CrossRef CAS PubMed.
- U. Satish, M. J. Mendell, K. Shekhar, T. Hotchi, D. Sullivan, S. Streufert and W. J. Fisk, Is CO2 an indoor pollutant? Direct effects of low-to-moderate CO2 concentrations on human decision-making performance, Environ. Health Perspect., 2012, 120, 1671–1677 CrossRef CAS PubMed.
- K. Azuma, N. Kagi, U. Yanagi and H. Osawa, Effects of low-level inhalation exposure to carbon dioxide in indoor environments: A short review on human health and psychomotor performance, Environ. Int., 2018, 121, 51–56 CrossRef CAS PubMed.
- J. G. Allen, P. MacNaughton, U. Satish, S. Santanam, J. Vallarino and J. D. Spengler, Associations of cognitive function scores with carbon dioxide, ventilation, and volatile organic compound exposures in office workers: a controlled exposure study of green and conventional office environments, Environ. Health Perspect., 2016, 124, 805–812 CrossRef CAS PubMed.
- D. Norbäck, K. Nordström and Z. Zhao, Carbon dioxide (CO2) demand-controlled ventilation in university computer classrooms and possible effects on headache, fatigue and perceived indoor environment: an intervention study, Int. Arch. Occup. Environ. Health, 2013, 86, 199–209 CrossRef PubMed.
- W. W. Nazaroff, Indoor bioaerosol dynamics, Indoor Air, 2016, 26, 61–78 CrossRef CAS PubMed.
- X. Zhang, B. Chen and X. Fan, Different fuel types and heating approaches impact on the indoor air quality of rural houses in Northern China, Procedia Eng., 2015, 121, 493–500 CrossRef CAS.
- Nova SDS011 Laser PM2.5 Sensor specification, https://www-sd-nf.oss-cn-beijing.aliyuncs.com/, accessed July 19, 2022 Search PubMed.
- H.-Y. Liu, P. Schneider, R. Haugen and M. Vogt, Performance assessment of a low-cost PM2.5 sensor for a near four-month period in Oslo, Norway, Atmosphere, 2019, 10, 41 CrossRef CAS.
- R. Jayaratne, X. Liu, K. H. Ahn, A. Asumadu-Sakyi, G. Fisher, J. Gao, A. Mabon, M. Mazaheri, B. Mullins and M. Nyaku, et al., Low-cost PM2.5 sensors: An assessment of their suitability for various applications, Aerosol Air Qual. Res., 2020, 20, 520–532 Search PubMed.
- A. Wardoyo, H. Dharmawan, M. Nurhuda and E. Adi, Optimization of PM2.5 Measurement System Using NOVA SDS011 Sensor, J. Phys.: Conf. Ser., 2020, 012053 CrossRef.
- Sensirion SCD30 CO2 sensor, https://sensirion.com/media/documents/4EAF6AF8/61652C3C/Sensirion_CO2_Sensors_SCD30_Datasheet.pdf, accessed July 19, 2022 Search PubMed.
- A. M. Rahmani, T. N. Gia, B. Negash, A. Anzanpour, I. Azimi, M. Jiang and P. Liljeberg, Exploiting smart e-Health gateways at the edge of healthcare Internet-of-Things: A fog computing approach, Future Generation Computer Systems, 2018, 78, 641–658 CrossRef.
- NodeMCU ESP8266 Specifications, Overview and Setting Up, https://www.make-it.ca/nodemcu-details-specifications/, accessed September 27, 2022 Search PubMed.
- C. J. Lau, M. Loebel Roson, K. M. Klimchuk, T. Gautam, B. Zhao and R. Zhao, Particulate matter emitted from ultrasonic humidifiers—Chemical composition and implication to indoor air, Indoor Air, 2021, 31, 769–782 CrossRef CAS PubMed.
- T. Sayahi, A. Butterfield and K. Kelly, Long-term field evaluation of the Plantower PMS low-cost particulate matter sensors, Environ. Pollut., 2019, 245, 932–940 CrossRef CAS PubMed.
- T. Zheng, M. H. Bergin, K. K. Johnson, S. N. Tripathi, S. Shirodkar, M. S. Landis, R. Sutaria and D. E. Carlson, Field evaluation of low-cost particulate matter sensors in high-and low-concentration environments, Atmos. Meas. Tech., 2018, 11, 4823–4846 CrossRef CAS.
- X. Guo, T. Ehindero, C. Lau and R. Zhao, Impact of glycol-based solvents on indoor air quality—Artificial fog and exposure pathways of formaldehyde and various carbonyls, Indoor Air, 2022, 32, e13100 CAS.
- J. Kuula, T. Mäkelä, M. Aurela, K. Teinilä, S. Varjonen, Ó. González and H. Timonen, Laboratory evaluation of particle-size selectivity of optical low-cost particulate matter sensors, Atmos. Meas. Tech., 2020, 13, 2413–2423 CrossRef CAS.
- M. Budde, A. D. Schwarz, T. Müller, B. Laquai, N. Streibl, G. Schindler, M. Köpke, T. Riedel, A. Dittler and M. Beigl, et al., Potential and limitations of the low-cost SDS011 particle sensor for monitoring urban air quality, ProScience, 2018, 5, 6–12 Search PubMed.
- N. Zimmerman, Tutorial: Guidelines for implementing low-cost sensor networks for aerosol monitoring, J. Aerosol Sci., 2022, 159, 105872 CrossRef CAS.
- C. Malings, R. Tanzer, A. Hauryliuk, P. K. Saha, A. L. Robinson, A. A. Presto and R. Subramanian, Fine particle mass monitoring with low-cost sensors: Corrections and long-term performance evaluation, Aerosol Sci. Technol., 2020, 54, 160–174 CrossRef CAS.
- R. Jayaratne, X. Liu, P. Thai, M. Dunbabin and L. Morawska, The influence of humidity on the performance of a low-cost air particle mass sensor and the effect of atmospheric fog, Atmos. Meas. Tech., 2018, 11, 4883–4890 CrossRef CAS.
- M. Tagle, F. Rojas, F. Reyes, Y. Vásquez, F. Hallgren, J. Lindén, D. Kolev, Å. K. Watne and P. Oyola, Field performance of a low-cost sensor in the monitoring of particulate matter in Santiago, Chile, Environ. Monit. Assess., 2020, 192, 1–18 CrossRef PubMed.
- I. Stassen, J.-H. Dou, C. Hendon and M. Dinca, Chemiresistive sensing of ambient CO2 by an autogenously hydrated Cu3 (hexaiminobenzene)2 framework, ACS Cent. Sci., 2019, 5, 1425–1431 CrossRef CAS PubMed.
- Station pressure-Hourly data for Edmonton, https://edmonton.weatherstats.ca/charts/pressure_station-hourly.html, January 03, 2023 Search PubMed.
- M. R. Giordano, C. Malings, S. N. Pandis, A. A. Presto, V. McNeill, D. M. Westervelt, M. Beekmann and R. Subramanian, From low-cost sensors to high-quality data: A summary of challenges and best practices for effectively calibrating low-cost particulate matter mass sensors, J. Aerosol Sci., 2021, 158, 105833 CrossRef CAS.
- L. Wallace, W. Ott, T. Zhao, K.-C. Cheng and L. Hildemann, Secondhand exposure from vaping marijuana: Concentrations, emissions, and exposures determined using both research-grade and low-cost monitors, Atmos. Environ.: X, 2020, 8, 100093 CAS.
- L. Wallace, J. Bi, W. R. Ott, J. Sarnat and Y. Liu, Calibration of low-cost PurpleAir outdoor monitors using an improved method of calculating PM2. 5, Atmos. Environ., 2021, 256, 118432 CrossRef CAS.
- X. Liu, R. Jayaratne, P. Thai, T. Kuhn, I. Zing, B. Christensen, R. Lamont, M. Dunbabin, S. Zhu and J. Gao, et al., Low-cost sensors as an alternative for long-term air quality monitoring, Environ. Res., 2020, 185, 109438 CrossRef CAS PubMed.
- G. N. Carvlin, H. Lugo, L. Olmedo, E. Bejarano, A. Wilkie, D. Meltzer, M. Wong, G. King, A. Northcross and M. Jerrett, et al., Development and field validation of a community-engaged particulate matter air quality monitoring network in Imperial, California, USA, J. Air Waste Manage. Assoc., 2017, 67, 1342–1352 CrossRef CAS PubMed.
- USEPA Quality Assurance Guideline, https://www3.epa.gov/ttnamti1/files/ambient/pm25/qa/m212.pdf, accessed August 22, 2022 Search PubMed.
- H. Canada, Guidance for fine particulate matter (PM2.5) in residential indoor air. August 7, 2012, https://www.canada.ca/en/health-canada/services/publications/healthy-living/guidance-fine-particulate-matter-pm2-5-residential-indoor-air.html, accessed September 16, 2022.
- H. Canada, Consultation: Proposed Residential Indoor Air Quality Guidelines for Carbon Dioxide, October 29, 2020, https://www.canada.ca/en/health-canada/programs/consultation-residential-indoor-air-quality-guidelines-carbon-dioxide/document.html, accessed August 15, 2022.
- D. Lai, Y. Qi, J. Liu, X. Dai, L. Zhao and S. Wei, Ventilation behavior in residential buildings with mechanical ventilation systems across different climate zones in China, Build. Environ., 2018, 143, 679–690 CrossRef.
- J. Park, N.-Y. Jee and J.-W. Jeong, Effects of types of ventilation system on indoor particle concentrations in residential buildings, Indoor Air, 2014, 24, 629–638 CrossRef CAS PubMed.
- L. Tofful, S. Canepari, T. Sargolini and C. Perrino, Indoor air quality in a domestic environment: Combined contribution of indoor and outdoor PM sources, Build. Environ., 2021, 202, 108050 CrossRef.
- B. C. Singer and W. W. Delp, Response of consumer and research grade indoor air quality monitors to residential sources of fine particles, Indoor Air, 2018, 28, 624–639 CrossRef CAS PubMed.
- K. Guo, H. Qian, F. Liu, J. Ye, L. Liu and X. Zheng, The impact of using portable humidifiers on airborne particles dispersion in indoor environment, J. Build. Eng., 2021, 43, 103147 CrossRef.
- A. Sain, J. Zook, B. Davy, L. Marr and A. Dietrich, Size and mineral composition of airborne particles generated by an ultrasonic humidifier, Indoor Air, 2018, 28, 80–88 CrossRef CAS PubMed.
- W. Yao, D. L. Gallagher, L. C. Marr and A. M. Dietrich, Emission of iron and aluminum oxide particles from ultrasonic humidifiers and potential for inhalation, Water Res., 2019, 164, 114899 CrossRef CAS PubMed.
- V. R. Highsmith, R. J. Hardy, D. L. Costa and M. S. Germani, Physical and chemical characterization of indoor aerosols resulting from the use of tap water in portable home humidifiers, Environ. Sci. Technol., 1992, 26, 673–680 CrossRef CAS.
- W. Yao, D. L. Gallagher and A. M. Dietrich, An overlooked route of inhalation exposure to tap water constituents for children and adults: Aerosolized aqueous minerals from ultrasonic humidifiers, Water Res.: X, 2020, 9, 100060 CAS.
- A. E. Sain and A. M. Dietrich, Emission of inhalable dissolved drinking water constituents by ultrasonic humidifiers, Environ. Eng. Sci., 2015, 32, 1027–1035 CrossRef CAS.
- A. S. Daftary and R. R. Deterding, Inhalational lung injury associated with humidifier “white dust”, Pediatrics, 2011, 127, e509–e512 CrossRef PubMed.
- K. Kang, H. Kim, D. D. Kim, Y. G. Lee and T. Kim, Characteristics of cooking-generated PM10 and PM2.5 in residential buildings with different cooking and ventilation types, Sci. Total Environ., 2019, 668, 56–66 CrossRef CAS PubMed.
- Y.-C. Li, M. Shu, S. S. H. Ho, C. Wang, J.-J. Cao, G.-H. Wang, X.-X. Wang, K. Wang and X.-Q. Zhao, Characteristics of PM2.5 emitted from different cooking activities in China, Atmos. Res., 2015, 166, 83–91 CrossRef.
- L. Sun, L. A. Wallace, N. A. Dobbin, H. You, R. Kulka, T. Shin, M. St-Jean, D. Aubin and B. C. Singer, Effect of venting range hood flow rate on size-resolved ultrafine particle concentrations from gas stove cooking, Aerosol Sci. Technol., 2018, 52, 1370–1381 CrossRef CAS.
- K.-P. Yu, K. R. Yang, Y. C. Chen, J. Y. Gong, Y. P. Chen, H.-C. Shih and S.-C. C. Lung, Indoor air pollution from gas cooking in five Taiwanese families, Build. Environ., 2015, 93, 258–266 CrossRef.
- Q. Liu, Y. J. Son, L. Li, N. Wood, A. M. Senerat and J. Pantelic, Healthy home interventions: Distribution of PM2.5 emitted during cooking in residential settings, Build. Environ., 2022, 207, 108448 CrossRef.
- A. T. Johnson, Respirator masks protect health but impact performance: a review, J. Biol. Eng., 2016, 10, 1–12 CrossRef PubMed.
- Y. Zhao and B. Zhao, Emissions of air pollutants from Chinese cooking: A literature review, Build. Simul., 2018, 977–995 CrossRef.
- F. Wang, D. Meng, X. Li and J. Tan, Indoor-outdoor relationships of PM2.5 in four residential dwellings in winter in the Yangtze River Delta, China, Environ. Pollut., 2016, 215, 280–289 CrossRef CAS PubMed.
- C. O'Leary, Y. de Kluizenaar, P. Jacobs, W. Borsboom, I. Hall and B. Jones, Investigating measurements of fine particle (PM2.5) emissions from the cooking of meals and mitigating exposure using a cooker hood, Indoor Air, 2019, 29, 423–438 CrossRef PubMed.
- R. Sharma and R. Balasubramanian, Evaluation of the effectiveness of a portable air cleaner in mitigating indoor human exposure to cooking-derived airborne particles, Environ. Res., 2020, 183, 109192 CrossRef CAS PubMed.
- Sensor data cleaning and correction: Application on the AirNow Fire and Smoke Map, https://cfpub.epa.gov/si/si_public_record_report.cfm?dirEntryId=353088%26Lab=CEMM, January 03, 2023 Search PubMed.
Footnote |
| † Electronic supplementary information (ESI) available. See DOI: https://doi.org/10.1039/d2ea00149g |
| This journal is © The Royal Society of Chemistry 2023 |

