 Open Access Article
Creative Commons Attribution 3.0 Unported Licence
Elucidation of the electronic structures of thiolate-protected gold nanoclusters by electrochemical measurements
Tokuhisa
Kawawaki
 *ab and
Yuichi
Negishi
 *ab
*ab
aDepartment of Applied Chemistry, Faculty of Science, Tokyo University of Science, Kagurazaka, Shinjuku-ku, Tokyo 162-8601, Japan. E-mail: kawawaki@rs.tus.ac.jp; negishi@rs.tus.ac.jp
bResearch Institute for Science & Technology, Tokyo University of Science, Shinjuku-ku, Tokyo 162-8601, Japan
First published on 8th September 2023
Abstract
Metal nanoclusters (NCs) with sizes of approximately 2 nm or less have different physical/chemical properties from those of the bulk metals owing to quantum size effects. Metal NCs, which can be size-controlled and heterometal doped at atomic accuracy, are expected to be the next generation of important materials, and new metal NCs are reported regularly. However, compared with conventional materials such as metal complexes and relatively large metal nanoparticles (>2 nm), these metal NCs are still underdeveloped in terms of evaluation and establishment of application methods. Electrochemical measurements are one of the most widely used methods for synthesis, application, and characterisation of metal NCs. This review summarizes the basic knowledge of the electrochemistry and experimental techniques, and provides examples of the reported electronic states of thiolate-protected gold NCs elucidated by electrochemical approaches. It is expected that this review will provide useful information for researchers starting to study metal NCs.
1 Introduction
Metal nanoclusters (NCs) are a promising and widely studied group of next-generation nanomaterials.1–7 Although there is no strict definition of a NC, when the size of a metal particle is below ∼2 nm, it is often called a metal NC. Metal NCs are known to have different electronic/geometric structures from both the corresponding bulk metals and metal nanoparticles (NPs), and they thus have different physical properties and functions. Furthermore, because such properties and functions are dependent on the number of constituent atoms, creation of multiple functions with a single element is possible if the number of constituent atoms can be controlled in the size region of metal NCs. If multiple elements are used,8,9 an even greater variety of functions can be created. Among these metal NCs, gold (Au) NCs protected by thiolate (SR) groups (Aun(SR)m, where n is the number of constituent Au atoms and m is the number of SR ligands) have been the most studied. This is because of their simple and easy synthesis under atmospheric conditions and their relatively high chemical and thermal stability. Furthermore, many Aun(SR)m NCs can be analysed by single-crystal X-ray diffraction (SCXRD) to reveal their geometric structure and by density functional theory (DFT) calculations to reveal their electronic structure and origin of constructed orbitals.10,11 Therefore, Aun(SR)m NCs have attracted widespread attention as novel nanomaterials in environmental, energy, and biological fields.12–17Electrochemical methods play an important role in investigation of metal NCs with respect to elucidation of their electronic structures (Fig. 1).18–20 In this review, we summarise previous reports using electrochemical approaches to study the electronic structures of Aun(SR)m NCs. In section 2, we provide a brief history of synthesis of Aun(SR)m NCs. In section 3, we discuss the principles of electrochemical measurement techniques and provide reported examples of the electronic structures of Aun(SR)m NCs determined by electrochemical methods. In section 4, we summarise previous work and discuss the future outlook of this field. Studies on electrochemical catalysis21–24 and synthesis of Au NCs9,25–27 were excluded from the present review because they have been described in detail elsewhere.
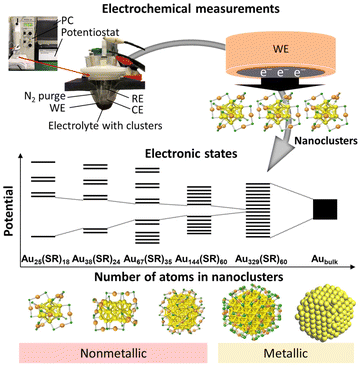 | ||
| Fig. 1 Schematic of electrochemical measurements for elucidation of the electronic structure of metal clusters. | ||
2 Thiolate-protected gold nanoclusters
The characteristics of the electronic structures of metal NCs are between those of metal complexes and metal NPs. Consequently, they have many similarities in their synthetic methods. As in general synthesis of metal NPs, metal NCs are obtained by mixing a solution containing organic ligands with metal salts as precursors with addition of a reducing agent. Such liquid-phase synthesis is called a bottom-up method. Since the late 1960s, efforts have been made to synthesise metal NCs consisting of Au, platinum (Pt), and palladium (Pd) with phosphine, halogen (X), and carbon monoxide (CO) as ligands.28–32 Moreover, metal NCs comprising SR-protected Au, silver (Ag), copper (Cu), Pt, and Pd have also been reported. Aun(SR)m NCs are extremely stable in air owing to the strong bonding between Au and sulfur (S).33,34 Therefore, precise separation and synthesis of a single chemical composition of these Aun(SR)m NCs was attempted relatively early.35,36 In general, Aun(SR)m NCs are synthesised by (i) adding a metal salt (e.g., gold chloride) to a solvent, (ii) adding a thiol as a ligand, and (iii) mixing with a reducing agent (e.g., sodium borohydride). The by-products and remaining SR complex are then washed off with solvent to obtain Aun(SR)m NCs with a uniform number of constituent atoms. In addition to SR, a number of syntheses using phosphine, N-heterocyclic carbene, and alkynyl ligands have also been reported.37,38 Moreover, some Au atoms in Aun(SR)m NCs can be exchange by Ag, Cu, Pt, Pd, iridium (Ir), mercury (Hg), cadmium (Cd) and so on. For Aun(SR)m NCs, many of their geometric structures have been determined by SCXRD.39 In conjunction with the development of these synthetic methods, the resulting Aun(SR)m NCs has been used as luminescent materials,40–42 chemical sensors,43 photosensitisers,44–46 catalysts,11,47–49 electrocatalysts,22,49–53 and photocatalysts.49,54,55 This is because the unique electronic/geometric structures of Aun(SR)m NCs give rise to properties and functions that are not observed in bulk metals and metal NPs. Research on metal NCs, which can be regarded as ultimate nanomaterials based on atomically precise control, has become increasingly active in recent years.3 Electronic structures of thiolate-protected metal nanoclusters by electrochemical methods
In this section, we describe the basic experimental techniques of electrochemical measurements and describe a series of studies on the electronic structures of Aun(SR)m NCs among the studies of metal NCs using electrochemical measurement techniques.3.1 Electrochemical methods for determination of the electronic structures of metal nanoclusters
There are two main parameters used in electrochemical measurements: the voltage (potential) and the current. The potential is the energy applied to the electrodes to cause a reaction (Fig. 2a), while the current indicates the reaction rate. By controlling these parameters, the causal relationship between them and their correlation with time can be investigated. In basic electrochemical measurements, three-electrode (working electrode (WE), reference electrode (RE), and counter electrode (CE)) or two-electrode (WE and CE) systems are used. The WE is the main electrode in the electrochemical reaction, and electrons are transferred and chemical reactions occur on its surface. The RE is used to control the potential of the WE and as a standard of the potential for the measurements. The CE is paired with the WE and serves to conduct unwanted current. These electrodes are immersed in an electrolyte containing the reactants, and the potential and current are controlled using a potentiostat to make electrochemical measurements. They can also be evaluated as a solid device by using a solid electrolyte instead of a solution electrolyte. Electrochemical measurement methods can be divided into several measurement methods depending on the settings of the potential and current (Fig. 2).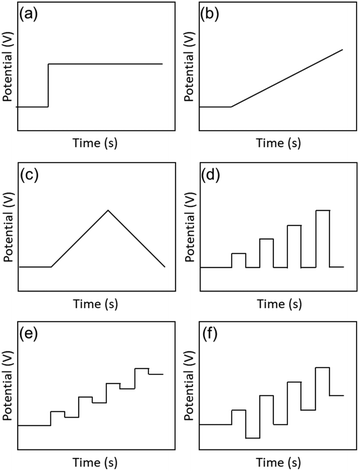 | ||
| Fig. 2 Electrochemical methods: (a) chronoamperometry, (b) LSV, (c) CV, (d) NPV, (e) DPV, and (f) SWV. | ||
Among the electrochemical measurement methods, voltammetry is the most basic method for measuring the flowing current by continuously changing the potential of the WE. Linear sweep voltammetry (LSV) is a technique in which the potential is swept in one direction and the current is measured (Fig. 2b). The measurement method in which the potential is folded back and the applied potential cycle is swept repeatedly in a specific potential range is called cyclic voltammetry (CV) (Fig. 2c). CV is widely used as a general purpose method because it provides a rough state of the electrochemical condition on the surface of the WE. Furthermore, it can provide information about (i) the ease of oxidation or reduction of the reactants dissolved in the electrolyte, (ii) the chemical reactions at the surface of the WE, and (iii) the species adsorbed on the surface of the WE. The direction and rate of sweep of the applied potential are important parameters, and their behaviour depends on the reversibility of the electrochemical reactions.
LSV and CV gradually change the applied voltage over a period of time and monitor the current during that time. In contrast, pulse voltammetry applies pulse-stepped potentials and measures the current. In LSV and CV, the reaction proceeds with the charging of the electrical double layer at the surface of the electrode, because the potential gradually changes with time. This makes it difficult to separate the non-faradaic current (i.e., the capacitive current) from the faradaic current (i.e., the reaction current). However, in pulse voltammetry, the charging of the electric double layer immediately ends after the applied potential step, so that the faradaic current can be separated and extracted. Therefore, by giving a slightly different potential each time and plotting the current values at regular intervals, more detailed analysis can be performed using pulse voltammetry compared with LSV and CV. Depending on the shape of the pulse, the measurements can be classified as normal pulse voltammetry (NPV, Fig. 2d), differential pulse voltammetry (DPV, Fig. 2e), and square-wave voltammetry (SWV, Fig. 2f). SWV can significantly reduce the measurement time compared with normal pulse voltammetry and DPV because the step potential is gradually increased. In recent years, pulse voltammetry has been used to determine the electronic states of metal NCs, and it can be combined with optical absorption spectroscopy, luminescence measurements, and DFT calculations to investigate the electronic structures of metal NCs in detail.
3.2 Determination of the electronic structures of metal nanoclusters
The earliest study of voltammetry of small metal NPs was reported by Mulvaney and co-workers in 1997.19,56 Initially, single-electron tunnelling microelectrode measurements using scanning tunnelling microscopy was the main focus.57,58 In 1998, Whetten and co-workers59 performed electrochemical analysis of Aun(SR)m NCs, which were easily obtained by liquid-phase synthesis (Fig. 3). The electronic structures of Aun(SR)m NCs with sizes of 8–38 kDa (1.1–1.9 nm in diameter) protected with an alkanethiolate (butanethiolate (SC4H9) or hexanethiolate (SC6H13)) were evaluated by DPV measurement.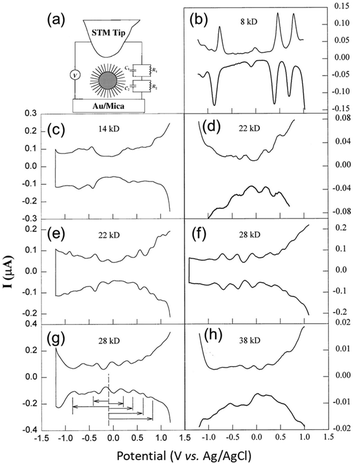 | ||
Fig. 3 (a). Schematic of the scanning tunnelling microscopy double tunnel-junction model. Differential pulse voltammograms of (b), (d), (f) and (h) hexanethiolate-, and (c), (e), and (g) butanethiolate-Au NCs as a function of the uniform core size in 0.05 M tetrabutylammonium perchlorate/toluene/acetonitrile (2![[thin space (1/6-em)]](https://www.rsc.org/images/entities/char_2009.gif) : :![[thin space (1/6-em)]](https://www.rsc.org/images/entities/char_2009.gif) 1 = v 1 = v![[thin space (1/6-em)]](https://www.rsc.org/images/entities/char_2009.gif) : :![[thin space (1/6-em)]](https://www.rsc.org/images/entities/char_2009.gif) v) at a 9.5 × 10⁻³ cm2 Pt electrode (direct current potential scan at 10 mV s−1 with a pulse amplitude of 50 mV). The sizes and concentrations were (b) 8 kDa and 0.30 mM, (c) 14 kDa and 0.086 mM, (d) 22 kDa and 0.10 mM, (e) 22 kDa and 0.032 mM, (f) 28 kDa and 0.10 mM, (g) 28 kDa and 0.10 mM, and (h) 38 kDa and 0.10 mM. Reproduced with permission from ref. 59. Copyright 1998, AAAS. v) at a 9.5 × 10⁻³ cm2 Pt electrode (direct current potential scan at 10 mV s−1 with a pulse amplitude of 50 mV). The sizes and concentrations were (b) 8 kDa and 0.30 mM, (c) 14 kDa and 0.086 mM, (d) 22 kDa and 0.10 mM, (e) 22 kDa and 0.032 mM, (f) 28 kDa and 0.10 mM, (g) 28 kDa and 0.10 mM, and (h) 38 kDa and 0.10 mM. Reproduced with permission from ref. 59. Copyright 1998, AAAS. | ||
The double-layer capacitance of small NCs can be modelled by considering the NC to be a concentric sphere capacitor. The inner and outer spheres have different radii, which correspond to the metal-core radius (r) and the thickness of the SR ligand layer (d) in Aun(SR)m, respectively. Considering the dielectric function of the SR ligand layer, the capacitance of the NC (CNC) is described by the following eqn (1):60,61
 | (1) |
Assuming that CNC does not vary with the charge of the metal core, a continuous series of charge steps (ΔVc) occurs at regular intervals when the metal core catches and releases one electron:
 | (2) |
Based on eqn (2), the large Aun(SR)m NCs (22–38 kDa) exhibited a Coulomb staircase-like response consistent with a metallic double-layer charge (Fig. 3e and f). In contrast, the small Aun(SR)m NCs (8 and 14 kDa) exhibited trends like a molecule (Fig. 3b and c), including a large central gap (1.2 and 0.7 V vs. Ag/AgCl for the 8 kDa Aun(SR)m NCs). Such molecule-like behaviour of the small Aun(SR)m NCs is similar to that of Pt carbonyl NCs,63 and it is consistent with the highest occupied molecular orbital (HOMO)–lowest unoccupied molecular orbital (LUMO) gaps obtained from the optical absorption spectra.
Studies then started to estimate the HOMO–LUMO (H–L) gaps of Aun(SR)m NCs by electrochemical methods, such as DPV.60,62,64–70 However, the electronic structures of Aun(SR)m NCs controlled with atomic precision were only revealed electrochemically from 2004. The development of methods for synthesis and isolation of Aun(SR)m NCs and establishment of evaluation methods, such as the development of mass spectrometry instruments, significantly contributed to this breakthrough. In recent years, the electronic structures of a number of Au NCs have been clarified. Such information about the electronic structure can also be obtained by optical absorption spectroscopy and DFT calculations. The H–L gaps of Aun(SR)m NCs determined by electrochemical methods are summarised in Table 1, along with information71,72 about the electronic structures obtained by other methods. In this review, the effects of the representative factors of the (i) size, (ii) ligand, (iii) introduction of other elements, and (iv) geometrical structure changes on the electronic structures of Aun(SR)m NCs are introduced.
| Composition | Geometric structure | Conditions for the electrochemical measurements |
E
eg [eV]![[thin space (1/6-em)]](https://www.rsc.org/images/entities/char_2009.gif) a a |
[eV]![[thin space (1/6-em)]](https://www.rsc.org/images/entities/char_2009.gif) b b |
E
cg [eV]![[thin space (1/6-em)]](https://www.rsc.org/images/entities/char_2009.gif) c c |
Ref.d |
|---|---|---|---|---|---|---|
| a Electrochemical HOMO–LUMO gap. b Optical HOMO–LUMO gap. c DFT-calculated HOMO–LUMO gap. d Reference number. e Bi-Oh: Bi-octahedral. f TBAPF6: tetrabutylammonium hexafluorophosphate. g MPS: (3-mercaptopropyl)sulfonate. h I h: icosahedral. i BAP: tetra-n-butylammonium perchlorate. j Bi-Ih: bi-icosahedral. k FCC: face-centered cubic. l BTPPATBF20: bis(triphenyl phosphoranylidene)ammonium tetrakis(pentafluorophenyl). m Tri-Ih: tri-icosahedral. n S-Nap: 2-naphthalenethiolate. o D h: decahedral. Room temperature (RT). | ||||||
| Au18(SC6H11)14 | Bi-Ohe | RT, DPV, 0.1 M TBAPF6/CH2Cl2![[thin space (1/6-em)]](https://www.rsc.org/images/entities/char_2009.gif) f f |
1.91 | 1.7 | — | 75 |
| Au15Ag3(SC6H11)14 | RT, DPV, 0.1 M TBAPF6/CH2Cl2 | 2.11 | 2.0 | — | 75 | |
| [Au25(SC6H5)18]− |
I
h![[thin space (1/6-em)]](https://www.rsc.org/images/entities/char_2009.gif) h h |
RT, DPV, 0.1 M TBAPF6/CH2Cl2 | 1.16 | — | — | 113 |
| [Au25(SC6H13)18]− | RT, SWV, 0.1 M TBAPF6/CH2Cl2 | 1.32 | 1.3 | — | 88 | |
RT, DPV, 0.1 M TBAPF6/CH2Cl2![[thin space (1/6-em)]](https://www.rsc.org/images/entities/char_2009.gif) : :![[thin space (1/6-em)]](https://www.rsc.org/images/entities/char_2009.gif) toluene toluene |
∼1.65 | — | — | 108 | ||
| RT, DPV, 0.1 M TBAPF6/CH2Cl2 | 1.25 | — | — | 113 | ||
| SWV, 0.1 M TBAPF6/CH2Cl2 | 1.31 | — | — | 89 | ||
| Au25(SCnH2n+1)18 (n = 2–12) | RT, DPV, 0.1 M TBAPF6/CH2Cl2 | 1.29–1.31 | — | — | 99 | |
Au25(MPS)18![[thin space (1/6-em)]](https://www.rsc.org/images/entities/char_2009.gif) g g |
RT, DPV, 0.1 M TBAPF6/CH2Cl2![[thin space (1/6-em)]](https://www.rsc.org/images/entities/char_2009.gif) : :![[thin space (1/6-em)]](https://www.rsc.org/images/entities/char_2009.gif) toluene toluene |
1.39–1.66 | — | — | 108 | |
| [Au25(PET)18]− | RT, DPV, 0.1 M TBAPF6/CH2Cl2 | 1.34 | — | — | 76 | |
| RT, DPV, 0.1 M TBAPF6/DMF | 1.44 | — | — | 76 | ||
| RT, DPV, 0.1 M TBAPF6/CH2Cl2 | 1.23 | — | — | 113 | ||
| 273 K, DPV, 0.1 M TBAPF6/CH2Cl2 | 1.30 | 1.17 | — | 116 | ||
| [Au25(PET)18]+ | DPV, 0.1 M TBAP/benzene![[thin space (1/6-em)]](https://www.rsc.org/images/entities/char_2009.gif) : :![[thin space (1/6-em)]](https://www.rsc.org/images/entities/char_2009.gif) acetonitrilei acetonitrilei |
1.54 | — | — | 80 | |
| [Au24Pt(SC4H9)18]0 | RT, DPV, 0.1 M TBAPF6/CH2Cl2 | 0.38 | — | — | 112 | |
| [Au24Pt(SC6H13)18]0 | SWV, 0.1 M TBAPF6/CH2Cl2 | 0.34 | — | — | 110 | |
| [Au24Pd(SC6H13)18]0 | 0.32 | — | — | 110 | ||
| [Au24Hg(PET)18]0 | RT, DPV, 0.1 M TBAPF6/CH2Cl2 | 1.20 | — | — | 113 | |
| 1.29 | — | — | 112 | |||
| [Au24Hg(SC4H9)18]0 | 1.28 | — | — | |||
| [Au24Cd(SC4H9)18]0 | 1.41 | 1.37 | — | |||
| [Au24Cd(PET)18]0 | 1.46 | 1.41 | — | |||
| 273 K, DPV, 0.1 M TBAPF6/CH2Cl2 | 1.29 | 1.22 | — | 116 | ||
| [Au24Pt(PET)18]2− | >1.80 | 1.40 | — | |||
| [Au23CdPt(PET)18]− | 1.45 | 1.41 | — | |||
| [Au25(PPh3)10(SC6H13)5Cl2]2+ | Bi-Ih![[thin space (1/6-em)]](https://www.rsc.org/images/entities/char_2009.gif) j j |
RT, DPV, 0.1 M TBAPF6/CH2Cl2 | 1.54 | 1.82 | — | 101 |
| [Au25(PPh3)10(PET)5Cl2]2+ | DPV, TBAPF6/CH2Cl2 | 1.57 | ∼1.4 | — | 119 | |
| [Au24Pd(PPh3)10(PET)5Cl2]+ | 1.29 | ∼1.2 | — | |||
| Au36(SPh)24 | FCCk | RT, DPV, 0.5 M BTPPATBF20/CH2Cl2![[thin space (1/6-em)]](https://www.rsc.org/images/entities/char_2009.gif) l l |
1.96 | 1.71 | 1.51–1.79 | 81 |
| [Au37(PPh3)10(PET)10Cl2]+ | Tri-Ih![[thin space (1/6-em)]](https://www.rsc.org/images/entities/char_2009.gif) m m |
RT, DPV, 0.1 M TBAPF6/CH2Cl2 | 0.77 | 0.83 | — | 82 |
| Au38(PET)24 | I h | RT, DPV, 0.1 M TBAPF6/CH2Cl2 | 1.00 | 0.92 | — | 83 |
| Au38(SC6H13)24 | RT, SWV, 0.1 M TBAPF6/CH2Cl2 | 0.99 | 0.9 | — | 88 | |
| [Au38(SC6H13)24]0 | SWV, 0.1 M TBAPF6/CH2Cl2 | 0.86 | — | 1.01 | 114 | |
| [Au36Pd2(SC6H13)24]0 | SWV, 0.1 M TBAPF6/CH2Cl2 | 0.26 | — | 0.23 | 114 | |
| [Au36Pt2(SC6H13)24]2− | SWV, 0.1 M TBAPF6/CH2Cl2 | 0.95 | — | 1.10 | 114 | |
| Au67(PET)35 | — | RT, DPV, 0.5 M TBAPF6/THF | 0.74 | — | 0.75 | 84 |
| Au67(SC6H13)35 | — | RT, SWV, 0.1 M TBAPF6/CH2Cl2 | 0.61 | 0.7 | — | 88 |
| Au102(SC6H13)44 | D h | RT, SWV, 0.1 M TBAPF6/CH2Cl2 | 0.18 | <0.5 | — | 88 |
Au103S2(S-Nap)41![[thin space (1/6-em)]](https://www.rsc.org/images/entities/char_2009.gif) n n |
RT, DPV, 0.1 M TBAPF6/CH2Cl2 | 0.38 | 0.42 | — | 105 | |
| Au130(PET)50 | RT, DPV, BTPPATBF20/CH2Cl2 | 0.21 | — | — | 85 | |
| Au144(SC6H13)60 | I h | RT, SWV, 0.1 M TBAPF6/CH2Cl2 | 0.15 | <0.5 | — | 88 |
| Au333(SC6H13)79 | — | RT, SWV, 0.1 M TBAPF6/CH2Cl2 | 0.04 | <0.5 | — | 88 |
3.3 Size effect on the electronic structure of thiolate-protected gold nanoclusters
In 2004, Murray and co-workers73 found that the electrochemically determined band gap of Au38(PET)24 (PET = 2-phenylethanethiolate), which was later modified to Au25(PET)18 (Fig. 4A) owing to developments in mass spectrometry, was consistent with the optically determined band gap.74 Au25(PET)18 was dissolved in a mixture of toluene/acetonitrile or dichloromethane (CH2Cl2) containing 0.1 M tetrabutylammonium hexafluorophosphate (TBAPF6) using 0.4 mm-diameter Pt for the WE, a Ag wire for the pseudo-RE (Ag QRE), and a Pt wire for the CE. The dissolved Au25(PET)18 was evaluated by DPV and CV (Fig. 4B). A resting potential of −0.1 V vs. Ag QRE was observed at 25 °C, with the first one-electron oxidation peak (O1) slightly on the positive side. Conversely, the first one-electron reduction peak (R1) was largely on the negative side, showing a large energy gap (1.62 V) (Fig. 4B and C). The potential intervals were calculated to be 0.73, 0.29, and 1.62 V for the O3–O2, O2–O1, and O1–R1 transitions, respectively. In this case, measurements at low temperature (−70 °C) contributed to the reversibility, especially in the high oxidation state. In general, the energy gap between the initial one-electron oxidation and one-electron reduction (O1–R1) is the H–L gap including the electron and hole charging energies. Therefore, to calculate the pseudo-H–L gap, this charging energy has to be subtracted. The charging energy was estimated to be 0.29 V, which corresponded to the O2–O1 transition. Because the energy gap between the initial one-electron oxidation and one-electron reduction in CH2Cl2 was 1.62 V (O1–R1), a value of 1.33 eV was obtained by subtracting the charging energy of 0.29 V (O2–O1). The absorption edge wavelength (i.e., the H–L gap) obtained from the optical absorption spectrum was 1.33 eV, which was in close agreement with the electrochemically determined H–L gap (Fig. 4C). Subsequently, several groups reported the H–L gaps of Au18(SC6H11)14,75 [Au25(SR)18]−,76–80 Au36(SPh)24 (SPh = benzenethiolate),81 [Au37(PPh3)10(PET)10Cl2]+ (PPh3 = triphenylphosphine),82 Au38(SR)24,68,83 Au67(PET)35,84 Au130(PET)50,85 Au130(Dur-DT)29(PET)22 (Dur-DT = durene-dithiolate),86 and Au133(TBBT)52 (TBBT = tert-butylbenzenethiolate),87 which were estimated by electrochemical measurements.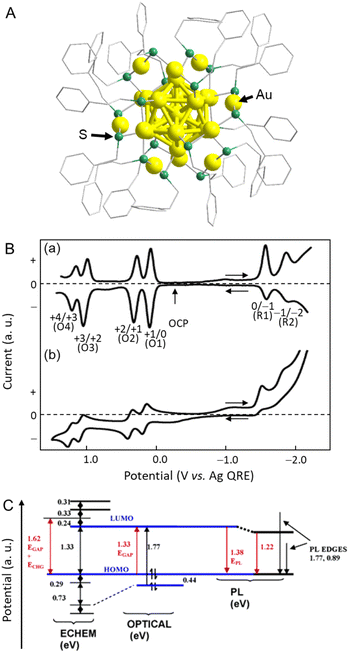 | ||
| Fig. 4 (A) Geometric structure of [Au25(PET)18]−. (B) (a) 25 °C DPVs at 0.02 V s−1, and (b) −70 °C cyclic voltammogram (0.1 V s−1) of Au25(PET)18 in 0.1 M TBAPF6 in degassed CH2Cl2 with a 0.4 mm-diameter Pt WE, a Ag-wire quasi-RE, and a Pt-wire CE. The arrows indicate the solution rest potentials, and * indicates the wave for incompletely removed O2, which varied from experiment to experiment. (C) Energy level diagram for Au25(PET)18 based on the data in CH2Cl2 solution. Reproduced with permission from ref. 74. Copyright 2004, American Chemical Society. | ||
Lee and co-workers88,89 used Au25(SC6H13)18, Au38(SC6H13)24, Au67(SC6H13)35, Au102(SC6H13)44, Au144(SC6H13)60, and Au333(SC6H13)79 to obtain the size effect of the H–L gap. They performed SWV measurements of each Aun(SR)m NC (Fig. 5A). The electrochemical H–L gaps were determined to be 1.32, 0.99, 0.61, 0.18, and 0.15 eV for Au25(SC6H13)18, Au38(SC6H13)24, Au67(SC6H13)35, Au102(SC6H13)44, and Au144(SC6H13)60, respectively (Fig. 5B). A significantly size-dependent O1–R1 gap was observed for the small Aun(SR)m NCs. The O1–R1 gaps of Au102(SC6H13)44, Au144(SC6H13)60, and Au333(SC6H13)79 were considerably smaller than those of the relatively small Aun(SR)m NCs (0.49, 0.39 and 0.22 V, respectively), and the O1 and R1 peaks were observed with equally spaced current peaks along with other peaks. This suggests that Au102(SC6H13)44, Au144(SC6H13)60, and Au333(SC6H13)79 work as quantum capacitors that exhibit the charging characteristics of a quantum double layer. In other words, the double-layer capacitance of these Aun(SR)m NCs is sufficiently small that the potential spacing between successive single-electron changes of the charge on the NC core becomes experimentally observable. The optical absorption spectra of Au25(SC6H13)18, Au38(SC6H13)24, and Au67(SC6H13)35 showed absorption edges of 1.3, 0.9, and 0.7 eV, respectively. The absorption edges corresponded to the Aun(SR)m optical gaps for the electronic transitions, and the absorption edge decreased with increasing Aun(SR)m size. For relatively large Aun(SR)m NCs, such as Au102(SC6H13)44, Au144(SC6H13)60, and Au333(SC6H13)79, the optical energy gap was less than 0.5 eV and the absorption edge became less distinct. In this respect, the electrochemical method was able to calculate the H–L gap with higher accuracy than optical absorption spectroscopy. From the optical absorption spectrum, Au333(SC6H13)79 showed a prominent band of surface plasmon resonance at approximately 2.3 eV. This indicates that electrons collectively oscillate within Au333(SC6H13)79 in response to the incident optical electric field, indicating that it has metallic properties.
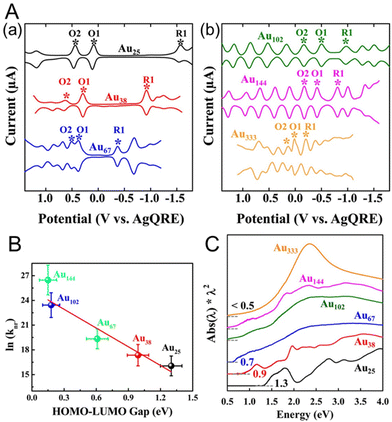 | ||
| Fig. 5 (A) Square-wave voltammograms of (a) Au25(SC6H13)18, Au38(SC6H13)24, and Au67(SC6H13)35 and (b) Au102(SC6H13)44, Au144(SC6H13)60, and Au333(SC6H13)79 in CH2Cl2 containing 0.1 M TBAPF6. (B) Plot of ln(knr) versus the H–L gap for gold clusters. The solid line is the best fit straight line for the data (Au25–Au144). (C) Ultraviolet–visible–near-infrared absorption spectra of Au25(SC6H13)18, Au38(SC6H13)24, Au67(SC6H13)35, Au102(SC6H13)44, Au144(SC6H13)60, and Au333(SC6H13)79. Reproduced with permission from ref. 88. Copyright 2017, American Chemical Society. | ||
The electronic structure of Au329(PET)84, a relatively large Aun(SR)m NC, was further analysed electrochemically by Dass and co-workers.90 They found that over a potential window of approximately 4 V, Au329(PET)84 exhibited 22 electronic states. In this study, the capacitance varied in proportion to the size of the Aun(SR)m NC. The transition of the electronic state from molecular to metallic in Aun(SR)m is still not completely understood. Au246(p-MBT)80 (p-MBT = p-methylbenzenethiolate) is the largest non-metallic Aun(SR)m NC and Au279(TBBT)84 is the smallest metallic Aun(SR)m NC, as revealed by Jin and co-workers91–94 by transient absorption spectroscopy. However, while Au246(p-MBT)80 has an octahedral structure, Au279(TBBT)84 has a face-centred cubic (fcc) structure. The influences of the differences in the geometry and ligand effect have not been clarified, so further investigation is required.95,96
The small size region of Aun(SR)m NCs was further investigated by Jin and co-workers97 using Au133(TBBT)52 and Au144(BM)60 (BM = phenylmethanethiolate). They found that the charging energy decreases with the catch and release of Aun(SR)m electrons in the more oxidised/reduced state (Fig. 6). This trend can be attributed to an increase in the capacitance of Aun(SR)m due to an increase in the dielectric constant of the ligand monolayer by penetration or intercalation of electrolyte ions. Indeed, when the temperature during the electrochemical measurements of Au133(TBBT)52 was lowered to 195 K, the charging energy became independent of the redox state and showed a constant value (Fig. 6A and B). Interestingly, the charging energy was much less sensitive to temperature changes for Au133(TBBT)52 in the reduced state compared with oxidised Au133(TBBT)52. To access the core stabilised by the bulky tert-butyl terminal functional group, the tetrabutylammonium cation is considerably less accessible than the perchloride anion because of steric hinderance. The relatively large decrease in the charging energy of oxidised NCs in the low temperature measurements could be due to suppression of the movement of such sterically hindered molecules at low temperature. Conversely, the BM monolayer of Au144(BM)60 is more flexible owing to the absence of the bulky tert-butyl group between the S atom and the phenyl group. Therefore, Au144(BM)60 exhibits a smaller peak potential spacing owing to it having larger capacitance than Au133(TBBT)52 with roughly the same sized metal core (Fig. 6C and D).
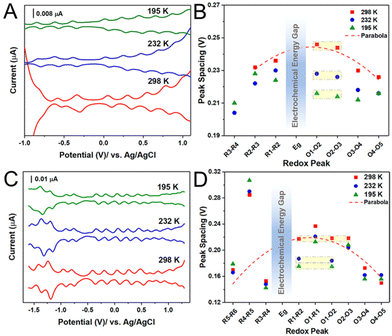 | ||
| Fig. 6 Temperature dependence of electrochemical properties of Au133(TBBT)52 and Au144(BM)60. (A and C) The DPVs and (B and D) the electrochemical peak spacing of (A and B) Au133(TBBT)52 and (C and D) Au144(BM)60 at 298, 232, and 195 K. Peak spacing ΔVs in (B) and (C) analyzed from (A) and (C), respectively. Reproduced with permission from ref. 97. Copyright 2020, American Chemical Society. | ||
3.4 Ligand effect on the electronic structure of thiolate-protected gold nanoclusters
Changes in the ligand from the S atom onwards have little effect on the electrochemically determined H–L gap in many cases,74,90,97–101 but replacing the S atom with a different element causes a change in the H–L gap.Negishi and co-workers102 investigated the ligand dependence using [Au25(PET)18−x(SePh)x]− (SePh = benzeneselenolate) and [Au25(PET)18−x(TePh)x]− (TePh = benzenetellurolate) by DPV measurements in 2016 (Fig. 7A). When the PET ligands were replaced by SePh or TePh, the redox potentials of R1 and O1 shifted towards the positive side (Fig. 7B). However, when the PET ligands were replaced by SePh, the redox potentials of O2 and O3 shifted to the negative side in the final step of ligand exchange (around x = 18) (Fig. 7B). Furthermore, the H–L gap narrowed as the number of exchanges increased. The relationships between the changes in the redox potentials of O2 and O3 and the number of exchanged ligands were not linear. This is presumably because of changes in the framework structure of the NC with increasing number of exchanged ligands, reflecting the difference in the atomic radii of S and Se. A similar trend was also reported by Zhu and co-workers103 using [Au25(PET)18]− and [Au25(SePh)18]−.
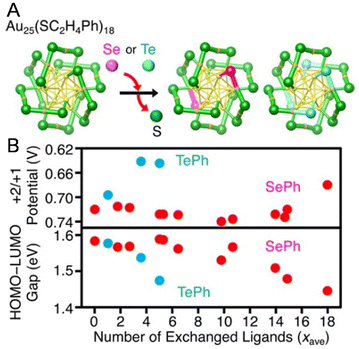 | ||
| Fig. 7 (A) Framework structures of [Au25(PET)18−x(SePh)x]− and [Au25(PET)18−x(TePh)x]− determined by SCXRD. (B) Relationships of the peak energy of O3 and the H–L gap with the average number of exchanged ligands (xave) for [Au25(PET)18]−, [Au25(PET)18−x(SePh)x]−, and [Au25(PET)18−x(TePh)x]−. In the experiments, each cluster was dissolved in 0.1 M tetrabutylammonium perchlorate in CH2Cl2. DPV was performed at room temperature. Reproduced with permission from ref. 102. Copyright 2016, American Chemical Society. | ||
In 2019, Tsukuda and co-workers104 reported the electronic structures of C![[triple bond, length as m-dash]](https://www.rsc.org/images/entities/char_e002.gif) CR-protected Au NCs by electrochemical measurements. The electrochemically determined superatomic orbital 1P–1D gaps of [Au25(PET)18]− and [Au25(C
CR-protected Au NCs by electrochemical measurements. The electrochemically determined superatomic orbital 1P–1D gaps of [Au25(PET)18]− and [Au25(C![[triple bond, length as m-dash]](https://www.rsc.org/images/entities/char_e002.gif) CArF)18]− (ArF = 3,5-(CF3)2C6H3) were 1.93 and 1.8 eV, respectively (Fig. 8A). A similar trend was observed when the superatomic orbital 1P–1D gaps were determined from the optical absorption spectra, with [Au25(C
CArF)18]− (ArF = 3,5-(CF3)2C6H3) were 1.93 and 1.8 eV, respectively (Fig. 8A). A similar trend was observed when the superatomic orbital 1P–1D gaps were determined from the optical absorption spectra, with [Au25(C![[triple bond, length as m-dash]](https://www.rsc.org/images/entities/char_e002.gif) CArF)18]− having a smaller 1P–1D gap than [Au25(PET)18]− (Fig. 8B). This can be attributed to the stronger cationic nature of Au in [Au25(C
CArF)18]− having a smaller 1P–1D gap than [Au25(PET)18]− (Fig. 8B). This can be attributed to the stronger cationic nature of Au in [Au25(C![[triple bond, length as m-dash]](https://www.rsc.org/images/entities/char_e002.gif) CArF)18]− than in [Au25(PET)18]−. The ligand dependence on the H–L gap owing to the change of the Au–S interface has been reported to be limited to relatively small Aun(SR)m NCs.105–107
CArF)18]− than in [Au25(PET)18]−. The ligand dependence on the H–L gap owing to the change of the Au–S interface has been reported to be limited to relatively small Aun(SR)m NCs.105–107
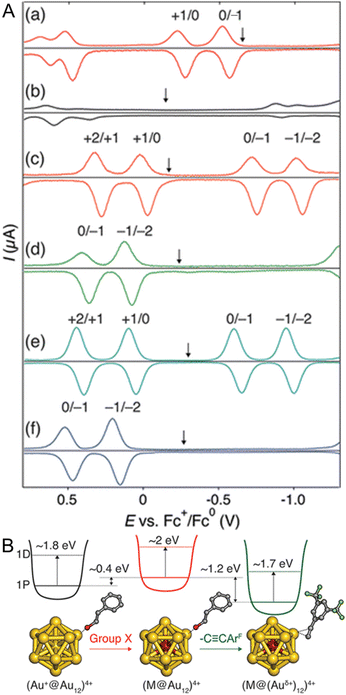 | ||
Fig. 8 (A) Differential pulse voltammograms of (a) [Au25(PET)18]−, (b) [Au25(C![[triple bond, length as m-dash]](https://www.rsc.org/images/entities/char_e002.gif) CArF)18]−, (c) [PdAu24(PET)18]0, (d) [PdAu24(C CArF)18]−, (c) [PdAu24(PET)18]0, (d) [PdAu24(C![[triple bond, length as m-dash]](https://www.rsc.org/images/entities/char_e002.gif) CArF)18]2−, (e) [PtAu24(PET)18]0, and (f) [PtAu24(C CArF)18]2−, (e) [PtAu24(PET)18]0, and (f) [PtAu24(C![[triple bond, length as m-dash]](https://www.rsc.org/images/entities/char_e002.gif) CArF)18]2− in a CH2Cl2 solution of 0.1 M TBAPF6 at room temperature. The down arrows indicate the corresponding open-circuit potentials. (B) Schematic energy diagram of M@Au12 superatoms protected by thiolate or alkynyl groups. Reproduced with permission from ref. 104. Copyright 2019, American Chemical Society. CArF)18]2− in a CH2Cl2 solution of 0.1 M TBAPF6 at room temperature. The down arrows indicate the corresponding open-circuit potentials. (B) Schematic energy diagram of M@Au12 superatoms protected by thiolate or alkynyl groups. Reproduced with permission from ref. 104. Copyright 2019, American Chemical Society. | ||
Solvent–ligand interactions also have an important effect on the electrochemically obtained H–L gap. Kwak and Lee108 investigated the H–L gaps of water-soluble Au25(MPS)18 ((3-mercaptopropyl)sulfonate) and [Au25(SC6H13)18]− by optical and electrochemical methods (Fig. 9A and B). Electrochemically, SWV measurements in CH2Cl2 containing 0.1 M TBAPF6 were performed. For [Au25(SC6H13)18]−, a H–L gap of 1.65 V was obtained, whereas the H–L gap for Au25(MPS)18 was 1.39 V. The O1–O2 gap difference was not very large, suggesting that the dielectric environments were not significantly different in the NCs. Furthermore, the ratio of the CH2Cl2/toluene solvent mixture was varied, and SWV measurements were performed in these solvents (Fig. 9A and B). In [Au25(SC6H13)18]−, the H–L gap did not change when the ratio of the mixed solvent was changed (Fig. 9B). However, for Au25(MPS)18, the first reduction potential (R1) shifted in the negative potential direction as the proportion of toluene increased. As a result, the H–L gap shifted from 1.39 to 1.66 V, which was found to be in close agreement with [Au25(SC6H13)18]− (Fig. 9A). This solvent dependence can be explained by the electrostatic effects of the MPS ligand and TOA+ (TOA = tetraoctylammonium): the SO3− group of the MPS ligand produces an ion-pair interaction with TOA+, resulting in depolarisation. Furthermore, depolarisation is expected to be influenced by the solvent polarity, which affects the strength of the ion-pair interaction between the SO3− group and TOA+. As a result, more positive charge is induced in the Au core by the polarised SO3− group, which may result in a positive redox potential shift in Au25(MPS)18. Similarly, the charging energy is known to vary with the solvent, even when only hydrophobic ligands are used. These effects of the ligand and solvent interactions on the H–L gap and charging energies might be better understood when the details of how solvation occurs between the SR ligands and solvents surrounding Aun(SR)m NCs are further clarified.
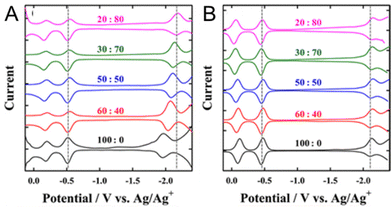 | ||
Fig. 9 Square-wave voltammograms of (A) Au25(MPS)18 and (B) Au25(SC6H13)18 in CH2Cl2/toluene mixtures containing 0.1 M TBAPF6. The CH2Cl2/toluene compositions (v/v) are indicated on the voltammograms. The first oxidation and reduction potentials of Au25(SR)18 in 20![[thin space (1/6-em)]](https://www.rsc.org/images/entities/char_2009.gif) : :![[thin space (1/6-em)]](https://www.rsc.org/images/entities/char_2009.gif) 80 CH2Cl2/toluene are indicated by dashed lines for comparison. Reproduced with permission from ref. 108. Copyright 2012, American Chemical Society. 80 CH2Cl2/toluene are indicated by dashed lines for comparison. Reproduced with permission from ref. 108. Copyright 2012, American Chemical Society. | ||
3.5 Doping effect on the electronic structure of thiolate-protected gold nanoclusters
For Au25(SR)18, there are a number of different elements (Ag, Cd, Cu, Hg, Ir, Pd, and Pt) that can be substituted for the Au atoms, and these are the most widely studied doped Aun(SR)m NCs. These Au25−xMx(SR)18 alloys can be divided into three groups: (i) a group with Pt or Pd, (ii) a group with Ag or Cu, and (iii) a group with Hg or Cd as the heteroatom. For NCs in group (i), neutral [Au24M1(SR)18]0 (M = Pt or Pd) with a total valence electron number of six can be stably synthesized.109,110 However, the NCs in group (ii) are stably synthesised as negative [Au25−xMx(SR)18]− (M = Ag or Cu) NCs, and those in group (iii) are neutral [Au25−xMx(SR)18]0 (M = Hg or Cd) NCs with a total number of eight valence electrons. The difference in the total number of valence electrons in such Au25−xMx(SR)18 NCs induces significant changes of the energy level in their HOMOs and LUMOs. Consequently, optical absorption of Au25−xMx(SR)18 (M = Ag, Cd Cu, Hg, Pd or Pt) significantly differs between the six- and eight-electron systems. The six-electron system shows a smaller H–L gap than the eight-electron system.In 2012, Negishi and co-workers.111 optically and electrochemically determined the electronic structures of [Au25−xCux(PET)18]− (x = 1–5) (Fig. 10). By DPV measurements, for [Au25(PET)18]−, the redox peaks corresponding to [Au25(PET)18]−1/0 and [Au25(PET)18]−2/−1 were observed at −282 (O1) and −1942 mV (R1) vs. ferrocene (Fc)+1/0, respectively (Fig. 10B). For [Au25−xCux(PET)18]− (x = 1–5), the peaks were observed at more positive energies (−276 (O1) and −1896 (R1) mV vs. Fc+1/0). This indicates that Cu doping decreases the HOMO and LUMO energies of [Au25(PET)18]−. The LUMO shift (46 mV) was larger than the HOMO shift (6 mV), indicating that Cu doping decreases the H–L gap. DFT calculations showed that Cu doped at the stable site does not significantly change the H–L gap, whereas Cu doped at the core surface site decreases the H–L gap.
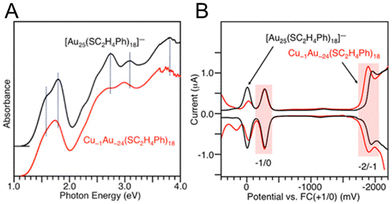 | ||
| Fig. 10 (A) Optical absorption spectra of Cu∼1Au∼24(PET)18 and [Au25(PET)18]−. The dotted lines indicate the main peak positions in the absorption spectrum of [Au25(PET)18]−. (B) DPV curves of Cu∼1Au∼24(PET)18 and [Au25(PET)18]−. The red shaded regions indicate the peaks derived from the redox potentials of −2/−1 and −1/0. Reproduced with permission from ref. 111. Copyright 2012, American Chemical Society. | ||
In 2019, Maran and co-workers112 revealed the electronic structures of Au24M(SR)18 (M = Au, Cd, Hg and Pt) by DPV measurements (Fig. 11A). Electrochemical measurements were performed using a glassy carbon microdisc electrode in CH2Cl2 containing 0.1 M TBAPF6. The DPV curves of [Au24Hg(SC4H9)18]0 and [Au24Cd(SC4H9)18]0 were qualitatively similar: two successive one-electron oxidations ( for O1 and
  for O2) were observed at 0.364 and 0.684 V vs. SCE for [Au24Hg(SC4H9)18]0 and at 0.332 and 0.636 V vs. SCE for [Au24Cd(SC4H9)18]0. On the timescale of the voltammetry experiments, both reactions were reversible processes. The first peaks were observed on the more positive side for [Au24Hg(SC4H9)18]0 and [Au24Cd(SC4H9)18]0 compared with those for [Au25(SC4H9)18]− (
 and
and  vs. SCE). A similar trend was observed using the PET ligand instead of the SC4H9 ligand. The first reduction peaks (R1) were observed at −1.23 and −1.39 V vs. SCE for [Au24Hg(SC4H9)18]0 and [Au24Cd(SC4H9)18]0, respectively. These anion formation processes were chemically irreversible, in which case the potential can be detected reversibly by increasing the potential scanning rate. The H–L gap of [Au24Cd(SC4H9)18]0 was determined to be 1.41 eV, which was in good agreement with the H–L gap of 1.37 eV determined by optical absorption (Fig. 11B). Similarly, the H–L gap of [Au24Cd(PET)18]0 was determined to be 1.46 eV, which was in good agreement with the H–L gap of 1.41 eV determined by optical absorption (Fig. 11B). Furthermore, a decrease in the H–L gap was observed for Hg doping. The change of the H–L gap with Hg doping has also been reported by Yang, Wu and co-workers,113 but the H–L gap difference was not as large as the differences in the Pt- and Pd-doped six-electron systems.
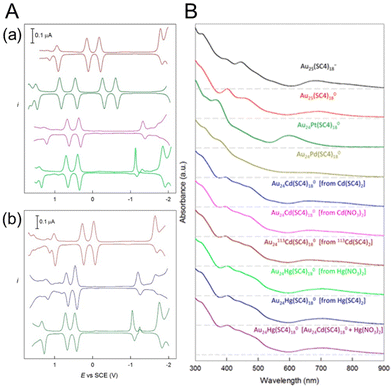 | ||
| Fig. 11 (A) Comparison of the DPV curves of (from top to bottom) (a) [Au25(SC4H9)18]−, [Au24Pt(SC4H9)18]0, [Au24Cd(SC4H9)18]0, and [Au24Hg(SC4H9)18]0 and (b) [Au25(PET)18]−, [Au24Cd(PET)18]0, and [Au24Hg(PET)18]0 (glassy-carbon electrode, CH2Cl2/0.1 M TBAH, 25 °C). (B) Ultraviolet–visible absorption spectra of all of the SC4H9-protected samples (0.2 mM, 1 mm cuvette) in CH2Cl2. For better comparison, the curves have been shifted vertically. The dashed lines indicate the corresponding zero absorbance. Reproduced with permission from ref. 112. Copyright 2019, American Chemical Society. | ||
In 2015, Lee and co-workers110 investigated the electronic structures of [Au24Pt(PET)18]0 and [Au24Pd(PET)18]0 (Fig. 12A). For [Au24Pd(PET)18]0, the open-circuit potential was in the middle of the two redox peaks (O1 and R1) at −0.48 V vs. Fc+1/0, indicating that it was neutral. Furthermore, the electrochemical gap between O1 and R1 was 0.75 V, giving a H–L gap of 0.32 V when the charge energy (O1–O2, 0.43 V) was considered. This was a dramatic decrease from the H–L gap of 1.32 eV for [Au25(PET)18]−. [Au24Pt(PET)18]0 showed a similar trend, with a H–L gap of 0.32 eV, indicating that [Au24Pt(PET)18]0 and [Au24Pd(PET)18]0 have very similar electronic states (Fig. 12A). To investigate the origin of the small H–L gap, DFT calculations were performed to simulate the energy levels of the six- and eight-electron systems (Fig. 12B). [Au25(SCH3)18]−, [Au24Pd(SCH3)18]2−, and [Au24Pt(SCH3)18]2− exhibit stable superatomic eight-electron systems (1S21P6), whereas the six-electron systems, including [Au24Pd(SCH3)18]0 and [Au24Pt(SCH3)18]0, have two electrons less than eight-electron systems. Therefore, they split from a triple degenerate HOMO into a doubly degenerate HOMO and LUMO, functioning as a superatomic 1P orbital (Fig. 12B). The H–L gap cannot be determined from the optical absorption spectrum because the dipole selection rule forbids optical HOMO–LUMO transitions. However, the H–L gaps of [Au24Pt(PET)18]0 and [Au24Pd(PET)18]0 can be revealed by SWV, because they are not forbidden electrochemically. Therefore, this electrochemical method is particularly useful for Aun(SR)m, where the HOMO–LUMO transition is optically forbidden. In addition, they reported the doping effects of Pt and Pd atoms for Au38(SR)24.114 The H–L gap of [Au36Pt2(SC6H13)24]2− measured by voltammetry was slightly larger than that of undoped [Au38(SC6H13)24]0, whereas the H–L gap of [Au36Pd2(SC6H13)24]0 was significantly smaller (0.26 V), resulting in the appearance of a near-infrared band at ∼0.8 eV.
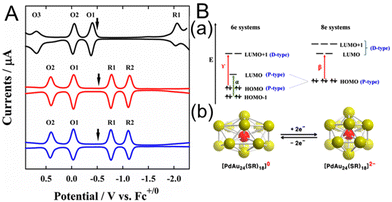 | ||
| Fig. 12 (A) Square-wave voltammograms of [Au25(SC6H13)18]− (black), [PdAu24(SC6H13)18]0 (red), and [PtAu24(SC6H13)18]0 (blue). The electrochemical measurements were performed in CH2Cl2 containing 0.1 M TBAPF6. The arrows indicate the solution open-circuit potentials. (B) (a) Electronic energy levels of the six-electron and eight-electron systems. α, β, and γ denote the optical transitions occurring in the six- and eight-electron systems. (b) Schematic showing Jahn–Teller-like distortion in the core (e.g., PdAu12) predicted for six-electron [PdAu24(SR)18]0 (left), which undergoes a structural change to nearly spherical eight-electron [PdAu24(SR)18]2− upon reduction (right). The vertical compression of [PdAu24(SR)18]0 (left) is exaggerated. Reproduced with permission from ref. 110. Copyright 2015, American Chemical Society. | ||
The change in the H–L gap has also been determined by electrochemical methods for doping with multiple different atoms. In 2020, Negishi and co-workers115 determined the H–L gaps of [Au24Pt(SR)18]0 and [Au24−xPtCux(PET)18]0 by DPV measurements (Fig. 13A). The H–L gap of the NC hardly changed by Cu substitution (Fig. 13A–C). The states of the HOMO and LUMO in [Au24Pt(SR)18]0 are caused by the dissolution of the degenerate electronic states owing to the symmetry lowering of the metal core (Fig. 13C, Jahn–Teller effect).39 It was presumed that substitution of Cu at the core surface Au did not significantly change the magnitude of the strain in the metal core, resulting in the H–L gap hardly changing. In 2020, Tsukuda and co-workers116 revealed the electronic structure of [Au23PtCd(PET)18]− by optical spectroscopy and electrochemical measurements (Fig. 14A and B). The first and second oxidation potentials (O1 and O2) of [Au23PtCd(PET)18]− were 0.110 and 0.175 V higher than those of [Au25(PET)18]−, respectively (Fig. 14B). This indicates that the 1P superatomic orbitals of Pt@CdAu11 in [Au23PtCd(PET)18]− are slightly more stable than those of Au@Au12 in [Au25(PET)18]−. The electrochemically determined H–L gap of [Au23PtCd(PET)18]− was 1.45 eV, which was in good agreement with the optically determined H–L gap (1.41 eV). This is significantly larger than the H–L gap (1.30 eV) of [Au25(PET)18]−. However, the H–L gap of [Au24Cd(PET)18]0 (1.29 eV) was almost the same as that of [Au25(PET)18]−. The H–L gap of the Pt@CdAu11 superatomic core is larger than that of Au@Au12, mainly because of Pt doping at the centre (Fig. 14C), which is in good agreement with the electronic structure changes observed by optical absorption spectroscopy and electrochemical measurements.
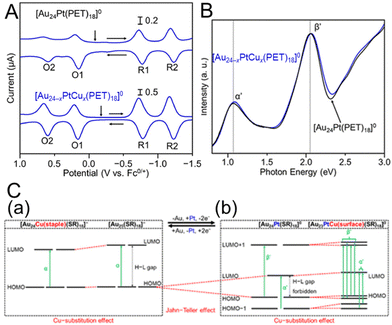 | ||
| Fig. 13 (A) DPV curves of [Au24Pt(PET)18]0 and [Au24−xPtCux(PET)18]0 (x = 0.9). The vertical arrows indicate the solution open-circuit potentials, and the horizontal arrows indicate the scan direction. (B) Optical absorption spectra of [Au24−xPtCux(PET)18]0 (x = 0.9) (blue) and [Au24Pt(PET)18]0 (black). (C) Schematic of the effect of Cu substitution on the electronic structure of (a) [Au25−xCux(SR)18]− and (b) [Au24−xPtCux(SR)18]0. Reproduced with permission from ref. 115. Copyright 2020, American Chemical Society. | ||
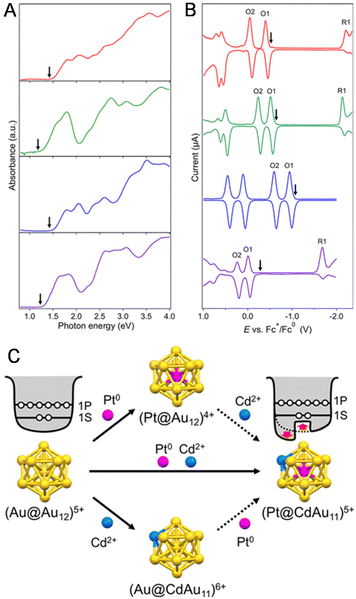 | ||
| Fig. 14 (A) Ultraviolet–visible–near-infrared spectra and (B) DPV curves of [Au23PtCd(PET)18]− (red), [Au25(PET)18]− (green), [Au24Pt(PET)18]0 (blue), and [Au24Cd(PET)18]0 (purple) in benzene and CH2Cl2, respectively. The downward arrows in panels (A) and (B) represent the corresponding optical H–L gaps and open-circuit potentials, respectively. (C) Schematic illustration of the jellium potentials of the (Au@Au12)5+ and (Pt@CdAu11)5+ superatoms. Reproduced with permission from ref. 116. Copyright 2020, American Chemical Society. | ||
The Ag replacing effect on the electronic structure of Aun(SR)m was also investigated by Dass and co-workers.90 using Au144−xAgx(PET)60 (x = 46). The electrochemical gap of Au144(PET)60 was approximately 0.37 V, while that of Au144−xAgx(PET)60 was approximately 0.38 V. A previous study of the band gap of Au144−xAgx(PET)60 using a combination of optical absorption spectroscopy and DFT calculations showed that the optical band gap is only moderately affected by Ag doping in this size range,117 which was consistent with previous reports.
In summary, previous studies indicate that doping the centre of Au25(SR)18 with Pt or Pd as a heteroatom has a significant effect on the electronic structure. It is expected that doping multiple elements can create an even greater variety of electronic states if the doping positions of the different elements can be controlled. The effects of doping with different elements have been found to be more pronounced for Aun(SR)m with smaller size.
3.6 Geometric structure effect on the electronic structure of thiolate-protected gold nanoclusters
Park and Lee101 compared the electronic states of Au25 NCs with two Au13 icosahedra connected via vertex sharing ([Au25(PPh3)10(SC6H13)5Cl2]2+) and one Au13 icosahedral core ([Au25(SC6H13)18]−) (Fig. 15). In this case, a series of [Au25(PPh3)10(SR)5Cl2]2+ NCs protected with SR (SR = SC6H13, PET, 11-hydroxy-1-undecanethiolate (MU), and 10-carboxy-1-decanethiolate (MUA)) was prepared. SWV measurements were performed with [Au25(SC6H13)18]− and [Au25(PPh3)10(SC6H13)5Cl2]2+ in 0.1 M TBAPF6/CH2Cl2 at −78 °C. The results showed that the open-circuit potential of the solution of [Au25(PPh3)10(SC6H13)5Cl2]2+ was approximately 0.37 V vs. 1,4-benzoquinone (BQ)−/0, and a series of oxidation peaks at 0.91 V (O1), 1.13 V (O2), 1.45 V (O3), and 1.62 V (O4) vs. BQ−/0 was observed, corresponding to oxidation of +3, +4, +5, and +6 for [Au25(PPh3)10(SC6H13)5Cl2]2+, respectively (Fig. 15B). From this voltammogram, the electrochemical energy gap was determined to be 1.54 V from the difference between the initial oxidation (O1) and reduction (R1) potentials (Fig. 15B). Compared with [Au25(SC6H13)18]−, the oxidation and reduction peaks (O1 and R1) of [Au25(PPh3)10(SC6H13)5Cl2]2+ were observed at significantly more positive potentials. The electrochemical energy gap of [Au25(PPh3)10(SC6H13)5Cl2]2+ (1.54 V) was smaller than that of [Au25(SC6H13)18]− (1.65 V), indicating that these NCs had clearly different electronic energy structures. The electrochemical energy gap of [Au25(PPh3)10(SC6H13)5Cl2]2+ was also smaller than that of the icosahedral Au13 NC assigned to Au13(PPh3)4(SC12H25)2Cl2 (1.76 V).69 Furthermore, the potential gap between O2 and O3 (0.32 V) was significantly smaller than the potential gap of [Au25(SC6H13)18]− (0.65 V). From the difference between the O2–O3 gap and O1–O2 gap, the charging energy of 0.10 eV was obtained. The electronic energy levels adjacent to the HOMO of [Au25(PPh3)10(SC6H13)5Cl2]2+ were revealed to be degenerate or close to each other owing to their high symmetry.118 Although there were differences in their charge states and some ligands, such as SRs, phosphines, and halogens, in the Au25 NCs with different geometries, the difference in their electronic structures was revealed. Furthermore, for such [Au25(PPh3)10(SR)5Cl2]2+ NCs, it has been reported that Pd doping decreases the H–L gap owing to splitting of the degenerate HOMO.119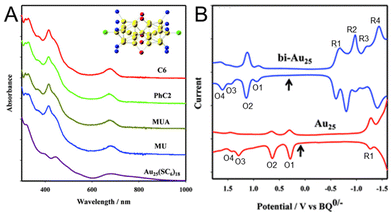 | ||
| Fig. 15 (A) Absorption spectra of [Au25(PPh3)10(SR)5Cl2]2+ (SR = SC6H13, PET, MUA, and MU) and Au25(SC6H13)18 in CH2Cl2. All of the spectra have been normalized to unity at 300 nm and offset for clarity. The insert shows the core structure of Au25(PPh3)10(SR)5Cl2. (B) Square-wave voltammograms of [Au25(PPh3)10(SC6H13)5Cl2]2+ (top) and [Au25(SC6H13)18]− (bottom) in 0.1 M TBAPF6 in degassed CH2Cl2 at −78 °C. The arrows indicate the solution open-circuit potentials. The open-circuit potential of Au25 indicates that the Au25 NC is an anionic form, [Au25(SC6H13)18]−. The concentration of [Au25(PPh3)10(SC6H13)5Cl2]2+ was 4 mg mL−1, and the tick interval on the current axis is 0.2 μA. Reproduced with permission from ref. 101. Copyright 2012, American Chemical Society. | ||
The effect of the Aun(SR)m core structure on the electrochemical gap was investigated by Wu and co-workers.120 The electronic structures of Au28(S-c-C6H11)20 (S-c-C6H11 = cyclohexanethiolate), Au28(TBBT)20, Au25(PET)18, Au44(DMBT)26 (DMBT = 2,4-dimethylbenzenethiolate), Au44(TBBT)28, Au49(DMBT)27, Au38(PET)24, and Au36(TBBT)24 were investigated. The results showed that the Aun(SR)m NC with a kernel of the fcc structure has a larger electrochemical gap than the Aun(SR)m NC with a kernel of the non-fcc structure.
4 Conclusions and outlook
Electrochemical techniques can be used to determine the H–L gaps of metal NCs, and the electronic structures of various Aun(SR)m have been elucidated by electrochemical measurements, as well as by optical absorption spectroscopy and DFT calculations. Bulk Au does not have a band gap, but a molecule-like H–L gap forms in small Aun(SR)m NCs, and the H–L gap tends to increase with decreasing size. Au25(SR)18 is currently the most studied Aun(SR)m NC. In Au25(SR)18, molecular changes of R in the SR ligand do not significantly change the H–L gap, but the electronic state greatly changes when S is a different atom or group (e.g., Se, Te, and C![[triple bond, length as m-dash]](https://www.rsc.org/images/entities/char_e002.gif) CR). Substitution of different elements for Au (i.e., alloying) also changes the H–L gap. In particular, substitution of Pt or Pd for Au in Au25(SR)18 significantly reduces the H–L gap owing to dissolution of the degeneracy of the electronic states. Furthermore, in Aun(SR)m, where the HOMO–LUMO transition is optically forbidden, the H–L gaps, which cannot be calculated from the optical spectra, can be determined by electrochemical methods.
CR). Substitution of different elements for Au (i.e., alloying) also changes the H–L gap. In particular, substitution of Pt or Pd for Au in Au25(SR)18 significantly reduces the H–L gap owing to dissolution of the degeneracy of the electronic states. Furthermore, in Aun(SR)m, where the HOMO–LUMO transition is optically forbidden, the H–L gaps, which cannot be calculated from the optical spectra, can be determined by electrochemical methods.
These electrochemical methods have also been applied to Au NCs protected by phosphine121–128 and stibine,129 and to NCs based on Ag,130–133 Cu,134 and group 10 elements.135–139 In the future, these electrochemical techniques are expected to reveal the electronic states of metal NCs protected by other ligands and composed of other metals.140–144
The electrochemical gap also varies depending on the ligand, solvent, electrolyte, measurement mode, temperature, and other factors. This is also the same when determining the H–L gaps from optical absorption spectra, and care should be taken when comparing the H–L gap values obtained in different studies. More accurate H–L gap calculations are required through the development of models that more accurately take the charging energy into account and a unified measurement method.61,145,146
The electronic structures of Aun(SR)m NCs in solution have already been extensively studied. However, it is desirable to clarify the electronic states of Aun(SR)m NCs on catalyst supports when considering their use in catalytic reactions in the gas or solid phase.135,147–151 In this case, it is expected that the electronic/geometric state of Aun(SR)m NCs will also significantly change during catalytic reaction. For instance, ligands have also been reported to desorb from Aun(SR)m NCs upon applying potential152 and the catalytic properties to be depends on the electronic state of Aun(SR)m NCs.153 It is expected that techniques such as pulse voltammetry can be used to elucidate the mechanism of such electrochemical catalytic reactions. If the electronic states of Aun(SR)m NCs during catalytic reaction could be investigated, it would be possible to clarify the details of the catalytic reaction mechanisms predicted by theoretical calculations.154 It is expected that the electronic states of various Aun(SR)m NCs will be clarified by electrochemical methods and these measurement techniques will be further developed in the future.
Conflicts of interest
There are no conflicts to declare.Acknowledgements
This work was supported by the Japan Society for the Promotion of Science (JSPS) KAKENHI (grant numbers 20H02698 and 20H02552), Scientific Research on Innovative Areas “Innovations for Light-Energy Conversion” (grant numbers 18H05178 and 20H05115), Scientific Research on Innovative Areas “Hydrogenomics” (grant number 21H00027), and the Joint Usage/Research Center for Catalysis (proposal numbers 22AY0056 and 23AY0189). Funding from the Takahashi Industrial and Economic Research Foundation, the Yazaki Memorial Foundation for Science and Technology, the Ogasawara Foundation for the Promotion of Science and Engineering, the Kao Foundation for Arts and Sciences, a Sasakawa Scientific research grant from the Japan Science Society, a TEPCO Memorial Foundation research grant (Basic Research), Advanced Technology Institute research grants 2022, and the Kumagai Foundation for Science and Technology are gratefully acknowledged.References
- R. Jin, C. Zeng, M. Zhou and Y. Chen, Chem. Rev., 2016, 116, 10346 CrossRef CAS PubMed.
- I. Chakraborty and T. Pradeep, Chem. Rev., 2017, 117, 8208 CrossRef CAS PubMed.
- R. R. Nasaruddin, T. Chen, N. Yan and J. Xie, Coord. Chem. Rev., 2018, 368, 60 CrossRef CAS.
- Y. Du, H. Sheng, D. Astruc and M. Zhu, Chem. Rev., 2020, 120, 526 CrossRef CAS PubMed.
- K. Yamamoto, T. Imaoka, M. Tanabe and T. Kambe, Chem. Rev., 2020, 120, 1397 CrossRef CAS PubMed.
- S. Hossain, D. Hirayama, A. Ikeda, M. Ishimi, S. Funaki, A. Samanta, T. Kawawaki and Y. Negishi, Aggregate, 2023, 4, e255 CrossRef CAS.
- B. Yin and Z. Luo, Coord. Chem. Rev., 2021, 429, 213643 CrossRef CAS.
- T. Kawawaki, Y. Imai, D. Suzuki, S. Kato, I. Kobayashi, T. Suzuki, R. Kaneko, S. Hossain and Y. Negishi, Chem. – Eur. J., 2020, 26, 16150 CrossRef CAS PubMed.
- X. Kang, Y. Li, M. Zhu and R. Jin, Chem. Soc. Rev., 2020, 49, 6443 RSC.
- R. Jin, G. Li, S. Sharma, Y. Li and X. Du, Chem. Rev., 2021, 121, 567 CrossRef CAS PubMed.
- C. Dong, Y. Li, D. Cheng, M. Zhang, J. Liu, Y.-G. Wang, D. Xiao and D. Ma, ACS Catal., 2020, 10, 11011 CrossRef CAS.
- T. Kawawaki, A. Ebina, Y. Hosokawa, S. Ozaki, D. Suzuki, S. Hossain and Y. Negishi, Small, 2021, 17, 2005328 CrossRef CAS PubMed.
- S. Maity, D. Bain and A. Patra, Nanoscale, 2019, 11, 22685 RSC.
- Z. Liu, Z. Wu, Q. Yao, Y. Cao, O. J. H. Chai and J. Xie, Nano Today, 2021, 36, 101053 CrossRef CAS.
- H. Cui, Z.-S. Shao, Z. Song, Y.-B. Wang and H.-S. Wang, J. Mater. Chem. C, 2020, 8, 14312 RSC.
- X. Dou, X. Chen, H. Zhu, Y. Liu, D. Chen, X. Yuan, Q. Yao and J. Xie, Dalton Trans., 2019, 48, 10385 RSC.
- A. S. K. Kumar and W.-L. Tseng, Anal. Methods, 2020, 12, 1809 RSC.
- S. Antonello and F. Maran, Curr. Opin. Electrochem., 2017, 2, 18 CrossRef CAS.
- R. W. Murray, Chem. Rev., 2008, 108, 2688 CrossRef CAS PubMed.
- K. Kwak and D. Lee, Acc. Chem. Res., 2019, 52, 12 CrossRef CAS PubMed.
- Q. Zhu, X. Huang, Y. Zeng, K. Sun, L. Zhou, Y. Liu, L. Luo, S. Tian and X. Sun, Nanoscale Adv., 2021, 3, 6330 RSC.
- L. Qin, G. Ma, L. Wang and Z. Tang, J. Energy Chem., 2021, 57, 359 CrossRef CAS.
- Y. Sun, X. Cai, W. Hu, X. Liu and Y. Zhu, Sci. China: Chem., 2021, 64, 1065 CrossRef CAS.
- X. Cai, G. Li, W. Hu and Y. Zhu, ACS Catal., 2022, 12, 10638 CrossRef CAS.
- X. Kang and M. Zhu, Chem. Mater., 2021, 33, 39 CrossRef CAS.
- Y. Wang and T. Bürgi, Nanoscale Adv., 2021, 3, 2710 RSC.
- W. Kurashige, Y. Niihori, S. Sharma and Y. Negishi, Coord. Chem. Rev., 2016, 320–321, 238 CrossRef CAS.
- C. Cesari, J.-H. Shon, S. Zacchini and L. A. Berben, Chem. Soc. Rev., 2021, 50, 9503 RSC.
- V. G. Albano, P. L. Bellon, M. Manassero and M. Sansoni, J. Chem. Soc. D, 1970, 1210 RSC.
- G. Schmid, R. Pfeil, R. Boese, F. Bandermann, S. Meyer, G. H. M. Calis and J. W. A. van der Velden, Chem. Ber., 1981, 114, 3634 CrossRef CAS.
- P. Chini, J. Organomet. Chem., 1980, 200, 37 CrossRef CAS.
- M. Paolieri, I. Ciabatti and M. Fontani, J. Cluster Sci., 2019, 30, 1623 CrossRef CAS.
- Y. Negishi, K. Nobusada and T. Tsukuda, J. Am. Chem. Soc., 2005, 127, 5261 CrossRef CAS PubMed.
- M. Brust, M. Walker, D. Bethell, D. J. Schiffrin and R. Whyman, J. Chem. Soc., Chem. Commun., 1994, 801 RSC.
- Y. Negishi, H. Horihata, A. Ebina, S. Miyajima, M. Nakamoto, A. Ikeda, T. Kawawaki and S. Hossain, Chem. Sci., 2022, 13, 5546 RSC.
- Y. Negishi, Phys. Chem. Chem. Phys., 2022, 24, 7569 RSC.
- B. Zhang, J. Chen, Y. Cao, O. J. H. Chai and J. Xie, Small, 2021, 17, 2004381 CrossRef CAS PubMed.
- R. H. Adnan, J. M. L. Madridejos, A. S. Alotabi, G. F. Metha and G. G. Andersson, Adv. Sci., 2022, 9, 2105692 CrossRef CAS PubMed.
- P. D. Jadzinsky, G. Calero, C. J. Ackerson, D. A. Bushnell and R. D. Kornberg, Science, 2007, 318, 430 CrossRef CAS PubMed.
- X. Kang and M. Zhu, Chem. Soc. Rev., 2019, 48, 2422 RSC.
- H. Yu, B. Rao, W. Jiang, S. Yang and M. Zhu, Coord. Chem. Rev., 2019, 378, 595 CrossRef CAS.
- M.-M. Zhang, K. Li and S.-Q. Zang, Adv. Opt. Mater., 2020, 8, 1902152 CrossRef CAS.
- Y. Zhang, C. Zhang, C. Xu, X. Wang, C. Liu, G. I. N. Waterhouse, Y. Wang and H. Yin, Talanta, 2019, 200, 432 CrossRef CAS PubMed.
- Y.-S. Chen, H. Choi and P. V. Kamat, J. Am. Chem. Soc., 2013, 135, 8822 CrossRef CAS PubMed.
- N. Sakai and T. Tatsuma, Adv. Mater., 2010, 22, 3185 CrossRef CAS PubMed.
- M. A. Abbas, R. Thota, K. Pyo, D. Lee and J. H. Bang, ACS Energy Lett., 2020, 5, 1404 CrossRef CAS.
- T. Higaki, Y. Li, S. Zhao, Q. Li, S. Li, X.-S. Du, S. Yang, J. Chai and R. Jin, Angew. Chem., Int. Ed., 2019, 58, 8291 CrossRef CAS PubMed.
- J. Fang, B. Zhang, Q. Yao, Y. Yang, J. Xie and N. Yan, Coord. Chem. Rev., 2016, 322, 1 CrossRef CAS.
- T. Kawawaki, Y. Kataoka, M. Hirata, Y. Iwamatsu, S. Hossain and Y. Negishi, Nanoscale Horiz., 2021, 6, 409 RSC.
- B. Kumar, T. Kawawaki, N. Shimizu, Y. Imai, D. Suzuki, S. Hossain, L. V. Nair and Y. Negishi, Nanoscale, 2020, 12, 9969 RSC.
- Y. Negishi, S. Hashimoto, A. Ebina, K. Hamada, S. Hossain and T. Kawawaki, Nanoscale, 2020, 12, 8017 RSC.
- T. Kawawaki and Y. Negishi, Nanomaterials, 2020, 10, 238 CrossRef CAS PubMed.
- T. Kawawaki, Y. Negishi and H. Kawasaki, Nanoscale Adv., 2020, 2, 17 RSC.
- T. Kawawaki, Y. Kataoka, S. Ozaki, M. Kawachi, M. Hirata and Y. Negishi, Chem. Commun., 2021, 57, 417 RSC.
- T. Kawawaki, Y. Mori, K. Wakamatsu, S. Ozaki, M. Kawachi, S. Hossain and Y. Negishi, J. Mater. Chem. A, 2020, 8, 16081 RSC.
- T. Ung, M. Giersig, D. Dunstan and P. Mulvaney, Langmuir, 1997, 13, 1773 CrossRef CAS.
- R. S. Ingram, M. J. Hostetler, R. W. Murray, T. G. Schaaff, J. T. Khoury, R. L. Whetten, T. P. Bigioni, D. K. Guthrie and P. N. First, J. Am. Chem. Soc., 1997, 119, 9279 CrossRef CAS.
- E. Hartmann, P. Marquardt, J. Ditterich, P. Radojkovic and H. Steinberger, Appl. Surf. Sci., 1996, 107, 197 CrossRef CAS.
- S. Chen, R. S. Ingram, M. J. Hostetler, J. J. Pietron, R. W. Murray, T. G. Schaaff, J. T. Khoury, M. M. Alvarez and R. L. Whetten, Science, 1998, 280, 2098 CrossRef CAS PubMed.
- J. F. Hicks, A. C. Templeton, S. Chen, K. M. Sheran, R. Jasti, R. W. Murray, J. Debord, T. G. Schaaff and R. L. Whetten, Anal. Chem., 1999, 71, 3703 CrossRef CAS PubMed.
- B. Su, M. Zhang, Y. Shao and H. H. Girault, J. Phys. Chem. B, 2006, 110, 21460 CrossRef CAS PubMed.
- S. Chen and R. W. Murray, J. Phys. Chem. B, 1999, 103, 9996 CrossRef CAS.
- M. J. Weaver and X. Gao, J. Phys. Chem., 1993, 97, 332 CrossRef CAS.
- S. Chen, R. W. Murray and S. W. Feldberg, J. Phys. Chem. B, 1998, 102, 9898 CrossRef CAS.
- D. Lee, R. L. Donkers, J. M. DeSimone and R. W. Murray, J. Am. Chem. Soc., 2003, 125, 1182 CrossRef CAS PubMed.
- Y. Yang and S. Chen, Nano Lett., 2003, 3, 75 CrossRef CAS.
- J. F. Hicks, D. T. Miles and R. W. Murray, J. Am. Chem. Soc., 2002, 124, 13322 CrossRef CAS PubMed.
- B. M. Quinn, P. Liljeroth, V. Ruiz, T. Laaksonen and K. Kontturi, J. Am. Chem. Soc., 2003, 125, 6644 CrossRef CAS PubMed.
- L. D. Menard, S.-P. Gao, H. Xu, R. D. Twesten, A. S. Harper, Y. Song, G. Wang, A. D. Douglas, J. C. Yang, A. I. Frenkel, R. G. Nuzzo and R. W. Murray, J. Phys. Chem. B, 2006, 110, 12874 CrossRef CAS PubMed.
- R. Balasubramanian, R. Guo, A. J. Mills and R. W. Murray, J. Am. Chem. Soc., 2005, 127, 8126 CrossRef CAS PubMed.
- T. Omoda, S. Takano and T. Tsukuda, Small, 2021, 17, 2001439 CrossRef CAS PubMed.
- S. Jin, S. Wang and M. Zhu, Chem. – Asian J., 2019, 14, 3222 CrossRef CAS PubMed.
- R. L. Donkers, D. Lee and R. W. Murray, Langmuir, 2008, 24, 5976 CrossRef CAS.
- D. Lee, R. L. Donkers, G. Wang, A. S. Harper and R. W. Murray, J. Am. Chem. Soc., 2004, 126, 6193 CrossRef CAS PubMed.
- J. Xiang, P. Li, Y. Song, X. Liu, H. Chong, S. Jin, Y. Pei, X. Yuan and M. Zhu, Nanoscale, 2015, 7, 18278 RSC.
- S. Antonello, A. H. Holm, E. Instuli and F. Maran, J. Am. Chem. Soc., 2007, 129, 9836 CrossRef CAS PubMed.
- M. Hesari, M. S. Workentin and Z. Ding, Chem. Sci., 2014, 5, 3814 RSC.
- K. Kwak, W. Choi, Q. Tang, M. Kim, Y. Lee, D.-E. Jiang and D. Lee, Nat. Commun., 2017, 8, 14723 CrossRef PubMed.
- M. Hesari, M. S. Workentin and Z. Ding, Chem. – Eur. J., 2014, 20, 15116 CrossRef CAS PubMed.
- K. N. Swanick, M. Hesari, M. S. Workentin and Z. Ding, J. Am. Chem. Soc., 2012, 134, 15205 CrossRef CAS PubMed.
- P. R. Nimmala, S. Knoppe, V. R. Jupally, J. H. Delcamp, C. M. Aikens and A. Dass, J. Phys. Chem. B, 2014, 118, 14157 CrossRef CAS PubMed.
- R. Jin, C. Liu, S. Zhao, A. Das, H. Xing, C. Gayathri, Y. Xing, N. L. Rosi, R. R. Gil and R. Jin, ACS Nano, 2015, 9, 8530 CrossRef CAS PubMed.
- H. Qian, Y. Zhu and R. Jin, ACS Nano, 2009, 3, 3795 CrossRef CAS PubMed.
- P. R. Nimmala, B. Yoon, R. L. Whetten, U. Landman and A. Dass, J. Phys. Chem. A, 2013, 117, 504 CrossRef CAS PubMed.
- V. R. Jupally, J. G. Thrasher and A. Dass, Analyst, 2014, 139, 1826 RSC.
- D. Wang, J. W. Padelford, T. Ahuja and G. Wang, ACS Nano, 2015, 9, 8344 CrossRef CAS PubMed.
- P. R. Nimmala, S. Theivendran, G. Barcaro, L. Sementa, C. Kumara, V. R. Jupally, E. Apra, M. Stener, A. Fortunelli and A. Dass, J. Phys. Chem. Lett., 2015, 6, 2134 CrossRef CAS PubMed.
- K. Kwak, V. D. Thanthirige, K. Pyo, D. Lee and G. Ramakrishna, J. Phys. Chem. Lett., 2017, 8, 4898 CrossRef CAS PubMed.
- W. Choi, G. Hu, K. Kwak, M. Kim, D.-E. Jiang, J.-P. Choi and D. Lee, ACS Appl. Mater. Interfaces, 2018, 10, 44645 CrossRef CAS PubMed.
- A. Dass, N. A. Sakthivel, V. R. Jupally, C. Kumara and M. Rambukwella, ACS Energy Lett., 2020, 5, 207 CrossRef CAS.
- M. Zhou, C. Zeng, Y. Song, J. W. Padelford, G. Wang, M. Y. Sfeir, T. Higaki and R. Jin, Angew. Chem., Int. Ed., 2017, 56, 16257 CrossRef CAS PubMed.
- C. Zeng, Y. Chen, K. Kirschbaum, K. J. Lambright and R. Jin, Science, 2016, 354, 1580 CrossRef CAS PubMed.
- T. Higaki, M. Zhou, K. J. Lambright, K. Kirschbaum, M. Y. Sfeir and R. Jin, J. Am. Chem. Soc., 2018, 140, 5691 CrossRef CAS PubMed.
- N. A. Sakthivel, S. Theivendran, V. Ganeshraj, A. G. Oliver and A. Dass, J. Am. Chem. Soc., 2017, 139, 15450 CrossRef CAS PubMed.
- R. Jin and T. Higaki, Commun. Chem., 2021, 4, 28 CrossRef CAS PubMed.
- M. Zhou, X. Du, H. Wang and R. Jin, ACS Nano, 2021, 15, 13980 CrossRef CAS PubMed.
- S. Chen, T. Higaki, H. Ma, M. Zhu, R. Jin and G. Wang, ACS Nano, 2020, 14, 16781 CrossRef CAS PubMed.
- J. Kim, K. Lema, M. Ukaigwe and D. Lee, Langmuir, 2007, 23, 7853 CrossRef CAS PubMed.
- S. Antonello, T. Dainese, M. De Nardi, L. Perotti and F. Maran, ChemElectroChem, 2016, 3, 1237 CrossRef CAS.
- S. Hossain, Y. Imai, D. Suzuki, W. Choi, Z. Chen, T. Suzuki, M. Yoshioka, T. Kawawaki, D. Lee and Y. Negishi, Nanoscale, 2019, 11, 22089 RSC.
- S. Park and D. Lee, Langmuir, 2012, 28, 7049 CrossRef CAS PubMed.
- S. Hossain, W. Kurashige, S. Wakayama, B. Kumar, L. V. Nair, Y. Niihori and Y. Negishi, J. Phys. Chem. C, 2016, 120, 25861 CrossRef CAS.
- Y. Song, J. Zhong, S. Yang, S. Wang, T. Cao, J. Zhang, P. Li, D. Hu, Y. Pei and M. Zhu, Nanoscale, 2014, 6, 13977 RSC.
- S. Takano, S. Ito and T. Tsukuda, J. Am. Chem. Soc., 2019, 141, 15994 CrossRef CAS PubMed.
- T. Higaki, C. Liu, M. Zhou, T.-Y. Luo, N. L. Rosi and R. Jin, J. Am. Chem. Soc., 2017, 139, 9994 CrossRef CAS PubMed.
- M. Rambukwella, L. Sementa, G. Barcaro, A. Fortunelli and A. Dass, J. Phys. Chem. C, 2015, 119, 25077 CrossRef CAS.
- P. S. Window and C. J. Ackerson, Inorg. Chem., 2020, 59, 3509 CrossRef CAS PubMed.
- K. Kwak and D. Lee, J. Phys. Chem. Lett., 2012, 3, 2476 CrossRef CAS PubMed.
- M. Suyama, S. Takano, T. Nakamura and T. Tsukuda, J. Am. Chem. Soc., 2019, 141, 14048 CrossRef CAS PubMed.
- K. Kwak, Q. Tang, M. Kim, D.-E. Jiang and D. Lee, J. Am. Chem. Soc., 2015, 137, 10833 CrossRef CAS PubMed.
- Y. Negishi, K. Munakata, W. Ohgake and K. Nobusada, J. Phys. Chem. Lett., 2012, 3, 2209 CrossRef CAS PubMed.
- W. Fei, S. Antonello, T. Dainese, A. Dolmella, M. Lahtinen, K. Rissanen, A. Venzo and F. Maran, J. Am. Chem. Soc., 2019, 141, 16033 CrossRef CAS PubMed.
- L. Liao, S. Zhou, Y. Dai, L. Liu, C. Yao, C. Fu, J. Yang and Z. Wu, J. Am. Chem. Soc., 2015, 137, 9511 CrossRef CAS PubMed.
- M. Kim, Q. Tang, A. V. Narendra Kumar, K. Kwak, W. Choi, D.-E. Jiang and D. Lee, J. Phys. Chem. Lett., 2018, 9, 982 CrossRef CAS PubMed.
- S. Hossain, D. Suzuki, T. Iwasa, R. Kaneko, T. Suzuki, S. Miyajima, Y. Iwamatsu, S. Pollitt, T. Kawawaki, N. Barrabés, G. Rupprechter and Y. Negishi, J. Phys. Chem. C, 2020, 124, 22304 CrossRef CAS.
- M. Suyama, S. Takano and T. Tsukuda, J. Phys. Chem. C, 2020, 124, 23923 CrossRef CAS.
- J. Koivisto, S. Malola, C. Kumara, A. Dass, H. Häkkinen and M. Pettersson, J. Phys. Chem. Lett., 2012, 3, 3076 CrossRef CAS PubMed.
- K. Nobusada and T. Iwasa, J. Phys. Chem. C, 2007, 111, 14279 CrossRef CAS.
- L. V. Nair, S. Hossain, S. Takagi, Y. Imai, G. Hu, S. Wakayama, B. Kumar, W. Kurashige, D.-E. Jiang and Y. Negishi, Nanoscale, 2018, 10, 18969 RSC.
- L. Liao, S. Zhuang, P. Wang, Y. Xu, N. Yan, H. Dong, C. Wang, Y. Zhao, N. Xia, J. Li, H. Deng, Y. Pei, S.-K. Tian and Z. Wu, Angew. Chem., Int. Ed., 2017, 56, 12644 CrossRef CAS PubMed.
- Y. Song, F. Fu, J. Zhang, J. Chai, X. Kang, P. Li, S. Li, H. Zhou and M. Zhu, Angew. Chem., Int. Ed., 2015, 54, 8430 CrossRef CAS PubMed.
- X. Yan, S. Su, X. Li, S. Jin and M. Zhu, Dalton Trans., 2023, 52, 4251 RSC.
- H. Deng, Y. Bai, M. Zhou, Y. Bao, S. Jin, X. Li, H. Yu and M. Zhu, J. Phys. Chem. C, 2020, 124, 21867 CrossRef CAS.
- H. Hirai, S. Takano, T. Nakamura and T. Tsukuda, Inorg. Chem., 2020, 59, 17889 CrossRef CAS PubMed.
- M. Kim, K. L. D. M. Weerawardene, W. Choi, S. M. Han, J. Paik, Y. Kim, M.-G. Choi, C. M. Aikens and D. Lee, Chem. Mater., 2020, 32, 10216 CrossRef CAS.
- S.-S. Zhang, L. Feng, R. D. Senanayake, C. M. Aikens, X.-P. Wang, Q.-Q. Zhao, C.-H. Tung and D. Sun, Chem. Sci., 2018, 9, 1251 RSC.
- Z. Qin, D. Zhao, L. Zhao, Q. Xiao, T. Wu, J. Zhang, C. Wan and G. Li, Nanoscale Adv., 2019, 1, 2529 RSC.
- J. Yan, S. Malola, C. Hu, J. Peng, B. Dittrich, B. K. Teo, H. Häkkinen, L. Zheng and N. Zheng, Nat. Commun., 2018, 9, 3357 CrossRef PubMed.
- Y.-Z. Li, R. Ganguly, K. Y. Hong, Y. Li, M. E. Tessensohn, R. Webster and W. K. Leong, Chem. Sci., 2018, 9, 8723 RSC.
- X. Kang, S. Chen, S. Jin, Y. Song, Y. Xu, H. Yu, H. Sheng and M. Zhu, ChemElectroChem, 2016, 3, 1261 CrossRef CAS.
- S. Jin, M. Zhou, X. Kang, X. Li, W. Du, X. Wei, S. Chen, S. Wang and M. Zhu, Angew. Chem., Int. Ed., 2020, 59, 3891 CrossRef CAS PubMed.
- W.-J. Zhang, Z. Liu, K.-P. Song, C. M. Aikens, S.-S. Zhang, Z. Wang, C.-H. Tung and D. Sun, Angew. Chem., Int. Ed., 2021, 60, 4231 CrossRef CAS PubMed.
- W. Du, S. Jin, L. Xiong, M. Chen, J. Zhang, X. Zou, Y. Pei, S. Wang and M. Zhu, J. Am. Chem. Soc., 2017, 139, 1618 CrossRef CAS PubMed.
- Q. Li, J. Chai, S. Yang, Y. Song, T. Chen, C. Chen, H. Zhang, H. Yu and M. Zhu, Small, 2021, 17, 1907114 CrossRef CAS PubMed.
- L. V. Nair, S. Hossain, S. Wakayama, S. Takagi, M. Yoshioka, J. Maekawa, A. Harasawa, B. Kumar, Y. Niihori, W. Kurashige and Y. Negishi, J. Phys. Chem. C, 2017, 121, 11002 CrossRef CAS.
- C. Cesari, B. Berti, T. Funaioli, C. Femoni, M. C. Iapalucci, D. Pontiroli, G. Magnani, M. Riccò, M. Bortoluzzi, F. M. Vivaldi and S. Zacchini, Inorg. Chem., 2022, 61, 12534 CrossRef CAS PubMed.
- C. Cesari, T. Funaioli, B. Berti, C. Femoni, M. C. Iapalucci, F. M. Vivaldi and S. Zacchini, Inorg. Chem., 2021, 60, 16713 CrossRef CAS PubMed.
- I. Ciabatti, C. Femoni, M. C. Iapalucci, G. Longoni, S. Zacchini, S. Fedi and F. Fabrizi de Biani, Inorg. Chem., 2012, 51, 11753 CrossRef CAS PubMed.
- E. Cattabriga, I. Ciabatti, C. Femoni, T. Funaioli, M. C. Iapalucci and S. Zacchini, Inorg. Chem., 2016, 55, 6068 CrossRef CAS PubMed.
- T. Kawawaki, N. Shimizu, K. Funai, Y. Mitomi, S. Hossain, S. Kikkawa, D. J. Osborn, S. Yamazoe, G. F. Metha and Y. Negishi, Nanoscale, 2021, 13, 14679 RSC.
- S. Hossain, S. Miyajima, T. Iwasa, R. Kaneko, T. Sekine, A. Ikeda, T. Kawawaki, T. Taketsugu and Y. Negishi, J. Chem. Phys., 2021, 155, 024302 CrossRef CAS PubMed.
- W. Kurashige, Y. Mori, S. Ozaki, M. Kawachi, S. Hossain, T. Kawawaki, C. J. Shearer, A. Iwase, G. F. Metha, S. Yamazoe, A. Kudo and Y. Negishi, Angew. Chem., Int. Ed., 2020, 59, 7076 CrossRef CAS PubMed.
- S. Funaki, T. Kawawaki, T. Okada, K. Takemae, S. Hossain, Y. Niihori, T. Naito, M. Takagi, T. Shimazaki, S. Kikkawa, S. Yamazoe, M. Tachikawa and Y. Negishi, Nanoscale, 2023, 15, 5201 RSC.
- S. Miyajima, S. Hossain, A. Ikeda, T. Kosaka, T. Kawawaki, Y. Niihori, T. Iwasa, T. Taketsugu and Y. Negishi, Commun. Chem., 2023, 6, 57 CrossRef CAS PubMed.
- D. García-Raya, R. Madueño, M. Blázquez and T. Pineda, J. Phys. Chem. C, 2009, 113, 8756 CrossRef.
- V. Garcia-Morales and S. Mafé, J. Phys. Chem. C, 2007, 111, 7242 CrossRef CAS.
- T. Kawawaki, N. Shimizu, Y. Mitomi, D. Yazaki, S. Hossain and Y. Negishi, Bull. Chem. Soc. Jpn., 2021, 94, 2853 CrossRef CAS.
- T. Kawawaki, Y. Mitomi, N. Nishi, R. Kurosaki, K. Oiwa, T. Tanaka, H. Hirase, S. Miyajima, Y. Niihori, D. J. Osborn, T. Koitaya, G. F. Metha, T. Yokoyama, K. Iida and Y. Negishi, Nanoscale, 2023, 15, 7272 RSC.
- D. Yazaki, T. Kawawaki, D. Hirayama, M. Kawachi, K. Kato, S. Oguchi, Y. Yamaguchi, S. Kikkawa, Y. Ueki, S. Hossain, D. J. Osborn, F. Ozaki, S. Tanaka, J. Yoshinobu, G. F. Metha, S. Yamazoe, A. Kudo, A. Yamakata and Y. Negishi, Small, 2023, 19, 2208287 CrossRef CAS PubMed.
- D. Yazaki, T. Kawawaki, T. Tanaka, D. Hirayama, Y. Shingyouchi and Y. Negishi, Energy Adv., 2023, 2, 1148 RSC.
- K. Koyasu and T. Tsukuda, J. Chem. Phys., 2021, 154, 140901 CrossRef CAS PubMed.
- S. Chen, M. Li, S. Yu, S. Louisia, W. Chuang, M. Gao, C. Chen, J. Jin, M. B. Salmeron and P. Yang, J. Chem. Phys., 2021, 155, 051101 CrossRef CAS PubMed.
- Y. Lu, Y. Jiang, X. Gao and W. Chen, Chem. Commun., 2014, 50, 8464 RSC.
- O. López-Estrada, N. Mammen, L. Laverdure, M. M. Melander, H. Häkkinen and K. Honkala, ACS Catal., 2023, 13, 8997 CrossRef.
| This journal is © The Royal Society of Chemistry 2023 |


