Linking microscopic structural changes and macroscopic mechanical responses in a near-ideal bottlebrush elastomer under uniaxial deformation†
Shintaro
Nakagawa
 * and
Naoko
Yoshie
 *
*
Institute of Industrial Science, the University of Tokyo, Komaba 4-6-1, Meguro-ku, Tokyo 153-8505, Japan. E-mail: snaka@iis.u-tokyo.ac.jp; yoshie@iis.u-tokyo.ac.jp
First published on 1st June 2022
Abstract
Bottlebrush (BB) elastomers, in which load-bearing network strands are densely grafted with side chains, are gaining much attention due to their unique mechanical properties. Herein, we used in situ small-angle X-ray scattering coupled with tensile tests to investigate the microscopic structural changes induced in a model BB elastomer with a controlled network structure under uniaxial deformation. The model BB elastomer was synthesized by end-linking a monodisperse star-shaped BB polymer, which ensured a controlled network structure. The BB elastomer exhibited both significant strain stiffening and backbone chain alignment under uniaxial loading, and these properties were not observed in an analogous side chain-free elastomer and gel. It was also found that the side chains in the BB elastomer did not show any sign of chain orientation even when the attached backbone chain was aligned in the stretching direction. These observations highlighted the roles of side chains: they were structurally disordered at the segment level but their steric repulsion made the backbone chain aligned and overstretched.
Introduction
Bottlebrush (BB) polymers, which consist of a linear backbone chain densely grafted with side chains, are a fascinating class of branched polymers owing to their unique properties.1 Steric repulsions among side chains increase the persistence length of the backbone chain, i.e., increase the apparent stiffness of the molecule. This also leads to an extremely high entanglement molecular weight, i.e., a low tendency to entangle. Such features of BB polymers have stimulated researchers to develop various functional materials, including ultrasoft elastomers2,3 exhibiting mechanochromism4 or reprocessability,5 nanoporous materials,6 polymer ink with tunable structural color,7 and quick-setting hydrogels.8 In particular, elastomers and gels formed by cross-linking of BB polymers have been studied extensively because the unique chain architecture directly influences mechanical properties. The seminal work by Vatankhah–Varnosfaderani3 showed that the use of BB polymers as components of network polymers enabled soft and strain-stiffening mechanical responses similar to biological tissues, which were inaccessible for conventional gels and elastomers.Despite the interesting properties and relevance in various applications, little is known about the structures of BB polymer networks under mechanical loading. Clair and coworkers studied the chain conformations in an ABA triblock copolymer-type BB elastomer.9 The middle B block, which was a BB polymer, bridged between the glassy spherical nanodomains of the A blocks. The authors used in situ small-angle X-ray scattering (SAXS) to examine the structural changes occurring upon stretching of the elastomer and noted briefly that the peak due to backbone-to-backbone correlation exhibited preferential orientation with respect to the stretching direction. Keith and coworkers later reported the stretching-induced structural changes of similar triblock copolymer-type BB elastomers using SAXS.10 The spacing between the hard spherical domains along the stretching direction increased linearly with the stretch ratio, while the interbackbone spacing decreased slightly upon stretching. The elongated backbone chains became “thinner” to maintain a constant physical density, which resulted in a decrease in the interbackbone spacing. However, there remain missing pieces needed for a complete understanding of the structures of BB polymer networks under deformation. For example, the extent of orientation of the backbone and the side chains and its impact on macroscopic mechanical properties have not been clarified.
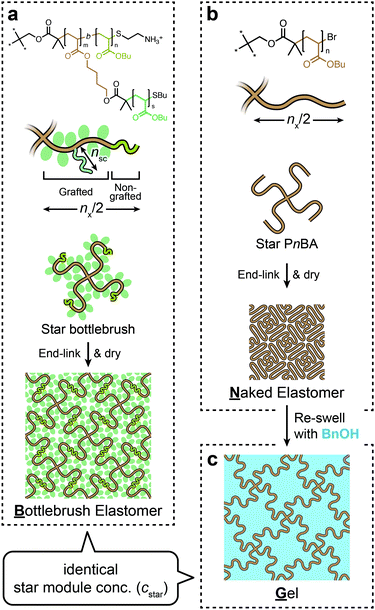
Here, we sought to gain insight into the structure–property relationships of BB polymer networks by taking advantage of the novel synthetic method we recently developed.11 For a precise understanding of polymer networks, it is crucial to use model networks with controlled network structures. We previously reported the synthesis of a network by end-linking of a monodisperse star-shaped polymer, each arm of which was a BB polymer. This strategy is known to be capable of producing highly ordered networks.12,13 Our method enabled precise and uniform control of the structural parameters of the BB polymer network, such as the contour lengths of the backbone chains and the side chains and the cross-link functionality. In this study, we designed a set of networks with well-controlled structures that enable directly linking the mechanical properties and the nanoscopic structure (Fig. 1). The BB elastomer (B) was prepared by end-linking a star BB polymer (Fig. 1a). A corresponding star polymer network without side chains was separately prepared, which we call a “naked” elastomer (N, Fig. 1b). The polymerization degree of the backbone chain between adjacent cross-links (nx) was set to be identical in N and B. Moreover, N was reswollen in a solvent to make a gel (G) for which the swelling degree was adjusted so the concentration of the star polymer module (cstar) was identical to that of B (Fig. 1c). Thus, all three networks, B, N, and G, had almost identical contour lengths between cross-links. N was an analog of B with side chains removed, while G was an analog of B with side chains replaced by the same volume of solvent. We performed tensile tests coupled with in situ small-angle X-ray scattering (tensile-SAXS) to compare mechanical properties and deformation-induced structural changes among the three networks B, N, and G.
Experimental
Materials.
The star BB polymer synthesized in our previous study11 was used in this study to synthesize B. The structure of the star BB polymer is depicted in the top of Fig. 1a. The backbone chain in each arm was actually a diblock copolymer composed of a grafted block and a nongrafted block. The nongrafted block and the side chains were poly(n-butyl acrylate) (PnBA). An ammonium group was attached at the end of the nongrafted block, which served as the reaction point for the end-linking process. The nongrafted block was introduced to avoid steric crowding around the ammonium end group; if the end group was attached directly to the end of the grafted section, access to the end group would have been hindered by the densely grafted side chains. Details of the synthesis and characterization can be found elsewhere.11 The star PnBA used for synthesizing N and G was prepared according to our previous report.14 The detailed synthetic procedure and the characterization data are found in the ESI† (Section S1, ESI†). Table 1 summarizes the molecular characterization of the star polymers and the corresponding networks, including the polymer weight fraction (wp), polymer volume fraction (φp), and number density of the star polymer module (cstar). N,N-Diisopropylethylamine (DIPEA), 3,6-dioxa-1,8-octanedithiol (DODT), and disuccinimidyl suberate (DSS) were purchased from Tokyo Chemical Industry Co., Ltd. (Japan). Benzyl alcohol (BnOH), N,N-dimethylformamide (DMF, superdehydrated), and N,N,N′,N′-tetramethyl-1,3-propanediamine (TMPDA) were purchased from FUJIFILM Wako Pure Chemical Corp. (Japan). All reagents were used as-received.| Sample | Precursor star polymer | Network | |||||
|---|---|---|---|---|---|---|---|
| M n [kDa] | M w/Mna | n x | n sc | w p | φ p | c star [mM] | |
| a Determined by size-exclusion chromatography using a light scattering detector. b Taken from our previous study.11 c Determined by 1H NMR. d Polymerization degree of the backbone chain between adjacent cross-links, calculated as twice the backbone polymerization degree of one arm of the precursor star polymer. e This value is the sum of the polymerization degree of the grafted section (18.6) and that of the nongrafted section (29.4). f Polymer weight fraction. g Polymer volume fraction, calculated by assuming additivity of the volume. The densities of the polymer and the solvent (BnOH) were assumed to be 1.09 g cm−3 (literature value for PnBA15) and 1.04 g cm−3 (literature value16), respectively. h Number density of the star polymer module calculated with the same assumptions used for φp. | |||||||
| B | 86.7ab | 1.16 | 48.0e | 13.0b | 1 | 1 | 12.6 |
| N | 13.8c | 1.06 | 50.8 | — | 1 | 1 | 79.0 |
| G | 13.8c | 1.06 | 50.8 | — | 0.165 | 0.159 | 12.5 |
Preparation of the BB elastomer (B).
Dumbbell-shaped test pieces of B were prepared as follows. The reaction scheme is described in Fig. S2a in the ESI.† A solution of the bifunctional activated ester linker DSS in dry DMF (13.8 mM) was prepared. 429.8 mg of the star BB polymer (Mn = 86.7 kDa, 4.96 μmol, 1 eq.) was dissolved in 720 μL of the DSS/DMF solution (containing 9.92 μmol of DSS, 2.00 eq.) in a glass tube. To this solution, 80 μL of the DMF solution of the organic base, DIPEA (0.990 M, 79.2 μmol, 16.0 eq.), was added. The mixed solution was vigorously stirred, filtered through a syringe membrane filter to remove dust, and briefly centrifuged to remove air bubbles. The solution was then quickly injected into molds consisting of a stainless steel plate, a 2 mm-thick silicone rubber spacer with a dumbbell-shaped hole (ISO 37 type 4), and a glass slide. The solution became a gel in the sealed mold ∼9 min after the base was added. The gel was cured for 2 days at room temperature. The cured dumbbell-shaped gel was carefully removed from the mold and equilibrated in dry DMF for 1 day, in a 1![[thin space (1/6-em)]](https://www.rsc.org/images/entities/char_2009.gif) :
:![[thin space (1/6-em)]](https://www.rsc.org/images/entities/char_2009.gif) 1 mixture of DMF and toluene for 1 day, and in toluene for at least 3 days to remove soluble residues and replace the DMF solvent with toluene. The gel piece fully swollen in toluene was too brittle and difficult to be dried without damage. Therefore, the gel pieces were slowly deswollen by immersion in hexane, which is a moderately poor solvent for PnBA. The pieces were first immersed in the hexane/toluene mixture, and the hexane content was gradually increased over several days. The deswollen gel pieces were dried in air and then in vacuo at room temperature for several days to obtain dumbbell-shaped test pieces of the dry BB elastomer B. The pieces were stored in vacuo at room temperature before use. The width of the reduced section was measured with an optical microscope (L-870 zoom lens, Hozan, Japan and NOA630B digital camera, WRAYMER, Japan). The thickness was measured with a digital micrometer (ID-S112S, Mitsutoyo, Japan). Four test pieces were subjected to tensile-SAXS measurements. The width and thickness were typically 1.16 mm and 1.12 mm, respectively. The photograph of a representative test piece is shown in Fig. S3a (ESI†). The final concentration of star polymer modules in the elastomer (cstar) was calculated by dividing the physical density of the polymer (ρp) by the Mn of the star polymer. We assumed that ρp was identical to that of PnBA (1.09 g cm−3 according to the literature15).
1 mixture of DMF and toluene for 1 day, and in toluene for at least 3 days to remove soluble residues and replace the DMF solvent with toluene. The gel piece fully swollen in toluene was too brittle and difficult to be dried without damage. Therefore, the gel pieces were slowly deswollen by immersion in hexane, which is a moderately poor solvent for PnBA. The pieces were first immersed in the hexane/toluene mixture, and the hexane content was gradually increased over several days. The deswollen gel pieces were dried in air and then in vacuo at room temperature for several days to obtain dumbbell-shaped test pieces of the dry BB elastomer B. The pieces were stored in vacuo at room temperature before use. The width of the reduced section was measured with an optical microscope (L-870 zoom lens, Hozan, Japan and NOA630B digital camera, WRAYMER, Japan). The thickness was measured with a digital micrometer (ID-S112S, Mitsutoyo, Japan). Four test pieces were subjected to tensile-SAXS measurements. The width and thickness were typically 1.16 mm and 1.12 mm, respectively. The photograph of a representative test piece is shown in Fig. S3a (ESI†). The final concentration of star polymer modules in the elastomer (cstar) was calculated by dividing the physical density of the polymer (ρp) by the Mn of the star polymer. We assumed that ρp was identical to that of PnBA (1.09 g cm−3 according to the literature15).
Preparation of the “naked” PnBA elastomer (N).
The dumbbell-shaped test pieces of N were prepared in a manner similar to B. The reaction scheme is shown in Fig. S2b (ESI†). In a typical run, 1196 mg of the star PnBA (Mn = 13.8 kDa, 86.7 μmol, 1 eq.) was dissolved in 2923 μL of dry DMF. To this solution, 500 μL of a DMF solution of the dithiol linker DODT (0.348 M, 174 μmol, 2.00 eq.) and 577 μL of TMPDA (452 mg, 3.47 mmol, 40 eq.) were added. The solution was stirred vigorously, filtered through a syringe filter, and injected into molds similar to those used for the preparation of B. After curing for 2 days at room temperature, the gel pieces were taken out from the molds and treated similarly to the B test pieces, which yielded the dumbbell-shaped test pieces of dry PnBA elastomer N. The sizes of the pieces were measured in a manner similar to that used for B. Only one test piece was actually subjected to a tensile-SAXS measurement due to limited beam time. The width and the thickness of the test piece were 1.11 mm and 1.15 mm, respectively. The photograph of the test piece is shown in Fig. S3b (ESI†). The test pieces were also used to produce G.Preparation of PnBA gel (G).
Test pieces of G were prepared by adding a prescribed amount of BnOH to N test pieces. BnOH was chosen because of its relatively high boiling point, which ensured negligible solvent evaporation from the gels during storage and tensile tests. The original N pieces were carefully weighed and placed in glass screw-cap vials. The weight of BnOH to be added was determined such that the final concentration of the star polymer modules in the network (cstar) became 12.5 mM, which was almost identical to that of B (cstar = 12.6 mM). Here, cstar was calculated by cstar = (mp/Mn)/(mp/ρp + ms/ρs), where mp and ms were the mass of the polymer and the added solvent and ρp and ρs were the physical densities of PnBA (1.09 g cm−3 from the literature15) and BnOH (1.04 g cm−3 from the literature16), respectively. The pieces were left at room temperature for ∼ 1 week until the added BnOH was fully absorbed and each piece was well equilibrated. The size of the pieces was measured in a manner similar to that used for B. Three test pieces were prepared and subjected to tensile-SAXS measurements. The widths and thicknesses of the test pieces were typically 2.13 mm and 2.19 mm, respectively. The photograph of a representative test piece is shown in Fig. S3c (ESI†).Uniaxial tensile test and in situ small-angle X-ray scattering (tensile-SAXS)
The dumbbell-shaped test pieces of the network samples were subjected to uniaxial tensile tests using a custom-made tensile tester while they were simultaneously subjected to a series of small-angle X-ray scattering (SAXS) measurements. All experiments were performed at beamline BL-6A in the Photon Factory, High Energy Acceleration Research Organization (Tsukuba, Japan).17 Photographs of the experimental setup are shown in Fig. S4 (ESI†). The in situ tensile tester consisted of two movable stages driven by a stepping motor. The two stages could move horizontally in opposite directions. The stages were equipped with planar grips, on which a piece of sand paper was glued to prevent slippage of the test piece during stretching. The grip on one side was fixed directly to one stage whereas the grip on the other side was connected to a load cell (TU-UJ 20N-G, TEAC, Japan, load capacity: 20 N, resolution: 0.001 N) that was fixed to the other stage, and the force in the stretching direction was measured. After fixing the test piece to the grips, the position of the sample stage was carefully adjusted so that the incident X-ray beam hit the center of the test piece. The tensile tests were performed at a constant nominal strain rate dλ/dt of 0.001 s−1. The stretch ratio λ was calculated by dividing the distance between the grips by its initial value. A monochromatic X-ray beam with a wavelength Λ = 1.500 Å was irradiated to the test piece being stretched. The exposure time was 10 s per frame, during which λ increased only by 0.01. The successive exposure frames were separated by intervals of 40 s (for B and G) or 90 s (for N). The scattered X-rays were recorded by a 2D hybrid pixel detector (PILATUS3-1M, Dectris, Switzerland). Moreover, the incident X-ray intensity ii and the transmitted X-ray intensity it (both in an arbitrary unit) were monitored with an ionization chamber placed before the sample and a photodiode placed at the beam stopper in front of the 2D detector, respectively. The X-ray transmittance τ of the sample was calculated from ii and it measured with the sample (ii,sam and it,sam) and without the sample (ii,bkg and it,bkg) as τ = (it,sam/it,bkg)/(ii,sam/ii,bkg). The normal incidence geometry and sample incompressibility were confirmed from the λ dependence of τ, which is discussed in detail in the ESI† (Section S2, ESI†). The obtained 2D images were corrected for the following factors: incident beam flux, exposure time, absorption, background scattering, solid angle coverage of each pixel, incident beam polarization, and sample thickness. Details of the polarization correction are described in the ESI† (Section S3, ESI†). The intensity was then scaled to the absolute intensity in cm−1 by using a glassy carbon standard (SRM3600, National Institute of Standards and Technology, United States) as a reference. The sample-to-detector distance and the position of the beam on the detector were calibrated by using the scattering peaks of silver behenate crystal powder (Nagara Science, Japan).18 The scattering vector![[q with combining right harpoon above (vector)]](https://www.rsc.org/images/entities/i_char_0071_20d1.gif) was calculated for each pixel on the detector by
was calculated for each pixel on the detector by | (1) |
![[e with combining right harpoon above (vector)]](https://www.rsc.org/images/entities/i_char_0065_20d1.gif) s and
s and ![[e with combining right harpoon above (vector)]](https://www.rsc.org/images/entities/i_char_0065_20d1.gif) i are unit vectors pointing in the direction of the incident X-ray and scattered X-ray, respectively. In this definition the magnitude of scattering vector |
i are unit vectors pointing in the direction of the incident X-ray and scattered X-ray, respectively. In this definition the magnitude of scattering vector |![[q with combining right harpoon above (vector)]](https://www.rsc.org/images/entities/i_char_0071_20d1.gif) | = q is equal to 4π sin
| = q is equal to 4π sin![[thin space (1/6-em)]](https://www.rsc.org/images/entities/char_2009.gif) θ/Λ where 2θ is the scattering angle.
θ/Λ where 2θ is the scattering angle.
Results and discussion
Mechanical properties of the three networks
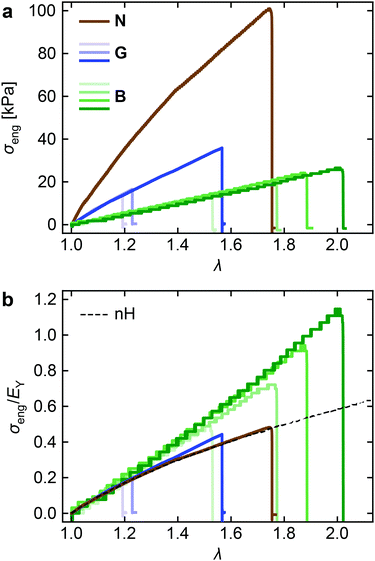
Fig. 2a shows the stress–strain curves for B, N, and G under uniaxial deformation at a constant stretching rate dλ/dt = 0.001 s−1, which were collected during tensile-SAXS measurements. Note that the stepwise stress change in B is an experimental artifact due to the limited force resolution of the load cell. The stress values of the three networks differ significantly from each other. The stress of N is markedly higher than that of G, which should be due to the higher number density of star polymer modules (cstar) in N. B shows much lower stress compared to G, despite the almost identical cstar of the two. Although these differences in the stress and the elastic modulus are interesting, we do not discuss them in detail because the elastic modulus is sensitive to various factors such as the end-linking reaction probability (p) and the recently found negative energy elasticity in gels.19 Instead we focus on the difference in the curve shape by normalizing the stress with the Young's modulus (EY). Akagi and coworkers performed such normalization on the stress–strain curves of star poly(ethylene glycol) networks with varying p.20 The normalized data formed a single master curve independent of p, indicating that the normalization enabled to remove the effects of different p. We estimated EY by linear fitting in the small strain region (Fig. S7, ESI†). The normalized stress (σeng/EY) is plotted against λ in Fig. 2b. The dotted line indicates the prediction from the neo-Hookean (nH) model, σeng/EY= (λ − λ−2)/3. The curve for N agrees perfectly with the nH model, which suggests that chains in N behave like ideal chains, as is assumed in the model. The curves for G start to deviate slightly upward from the nH prediction upon stretching beyond λ ∼ 1.4. B shows an even more significant upward deviation. It is obvious that strain stiffening is caused by the presence of side chains (B) or solvent molecules (G). The difference between B and G is interesting because the concentrations of the backbone chains were identical in B and G; thus, the significant strain stiffening is indeed the characterstics of BB polymer networks and does not appear in analogous gels. We will return to this point after the following structural study.Structure of the networks in the nonstrained state and under uniaxial stretching
To reveal the structural origins of the mechanical responses of the three networks, we performed in situ SAXS measurements synchronized with the uniaxial tensile tests shown in Fig. 2a. Fig. 3a–c shows the representative 2D SAXS images collected at zero strain (λ = 1) and immediately before failure. The corresponding stress–strain curves are given in Fig. 3d.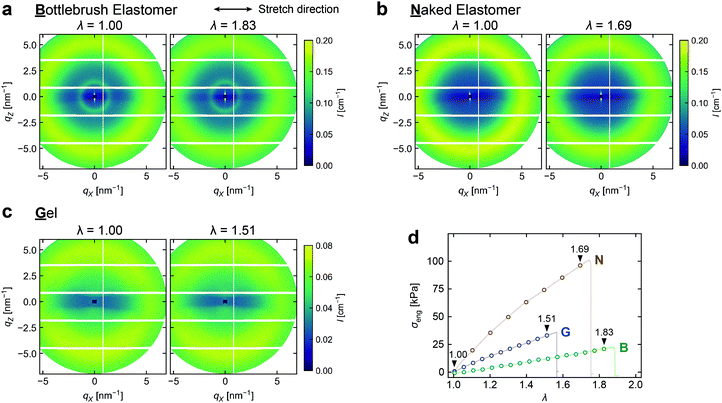 | ||
Fig. 3 Representative 2D SAXS images of (a) B, (b) N, and (c) G during tensile-SAXS measurements. The images at zero strain (λ = 1.00) and at the maximum strain investigated are shown. The intensity is plotted against the X and Z components of ![[q with combining right harpoon above (vector)]](https://www.rsc.org/images/entities/i_char_0071_20d1.gif) , where the X axis is parallel to the sample stretching direction and the Z axis is perpendicular to both the X axis and the incident beam direction (see Fig. S8a (ESI†) for the definition of axes). Areas in the detector not collecting the scattering intensity are masked in white. (d) Stress–strain curves of the three networks recorded in tensile-SAXS measurements. The markers indicate the points at which each SAXS measurement was performed. The positions corresponding to the images in Panels a–c are indicated by downward triangles. , where the X axis is parallel to the sample stretching direction and the Z axis is perpendicular to both the X axis and the incident beam direction (see Fig. S8a (ESI†) for the definition of axes). Areas in the detector not collecting the scattering intensity are masked in white. (d) Stress–strain curves of the three networks recorded in tensile-SAXS measurements. The markers indicate the points at which each SAXS measurement was performed. The positions corresponding to the images in Panels a–c are indicated by downward triangles. | ||
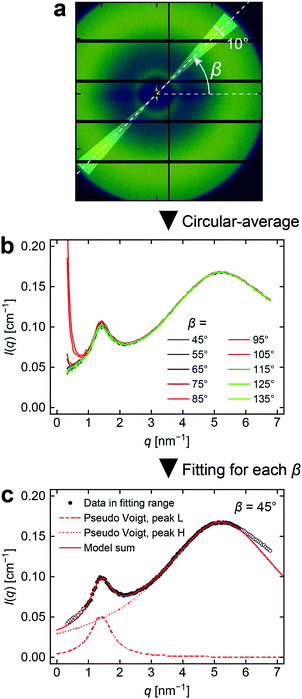
Before discussing the scattering from each sample, a comment is needed on the reduction in intensity along the equator, which is observed in all images as a horizontal dark band. This was due to uneven absorption of background scattering by the test pieces. Since the background was isotropic, its effect on further analyses could be avoided simply by limiting the azimuthal angle (β) to be sufficiently far from the equator (45° ≤ β ≤ 135° and 225° ≤ β ≤ 315°) when performing circular averaging.
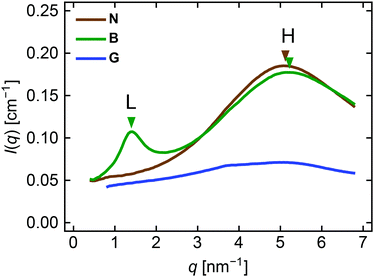
Let us first focus on the scattering images recorded at zero strain. All three networks show a similar diffuse halo in the high q region, whereas B has an additional ring in the lower q region. Fig. 4 compares the 1D profiles at zero strain obtained by circular averaging of the 2D images. The broad high-q peak appears similarly for B and N at q ∼ 5 nm−1. B exhibits an additional low-q peak at q ∼ 1.4 nm−1. We hereafter refer to the high-q peak as peak H and the low-q peak in B as peak L. Although G seems to have a very broad peak centered at q ∼ 5 nm−1, the weak intensity suggests that there is no clear spatial correlation in the gel in the length scale investigated. Interchain correlations would be significantly blurred in gels because chains in a solvent would undergo considerable thermal fluctuations.
The positions of peak H for B and N are almost identical. The equivalent Bragg spacing (d*), defined as d* = 2π/q* where q* is the peak position, is d* = 1.20 nm for B and 1.23 nm for N. This is close to a rough estimation of the molecular diameter of a PnBA chain, ∼ 1.0 nm (see Section S4 in the ESI† for calculation). Miller and coworkers reported a very similar value (1.26 nm) in their X-ray scattering study of a PnBA homopolymer, which they assigned to the interchain correlation between neighboring backbones of PnBA.21 Thus, peak H provides information on the interchain correlations among PnBA side chains in B and PnBA backbone chains in N. Peak L in B indicates d* = 4.49 nm. This value is similar to a rough estimation of the diameter of one arm of the star BB polymer, 4.2 nm (see Section S4 in the ESI† for calculation). Scattering peaks with similar length scales have been observed for various BB polymer melts with similar nsc (∼10) and the repeat unit volumes in the side chains.9,22 The peak has been assigned to the interbackbone correlations among BB chains. Therefore, peak L can be used as an indicator of the interbackbone correlations in B.
It may be somewhat surprising that such interbackbone correlations are clearly observed, despite the compositional similarity between the backbone and the side chains in B (Fig. 1a). We estimated the scattering length density (SLD) of these components from the atomic composition and physical density, using the reported atomic scattering factors.23 The SLDs of the backbone (composition: C11H17O4) and the side chains (C7H12O2) were 10.01 × 10⁻⁶ Å−2 and 10.13 × 10⁻⁶ Å−2, respectively, assuming that the physical density of both components was equal to that of PnBA (1.09 g cm−3). The small difference in the estimated SLDs does not seem to be enough to yield a clear correlation peak observed in Fig. 4. We speculate that the actual SLD contrast would be different from the estimation because the physical density of the backbone chain could be different from that of PnBA.
Next, we turn our attention to the 2D scattered intensity images just before failure. At first glance, the images of all three networks do not show significant changes upon stretching, even immediately before rupture. For B and N which showed clear spatial correlations at zero strain, we further analyzed the images more closely by transforming them to the polar coordinate system. Each scattered intensity was rebinned into (q, β) space by sector averaging, as illustrated in Fig. 5a. The representative plots of I(q,β) against q for each β are shown in Fig. 5b. The intensities of the peaks were quantified by fitting the curves with one (peak H in N) or two (peak L and peak H in B) pseudo-Voigt functions. An example of the fitting result is plotted in Fig. 5c.
The peak height and the equivalent Bragg spacing d* for peaks L and H obtained by fitting are plotted as a function of β and λ in Fig. 6. The intensity of peak L in B becomes more concentrated around β = 90° (perpendicular to the stretching direction) upon stretching, whereas the intensity of peak H does not show any anisotropy. This indicates that the main chains become more aligned along the stretching direction while the side chains remain isotropic. On the other hand, the intensity of peak H in N shows a subtle concentration of intensity around β = 90°, suggesting a slight alignment of the PnBA chains along the stretching direction. For peaks H and L of both B and N, d* remains isotropic and unchanged independent of λ. The distance among the main chains and that among the side chains are completely preserved during stretching, even when the associated scattered intensity is anisotropic.
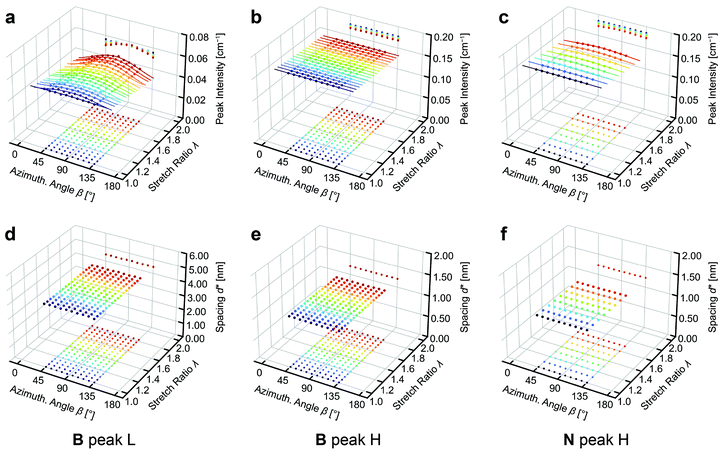 | ||
| Fig. 6 (a–c) Peak intensities and (d–f) associated equivalent Bragg spacing (d*) obtained by the fitting analyses. The values are shown as a function of the azimuthal angle (β) and stretch ratio (λ). (a, d) Results for peak L in B. (b,e) Peak H in B. (c,f) Peak H in N. The solid curves in Panels a–c represent the result of curve fitting using eqn (3). In each panel, 2D projections of the 3D data are shown on the bottom and the back boundaries of the 3D plot to enable identification of the coordinate for each data point. | ||
We then quantified the degree of anisotropy for the peak intensity at each λ in Fig. 6a–c. In the crystallographic context, scattering is observed when the plane normal vector (pole) of the periodic structure coincides with the scattering vector (![[q with combining right harpoon above (vector)]](https://www.rsc.org/images/entities/i_char_0071_20d1.gif) ). The spatial correlations between BB backbones (peak L) or between PnBA chains (peak H) can be regarded as the periodic structures in B and N that yield scattering. The angular distributions of the associated poles gives rise to the anisotropy seen in Fig. 6a–c. The extent of orientation of a pole with respect to a reference axis (the stretching direction in the present case) is often measured by using Hermann's orientation parameter (f), which is defined as
). The spatial correlations between BB backbones (peak L) or between PnBA chains (peak H) can be regarded as the periodic structures in B and N that yield scattering. The angular distributions of the associated poles gives rise to the anisotropy seen in Fig. 6a–c. The extent of orientation of a pole with respect to a reference axis (the stretching direction in the present case) is often measured by using Hermann's orientation parameter (f), which is defined as
| f = ½(3cos2θ − 1) | (2) |
| I(β) =a0 + a2cos2β | (3) |
 | (4) |
A detailed derivation of these expressions is described in the ESI† (Section S5, ESI†). The results of fitting with eqn (3) are shown as solid curves in Fig. 6a–c. The model fits the experimental intensity profiles well. Fig. 7a shows the obtained f as a function of λ. To the best of our knowledge, this is the first study to quantify the chain orientations in BB elastomers under mechanical loading.
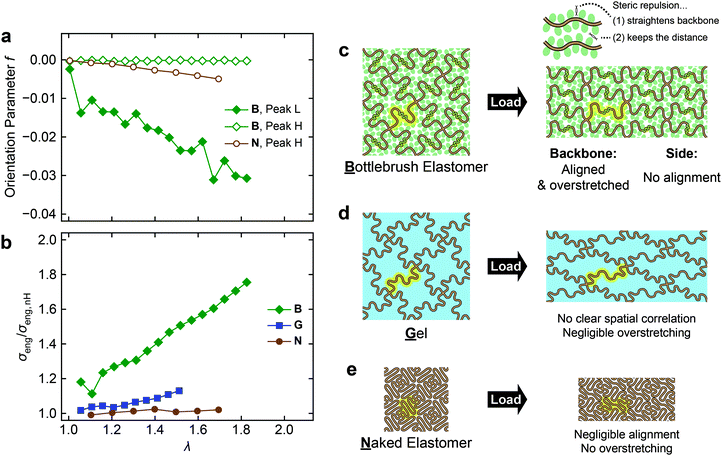
We first focus on the orientation behavior in B. Upon stretching, f of peak L (interbackbone correlation of BB chains) immediately starts to decrease to a negative value and keeps decreasing constantly. The negative f indicates that the corresponding poles are oriented perpendicularly to the stretching direction, which further indicates the alignment of the backbone chains along the stretching direction. In contrast, the f of peak H in B (interchain correlation of PnBA side chains) remains zero upon stretching, indicating no preferential orientation of the side chains. Stretching N induces a subtle decline in the f of peak H (interchain correlation of PnBA main chains). Similar to the backbone chains in B, the PnBA main chains in N align in the stretching direction, but the degree of orientation is much smaller compared to that of the backbone chains in B.
Now we can compare the molecular orientations to the macroscopic strain stiffening behavior of the networks. Fig. 7b shows the observed σeng normalized with the prediction from the nH model (σeng,nH, black dashed curve in Fig. 2b). Considerable upward deviation of B from the model, i.e., strain stiffening is again clearly seen, while G shows moderate strain stiffening, and there is almost no strain stiffening in N.
The proposed mechanisms for the stress responses of the three networks are schematically illustrated in Fig. 7c–e. In B, the backbone chains are aligned along the stretching direction (Fig. 7a). This is well synchronized with the deviations from the nH model (Fig. 7b), which means that the conformations of the backbone chains deviate from the ideal chain conformation. We hereafter refer to the chains stretched beyond the ideal chain regime as overstretched chains. Taken together, the BB backbone chains should be both overstretched and aligned in the macroscopic stretching direction (Fig. 7c). Interestingly, interchain correlations within the side chains do not show anisotropy, even when the nearby backbone chains are aligned and overstretched. This observation implies that the side chains behave rather like a disordered solvent in terms of spatial correlations at the segment level. However, when the side chains are replaced with the same volume of a solvent (Fig. 7d), strain stiffening is negligibly small. This indirectly suggests the absence of overstretching in G, although the structure was not directly detected by SAXS. The comparison between B and G highlights the role of side chains in BB elastomers. Steric repulsions among side chains grafted to the neighboring repeat units of the backbone chain force the backbone chains to adopt a stretched conformation ((1) in Fig. 7c). The prestretched backbone chains are easily overstretched beyond the ideal chain conformation, resulting in significant strain stiffening upon macroscopic deformation of the network. In addition, intermolecular repulsions among side chains belonging to different backbone chains keep the distances between the backbone chains constant ((2) in Fig. 7c). This is evident in Fig. 6d from the invariance and the lack of anisotropy of d* of peak L. Taken together, the presence of side chains forces alignment and overstretching of backbone chains under loading. The equivalent volume of a solvent does not simulate the roles of side chains, since the solvent can freely “escape” from the spaces between chains and hence cannot generate steric repulsion. Obviously, when there are no side chains and a solvent (N), the backbone chains behave like ideal chains and show almost no chain alignment and strain stiffening upon stretching (Fig. 7e).
Conclusion
We investigated the macroscopic stress–strain relationships and the microscopic structural changes in a BB elastomer with a controlled network structure by means of tensile-SAXS. The model networks were synthesized by end-linking monodisperse star polymers. In the tensile tests, the solvent-free BB elastomer showed much more prominent strain stiffening compared to the gel with the same backbone chain density and the solvent-free elastomer without the side chains. Tensile-SAXS analyses revealed that strain stiffening in the BB elastomer accompanied significant backbone chain alignment in contrast to the case for the side chain-free elastomer, for which only a very small degree of backbone chain alignment was observed. It was found that the side chains in the BB elastomer did not show any preferential orientation. These results indicated that the side chains behaved like a disordered diluent at the segment level, but their steric repulsion led to overstretching and alignment of the backbone chain. These findings will aid further understanding of the structures and physics of BB polymer networks.Conflicts of interest
There are no conflicts to declare.Acknowledgements
This work was supported by JSPS KAKENHI Grant Number 19K15630. The SAXS experiment was performed under the approval of the Photon Factory Program Advisory Committee (Proposal No. 2021G096).References
- Z. Li, M. Tang, S. Liang, M. Zhang, G. M. Biesold, Y. He, S.-M. Hao, W. Choi, Y. Liu, J. Peng and Z. Lin, Bottlebrush polymers: From controlled synthesis, self-assembly, properties to applications, Prog. Polym. Sci., 2021, 116, 101387 CrossRef CAS.
- W. F. M. Daniel, J. Burdyńska, M. Vatankhah-Varnoosfaderani, K. Matyjaszewski, J. Paturej, M. Rubinstein, A. V. Dobrynin and S. S. Sheiko, Solvent-free, supersoft and superelastic bottlebrush melts and networks, Nat. Mater., 2016, 15, 183–189 CrossRef CAS PubMed.
- M. Vatankhah-Varnosfaderani, W. F. M. Daniel, M. H. Everhart, A. A. Pandya, H. Liang, K. Matyjaszewski, A. V. Dobrynin and S. S. Sheiko, Mimicking biological stress–strain behaviour with synthetic elastomers, Nature, 2017, 549, 497–501 CrossRef PubMed.
- M. Vatankhah-Varnosfaderani, A. N. Keith, Y. Cong, H. Liang, M. Rosenthal, M. Sztucki, C. Clair, S. Magonov, D. A. Ivanov, A. V. Dobrynin and S. S. Sheiko, Chameleon-like elastomers with molecularly encoded strain-adaptive stiffening and coloration, Science, 2018, 359, 1509–1513 CrossRef CAS PubMed.
- C. Choi, J. L. Self, Y. Okayama, A. E. Levi, M. Gerst, J. C. Speros, C. J. Hawker, J. Read de Alaniz and C. M. Bates, Light-Mediated Synthesis and Reprocessing of Dynamic Bottlebrush Elastomers under Ambient Conditions, J. Am. Chem. Soc., 2021, 143, 9866–9871 CrossRef CAS PubMed.
- E. Altay, D. Nykypanchuk and J. Rzayev, Mesoporous Polymer Frameworks from End-Reactive Bottlebrush Copolymers, ACS Nano, 2017, 11, 8207–8214 CrossRef CAS PubMed.
- B. B. Patel, D. J. Walsh, D. H. Kim, J. Kwok, B. Lee, D. Guironnet and Y. Diao, Tunable structural color of bottlebrush block copolymers through direct-write 3D printing from solution, Sci. Adv., 2020, 6, eaaz7202 CrossRef CAS PubMed.
- F. Jia, J. M. Kubiak, M. Onoda, Y. Wang and R. J. Macfarlane, Design and Synthesis of Quick Setting Nonswelling Hydrogels via Brush Polymers, Adv. Sci., 2021, 8, 2100968 CrossRef CAS PubMed.
- C. Clair, A. Lallam, M. Rosenthal, M. Sztucki, M. Vatankhah-Varnosfaderani, A. N. Keith, Y. Cong, H. Liang, A. V. Dobrynin, S. S. Sheiko and D. A. Ivanov, Strained Bottlebrushes in Super-Soft Physical Networks, ACS Macro Lett., 2019, 8, 530–534 CrossRef CAS PubMed.
- A. N. Keith, M. Vatankhah-Varnosfaderani, C. Clair, F. Fahimipour, E. Dashtimoghadam, A. Lallam, M. Sztucki, D. A. Ivanov, H. Liang, A. V. Dobrynin and S. S. Sheiko, Bottlebrush Bridge between Soft Gels and Firm Tissues, ACS Cent. Sci., 2020, 6, 413–419 CrossRef CAS PubMed.
- S. Nakagawa and N. Yoshie, Synthesis of a Bottlebrush Polymer Gel with a Uniform and Controlled Network Structure, ACS Macro Lett., 2021, 10, 186–191 CrossRef CAS PubMed.
- X. Li, S. Nakagawa, Y. Tsuji, N. Watanabe and M. Shibayama, Polymer gel with a flexible and highly ordered three-dimensional network synthesized via bond percolation, Sci. Adv., 2019, 5, eaax8647 CrossRef CAS PubMed.
- S. Nakagawa and N. Yoshie, Star polymer networks: a toolbox for cross-linked polymers with controlled structure, Polym. Chem., 2022, 13, 2074–2107 RSC.
- X. Huang, S. Nakagawa, X. Li, M. Shibayama and N. Yoshie, A Simple and Versatile Method for the Construction of Nearly Ideal Polymer Networks, Angew. Chem., Int. Ed., 2020, 59, 9646–9652 CrossRef CAS PubMed.
- E. Eghbali, O. Colombani, M. Drechsler, A. H. E. Müller and H. Hoffmann, Rheology and Phase Behavior of Poly(n-butyl acrylate)-block-poly(acrylic acid) in Aqueous Solution, Langmuir, 2006, 22, 4766–4776 CrossRef CAS PubMed.
- K.-D. Chen, Y.-F. Lin and C.-H. Tu, Densities, Viscosities, Refractive Indexes, and Surface Tensions for Mixtures of Ethanol, Benzyl Acetate, and Benzyl Alcohol, J. Chem. Eng. Data, 2012, 57, 1118–1127 CrossRef CAS.
- H. Takagi, N. Igarashi, T. Mori, S. Saijo, H. Ohta, Y. Nagatani, T. Kosuge and N. Shimizu, Upgrade of small angle X-ray scattering beamline BL-6A at the photon factory, AIP Conf. Proc., 2016, 1741, 030018 CrossRef.
- T. C. Huang, H. Toraya, T. N. Blanton and Y. Wu, X-ray powder diffraction analysis of silver behenate, a possible low-angle diffraction standard, J. Appl. Crystallogr., 1993, 26, 180–184 CrossRef CAS.
- Y. Yoshikawa, N. Sakumichi, U. Chung and T. Sakai, Negative Energy Elasticity in a Rubberlike Gel, Phys. Rev. X, 2021, 11, 011045 CAS.
- Y. Akagi, T. Katashima, H. Sakurai, U. Chung and T. Sakai, Ultimate elongation of polymer gels with controlled network structure, RSC Adv., 2013, 3, 13251–13258 RSC.
- R. L. Miller, R. F. Boyer and J. Heijboer, X-ray scattering from amorphous acrylate and methacrylate polymers: Evidence of local order, J. Polym. Sci., Polym. Phys. Ed., 1984, 22, 2021–2041 CrossRef CAS.
- J. M. Sarapas, T. B. Martin, A. Chremos, J. F. Douglas and K. L. Beers, Bottlebrush polymers in the melt and polyelectrolytes in solution share common structural features, Proc. Natl. Acad. Sci. U. S. A., 2020, 117, 5168–5175 CrossRef CAS PubMed.
- B. L. Henke, E. M. Gullikson and J. C. Davis, X-Ray Interactions: Photoabsorption, Scattering, Transmission, and Reflection at E = 50-30,000 eV, Z = 1-92, At. Data Nucl. Data Tables, 1993, 54, 181–342 CrossRef CAS.
- G. R. Mitchell, A wide-angle X-ray study of the development of molecular orientation in crosslinked natural rubber, Polymer, 1984, 25, 1562–1572 CrossRef CAS.
- P.-A. Albouy, G. Guillier, D. Petermann, A. Vieyres, O. Sanseau and P. Sotta, A stroboscopic X-ray apparatus for the study of the kinetics of strain-induced crystallization in natural rubber, Polymer, 2012, 53, 3313–3324 CrossRef CAS.
Footnote |
| † Electronic supplementary information (ESI) available. See DOI: https://doi.org/10.1039/d2sm00492e |
| This journal is © The Royal Society of Chemistry 2022 |

