 Open Access Article
Coexistence of 1![[thin space (1/6-em)]](https://www.rsc.org/images/entities/h2_char_2009.gif) :
:![[thin space (1/6-em)]](https://www.rsc.org/images/entities/h2_char_2009.gif) 1 and 2
1 and 2![[thin space (1/6-em)]](https://www.rsc.org/images/entities/h2_char_2009.gif) :
:![[thin space (1/6-em)]](https://www.rsc.org/images/entities/h2_char_2009.gif) 1 inclusion complexes of indigo carmine†
1 inclusion complexes of indigo carmine†
Oksana
Yanshyna
 a,
Liat
Avram
 b,
Linda J. W.
Shimon
 b and
Rafal
Klajn
 *a
*a
aDepartment of Organic Chemistry, Weizmann Institute of Science, Rehovot 76100, Israel. E-mail: rafal.klajn@weizmann.ac.il
bDepartment of Chemical Research Support, Weizmann Institute of Science, Rehovot 76100, Israel
First published on 22nd January 2022
Abstract
We show that the optical properties of indigo carmine can be modulated by encapsulation within a coordination cage. Depending on the host/guest molar ratio, the cage can predominantly encapsulate either one or two dye molecules. The 1![[thin space (1/6-em)]](https://www.rsc.org/images/entities/char_2009.gif) :
:![[thin space (1/6-em)]](https://www.rsc.org/images/entities/char_2009.gif) 1 complex is fluorescent, unique for an indigo dye in an aqueous solution. We have also found that binding two dye molecules stabilizes a previously unknown conformation of the cage.
1 complex is fluorescent, unique for an indigo dye in an aqueous solution. We have also found that binding two dye molecules stabilizes a previously unknown conformation of the cage.
Confining dye molecules in spaces not much larger than the molecules themselves1 can drastically affect their optical properties. Both absorption and emission of dyes can be altered by encapsulation within the cavities of molecular cages,2 metal–organic frameworks,3,4 and protein molecules.5 For example, cucurbit[8]uril (CB[8]) was shown to stabilize the monomeric form of perylene dyes, thus preventing undesired aggregation and enabling strong fluorescence in aqueous media.6 In a related study, CB[8] was used to assemble coumarin dyes into either H- or J-aggregates, depending on the substitution pattern on the coumarin scaffold.7 Similarly, the emission of other fluorescent dyes can be fine-tuned by encapsulation8 or co-encapsulation with other molecules.9 Furthermore, confinement can reverse the thermodynamic stability of two forms of isomerizable dyes, as was demonstrated for phenolphthalein,2 spiropyran,10 and a donor–acceptor Stenhouse adduct,11 all within Pd–based coordination cages. Encapsulating dyes within molecular capsules can also enhance their stability12,13 and has been used in controlled-delivery applications (e.g., for photothermal therapy).14
Indigo carmine (the disodium salt of indigo-5,5′-disulfonic acid; 2 in Fig. 1) has long15 been used as a textile dye16 and an edible food colorant.17 Owing to its facile conversion to colorless products, it has been employed for colorimetric detection of various analytes, including oxygen18 and ozone19 dissolved in water. It has also been used as an electrode material for rechargeable batteries20,21 and, more recently, served as a model dye in developing a new tooth whitening procedure.22 However, except for several studies of 2 within layered inorganic materials,23–25 surprisingly little attention has been devoted to its behavior under confinement, and in particular as a guest in supramolecular host–guest inclusion complexes.26
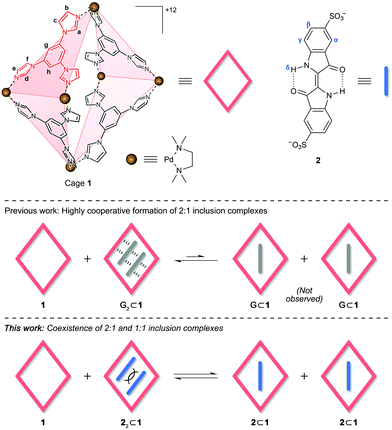 | ||
Fig. 1 Structural formulae of cage 1 and indigo carmine 2 (top) and schematic illustration of equilibria between 2![[thin space (1/6-em)]](https://www.rsc.org/images/entities/char_2009.gif) : :![[thin space (1/6-em)]](https://www.rsc.org/images/entities/char_2009.gif) 1 and 1 1 and 1![[thin space (1/6-em)]](https://www.rsc.org/images/entities/char_2009.gif) : :![[thin space (1/6-em)]](https://www.rsc.org/images/entities/char_2009.gif) 1 inclusion complexes (bottom). Counterions = NO3− for 1 and Na+ for 2. 1 inclusion complexes (bottom). Counterions = NO3− for 1 and Na+ for 2. | ||
Here, we investigated the complexation of indigo carmine within a metal–organic cage assembled from six cis-blocked Pd2+ cations and four triimidazole panels (1 in Fig. 1).27 Owing to its high charge, cage 1 exhibits excellent aqueous solubility, yet it contains a hydrophobic cavity, enabling it to bind various organic molecules, effectively solubilizing them in water. The size of 1's cavity allows it to simultaneously encapsulate two small aromatic molecules, such as pyrene27 and arylazopyrazole28 derivatives, as well as various azobenzenes29 and BODIPY dyes.30 The resulting complexes are stabilized by the combination of the hydrophobic effect and attractive van der Waals and π⋯π stacking interactions involving both (i) the cage and the guest, and (ii) two guest molecules (see G2⊂1 in Fig. 1, where G denotes an electrically neutral guest). For such interactions to be optimized, 1's cavity must be filled by two guest molecules; therefore, the binding of guests within 1 is cooperative, and no 1![[thin space (1/6-em)]](https://www.rsc.org/images/entities/char_2009.gif) :
:![[thin space (1/6-em)]](https://www.rsc.org/images/entities/char_2009.gif) 1 complexes (G⊂1 in Fig. 1) have so far been observed, even in the presence of excess 1.29 Unlike the previously studied guests, however, 2 bears two negative charges. These charges can, on the one hand, facilitate binding within the positively charged cage; on the other hand, placing two negatively charged molecules in close proximity is energetically unfavorable; thus, we expected that in the presence of an excess of free 1, a complex of a 1
1 complexes (G⊂1 in Fig. 1) have so far been observed, even in the presence of excess 1.29 Unlike the previously studied guests, however, 2 bears two negative charges. These charges can, on the one hand, facilitate binding within the positively charged cage; on the other hand, placing two negatively charged molecules in close proximity is energetically unfavorable; thus, we expected that in the presence of an excess of free 1, a complex of a 1![[thin space (1/6-em)]](https://www.rsc.org/images/entities/char_2009.gif) :
:![[thin space (1/6-em)]](https://www.rsc.org/images/entities/char_2009.gif) 1 stoichiometry might prevail (Fig. 1, bottom panel).
1 stoichiometry might prevail (Fig. 1, bottom panel).
First, we prepared and characterized the 2![[thin space (1/6-em)]](https://www.rsc.org/images/entities/char_2009.gif) :
:![[thin space (1/6-em)]](https://www.rsc.org/images/entities/char_2009.gif) 1 inclusion complex by treating cage 1 with 2.0 equiv. of 2. Fig. 2 compares the 1H NMR spectra of 1, 2, and the inclusion complex 22⊂1 (for which all the peaks were assigned based on a comprehensive analysis using several 2D NMR techniques; Fig. S5–S8 in the ESI†). The chemical shifts of 1's protons changed upon encapsulating 2; most notably, the axial acidic imidazole protons of 22⊂1 (a in Fig. 1) appear significantly (by 0.47 ppm) downfield-shifted compared with the empty 1, diagnostic10,31 of large structural changes of the host induced by binding the guest. Interestingly, the singlet due to the equatorial acidic imidazole protons (d in Fig. 1) splits into two peaks (this guest-induced asymmetrization of 1 can be understood by analyzing the solid-state structure of 22⊂1; see below). As expected, encapsulation within the hydrophobic cavity induced an upfield shift of the guest's protons (by 0.14 ppm and 1.24 ppm for 2γ and 2α, respectively). Surprisingly, however, 2β moved downfield (by 0.28 ppm), suggesting that 2 might partially protrude from the cage's cavity.
1 inclusion complex by treating cage 1 with 2.0 equiv. of 2. Fig. 2 compares the 1H NMR spectra of 1, 2, and the inclusion complex 22⊂1 (for which all the peaks were assigned based on a comprehensive analysis using several 2D NMR techniques; Fig. S5–S8 in the ESI†). The chemical shifts of 1's protons changed upon encapsulating 2; most notably, the axial acidic imidazole protons of 22⊂1 (a in Fig. 1) appear significantly (by 0.47 ppm) downfield-shifted compared with the empty 1, diagnostic10,31 of large structural changes of the host induced by binding the guest. Interestingly, the singlet due to the equatorial acidic imidazole protons (d in Fig. 1) splits into two peaks (this guest-induced asymmetrization of 1 can be understood by analyzing the solid-state structure of 22⊂1; see below). As expected, encapsulation within the hydrophobic cavity induced an upfield shift of the guest's protons (by 0.14 ppm and 1.24 ppm for 2γ and 2α, respectively). Surprisingly, however, 2β moved downfield (by 0.28 ppm), suggesting that 2 might partially protrude from the cage's cavity.
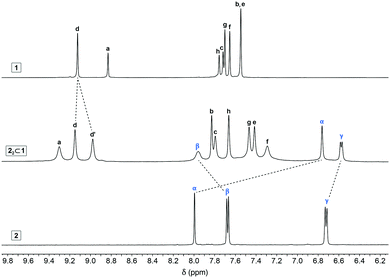 | ||
| Fig. 2 Partial 1H NMR spectra of cage 1 (top), indigo carmine 2 (bottom), and 22⊂1 (middle) (500 MHz, D2O, 298 K). For the full-range spectrum of 22⊂1, see Fig. S2 in the ESI.† | ||
Single crystals of 22⊂1 suitable for X-ray diffraction were prepared by slow water evaporation from an aqueous solution of the inclusion complex. To our satisfaction, the solid-state structure of 22⊂1 could be elucidated with a level of structural detail far surpassing that of the previously reported complexes of cage 1.10,27–29,31 Specifically, we determined the positions of all eight NO3− counterions (note that four out of 1's twelve charges are compensated by 2) and as many as 48 water molecules (in addition to one NaNO3) per unit cell (which contains one cage molecule). Similar to the previously reported structures, the aromatic systems of the guests were roughly parallel to each other and to two opposite walls of the cage (Fig. 3A, left). However, in contrast to the 2![[thin space (1/6-em)]](https://www.rsc.org/images/entities/char_2009.gif) :
:![[thin space (1/6-em)]](https://www.rsc.org/images/entities/char_2009.gif) 1 complexes of electrically neutral guests, whereby the guest molecules’ long axes are parallel to each other,10,27–29 the noncovalent dimer of 2 adopted a scissor-like arrangement (Fig. 3A, center), with a ∼33° angle between the long axes (defined as the lines connecting the centroids of the two peripheral benzene rings). This arrangement results from the electrostatic repulsion between the sulfonate groups. More interestingly, the cage adopted a previously unknown, low-symmetry conformation, with both axial Pd nodes pointing in the same direction (Fig. 3A, center). We refer to this conformation as “cis” to differentiate it from the typically observed “trans” structure (Fig. 3B, top center). The transformation between trans-1 and cis-1 results from the rotation of two neighboring axial imidazole groups by 180° (orange in Fig. 3B), which must involve a temporary dissociation of one of these imidazoles from Pd. We found that one of the windows in cis-1 (defined as the distance between two equatorial Pd nodes as shown in Fig. 3B, right) is significantly larger than the other (Fig. 3B, bottom right); it is at this large window that the two SO3− groups at the “scissors handle” repel one another (see Fig. 3A, right). It is also interesting to point out that the trans → cis transformation changes the size of the macrocycles constituting the window “frames”. In trans-1, both windows are formed by 46-membered rings; cis-1, however, features two differently sized windows, one composed of 44 atoms and the other one of 48 atoms. Finally, we note that four equatorial imidazoles (highlighted in green in Fig. 3B, bottom) are significantly more tilted than the other four; this tilting can explain the unusual splitting of the equatorial acidic imidazole signal seen in the NMR spectra (Fig. 2). We have separately crystallized 22⊂1 by diffusing acetone vapors into an aqueous solution of the complex and found both solid-state structures to be very similar (Fig. S19 in the ESI†).
1 complexes of electrically neutral guests, whereby the guest molecules’ long axes are parallel to each other,10,27–29 the noncovalent dimer of 2 adopted a scissor-like arrangement (Fig. 3A, center), with a ∼33° angle between the long axes (defined as the lines connecting the centroids of the two peripheral benzene rings). This arrangement results from the electrostatic repulsion between the sulfonate groups. More interestingly, the cage adopted a previously unknown, low-symmetry conformation, with both axial Pd nodes pointing in the same direction (Fig. 3A, center). We refer to this conformation as “cis” to differentiate it from the typically observed “trans” structure (Fig. 3B, top center). The transformation between trans-1 and cis-1 results from the rotation of two neighboring axial imidazole groups by 180° (orange in Fig. 3B), which must involve a temporary dissociation of one of these imidazoles from Pd. We found that one of the windows in cis-1 (defined as the distance between two equatorial Pd nodes as shown in Fig. 3B, right) is significantly larger than the other (Fig. 3B, bottom right); it is at this large window that the two SO3− groups at the “scissors handle” repel one another (see Fig. 3A, right). It is also interesting to point out that the trans → cis transformation changes the size of the macrocycles constituting the window “frames”. In trans-1, both windows are formed by 46-membered rings; cis-1, however, features two differently sized windows, one composed of 44 atoms and the other one of 48 atoms. Finally, we note that four equatorial imidazoles (highlighted in green in Fig. 3B, bottom) are significantly more tilted than the other four; this tilting can explain the unusual splitting of the equatorial acidic imidazole signal seen in the NMR spectra (Fig. 2). We have separately crystallized 22⊂1 by diffusing acetone vapors into an aqueous solution of the complex and found both solid-state structures to be very similar (Fig. S19 in the ESI†).
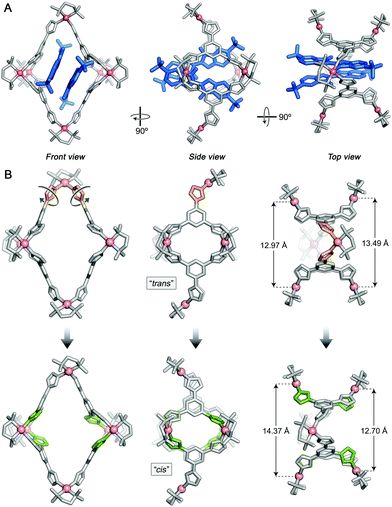 | ||
| Fig. 3 (A) X-ray crystal structure of the 22⊂1 inclusion complex viewed along three different directions. 1, gray (with Pd in pink); 2, blue. (B) Structural transformation of 1 accompanying encapsulation of 2. Top panel: X-ray crystal structure of a typical G2⊂1 inclusion complex29 (here, G = azobenzene, not shown for clarity). Bottom panel: X-ray crystal structure of 22⊂1 (2 removed for clarity). The transformation is induced by a ∼180° rotation of the two axial imidazole groups shown in orange. The four imidazole groups highlighted in green are distorted from the plane of the central benzene ring significantly more than the other four equatorial imidazoles to more efficiently interact with the encapsulated 2. Hydrogens, small ions, and water molecules were omitted for clarity. | ||
In contrast to the guests in the previously reported 2![[thin space (1/6-em)]](https://www.rsc.org/images/entities/char_2009.gif) :
:![[thin space (1/6-em)]](https://www.rsc.org/images/entities/char_2009.gif) 1 complexes of cage 1, indigo carmine has high water solubility, which allowed us to determine the binding strength by isothermal titration calorimetry (ITC). In these experiments, we titrated aqueous solutions of 2 with cage 1; by integrating the raw data (Fig. S20A in the ESI†), we confirmed the 2
1 complexes of cage 1, indigo carmine has high water solubility, which allowed us to determine the binding strength by isothermal titration calorimetry (ITC). In these experiments, we titrated aqueous solutions of 2 with cage 1; by integrating the raw data (Fig. S20A in the ESI†), we confirmed the 2![[thin space (1/6-em)]](https://www.rsc.org/images/entities/char_2009.gif) :
:![[thin space (1/6-em)]](https://www.rsc.org/images/entities/char_2009.gif) 1 binding stoichiometry and derived the association constants, Ka1 = 2.78(±0.60) × 106 M−1 and Ka2 = 7.41(±0.82) × 106 M−1. Both ΔH and −TΔS are negative, indicating that the formation of both inclusion complexes is driven enthalpically and entropically (Table S2 in the ESI†). At the same time, we note that Ka2 is only slightly (by a factor of ∼2.7) higher than Ka1, which further suggests that in the presence of >0.5 equiv. of the cage, 22⊂1 should coexist with 2⊂1.
1 binding stoichiometry and derived the association constants, Ka1 = 2.78(±0.60) × 106 M−1 and Ka2 = 7.41(±0.82) × 106 M−1. Both ΔH and −TΔS are negative, indicating that the formation of both inclusion complexes is driven enthalpically and entropically (Table S2 in the ESI†). At the same time, we note that Ka2 is only slightly (by a factor of ∼2.7) higher than Ka1, which further suggests that in the presence of >0.5 equiv. of the cage, 22⊂1 should coexist with 2⊂1.
We hypothesized that (i) free 2, (ii) 2 within the 2![[thin space (1/6-em)]](https://www.rsc.org/images/entities/char_2009.gif) :
:![[thin space (1/6-em)]](https://www.rsc.org/images/entities/char_2009.gif) 1 complex, and (iii) 2 within the putative 1
1 complex, and (iii) 2 within the putative 1![[thin space (1/6-em)]](https://www.rsc.org/images/entities/char_2009.gif) :
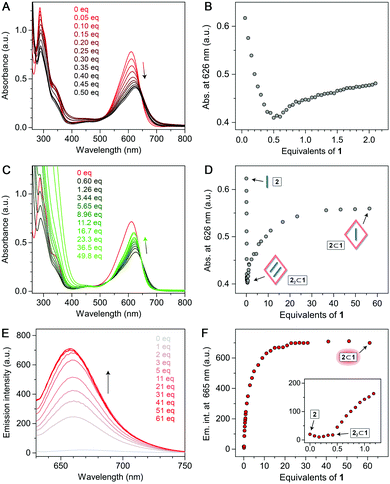
:![[thin space (1/6-em)]](https://www.rsc.org/images/entities/char_2009.gif) 1 complex should all have distinct optical properties; hence, we first sought evidence of 2⊂1 by UV–Vis absorption spectroscopy. When an aqueous solution of 2 was titrated with the cage, 2's sharp absorption peak at 610 nm gradually decreased (Fig. 4A). Upon adding 0.5 equiv. of 1, a solution of 22⊂1 was obtained, with a broader and red-shifted (λmax = 626 nm) absorption band. Had the 22⊂1 complex and free cage stably coexisted, continued addition of 1 (which is optically transparent in the visible region) would not affect the absorption spectrum of 22⊂1. However, we found that following the initial (<0.5 equiv. of 1) decrease, the absorbance at ∼610 nm progressively increased until it stabilized for >23 equiv. of 1 (Fig. 4C and D). Therefore, we attribute the visible-region absorption in the final spectra (green in Fig. 4C) to 2⊂1. We note that the spectrum of 2⊂1 resembles more that of free 2 rather than of 22⊂1.
1 complex should all have distinct optical properties; hence, we first sought evidence of 2⊂1 by UV–Vis absorption spectroscopy. When an aqueous solution of 2 was titrated with the cage, 2's sharp absorption peak at 610 nm gradually decreased (Fig. 4A). Upon adding 0.5 equiv. of 1, a solution of 22⊂1 was obtained, with a broader and red-shifted (λmax = 626 nm) absorption band. Had the 22⊂1 complex and free cage stably coexisted, continued addition of 1 (which is optically transparent in the visible region) would not affect the absorption spectrum of 22⊂1. However, we found that following the initial (<0.5 equiv. of 1) decrease, the absorbance at ∼610 nm progressively increased until it stabilized for >23 equiv. of 1 (Fig. 4C and D). Therefore, we attribute the visible-region absorption in the final spectra (green in Fig. 4C) to 2⊂1. We note that the spectrum of 2⊂1 resembles more that of free 2 rather than of 22⊂1.
Further evidence for the formation of 22⊂1 was provided by fluorescence spectroscopy. Solutions of 2 in polar organic solvents are fluorescent; in water, however, 2's fluorescence is largely quenched as the intramolecular hydrogen bonds (see Fig. 1) are broken due to hydration.32,33 Within the hydrophobic cavity of 1, the hydrogen bonds are restored; in 22⊂1, however, fluorescence is still quenched because of excimer formation (as reported previously for encapsulated BODIPY dimers30). Uniquely, 2⊂1 combines the presence of intramolecular hydrogen bonds with the stabilization of monomeric 2; hence, high emission can be expected. Indeed, upon the addition of >0.5 equiv. of 1 to 2, emission intensity (λmax = 665 nm) rapidly increased (Fig. 4E and F) before it plateaued at ∼25 equiv., in agreement with the UV–Vis absorption experiments. Remarkably, the emission intensity of 2⊂1 was more than 35-fold higher than that of both free 2 and 22⊂1 (Fig. 4F).
Finally, we attempted to characterize 2⊂1 by NMR. To this end, we titrated free 2 in D2O with 1 and recorded 1H NMR spectra after adding each aliquot of the cage (Fig. S15 in the ESI†). Interestingly, the addition of 0.2 equiv. of 1 resulted in the precipitation of a blue solid while color of the solution faded. To explain this result, we note that at 0.2 equiv. of 1, the mixture consists of 0.2 equiv. of the octuply charged 22⊂1 and 0.6 equiv. of the doubly charged 2; these two species can interact strongly by Coulombic forces, causing the formation of an electroneutral precipitate [22⊂1]8+·[24]8−. Upon continued addition of 1, the precipitate gradually redissolved as the remaining free 2 was encapsulated; at 0.5 equiv. of 1, a well-defined spectrum of 22⊂1 was obtained. We were pleased to find that when >0.5 equiv. of 1 was added, two new peaks due to 2 emerged, which were distinct from those of both free 2 and 22⊂1. These peaks, labeled α′ and γ′ in Fig. 5A, can be attributed to 2 within the 1![[thin space (1/6-em)]](https://www.rsc.org/images/entities/char_2009.gif) :
:![[thin space (1/6-em)]](https://www.rsc.org/images/entities/char_2009.gif) 1 complex 2⊂1 (see the ROESY spectrum in Fig. 5B). Integrating peaks α′ and γ′ with respect to α and γ (Fig. 5A) allowed us to plot the distribution of 2 over 2⊂1vs.22⊂1 (Fig. 5C). As expected, the molar fraction of 2⊂1 steadily increased with the addition of 1, reaching as much as 92% in the presence of 16.6 equiv. of 1 (which corresponds to ∼85% of 2 residing within 2⊂1 and ∼15% within 22⊂1; note the stoichiometry of the two complexes). It is worth pointing out that the chemical shifts of both α′ and γ′ are higher than those of α and γ, indicating that 2 is less shielded within 2⊂1 than it is within 22⊂1; interestingly, the position of proton 2β is nearly the same within both inclusion complexes (Fig. S14 in the ESI†). Unfortunately, despite repeated attempts, we did not succeed in obtaining single crystals of 2⊂1 suitable for X-ray diffraction. We note that a large fraction of 2 within 2⊂1 persists only in the presence of a large excess of 1, which therefore crystallizes preferentially. However, removing 1 from the solution shifts the equilibrium (see Fig. 1) to the left, thus turning 2⊂1 into 22⊂1. Although 2⊂1 remains elusive unless stabilized by the presence of an excess of 1, its optical properties could still be characterized as 1 is optically transparent in the visible range.
1 complex 2⊂1 (see the ROESY spectrum in Fig. 5B). Integrating peaks α′ and γ′ with respect to α and γ (Fig. 5A) allowed us to plot the distribution of 2 over 2⊂1vs.22⊂1 (Fig. 5C). As expected, the molar fraction of 2⊂1 steadily increased with the addition of 1, reaching as much as 92% in the presence of 16.6 equiv. of 1 (which corresponds to ∼85% of 2 residing within 2⊂1 and ∼15% within 22⊂1; note the stoichiometry of the two complexes). It is worth pointing out that the chemical shifts of both α′ and γ′ are higher than those of α and γ, indicating that 2 is less shielded within 2⊂1 than it is within 22⊂1; interestingly, the position of proton 2β is nearly the same within both inclusion complexes (Fig. S14 in the ESI†). Unfortunately, despite repeated attempts, we did not succeed in obtaining single crystals of 2⊂1 suitable for X-ray diffraction. We note that a large fraction of 2 within 2⊂1 persists only in the presence of a large excess of 1, which therefore crystallizes preferentially. However, removing 1 from the solution shifts the equilibrium (see Fig. 1) to the left, thus turning 2⊂1 into 22⊂1. Although 2⊂1 remains elusive unless stabilized by the presence of an excess of 1, its optical properties could still be characterized as 1 is optically transparent in the visible range.
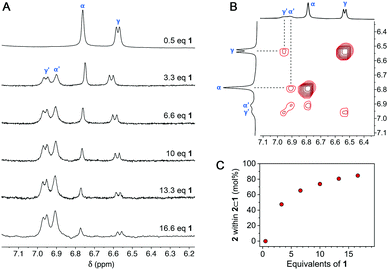 | ||
| Fig. 5 (A) Partial 1H NMR spectra of 2 in the presence of increasing amounts of 1 (up to 16.6 equiv. of 1) (D2O, 298 K; for full-range spectra, see Fig. S16 in the ESI†). (B) Partial 1H–1H ROESY spectrum of 2 in the presence of 2.0 equiv. of cage 1. The highlighted correlations originate from the exchange of 2 between two different supramolecular environments (i.e., 22⊂1 and 2⊂1). See also Fig. S14 in the ESI.† (C) The molar fraction of 2 within 2⊂1 (vs.22⊂1) as a function of the amount of 1 added. | ||
This work was supported by the European Research Council (grant 820008) and the Minerva Foundation with funding from the Federal German Ministry for Education and Research.
Conflicts of interest
There are no conflicts to declare.Notes and references
- A. B. Grommet, M. Feller and R. Klajn, Nat. Nanotechnol., 2020, 15, 256 CrossRef CAS PubMed.
- H. Takezawa, S. Akiba, T. Murase and M. Fujita, J. Am. Chem. Soc., 2015, 137, 7043 CrossRef CAS PubMed.
- I.-H. Choi, S. B. Yoon, S. Huh, S.-J. Kim and Y. Kim, Sci. Rep., 2018, 8, 9838 CrossRef PubMed.
- W. Cho, H. J. Lee, G. Choi, S. Choi and M. Oh, J. Am. Chem. Soc., 2014, 136, 12201 CrossRef CAS PubMed.
- N. Amdursky, P. K. Kundu, J. Ahrens, D. Huppert and R. Klajn, ChemPlusChem, 2016, 81, 44 CrossRef CAS PubMed.
- F. Biedermann, E. Elmalem, I. Ghosh, W. M. Nau and O. A. Scherman, Angew. Chem., Int. Ed., 2012, 51, 7739 CrossRef CAS PubMed.
- N. Barooah, J. Mohanty and A. C. Bhasikuttan, Chem. Commun., 2015, 51, 13225 RSC.
- M.-Q. Wang, Q. Wang, M. Chen and D.-H. Qu, Dyes Pigm., 2021, 196, 109822 CrossRef CAS.
- M. Yamashina, M. M. Sartin, Y. Sei, M. Akita, S. Takeuchi, T. Tahara and M. Yoshizawa, J. Am. Chem. Soc., 2015, 137, 9266 CrossRef CAS PubMed.
- D. Samanta, D. Galaktionova, J. Gemen, L. J. W. Shimon, Y. Diskin-Posner, L. Avram, P. Král and R. Klajn, Nat. Commun., 2018, 9, 641 CrossRef PubMed.
- R. Saha, A. Devaraj, S. Bhattacharyya, S. Das, E. Zangrando and P. S. Mukherjee, J. Am. Chem. Soc., 2019, 141, 8638 CrossRef CAS PubMed.
- J. Mohanty and W. M. Nau, Angew. Chem., Int. Ed., 2005, 44, 3750 CrossRef CAS PubMed.
- A. Teepakakorn, T. Yamaguchi and M. Ogawa, Chem. Lett., 2019, 48, 398 CrossRef CAS.
- A. Sowa and J. Voskuhl, Int. J. Pharm., 2020, 586, 119595 CrossRef CAS PubMed.
- C. Calvert, J. R. Soc. Arts, 1871, 19, 825 Search PubMed.
- S. Komboonchoo and T. Bechtold, J. Cleaner Prod., 2009, 17, 1487 CrossRef CAS.
- I. Coreixas de Sá, F. Neves Feiteira and W. F. Pacheco, Food Anal. Meth., 2020, 13, 962 CrossRef.
- L. S. Buchoff, N. M. Ingber and J. H. Brady, Anal. Chem., 1955, 27, 1401 CrossRef CAS.
- K. Takeuchi and T. Ibusuki, Anal. Chem., 1989, 61, 619 CrossRef CAS PubMed.
- M. Yao, K. Kuratani, T. Kojima, N. Takeichi, H. Senoh and T. Kiyobayashi, Sci. Rep., 2014, 4, 3650 CrossRef PubMed.
- N. Amdursky, E. D. Głowacki and P. Meredith, Adv. Mater., 2019, 31, 1802221 CrossRef PubMed.
- Y. Wang, X. Wen, Y. Jia, M. Huang, F. Wang, X. Zhang, Y. Bai, G. Yuan and Y. Wang, Nat. Commun., 2020, 11, 1328 CrossRef CAS PubMed.
- A. L. Costa, A. C. Gomes, M. Pillinger, I. S. Gonçalves and J. S. Seixas de Melo, Chem. – Eur. J., 2015, 21, 12069 CrossRef CAS PubMed.
- A. L. Costa, A. C. Gomes, R. C. Pereira, M. Pillinger, I. S. Gonçalves, M. Pineiro and J. S. Seixas de Melo, Langmuir, 2018, 34, 453 CrossRef CAS PubMed.
- S. A. Maruyama, S. R. Tavares, A. A. Leitāo and F. Wypych, Dyes Pigm., 2016, 128, 158 CrossRef CAS.
- S. S. Zhu, H. Staats, K. Brandhorst, J. Grunenberg, F. Gruppi, E. Dalcanale, A. Lützen, K. Rissanen and C. A. Schalley, Angew. Chem., Int. Ed., 2008, 47, 788 CrossRef CAS PubMed.
- D. Samanta, S. Mukherjee, Y. P. Patil and P. S. Mukherjee, Chem. – Eur. J., 2012, 18, 12322 CrossRef CAS PubMed.
- A. I. Hanopolskyi, S. De, M. J. Białek, Y. Diskin-Posner, L. Avram, M. Feller and R. Klajn, Beilstein J. Org. Chem., 2019, 15, 2398 CrossRef CAS PubMed.
- D. Samanta, J. Gemen, Z. Chu, Y. Diskin-Posner, L. J. W. Shimon and R. Klajn, Proc. Natl. Acad. Sci. U. S. A., 2018, 115, 9379 CrossRef CAS PubMed.
- J. Gemen, J. Ahrens, L. J. W. Shimon and R. Klajn, J. Am. Chem. Soc., 2020, 142, 17721 CrossRef CAS PubMed.
- M. Canton, A. B. Grommet, L. Pesce, J. Gemen, S. Li, Y. Diskin-Posner, A. Credi, G. M. Pavan, J. Andréasson and R. Klajn, J. Am. Chem. Soc., 2020, 142, 14557 CrossRef CAS PubMed.
- Y. Nagasawa, R. Taguri, H. Matsuda, M. Murakami, M. Ohama, T. Okada and H. Miyasaka, Phys. Chem. Chem. Phys., 2004, 6, 5370 RSC.
- P. P. Roy, J. Shee, E. A. Arsenault, Y. Yoneda, K. Feuling, M. Head-Gordon and G. R. Fleming, J. Phys. Chem. Lett., 2020, 11, 4156 CrossRef CAS PubMed.
Footnote |
| † Electronic supplementary information (ESI) available: Further characterization of the inclusion complexes. CCDC 2126310 and 2128952. For ESI and crystallographic data in CIF or other electronic format see DOI: 10.1039/d1cc07081a |
| This journal is © The Royal Society of Chemistry 2022 |

