Design of FeIII–LnIII binuclear complexes using compartmental ligands: synthesis, crystal structures, magnetic properties, and ab initio analysis†
Alexandru
Topor‡
 a,
Dan
Liu‡
 b,
Catalin
Maxim
*a,
Ghenadie
Novitchi
c,
Cyrille
Train
 c,
Zeid A.
AlOthman
 d,
Abdullah A. S.
Al-Kahtani
d,
Liviu
Ungur
d,
Abdullah A. S.
Al-Kahtani
d,
Liviu
Ungur
 e,
Le Tuan Anh
Ho
 *e,
Liviu F.
Chibotaru
*df and
Marius
Andruh
 *ag
*ag
aUniversity of Bucharest, Faculty of Chemistry, Inorganic Chemistry Laboratory, Str. Dumbrava Rosie nr. 23, 020464-Bucharest, Romania. E-mail: catalin.maxim@chimie.unibuc.ro; marius.andruh@dnt.ro
bInstitute of Flexible Electronics, Northwestern Polytechnical University, 127 West Youyi Road, Xi’an, 710072, Shaanxi, China
cCNRS, Univ. Grenoble Alpes, LNCMI, F-38000 Grenoble, France
dChemistry Department, College of Science, King Saud University, P.O. Box 2455, Riyadh 11451, Saudi Arabia
eDepartment of Chemistry, National University of Singapore, Block S8 Level 3, 3 Science Drive 3, Singapore 117543. E-mail: chmhlta@nus.edu.sg
fTheory of Nanomaterials Group, Department of Chemistry KU Leuven, Celestijnenlaan 200F, 3001 Leuven, Belgium. E-mail: Liviu.Chibotaru@kuleuven.be
gC. D. Nenitzescu Institute of Organic Chemistry of the Romanian Academy, Splaiul Independentei 202B, Bucharest, Romania
First published on 25th June 2021
Abstract
Three new binuclear FeIII–LnIII complexes, with similar structures, have been synthesized using the end-off compartmental proligand, H2valpn, resulting from the Schiff condensation between o-vanillin and 1,3-propylenediamine: [FeIIILnIII(valpn)(hfac)2(OAc)Cl] (Ln = Gd, Tb, Dy; hfac− = hexafluoroacetylacetonate; AcO− = acetate). The metal ions are triply bridged by two phenoxido oxygen atoms and by the acetato ligand (syn–syn bridging mode). Among all these compounds the FeIII–LnIII exchange interaction was found to be ferromagnetic (JFeGd = +1.004(4) cm−1; H = −JSFeSGd). The [FeIIIDyIII] derivative shows field-induced slow relaxation of the magnetization. The interpretation of the magnetic properties for the [FeIIIGdIII], [FeIIITbIII] and [FeIIIDyIII] is done through ab initio calculations. It was concluded that the temperature behavior of the relaxation time in the [FeIIIDyIII] derivative is due to dominant Orbach relaxation processes between states at the opposite sides and opposite heights of the blocking barrier. From this understanding, the relaxation mechanism for similar systems where a transition metal is in exchange coupling with a strong anisotropic lanthanide ion is elucidated, which could provide a strategy to synthesize other binuclear complexes with better magnetic properties.
Introduction
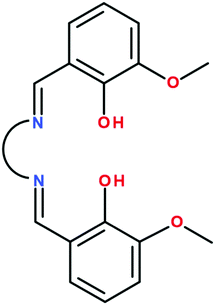
Oligonuclear heterometallic complexes, combining 3d and 4f metal ions, are intensively investigated in molecular magnetism.1 First of all, such compounds are useful models illuminating the factors that influence the nature and strength of the 3d–4f magnetic couplings. Then, numerous 3d–4f complexes show Single Molecule Magnet (SMM) behavior and emphasize the role played by the magnetic anisotropy of both metal ions, as well as of the 3d–4f exchange interaction in the slow relaxation of the magnetization phenomena.2 Theoretical and experimental studies indicate that the strength of the 3d–4f interaction has direct consequences on the quantum tunneling of magnetization (QTM).3 Concerning the FeIII–LnIII pair, numerous clusters with various nuclearities have been reported. Most of these compounds have been obtained by reacting iron(III) and lanthanide(III) salts with aminoalcohols.4 Dodecanuclear complexes, [FeIII6LnIII6], have been assembled by reacting pivalato iron(III) and lanthanide(III) precursors with phosphonic acids.5 Several [LnIIIFeIII3] tetranuclear complexes with trichloroacetato bridging ligands have been reported by Powell et al.6 A high-nuclearity cluster, [FeIII12SmIII4], the first Sm-based SMM, has been aggregated by benzoate ligands.7 Other FeIII–LnIII oligonuclear complexes have been obtained using homo- and heteroleptic cyanido metalloligands, ([FeIII(CN)6]3− and [FeIII(bipy)(CN)4]−).8 Tetranuclear cyanido-bridged [FeIII2LnIII2] molecular squares have been assembled from [FeIII{HB(pz)3}(CN)3]− and lanthanide ions carrying bidentate chelating ligands.9 By employing bis-calix[4]arene as a ligand, Brechin, Dalgarno et al. have obtained several heterometallic clusters, including a nonanuclear complex, [FeIII5GdIII4].10The number of binuclear [FeIIILnIII] complexes is limited to a few examples: (i) cyanido-bridged complexes resulting by attaching a [FeIII(CN)6]3− group to lanthanide ions coordinated by solvent molecules (H2O, DMF, DMSO) or other organic ligands;11 (ii) an [FeIIIDyIII] complex showing SMM behavior which results from the self-assembly process involving [FeIII(bpca)2]+ as a metalloligand and dysprosium(III) nitrate (bpca = bis(2-pyridylcarbonyl)amine);12 (iii) a tris-phenoxido bridged binuclear [FeIIIGdIII] complex synthesized from a bicompartmental ligand derived from o-vanillin and a tripodal amine.13 The Schiff-base bicompartmental ligands generated by o-vanillin, valXn2− (Scheme 1), have been widely employed to design strictly binuclear 3d–4f complexes, the 3d metal ion being in almost all cases divalent and occupies the small inner compartment.1a,14 Except the aforementioned [FeIIIGdIII] complex,13 no other binuclear 3d–4f complexes with a trivalent 3d metal ion and bicompartmental ligands are known. The main reason is that, in the step-wise synthetic process, the [MIII(valXn)]+ intermediate bears a positive charge. Electrostatic repulsion between the metalloligand and the lanthanide cations hinders the formation of the heteronuclear binuclear complexes. Using valXn2− ligands and FeIII and GdIII ions, it has been shown that, instead of binuclear complexes, tetranuclear [FeIII2GdIII2] species are assembled, the two {FeIII(valXn)LnIII} moieties being connected by an oxido bridge established between the two FeIII ions.15 In these compounds, the weak FeIII–GdIII exchange interaction is overwhelmed by the strong antiferromagnetic FeIII–O–FeIII coupling. Finally, we recall that a non-compartmental ligand, obtained by reacting o-vanillin with o-amino-phenol, leads to trinuclear [FeIII2LnIII] complexes.16 Herein we report on a new general synthetic approach that allows an easy access to binuclear FeIII–LnIII complexes.
Besides the new general synthetic approach, magnetic characterization of this first family of binuclear 3d–4f complexes with a trivalent 3d metal ion and bicompartmental ligands is also investigated both in experiments and by using a state-of-the-art ab initio method. Interestingly, we found that exchange interactions between metal ions in these compounds are all ferromagnetic. Dynamic magnetic susceptibility measurements also revealed that among these compounds, only [FeIIIDyIII] shows a field-induced slow relaxation of the magnetization. Based on ab initio calculations, physical insight into the electronic structure as well as relaxation mechanisms in this new family of FeIII–LnIII complexes will be presented, which not only elucidates the magnetic properties in this new family of complexes but also may provide a recommendation to design other 3d–4f complexes with better magnetic properties in the future.
Theoretical investigation of polynuclear compounds is usually performed using phenomenological models based e.g. on the parameterization of the on-site magnetic anisotropy and zero-field splitting and of the inter-site magnetic interactions.17–20 Another phenomenological method involves the description of the zero-field splitting of the ground state spin state of the polynuclear compound (e.g. ZFS of the ground S = 10 in the case of Mn12). Quantum thermodynamical methods allowing the simulation of the magnetic properties of large spin clusters are also commonly used.21–25 The latter methods require experimental determination of the ground state spin state from low-temperature magnetic measurements. Broken-Symmetry DFT calculations are commonly used for the description of the inter-site magnetic exchange.26–28 Usually, it provides reasonable values for the magnetic interaction. This method was further expanded to extract the anisotropic magnetic exchange interactions. Fully ab initio computational methods are scarcely applied for the description of the electronic structure and properties of polynuclear compounds, because of the computational difficulties involved in their application: (a) large size of the active space; (b) a large number of roots required to be computed and (c) difficulties in molecular orbital optimizations for such states, which prevent the required level of numerical accuracy from being obtained (<0.1 cm−1). For these reasons, most used electron correlation methods are applied to binuclear compounds.29 DMRG-based methods are used for describing large active spaces,30–33 but given the large number of roots required for the description of the spin–orbit coupling of lanthanides – their application for such compounds is yet limited.
To overcome the above computational difficulties, a semi-ab initio approach was proposed and successfully used for many cases.34–37 The proposed method involves (a) calculations of the on-site electronic structure and properties using high-level ab initio methods, (b) estimation of the inter-site magnetic exchange using the BS-DFT method,38 and (c) evaluation of the energy spectra and properties of the entire polynuclear compound using the data obtained at (a) and (b) with a fine-tuning of the magnetic exchange in order to describe the available magnetization data. This method was successfully used for the description of the magnetism in a series of polynuclear compounds and offers the best balance between the computational cost and accuracy.
Experimental
Materials
All starting materials were reagent grade and used without purification. The syntheses of [FeIII(valpn)(H2O)Cl]15b and [LnIII(hfac)2(Hhfac)(OAc)(H2O)2]39 (Ln = GdIII, TbIII, DyIII) have been carried out as described in the respective papers.Syntheses
Physical measurements
IR spectra were recorded on a JASCO FTIR 4100 spectrometer in the 4000–400 cm−1 range, with samples prepared as KBr pellets. The X-ray powder diffraction measurements were carried out on a Proto AXRD Benchtop using Cu-Kα radiation with a wavelength of 1.54059 Å in the range 5–35° (2θ). The absorption spectra were obtained on a JASCO V-670 spectrophotometer with solid sample accessory, in the 1800–250 nm range. Magnetic susceptibility measurements were performed on a Quantum Design SQUID MPMS-XL magnetometer at temperatures between 1.8 and 300 K. All data were corrected for the contribution of the sample holder and the diamagnetism of the samples estimated from Pascal’s constants.Crystal structure determination and refinement
X-Ray diffraction measurements for compounds 1, 2 and 3 were performed on a STOE IPDS II diffractometer operating with Mo-Kα (λ = 0.71073 Å) X-ray tube with graphite monochromator. The structures were solved by direct methods and refined by full-matrix least squares techniques based on F2. The non-H atoms were refined using anisotropic displacement parameters. Calculations were performed using the SHELX-2013 crystallographic software package. The structures were solved by direct methods using the SHELXS structure solution program. The H atoms attached to carbon were introduced in idealized positions using the riding model. A summary of the crystallographic data and the structure refinement for crystals 1–3 is given in Table 1. CCDC reference numbers: 1916564–1916566.†| Compounds | 1 | 2 | 3 |
|---|---|---|---|
| a R 1 = ∑||Fo| − |Fc||/∑|Fo|. b wR2 = [∑w(Fo2 − Fc2)2/∑w(Fo2)2]1/2; w = 1/[σ2(F02) + (aP)2 + bP] where P = [max(F02, 0) + 2Fc2]/3. | |||
| Formula | C31H25ClF12FeGdN2O10 | C31H25ClF12FeTbN2O10 | C31H25ClF12FeDyN2O10 |
| Molecular weight | 1062.08 | 1063.75 | 1067.33 |
| Temperature (K) | 293(2) | 293(2) | 293(2) |
| Crystal system | Monoclinic | Monoclinic | Monoclinic |
| Space group | P21/a | P21/a | P21/a |
| a (Å) | 16.9739(2) | 16.9716(2) | 16.9946(2) |
| b (Å) | 12.6044(3) | 12.5632(3) | 12.5891(3) |
| c (Å) | 18.5271(4) | 18.5399(4) | 18.5684(4) |
| β (deg) | 98.272(5) | 98.459(5) | 98.404(5) |
| V (Å3) | 3922.56(14) | 3910.03(14) | 3929.99(14) |
| Z | 4 | 4 | 4 |
| D calc (g cm−3) | 1.798 | 1.807 | 1.804 |
| F (000) | 2080 | 2084 | 2088 |
| Wavelength (Å) | 0.71073 | 0.71073 | 0.71073 |
| Final R1a, wR2b [I > 2σ(I)] | 0.0412, 0.0967 | 0.0420, 0.0924 | 0.0803, 0.1383 |
| R 1 , wR2b (all data) | 0.0618, 0.1093 | 0.0624, 0.1138 | 0.1762, 0.1913 |
| Goodness-of-fit on F2 | 1.023 | 1.111 | 1.130 |
| Largest peak in final difference (e Å−3) | −0.837, 0.762 | −1.332, 1.069 | −0.982, 0.856 |
Ab initio calculations
The ab initio calculations for each compound were carried out using CASSCF/RASSI-SO/SINGLE_ANISO approach implemented using the MOLCAS 8.2 program package.40 The atomic coordinates for each compound were taken from structural data. The ANO-RCC-VDZP basis set was used for all atoms except C, F and H, for which the ANO-RCC-VDZ basis set was employed. The active space in the CASSCF calculations included 7 electrons in 7 orbitals for GdIII, 8 electrons in 7 orbitals for TbIII, 9 electrons in 7 orbitals for DyIII and 5 electrons in 5 orbitals for FeIII (4f orbitals of GdIII, TbIII, DyIII and 3d orbital of FeIII). On the basis of the resulting spin–orbit multiplets, g-factors and the orientation of the magnetic axes of doublet states at the metal sites, as well as the zero-field splitting tensors (ZFS parameters and the orientation of the anisotropy axes) of GdIII, TbIII, and DyIII centres three complexes have been calculated ab initio within the CASSCF/RASSI/SINGLE_ANISO approach using the MOLCAS 8.2 package (see the ESI† for the details).34,40–45 Meanwhile, the dipolar coupling parameters were calculated directly from the ab initio results for the single-ion anisotropy of individual metal sites. Exchange coupling parameters were then determined by fitting the experimental magnetic susceptibility and magnetisation data using the POLY_ANISO module of the MOLCAS 8.2 package (see the ESI† for the details).34,40–45Results and discussion
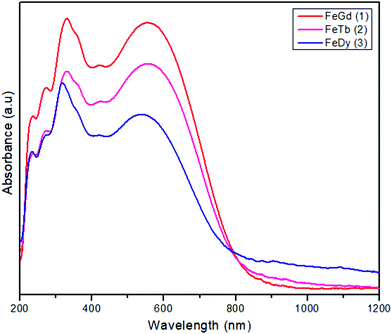
The new compounds, [FeIIILnIII(valpn)(hfac)2(OAc)Cl], have been obtained by reacting two neutral precursors: [FeIII(valpn)(H2O)Cl]15b and [LnIII(hfac)2(Hhfac)(OAc)(H2O)2].39 The hfac− ligands increase the Lewis acidity of the LnIII ions, facilitating their interaction with the oxygen atoms from the open compartment of the iron(III) precursor. Moreover, the reaction between two neutral precursors will favor the assembly of the desired heterobinuclear complexes. For this study, we have chosen the following lanthanide ions: GdIII1, TbIII2, and DyIII3. This synthetic approach appears to be successful. It clearly indicates the principles to be followed to obtain strictly binuclear [FeIIILnIII] complexes in a rational manner, paving the way for other syntheses. The diffuse reflectance spectra of the three compounds (Fig. 1) show the characteristic ligand-to-metal charge transfer band for FeIII–phenoxido systems, which obscure the spin forbidden, and therefore weak, d–d bands of the [FeIIIN2O3Cl] chromophore. (1: 554, 2: 555, 3: 535 nm). The purity of the crystalline phases was proved by powder X-ray diffraction (Fig. S1, ESI†).Description of the structures
Compounds 1–3 are isostructural, therefore only the crystal structure of the [FeIIIGdIII] derivative will be discussed here (Fig. 2). The metal ions are triply bridged by two phenoxido oxygen atoms and by the acetato ligand (syn–syn bridging mode). The FeIII ion is hosted into the inner compartment, being coordinated by two nitrogen and two oxygen atoms from the organic ligand (Fe–N1 = 2.079(5); Fe–N2 = 2.091(5); Fe–O1 = 1.975(4); Fe–O2 = 1.978(3) Å); and by a chlorido ligand and an acetato oxygen atom into the apical positions (Fe–O5 = 2.050(4); Fe–Cl = 2.306(15) Å), with an octahedral geometry. The LnIII ion shows a coordination number of 9, being coordinated only by oxygen atoms (4 from the two hfac− ligands, 4 from the open compartment of the Schiff base, and one from the bridging acetato ligand) with distances varying between 2.373(4) and 2.628(4) Å). The coordination geometry of GdIII can be described best as a muffin (MFF-9)-like type with a CShM value of 0.585 (Table S1, ESI†).46 The intramolecular Fe⋯Gd distance is 3.449 Å, while the shortest intermolecular Fe⋯Fe distance is 7.673 Å; the shortest intermolecular Gd⋯Gd distance is 10.296 Å and the shortest intermolecular Fe⋯Gd distance is 9.534 Å. The values of the two Gd–O(phenoxido)–Fe angles are Fe–O1–Gd = 103.41(14) and Fe–O2–Gd = 103.87(13)°. Selected bond distances and angles for the three compounds are collected in Table 2. We recall that the structural motif is similar to the one described for [MIILnIII(valXn)(hfac)2(OAc)] complexes,39 but in our case an additional chlorido ligand is necessary in order to obtain a neutral species.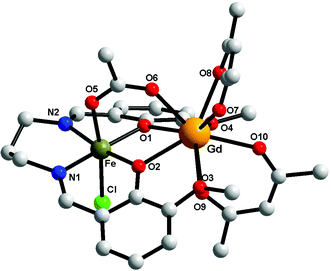 | ||
| Fig. 2 Perspective view of complex 1. For clarity the hydrogen and fluorine atoms have been removed. | ||
| Compounds | Distances (Å) | Angles (°) | ||||
|---|---|---|---|---|---|---|
| 1 | Gd–O10 | 2.362(4) | O10–Gd–O7 | 74.77(15) | O1–Fe–O5 | 92.37(14) |
| Gd–O7 | 2.365(4) | O10–Gd–O6 | 141.49(14) | O2–Fe–N1 | 88.93(19) | |
| Gd–O6 | 2.365(4) | O7–Gd–O6 | 70.67(14) | O1–Fe–N1 | 172.40(18) | |
| Gd–O8 | 2.373(4) | O10–Gd–O8 | 80.72(14) | O5–Fe–N1 | 84.02(17) | |
| Gd–O1 | 2.390(3) | O7–Gd–O8 | 72.48(13) | O2–Fe–N2 | 171.62(17) | |
| Fe–O1 | 1.978(3) | O6–Gd–O8 | 73.22(13) | O1–Fe–N2 | 88.83(17) | |
| Fe–O5 | 2.050(4) | O10–Gd–O1 | 137.75(13) | O5–Fe–N2 | 86.71(16) | |
| Fe–N1 | 2.079(5) | O7–Gd–O1 | 143.26(13) | N1–Fe–N2 | 97.6(2) | |
| Fe–N2 | 2.091(5) | O6–Gd–O1 | 72.79(12) | O2–Fe–Cl | 95.34(11) | |
| Fe–Cl | 2.3062(15) | O8–Gd–O1 | 93.58(12) | O1–Fe–Cl | 94.32(11 | |
| 2 | Tb–O10 | 2.344(4) | O10–Tb–O7 | 74.43(16) | O1–Fe–O2 | 83.95(15) |
| Tb–O7 | 2.350(4) | O10–Tb–O8 | 80.31(16) | O1–Fe–O5 | 92.54(15) | |
| Tb–O8 | 2.352(4) | O7–Tb–O8 | 73.00(15) | O2–Fe–O5 | 88.59(16) | |
| Tb–O6 | 2.352(4) | O10–Tb–O6 | 141.12(15) | O1–Fe–N1 | 172.50(19) | |
| Tb–O1 | 2.381(4) | O7–Tb–O6 | 70.90(15) | O2–Fe–N1 | 89.2(2) | |
| Fe–O2 | 1.975(4) | O8–Tb–O6 | 73.27(15) | O5–Fe–N1 | 84.20(18) | |
| Fe–O5 | 2.055(4) | O10–Tb–O1 | 137.62(14) | O1–Fe–N2 | 88.97(18) | |
| Fe–N1 | 2.078(5) | O7–Tb–O1 | 143.83(14) | O2–Fe–N2 | 171.39(17) | |
| Fe–N2 | 2.081(5) | O8–Tb–O1 | 93.67(14) | O5–Fe–N2 | 86.82(17) | |
| Fe–Cl | 2.3052(16) | O6–Tb–O1 | 73.09(14) | N1–Fe–N2 | 97.6(2) | |
| 3 | Dy–O9 | 2.318(13) | O9–Dy–O6 | 141.4(4) | O2–Fe–N1 | 171.2(5) |
| Dy–O6 | 2.336(11) | O9–Dy–O7 | 74.6(5) | O1–Fe–N1 | 88.5(5) | |
| Dy–O7 | 2.344(11) | O6–Dy–O7 | 70.7(4) | N2–Fe–N1 | 98.2(6) | |
| Dy–O8 | 2.348(11) | O9 Dy–O8 | 80.5(4) | O5–Fe–N1 | 84.6(5) | |
| Dy–O2 | 2.355(10) | O6–Dy–O8 | 73.9(4) | O2–Fe–Cl | 95.1(3) | |
| Fe–O1 | 1.992(10) | O7–Dy–O8 | 73.1(4) | O1–Fe–Cl | 96.5(3) | |
| Fe–N2 | 2.059(13) | O9–Dy–O2 | 137.6(4) | N2–Fe–Cl | 90.1(4) | |
| Fe–O5 | 2.065(11) | O6–Dy–O2 | 73.1(3) | O5–Fe–Cl | 172.8(4) | |
| Fe–N1 | 2.081(14) | O7–Dy–O2 | 143.6(4) | N1–Fe– Cl | 89.7(4) | |
| Fe–Cl | 2.297(5) | O8–Dy–O2 | 93.2(4) | O2–Fe–Dy | 41.6(3) | |
Magnetic properties
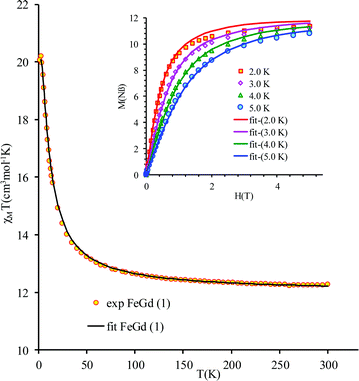
The new binuclear compounds are excellent candidates for magnetostructural correlations, which are scarce for the phenoxido-bridged FeIII–LnIII pairs. Let us start with compound 1. The temperature dependence of χMT for this compound is shown in Fig. 3. As can be seen, the room temperature value of the χMT product (12.26 cm3 mol−1 K) is close to the one of two magnetically independent FeIII and GdIII ions (12.25 cm3 mol−1 K, considering gFe = gGd = 2.00). Below 100 K, χMT increases abruptly and reaches 20.05 cm3 mol−1 K at 2 K, a value that corresponds to S = 12/2 for the ground state, resulting from the ferromagnetic interaction between FeIII and GdIII ions. The best fit to the data, using the Hamiltonian | (1) |
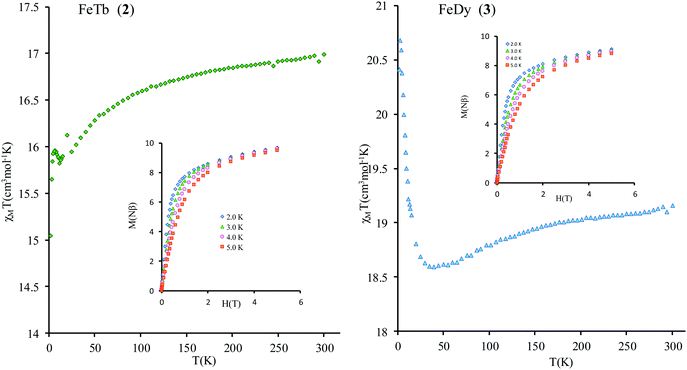
Compounds 2 and 3 contain strongly anisotropic TbIII and DyIII ions, which have been chosen in order to induce the slow relaxation of the magnetization phenomenon. The χMT vs. T curves for 2 and 3 are shown Fig. 4. The corresponding room-temperature values 16.91 and 19.16 cm3 mol−1 K are slightly higher than the sum of contributions of isolated magnetic ions in these complexes, 16.2 and 18.4 cm3 mol−1 K, respectively (a straightforward calculation for gFe = 2.00, SFe = 5/2; gTb = 3/2, JTb = 6; gDy = 4/3, JDy = 15/2 can be done following ref. 47). Given small values of exchange parameters in these compounds (vide infra) and the fact that the magnetic susceptibility for individual magnetic centers in complexes are smaller than for corresponding isolated metal ions due to zero-field (crystal-field) splitting of their magnetic multiplets, the obtained higher values of room-temperature magnetic susceptibility suggest a rescaling down of the magnetic data for all complexes (see the ESI†).
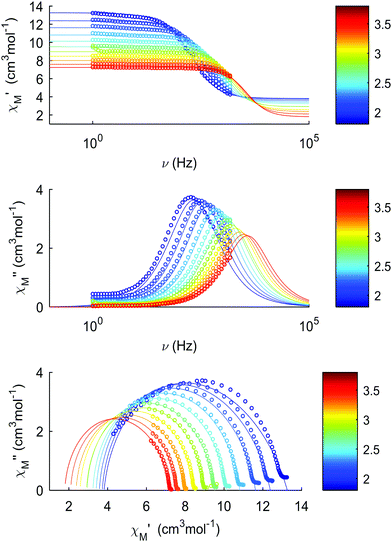
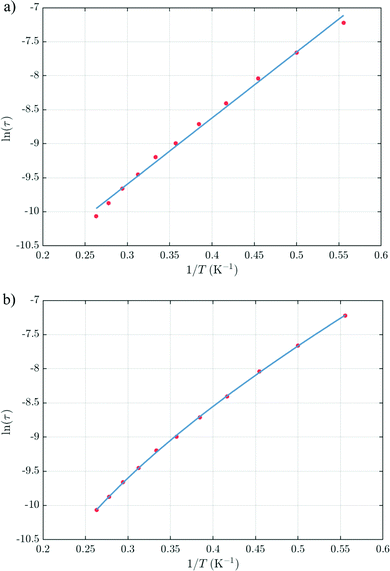
The thermal dependences of χMT are similar: (i) a decrease from room temperature down to ca. 20 K, which is due to the depopulation of the Stark sublevels of the LnIII ions; and (ii) an increase below 20 K, indicating the ferromagnetic coupling of the FeIII and LnIII ions. The M vs. H curves (insets to Fig. 4) confirm the expected magnetic anisotropy of these systems. Compounds 2 and 3 do not show frequency dependence of the magnetic susceptibility in zero static field, suggesting fast relaxation via QTM. The in-phase and out-of-phase magnetic susceptibilities of both compounds have been recorded at various static fields (0–3000 Oe), at 2 K (Fig. S2, ESI†), in order to find the optimal value of the field for the observation of slow relaxation of magnetization. For the terbium derivative, 2, only weak frequency dependences of χ′ and χ′′ at 2500 Oe are observed (Fig. S3, ESI†). Conversely, the ac magnetic measurements indicate that the dysprosium derivative, 3, (Fig. 5 and Fig. S4, Table S2, ESI†) shows slow relaxation of the magnetization under an applied static field (1000 Oe). Arrhenius plot of ln(τ) vs. 1/T for compound 3 (Fig. 6) reveals that an approximately linear profile represents relatively well the relaxation curve, which indicates that the Orbach mechanism is dominant at an applied dc field. The corresponding effective blocking barrier to magnetization reversal from the fitting is around Ueff ≈ 9.72 K if only the Orbach process is used and Ueff ≈ 8.39 K if the Raman process is included. Detailed theoretical analyses of the magnetic relaxation behavior of all three complexes will be discussed in the following section.
Theoretical analysis
From ab initio results for 1, which are listed in Tables S6–S9 and S20, S21 and the corresponding low-lying energy levels of each single metal ion plotted in Fig. S5–S10 (ESI†), as well as zero field splitting parameters D and E for FeIII shown in Table 3, we see that the obtained ZFS splitting on GdIII and FeIII sites are relatively small, which is not surprising given that these ions are almost isotropic. In agreement with the fitted D and E parameters for FeIII reported above, a negligible value for the rhombic anisotropy parameter E is also observed. Ab initio calculations for 1 also reveal that the ZFS parameter D on FeIII appears to be considerably smaller than the fitted one using the phenomenological model in eqn (1). The reason for this discrepancy is that in the latter no ZFS on GdIII was taken into account, which was compensated by the artefactual increase of ZFS on FeIII in order to fit the magnetic data. Another drawback of a pure phenomenological model is the opposite sign of D for FeIII compared to the ab initio results. This is a known problem of a weak sensitivity of powder magnetic susceptibility to the sign of D, mentioned already by Kahn,47 which makes it difficult to extract the sign of D from the fitting of magnetic data.| Compound | D | E |
|---|---|---|
| [FeIIIGdIII] | 0.2034 | 0.0109 |
| [FeIIITbIII] | 0.2113 | 0.0103 |
| [FeIIIDyIII] | 0.2129 | 0.0105 |
To elucidate the magnetic properties of the [FeIIILnIII] series, we simulate the thermal dependences of χMT as well as the M vs. H curves in Fig. S10 and S11 (ESI†), for compound 1. With an introduction of the intermolecular interaction zJ = −0.0007 cm−1, our ab initio results show that the simulated magnetic data for 1 are in good agreement with experiment. From the fitting, we also obtain the ferromagnetic exchange coupling J = 0.898 cm−1, which is consistent with the parameter used in the phenomenological model in eqn (1) but is slightly different with respect to the BS-DFT result (J = 0.710 cm−1).
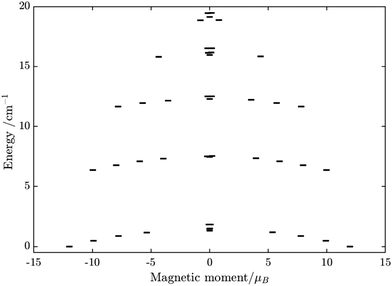
Having all ZFS calculated, in Fig. 7, we show the low-lying spectrum of exchange/dipolar multiplets of the [FeIIIGdIII] complex resulting from interaction between the ground multiplet S = 5/2 of the FeIII site and S = 7/2 of the GdIII site (6 × 8 = 48 exchange states). These states subdivide into several groups of levels separated by the exchange interaction. The states in each such group correspond to a total spin Stot = SFe + SGd (Stot = 1,…6) with total number of states being equal to 2Stot + 1 (Table S20, ESI†). In each group, these states basically split again into Ising doublets via a weaker ZFS interaction on FeIII and GdIII ions. The multiplet arising from the ground manifold of 13 states (Stot = 6) spread over an energy less than 2 cm−1; therefore, they are all populated at the investigated temperatures. Given that many of these doublets display a tunnelling gap as large as 10−2 cm−1 (Table S20, ESI†), no blocking of magnetization relaxation can be expected. This is in full agreement with the ac susceptibility measurements showing that 1 is not a SMM.
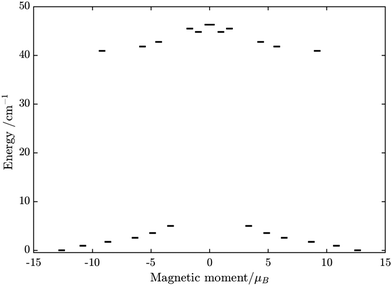
Substitution of the isotropic GdIII ion for an anisotropic TbIII ion with oblate-shape f-electron charge cloud48 in complex 2 indeed increases the axiality of the crystal field on the lanthanide ion. This is clearly shown in Table S10 and Fig. S7 (ESI†) where the energy gap between the electronic ground and first excited doublet corresponding to the lanthanide center substantially changes from ca. 0.2 cm−1 to ca. 40 cm−1. This increase in the axiality effectively differentiates nature of the energy splitting in complex 2 from 1. In particular, the energy diagram changes from subgroups characterized by the total spin SFe + SGd in 1 to subgroup of pseudospin 1/2 (corresponding to each electronic doublet of TbIII ion) in exchange coupling with SFe in 2 as seen in Fig. 8. It should also be mentioned that due to no change in the ligand, this substitution results in little effect on the FeIII center (see Tables S12, S13 and Fig. S8, ESI†).
We further calculated the magnetic susceptibility and field-dependent magnetization for complex 2 and showed them in Fig. S12 and S13 (ESI†), respectively. An intermolecular antiferromagnetic exchange coupling, zJ = −0.027 cm−1, was introduced to give a better fit to the χMT curve of 2 at low temperatures.34,41,42 It is noted that the ferromagnetic exchange parameters J = 0.310 cm−1 obtained from fitting of χMT is of the same order of magnitude with the one from BS-DFT calculation but ca. 3 times smaller (0.85 cm−1 in Table S18, ESI†). This difference is understandable considering the low accuracy of the BS-DFT methodology for exchange parameter calculation.
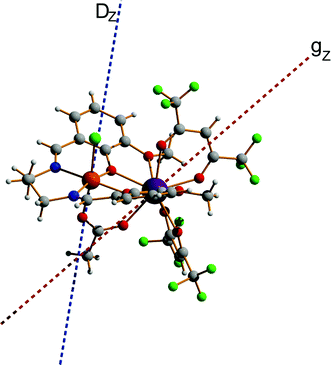
Using the exchange parameter obtained from fitting, the low-lying manifolds of exchange/dipolar spin–orbit states of 2, resulting from the magnetic interaction of the ground S = 5/2 of FeIII centre with the ground non-Kramers doublet of the TbIII ion (lower manifold of 12 states) and with the first excited doublet (higher manifold of 12 states) lying ca. 40 cm−1 higher are plotted in Fig. 8. The multiplet states in each manifold group form Kramers doublets separated by the FeIII–TbIII exchange interaction and the ZFS interaction at the FeIII site. At low temperature, the relaxation occurs mostly in the lowest multiplet of 12 states, which due to the axiality of TbIII ions in 2, can be considered in an effective manner by the exchange interaction between the ground doublet of the TbIII ion (pseudospin 1/2) and the FeIII ion (spin 5/2) in the crystal field.49 However, as the ZFS of the FeIII ion is weak (see Table S12, ESI†), the easy magnetic axis of the TbIII ions ground doublet and the ZFS of FeIII ion is also non-colinear (about 27.2°, Fig. 9),49–52 and the exchange interaction between TbIII and FeIII ions (see Table S18, ESI†) is small, each eigenstate of the [FeIIITbIII] complex will accordingly be a strong mixture of different mFe states. This results in large transversal components of the g-tensor of doublets of the complex (see Table S23, ESI†) as well as large transition matrix elements between the eigenstates of 2, which can be seen in Fig. 10via the relative transition conductance45,49–51 between localized states |i〉 and |j〉. Consequently, relaxation in [FeIIITbIII], despite being slower than in [FeIIIGdIII] due to the axiality of the TbIII ion, is still overly fast. Specifically, at zero applied field, due to the large values of the transversal components of the g-tensor, even the internal field is able to open large tunnelling splitting gaps and accordingly accelerates the magnetization relaxation. At large applied field, although relaxation via QTM is suppressed, the large transition conductance, and accordingly large transition rates, between states with magnetic moments of opposite sign (see Fig. 10) are still sufficient to result in a fast relaxation of magnetization.52 This explains why some changes to the out-of-phase susceptibility (see Fig. S3, ESI†) can be observed at high magnetic field, but no slow relaxation is detected.
Similarly, the ab initio fragments calculations for complex 3 were performed. The spin-orbital energy levels and g tensors for each metal center in the crystal field are exhibited in Tables S14–S17, S24, S25 and Fig. S9, S10 (ESI†). As can be seen, while the ZFS splitting of FeIII is similar to those in the above two complexes, the substitution from TbIII to DyIII further increases the axiality of the lanthanide center. In particular, the energy gap between the ground doublet and the first excited doublet of the DyIII center in 3 is almost double of the TbIII center in 2 (70 cm−1vs. 40 cm−1). Other excited doublets of 3 also have a larger energy than corresponding ones in 2. Together with the fact that DyIII is a Kramer ion, even without experiment, we can also guess that a slower relaxation than 2 in 3 is likely and may be observed.
Ab initio calculations of the magnetic susceptibility and field-dependent magnetization for the [FeIIIDyIII] complex are also shown in Fig. S14 and S15 (ESI†), respectively. To have a good agreement with experiment, an intermolecular antiferromagnetic exchange coupling, zJ = −0.023 cm−1 was introduced to describe the bending down of the χMT curve at low temperature.34,41,42
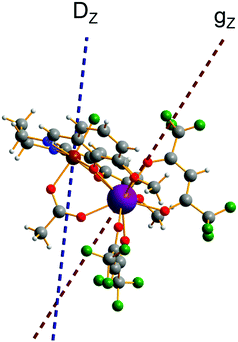
The fitting process done using the POLY_ANISO package (MOLCAS 8.2) gives a value of J = 0.452 cm−1, which is about 45% larger than J in 2. This relative difference of J between 2 and 3 is also verified by BS-DFT calculation (see Table S18, ESI†). It should also be noted that in complexes 1, 2, and 3, all ab initio calculations show that the exchange interaction between LnIII and FeIII ions is ferromagnetic, which is well supported by the BS-DFT calculations (see Table S18, ESI†). Meanwhile, the magnetic dipolar interaction (Table S19, ESI†) overall counteracts the ferromagnetic exchange interaction. However, in the [FeIIIGdIII] compound, this effect is much weaker than in [FeIIIDyIII], where it reduces the effect of ferromagnetic exchange by ca. 1/3. This is explained by a different orientation of the spins (magnetic moments) of Ln and Fe sites relatives to each other and relative to the Ln–Fe axis in the complexes in 1–3, with the easy magnetic axis of the DyIII ion ground doublet and the ZFS of FeIII also being non-collinear (at an angle of 44.4°, see Fig. 11).
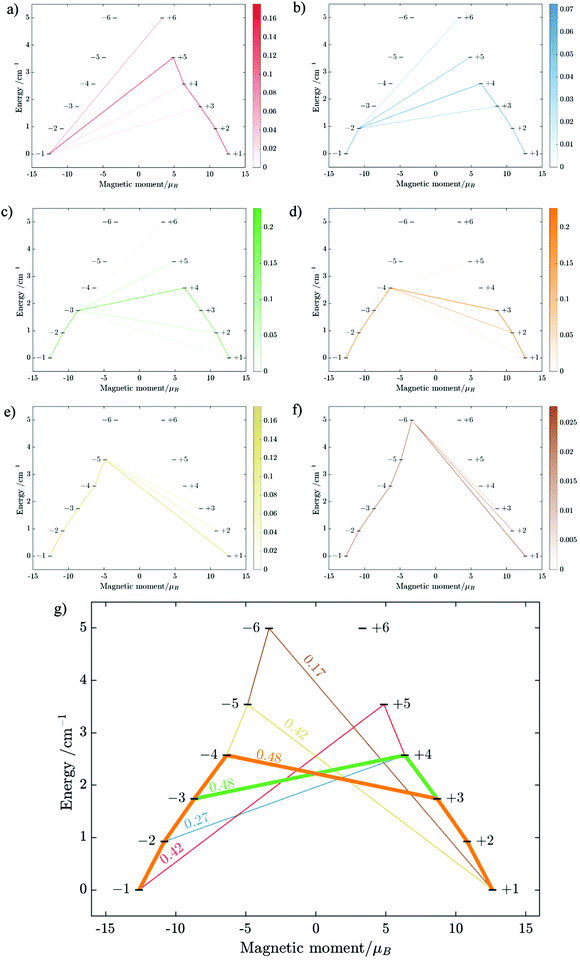
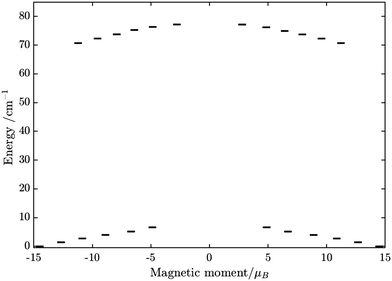
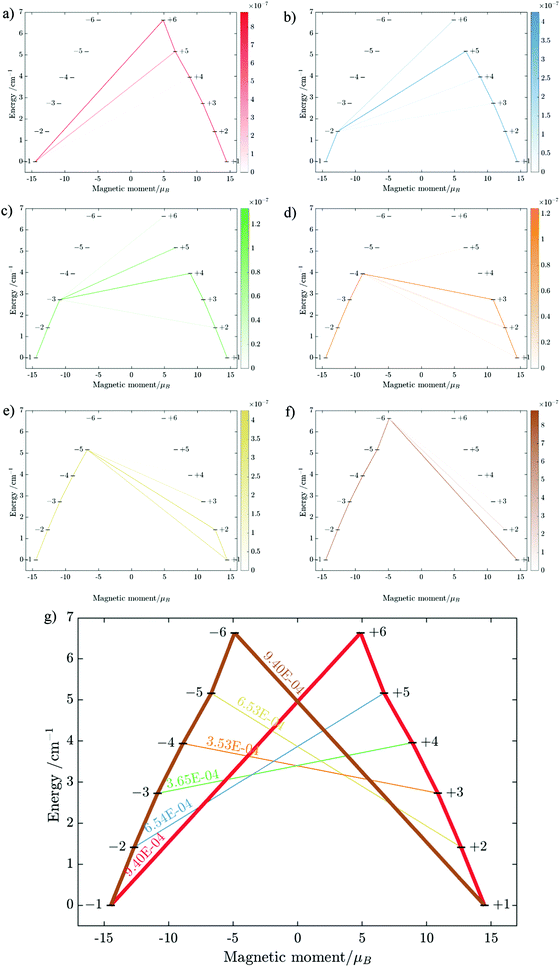
Using fitting value of J, the energy spectrum of the complex is calculated and shown in Fig. 12 with the low-lying manifolds of exchange/dipolar spin–orbit states resulting from the magnetic interaction of the ground S = 5/2 of FeIII centre with the ground KD of the DyIII ion (lower manifold of 12 states) and the first excited KD (higher manifold of 12 states) lying ca. 70 cm−1 higher, which is larger than 2 due to DyIII being more axial than the TbIII ion (see Tables S10, S11 and S14, S15, ESI†). Relaxation in 3 also occurs mainly within the lowest exchange manifold (of 12 states) at low temperature. Due to ca. 45% stronger exchange interaction between DyIII and FeIII ions (see Table S18, ESI†), higher axiality and larger magnetic moment of the DyIII ion, the mixture of different mFe in each eigenstate corresponding to the lower manifold of [FeIIIDyIII] is significantly lower.49,52 This leads to much smaller relative transition conductance, and accordingly much smaller transition rates between states having different signs of magnetic moments in 3 compared to 2, which can be seen from Fig. 10 and 13via the relative transition conductance calculations. Indeed, these matrix elements for 3 are at least two orders of magnitude smaller than 2, which explains why under an applied field where QTM is suppressed, 3 relaxes much slower than 2 (see Fig. S2 and S3, ESI†) and is thus observable via the maximum in frequency-dependent out-of-phase susceptibility. However, at zero applied field, since the mixture of different mFe in eigenstates of 3 is still not sufficiently small due to the weak crystal field of the FeIII ion, fairly decent tunnelling splitting gaps (see Table S24, ESI†) within (quasi-) doublets of 3 are still open, which speed up the relaxation via the QTM process between states with opposite signed magnetic moments49,52,55 (left and right states in Fig. 13).
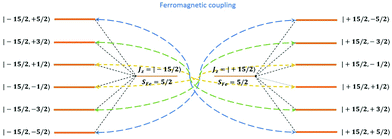
From above, we have explained why the magnetization relaxation in 3 is slower than 2, which is slower than 1. A summary of the difference between these three binuclear complexes is also provided in Table 4. Since only slow relaxation is observed in 3, our next task is finding its dominant relaxation path and accordingly the effective blocking barrier. This can be done by first noticing that the exchange interaction splits the energy spectrum so that |−m〉 and |+(7 − m)〉 in Fig. 13 having approximately the same contribution of z-axis spin projection component of FeIII spin (see Fig. 14 for a depiction of the splitting of the energy spectrum in 3 assuming that there is no involvement of the crystal field in the FeIII ion). Accordingly, those transitions between |−m〉 and |+(7 − m)〉 are favoured as flipping one spin is much easier than two spins at the same time (coloured lines with arrow in Fig. 14). This is demonstrated in Fig. 13 for 3 where the relative transition conductance, and accordingly the transition rate, between states |−m〉 and state |+(7 − m)〉 is always fastest comparing to between |−m〉 and other |+n〉. Additionally, from Fig. 13g, the calculated data for the relative transition conductance also show that despite some contributions from other relaxation paths (|±2〉 to |∓5〉 and |±3〉 to |∓4〉), the dominant relaxation path is indeed from |±1〉 to |∓6〉. This corresponds to the Orbach relaxation process with a blocking barrier of approximately 9.54 K (6.63 cm−1), which is in excellent/good agreement with the fitted one 9.72 K from experimental data (see Fig. 6a) if only the Orbach process is taken into consideration, or 8.39 K (see Fig. 6b) if the Raman process is also included. This agreement validates our suggested mechanism for the relaxation in 3.
| FeIIIGdIII | FeIIITbIII | FeIIIDyIII | |
|---|---|---|---|
| ZFS on FeIII | Small | Small | Small |
| ZFS on LnIII | Small | Large | Largest |
| Order of interactions | H Gd–FeEx > HGdCF | H TbCF > HTb–FeEx > HFeCF | H DyCF > HTb–FeEx > HFeCF |
| (Ex – Exchange, CF – Crystal field) | H Gd–FeEx > HFeCF | ||
| Ground multiplet (relaxation at low T occurs here) | S total = 6 13 levels |
![[S with combining tilde]](https://www.rsc.org/images/entities/i_char_0053_0303.gif) Tb = 1/2, SFe = 5/2, 12 levels
Tb = 1/2, SFe = 5/2, 12 levels |
![[S with combining tilde]](https://www.rsc.org/images/entities/i_char_0053_0303.gif) Dy = 1/2, SFe = 5/2, 12 levels
Dy = 1/2, SFe = 5/2, 12 levels |
| Exchange constant FeIII–LnIII (cm−1) | 0.898 | 0.310 | 0.452 |
| Axiality of the ground multiplet | Low | High | Highest |
| Relaxation at zero field | Fast, not observable. | Fast, not observable. | Fast, not observable. |
| Main reason | Weak ZFS on FeIII and isotropic LnIII ion → low axiality, large tunneling splittings, strong spin-phonon coupling. | Weak ZFS on FeIII, weak FeIII–TbIII exchange interaction and non-collinearity between easy magnetic axis of TbIII ground doublet and ZFS on FeIII → large spin-phonon coupling and fast QTM | Weak ZFS on FeIII → fast QTM |
| Relaxation under an applied field | Fast, not observable. | Fast, not observable. | Slower, observable |
| Main reason | Weak ZFS on FeIII and isotropic LnIII ion → low axiality, strong spin-phonon coupling. | Weak ZFS on FeIII, weak FeIII–TbIII exchange interaction and non-collinearity between easy magnetic axis of TbIII ground doublet and ZFS on FeIII → strong spin-phonon coupling. | Stronger FeIII exchange interaction, higher axiality → weaker spin-phonon coupling. |
| U eff | Not applicable | Not applicable | From lowest to highest energy level of the ground multiplet at low T |
From above analyses on the physics in complex series [FeIIILnIII], a generalization for similar systems where a transition metal is in exchange coupling with the ground doublet of a strong anisotropic lanthanide ion can also be made. In particular, due to the exchange interaction, the energy spectrum of these complexes will be divided into multiple manifolds where each one effectively arises from exchange coupling between each doublet of the anisotropic lanthanide ion and the zero-field-split energy spectrum of the transition metal ion. Relaxation in these systems at low temperatures will then occur mainly in the lowest manifold of the 2 × (2Stransition−metal−ion + 1) energy levels. In general, for these systems under an applied field, the dominant relaxation path, and accordingly the effective blocking barrier, will depend on the competition between relaxation channels connecting states with the same dominant z-component of the transition metal ion spin (see Fig. 14). On the other hand, tunnelling splitting in these systems, which plays an important role in relaxation at zero field, will depend on the mixing of different z-components of the transition metal ion spin in the localized states,52 hereinafter referred to as “pureness” and thus depends strongly on the rhombic anisotropy parameter E of the crystal field of the transition metal ion, the magnitude of the exchange constant, the collinearity of the easy magnetic axis of the lanthanide ion's ground doublet and one of the ZFS of the transition metal ion, and to some degree the spin number of the lanthanide ion.50–57 Specifically, a weaker E, will not only decrease the tunnelling splitting gaps but also improve the “pureness” of the eigenstates on the opposite sides of the potential wells and accordingly lower the transition rate between states with different dominant z-component contributions, e.g. |−m〉 and |n ≠ +(7 − m)〉 in 3 (see Fig. 14). Meanwhile, a strong exchange interaction and collinearity of the axes of lanthanide ion's ground doublet and transition metal's ZFS, will further strengthen the axiality of the complex's eigenstates.50–54 All these effects are in a synergy to help reduce relaxation time. Thus, a system with a large J, a small E, and collinearity between easy magnetic axes of lanthanide's ion and ZFS of transition metal ion will highly likely show a slow relaxation of magnetization.
Conclusions
We presented a new synthetic approach allowing for an easy access to binuclear FeIII–LnIII complexes. Applying this methodology, three new isostructural complexes, [FeIIILnIII(valpn)(hfac)2(OAc)Cl] (Ln = Gd, Tb, Dy; hfac− = hexafluoroacetylacetonate; AcO− = acetate), have been synthesized and thoroughly investigated. This strategy can be extended towards other 3d–4f complexes containing trivalent 3d metal ions. It was shown that only the third, [FeIIIDyIII] complex 3 exhibits SMM behavior within the investigated frequency domain of ac susceptibility, which was rationalized by ab initio analysis. In particular, ab initio analysis revealed that the temperature behavior of the relaxation time is due to the Orbach relaxation processes between the states on the opposite sides and opposite heights of the blocking barrier, which become dominant in a sufficiently strong applied magnetic field (Hdc = 800 Oe), when the QTM is sufficiently suppressed. Our theoretical analyses not only elucidated the mechanism of the relaxation of magnetization in this series of binuclear complexes, but also shed light on the possible relaxation mechanism in similar systems where a transition metal is in exchange coupling with the ground doublet of a strong anisotropic lanthanide ion. From this understanding, similar systems with better magnetization relaxation may be developed in the future.Conflicts of interest
There are no conflicts to declare.Acknowledgements
Financial support from the UEFISCDI (project number PN-III-P1-1.1-TE-2016-1633) and from The Research Institute of the University of Bucharest (ICUB) is gratefully acknowledged. D. L. gratefully acknowledges the Natural Science Basic Research Program of Shaanxi (program no. 2020JQ-136), the “Fundamental Research Funds for the Central Universities” and the Key Research and Development Program of Shaanxi Province (2020GXLH-Z-027, 2020GXLH-Z-029). L. T. A. H. and L. U. acknowledge the financial support from the research grants of the National University of Singapore R-143-000-A65-133 and R-143-000-A80-114. Computational resources from NSCC (ASPIRE-1, grant 11001278) were used for this study. This work was supported by the Distinguished Scientist Fellowship Program (DSFP) of King Saud University, Riyadh, Saudi Arabia.References
- (a) M. Andruh, J.-P. Costes, C. Diaz and S. Gao, Inorg. Chem., 2009, 48, 3342 CrossRef PubMed; (b) M. Sakamoto, K. Manseki and H. Ō.nse, Coord. Chem. Rev., 2001, 219–221, 379 CrossRef; (c) C. Benelli and D. Gatteschi, Chem. Rev., 2002, 102, 2369 CrossRef PubMed.
- (a) R. Sessoli and A. K. Powell, Coord. Chem. Rev., 2009, 253, 2328 CrossRef; (b) K. Liu, W. Shi and P. Cheng, Coord. Chem. Rev., 2015, 289–290, 74 CrossRef; (c) H. L. C. Feltham and S. Booker, Coord. Chem. Rev., 2014, 276, 1 CrossRef; (d) L. Rosado Piquer and E. C. Sañudo, Dalton Trans., 2015, 44, 8771 RSC.
- See, for example: (a) T. Gupta, M. F. Beg and G. Rajaraman, Inorg. Chem., 2016, 55, 11201 CrossRef PubMed; (b) L. Ungur, M. Thewissen, J.-P. Costes, W. Wernsdorfer and L. F. Chibotaru, Inorg. Chem., 2013, 52, 6328 CrossRef PubMed; (c) J.-W. Yang, Y.-M. Tian, J. Tao, P. Chen, H.-F. Li, Y.-Q. Zhang, P.-F. Yan and W.-B. Sun, Inorg. Chem., 2018, 57, 8065 CrossRef PubMed.
- See, for example: (a) G. Peng, G. E. Kostakis, Y. Lan and A. K. Powell, Dalton Trans., 2013, 42, 46 RSC; (b) A. Baniodeh, I. J. Hewitt, V. Mereacre, Y. Lan, G. Novitchi, C. E. Anson and A. K. Powell, Dalton Trans., 2011, 40, 4080 RSC; (c) A. M. Ako, V. Mereacre, R. Clérac, I. J. Hewitt, Y. Lan, C. E. Anson and A. K. Powell, Dalton Trans., 2007, 5245 RSC; (d) J. W. Sharples and D. Collison, Coord. Chem. Rev., 2014, 260, 1 CrossRef PubMed.
- E. Moreno Pineda, F. Tuna, Y.-Z. Zheng, S. J. Teat, R. E. P. Winpenny, J. Schnack and E. J. L. McInnes, Inorg. Chem., 2014, 53, 3032 CrossRef PubMed.
- V. Mereacre, D. Prodius, C. Turta, S. Shova, G. Filoti, J. Bartolomé, R. Clérac, C. E. Anson and A. K. Powell, Polyhedron, 2009, 28, 3017 CrossRef.
- Y.-F. Zeng, G.-C. Xu, X. Hu, Z. Chen, X.-H. Bu, S. Gao and E. C. Sañudo, Inorg. Chem., 2010, 49, 9734 CrossRef PubMed.
- (a) A. Figuerola, J. Ribas, M. Llunell, D. Cassanova, M. Maestro, S. Alvarez and C. Diaz, Inorg. Chem., 2005, 44, 6939 CrossRef PubMed; (b) B. Yan and Z. Chen, Helv. Chim. Acta, 2001, 84, 817 CrossRef; (c) X.-J. Song, J.-J. Xu, Y. Chen, M. Muddassir, F. Cao, R.-M. Wei, Y. Song and X.-Z. You, Polyhedron, 2013, 66, 212 CrossRef.
- M.-G. Alexandru, D. Visinescu, S. Shova, W. X. C. Oliveira, F. Lloret and M. Julve, Dalton Trans., 2018, 47, 6005 RSC.
- M. Coletta, R. McLellan, S. Sanz, K. J. Gagnon, S. J. Teat, E. K. Brechin and S. J. Dalgarno, Chem. – Eur. J, 2017, 23, 14073 CrossRef PubMed.
- (a) A. Figuerola, C. Diaz, J. Ribas, V. Tangoulis, J. Granell, F. Lloret, J. Mahia and M. Maestro, Inorg. Chem., 2003, 42, 641 CrossRef; (b) W.-T. Chen, G.-C. Guo, M.-S. Wang, G. Xu, L.-Z. Cai, T. Akitsu, M. Akita-Tanaka, A. Matsushita and J.-S. Huang, Inorg. Chem., 2007, 46, 2105 CrossRef PubMed; (c) G. Li, T. Akitsu, O. Sato and Y. Einaga, J. Am. Chem. Soc., 2003, 125, 12396 CrossRef; (d) X.-R. Sun, Z.-D. Chen, F. Yan, S. Gao, K.-K. Cheung, C.-M. Che and X.-X. Zhang, J. Clust. Sci., 2002, 13, 103 CrossRef; (e) S. A. Stoian, C. Paraschiv, N. Kiritsakas, F. Lloret, E. Münck, E. L. Bominaar and M. Andruh, Inorg. Chem., 2010, 49, 3387 CrossRef.
- M. Ferbinteanu, T. Kajiwara, K.-Y. Choi, H. Nojiri, A. Nakamoto, N. Kojima, F. Cimpoesu, Y. Fujimura, S. Takaishi and M. Yamashita, J. Am. Chem. Soc., 2006, 128, 9008 CrossRef.
- J.-P. Costes, A. Dupuis and J.-P. Laurent, Eur. J. Inorg. Chem., 1998, 1543 CrossRef.
- M. Andruh, Dalton Trans., 2015, 44, 16633 RSC.
- (a) J.-P. Costes, F. Dahan, F. Dumestre, J. M. Clemente-Juan, J. Garcia-Tojal and J.-P. Tuchagues, Dalton Trans., 2003, 464 RSC; (b) M. Sarwar, A. M. Madalan, F. Lloret, M. Julve and M. Andruh, Polyhedron, 2011, 30, 2414 CrossRef.
- (a) I. Nemec, M. Machata, R. Herchel, R. Boča and Z. Trávníček, Dalton Trans., 2012, 41, 14603 RSC; (b) W.-W. Kuang, C.-Y. Shao and P.-P. Yang, J. Coord. Chem., 2015, 68, 1412 CrossRef.
- S. Stoll and A. Schweiger, J. Magn. Reson., 2006, 178, 42 CrossRef PubMed.
- S. Stoll and R. D. Britt, Phys. Chem. Chem. Phys., 2009, 11, 6614 RSC.
- A. Bencini and D. Gatteschi, EPR of exchange coupled systems: Springer - Verlag, New York, 1990 Search PubMed.
- N. F. Chilton, R. P. Anderson, L. D. Turner, A. Soncini and K. S. Murray, J. Comput. Chem., 2013, 34, 1164 CrossRef CAS.
- J. Schnack, P. Hage and H. J. Schmidt, J. Comput. Phys., 2008, 227, 4512 CrossRef.
- R. Schnalle and J. Schnack, Int. Rev. Phys. Chem., 2010, 29, 403 Search PubMed.
- M. Haertel, J. Richter, D. Ihle, J. Schnack and S.-L. Drechsler, Phys. Rev. B: Condens. Matter Mater. Phys., 2011, 84, 104411 CrossRef.
- H. Veronika, K. Gieb, P. Müller, L. Ungur, L. F. Chibotaru, M. Heidemeier, E. Krickemeyer, A. Stammler, H. Bögge, C. Schröder, J. Schnack and T. Glaser, Chem. Sci., 2012, 3, 2868 RSC.
- T. Glaser, V. Hoeke, K. Gieb, J. Schnack, C. Schröder and P. Muller, Coord. Chem. Rev., 2015, 289, 261 CrossRef.
- L. Noodleman, D. A. Case and A. Aizman, J. Am. Chem. Soc., 1988, 110(4), 1001 CrossRef CAS.
- D. Gatteschi and K. Yamaguchi, Opportunities for new physics in molecular magnetism. Molecular Magnetism: from Molecular Assemblies to the Devices, Springer, Dordrecht, 1996, vol. 321, pp. 561–570 Search PubMed.
- M. Shoji, K. Koizumi, Y. Kitagawa, T. Kawakami, S. Yamanaka, M. Okumura and K. Yamaguchi, Chem. Phys. Lett., 2006, 432(1–3), 343 CrossRef CAS.
- I. Negodaev, C. de Graaf and R. Caballol, Chem. Phys. Lett., 2008, 458(4–6), 290 CrossRef CAS.
- S. Knecht, E. D. Hedegåd, S. Keller, A. Kovyrshin, Y. Ma, A. Muolo, C. J. Stein and M. Reiher, Chimia, 2016, 70, 24 CrossRef PubMed.
- S. Battaglia, S. Keller and S. Knecht, J. Chem. Theory Comput., 2018, 14, 2353 CrossRef CAS PubMed.
- S. Wouters, T. Bogaerts, P. Van Der Voort, V. Van Speybroeck and D. Van Neck, J. Chem. Phys., 2014, 140, 241103 CrossRef.
- S. Wouters, V. Van Speybroeck and D. Van Neck, J. Chem. Phys., 2016, 145, 054120 CrossRef.
- L. F. Chibotaru, L. Ungur, C. Aronica, H. Elmoll, G. Pilet and D. Luneau, J. Am. Chem. Soc., 2008, 130, 12445 CrossRef CAS PubMed.
- L. F. Chibotaru, L. Ungur and A. Soncini, Angew. Chem., Int. Ed., 2008, 120, 4194 CrossRef.
- S.-Y. Lin, W. Wernsdorfer, L. Ungur, A. K. Powell, Y.-N. Guo, J. Tang, L. Zhao, L. F. Chibotaru and H.-J. Zhang, Angew. Chem., Int. Ed., 2012, 51(51), 12767 CrossRef CAS PubMed.
- L. Ungur, S. K. Langley, T. N. Hooper, B. Moubaraki, E. K. Brechin, K. S. Murray and L. F. Chibotaru, J. Am. Chem. Soc., 2012, 134, 18554 CrossRef CAS PubMed.
- S. K. Langley, D. P. Wielechowski, V. Vieru, N. F. Chilton, B. Moubaraki, B. F. Abrahams, L. F. Chibotaru and K. S. Murray, Angew. Chem., Int. Ed., 2013, 52(46), 12014 CrossRef CAS PubMed.
- M. Towatari, K. Nishi, T. Fujinami, N. Matsumoto, Y. Sunatsuki, M. Kojima, N. Mochida, T. Ishida, N. Re and J. Mrozinski, Inorg. Chem., 2013, 52, 6160 CrossRef CAS PubMed.
- F. Aquilante, J. Autschbach, R. K. Carlson, L. F. Chibotaru, M. G. Delcey, L. De Vico, I. F. G. N. Ferre, L. M. Frutos, L. Gagliardi, M. Garavelli, A. Giussani, C. E. Hoyer, G. L. Manni, H. Lischka, D. Ma, P. A. Malmqvist, T. s. Muller, A. Nenov, M. Olivucci, T. B. Pedersen, D. Peng, F. Plasser, B. Pritchard, M. Reiher, I. Rivalta, I. Schapiro, J. Segarra-Mart, M. Stenrup, D. G. Truhlar, L. Ungur, A. Valentini, S. Vancoillie, V. Veryazov, V. P. Vysotskiy, O. Weingart, F. Zapata and R. Lindh, J. Comp. Chem., 2016, 37, 506 CrossRef CAS PubMed.
- L. Ungur and L. F. Chibotaru, http://www.molcas.org/documentation/manual/.
- L. F. Chibotaru, L. Ungur and A. Soncini, Angew. Chem., Int. Ed., 2008, 47, 4126 CrossRef CAS PubMed.
- V. Vieru, L. Ungur and L. F. Chibotaru, J. Phys. Chem. Lett., 2013, 4, 3565 CrossRef CAS.
- A. Abragam and B. Bleaney, Electron Paramagnetic Resonance of Transition Ions, Clarendon Press, Oxford, 1970 Search PubMed.
- D. A. Garanin and E. M. Chudnovsky, Phys. Rev. B: Condens. Matter Mater. Phys., 1997, 56, 11102 CrossRef CAS.
- (a) M. Llunell, D. Casanova, J. Girera, P. Alemany and S. Alvarez, SHAPE, version 2.1, Universitat de Barcelona, Barcelona, Spain Search PubMed; (b) S. Alvarez, P. Alemany, D. Casanova, J. Cirera, M. Llunell and D. Avnir, Coord. Chem. Rev., 2005, 249, 1693 CrossRef CAS.
- O. Kahn, Molecular Magnetism, Wiley-VCH, Dodrecht., 1993 Search PubMed.
- J. D. Rinehart and J. R. Long, Chem. Sci., 2011, 2, 2078 RSC.
- L. F. Chibotaru, Molecular Nanomagnets and Related Phenomena, Springer Berlin Heidelberg, Berlin, Heidelberg, 2014, p. 185 Search PubMed.
- A. A. Patrascu, M. Briganti, S. Soriano, S. Calancea, R. A. Allão Cassaro, F. Totti, M. G. F. Vaz and M. Andruh, Inorg. Chem., 2019, 58, 13090 CrossRef CAS PubMed.
- A. A. Patrascu, S. Calancea, M. Briganti, S. Soriano, A. M. Madalan, R. A. A. Cassaro, A. Caneschi, F. Totti, M. G. F. Vaz and M. Andruh, Chem. Commun., 2017, 53, 6504 RSC.
- D. Gatteschi and R. Sessoli, J. Villain, Molecular Nanomagnets, Oxford University Press, 2006 Search PubMed.
- V. Vieru, T. D. Pasatoiu, L. Ungur, E. Suturina, A. M. Madalan, C. Duhayon, J.-P. Sutter, M. Andruh and L. F. Chibotaru, Inorg. Chem., 2016, 55, 12158 CrossRef CAS PubMed.
- L. F. Chibotaru and L. Ungur, J. Chem. Phys., 2012, 137, 064112 CrossRef CAS PubMed.
- M. N. Leuenberger and D. Loss, Phys. Rev. B: Condens. Matter Mater. Phys., 2000, 61, 1286 CrossRef CAS.
- S.-G. Wu, Z.-Y. Ruan, G.-Z. Huang, J.-Y. Zheng, V. Vieru, G. Taran, J. Wang, Y.-C. Chen, J.-L. Liu, L. T. A. Ho, L. F. Chibotaru, W. Wernsdorfer, X.-M. Chen and M.-L. Tong, Chem, 2021, 7, 982 CAS.
- M. N. Leuenberger and D. Loss, Europhys. Lett., 1999, 46, 692 CrossRef CAS.
Footnotes |
| † Electronic supplementary information (ESI) available. CCDC 1916564–1916566. For ESI and crystallographic data in CIF or other electronic format see DOI: 10.1039/d1tc00894c |
| ‡ These authors contributed equally to this work. |
| This journal is © The Royal Society of Chemistry 2021 |

