Sensitivity of mixed cation/halide perovskites to evaporation kinetics of DMSO at an early stage†
Gyu Min
Kim
 *a,
Eun Seo
Oh
 a,
Ajay Kumar
Jena
 b and
Tsutomu
Miyasaka
 *b
*b
aFaculty of Food Biotechnology and Chemical Engineering, Hankyong National University, Anseong, Gyeonggi-Do 17579, Republic of Korea. E-mail: gyumin@hknu.ac.kr; Tel: +82-31-670-5202
bGraduate School of Engineering, Toin University of Yokohama, 1614 Kurogane-cho, Aoba, Yokohama, Kanagawa 225-8503, Japan. E-mail: miyasaka@toin.ac.jp
First published on 4th November 2021
Abstract
Controlling the evaporation kinetics of the perovskite precursor (EKP) during the thermal annealing step of organic–inorganic hybrid perovskite solar cells (OIHPs) is important for achieving high performance. Although regulation of the evaporation kinetics of precursors and their influence on the final cell performance have been studied, the exact mechanism underlying their effects on the final performance is not understood. In this study, we found that the evaporation kinetics of lead-based organic–inorganic hybrid perovskite precursors strongly depend on the compositions and ratios of cations and halides. Crystal-structure analysis of films of various compositions formed at different stages of thermal annealing revealed that the wet films (before annealing) of lead-based perovskite precursors should be categorised into one of six states depending on perovskite compositions. Interestingly, only two of the six states exhibit a strong dependence on the EKP, implying that extra care should be taken when these perovskite inks are used. We suggest a way to easily determine whether wet films are sensitive to EKP by briefly examining their compositions, without scrutinising their optoelectronic properties. This procedure will help to reduce the standard deviation of the performance and easily obtain high power conversion efficiencies for lead-based OIHPs.
Introduction
Organic–inorganic hybrid perovskite solar cells (OIHPs), which are composed of three-dimensional structures of perovskites, have attracted considerable interest owing to their excellent optoelectronic properties, including power conversion efficiencies (PCEs) of >25%, despite their short history.1The high performance of OIHPs, which is comparable to that of silicon-based solar cells, has been attributed to the development of methods for synthesising perovskites directly on transparent conducting oxides, such as anti-solvent treatment (AST), hot solution casting, two-step spin coating, and vapour deposition.2–6 The most important factor for achieving high-performance OIHPs is the realisation of uniform, pin-hole free, and defect-less perovskite films.7–9 The PCE, reproducibility, and simplicity of the fabrication methods are additional concerns from an economic viewpoint.10,11
With the advent of mixed cation/halide perovskites, the choice of perovskite composition has been extended depending on the experimental purpose.12–14 At the same time, precise control of compositional engineering has become an important and challenging task, as the procedures developed for conventional perovskites (mostly MAPbI3) may be ineffective for mixed cation/halide perovskites, possibly because of the different chemical and physical interactions between the cations/halides and the solvents.15–18 The optimal spin speed, precursor concentration, and annealing temperature vary among different perovskite compositions, which presents an obstacle for achieving high performance. The use of AST has increased in popularity owing to the versatility and simplicity of mixed cation/halide perovskites among the various fabrication methods, and PCEs of >20% have been achieved.19,20 Because small changes in the experimental conditions often result in significantly different performance in the field of OIHPs, many research groups have started to emphasise the importance of specifying experimental conditions such as the temperature, humidity, substrate size, and amounts of solvents used during fabrication.6,21–23 Despite relatively precise disclosure in the reports compared with the past, high PCEs of OIHPs based on mixed cations and halides have been obtained by relatively few research groups, while high PCEs of MAPbI3-based OIHPs have been reported by many research groups. This is attributed to hidden factors that have not been carefully considered by many researchers. Although we recognise the adequate amounts of anti-solvents and the annealing temperatures of perovskites, information on the dripping speed of the anti-solvent, the distance between the pipet tip and the substrates, and the exact environmental conditions of the glovebox or laboratory room are still missing. We frequently encounter inconsistent results of OIHPs for different experimenters in the same laboratory or even for the same experimenters in different batches owing to ignorance of these conditions. Despite the difficulties of accurate and numerical measurements, the hidden factors related to perovskite formation should be thoroughly unveiled so that research groups worldwide can improve OIHPs with reproducible and reliable data. We found that the early stage of dimethyl sulfoxide (DMSO) evaporation immediately after AST is a critical factor affecting the performance. The effect of the evaporation kinetics of DMSO (EKD) on the optoelectronic properties of OIHPs strongly depends on the perovskite composition. As the number of combinations of perovskite compositions is large, determining the impact of the EKD for each composition is difficult. To address this issue, in the present paper, we provide a simple broad map to gain insight into how much the EKD affect the optoelectronic properties of perovskites depending on the perovskite compositions, thereby reducing the experimental error and obtaining high performance based on the compositions we use. We categorised perovskites into six different states depending on their compositions and analysed the impact of the EKD for each state. Considering these factors, reproducible high performance of OIHPs was easily obtained for the broad range of compositions that we used.
Experimental
Materials
All reagents were purchased commercially and were not further purified. Anhydrous N,N-dimethylformamide (DMF, 99.5+%) and anhydrous dimethyl sulfoxide (DMSO, 99.0+%) were purchased from Wako. Lead iodide (PbI2, 99.99%), methyl ammonium bromide (MABr, 98.0%), formamidine iodide (FAI, 98.0%), cesium iodide (CsI, 99.0%) and lead bromide (PbBr2, 98.0%) were purchased from TCI. Anhydrous chlorobenzene (CB, 99.8%), titanium diisopropoxide bis(acetylacetonate) (75 wt% in 2-propanol) and rubidium iodide (RbI, 99.9%) were purchased from Sigma Aldrich.Preparation of precursors
Precursors for compact TiO2 (cTiO2) are prepared from 0.2 M titanium diisopropoxide bis(acetylacetonate) diluted in 2-propanol. Perovskite ink was prepared from DMF/DMSO cosolvent (4![[thin space (1/6-em)]](https://www.rsc.org/images/entities/char_2009.gif) :
:![[thin space (1/6-em)]](https://www.rsc.org/images/entities/char_2009.gif) 1 volume ratio) containing PbI2 (1.1 M), FAI (1 M), MABr (0.2 M), and PbBr2 (0.2 M). Quadrupole cation perovskite ink was obtained by adding 40 μl and 30 μl of CsI (1.5 M in DMSO) and RbI (1.5 M in DMSO) to 1 ml of double cation perovskite ink. Spiro-OMeTAD (0.059 M) was dissolved in CB with Li-TFSI and tBP as additives. The molar ratio of Spiro-OMeTAD
1 volume ratio) containing PbI2 (1.1 M), FAI (1 M), MABr (0.2 M), and PbBr2 (0.2 M). Quadrupole cation perovskite ink was obtained by adding 40 μl and 30 μl of CsI (1.5 M in DMSO) and RbI (1.5 M in DMSO) to 1 ml of double cation perovskite ink. Spiro-OMeTAD (0.059 M) was dissolved in CB with Li-TFSI and tBP as additives. The molar ratio of Spiro-OMeTAD![[thin space (1/6-em)]](https://www.rsc.org/images/entities/char_2009.gif) :
:![[thin space (1/6-em)]](https://www.rsc.org/images/entities/char_2009.gif) Li-TFSI
Li-TFSI![[thin space (1/6-em)]](https://www.rsc.org/images/entities/char_2009.gif) :
:![[thin space (1/6-em)]](https://www.rsc.org/images/entities/char_2009.gif) tBP is 1
tBP is 1![[thin space (1/6-em)]](https://www.rsc.org/images/entities/char_2009.gif) :
:![[thin space (1/6-em)]](https://www.rsc.org/images/entities/char_2009.gif) 0.53
0.53![[thin space (1/6-em)]](https://www.rsc.org/images/entities/char_2009.gif) :
:![[thin space (1/6-em)]](https://www.rsc.org/images/entities/char_2009.gif) 3.33.
3.33.
Device fabrication
OIHPs were fabricated in a controlled dry room under 5% relative humidity. OIHPs were composed of TCO (FTO or ITO)/cTiO2 (used when FTO is used)/mesoporous-TiO2/perovskite (double cation or quadrupole cation perovskite)/Spiro-OMeTAD/Au. cTiO2 was coated on FTO by coating titanium diisopropoxide bis(acetylacetonate) (0.2 M in 2-propanol) at 3000 rpm for 20 s followed by annealing at 500 °C for 30 min. TiO2 paste diluted in EtOH was spin-coated on cTiO2 followed by annealing at 500 °C for 30 min.Perovskite ink was coated by two rounds of consecutive spin-coating at 1700 rpm for 15 s and 6500 rpm for 25 s. Chlorobenzene as an antisolvent was dripped 15 s prior to the end of spin-coating. The resulting films were annealed at 150 °C for 15 min. The Spiro-OMeTAD precursor was coated on perovskite films at 3000 rpm for 30 s followed by Au (100 nm) evaporation.
Results and discussion
The main function of anti-solvents in AST is the removal of dimethylformamide (DMF) due to its poor miscibility with DMSO, forming DMSO-related intermediate phases. Rong et al. stated that the general molar ratio of PbI2![[thin space (1/6-em)]](https://www.rsc.org/images/entities/char_2009.gif) :
:![[thin space (1/6-em)]](https://www.rsc.org/images/entities/char_2009.gif) DMSO in the intermediate phase of the MAPbI3-based perovskite precursor was 3
DMSO in the intermediate phase of the MAPbI3-based perovskite precursor was 3![[thin space (1/6-em)]](https://www.rsc.org/images/entities/char_2009.gif) :
:![[thin space (1/6-em)]](https://www.rsc.org/images/entities/char_2009.gif) 2, forming (MA)2(Pb3I8)22DMSO, which is denoted as Pb3I8.24,25 These intermediate phases are easily identified via X-ray diffraction (XRD) (ESI 1†) in the substrates immediately after the anti-solvent dripping (before thermal treatment) owing to the crystalline structures. The perovskite precursors adopted by many research groups contain PbI2 (1–1.5 M) in DMF
2, forming (MA)2(Pb3I8)22DMSO, which is denoted as Pb3I8.24,25 These intermediate phases are easily identified via X-ray diffraction (XRD) (ESI 1†) in the substrates immediately after the anti-solvent dripping (before thermal treatment) owing to the crystalline structures. The perovskite precursors adopted by many research groups contain PbI2 (1–1.5 M) in DMF![[thin space (1/6-em)]](https://www.rsc.org/images/entities/char_2009.gif) :
:![[thin space (1/6-em)]](https://www.rsc.org/images/entities/char_2009.gif) DMSO (4
DMSO (4![[thin space (1/6-em)]](https://www.rsc.org/images/entities/char_2009.gif) :
:![[thin space (1/6-em)]](https://www.rsc.org/images/entities/char_2009.gif) 1 vol%), where the PbI2
1 vol%), where the PbI2![[thin space (1/6-em)]](https://www.rsc.org/images/entities/char_2009.gif) :
:![[thin space (1/6-em)]](https://www.rsc.org/images/entities/char_2009.gif) DMSO ratio varies from 1
DMSO ratio varies from 1![[thin space (1/6-em)]](https://www.rsc.org/images/entities/char_2009.gif) :
:![[thin space (1/6-em)]](https://www.rsc.org/images/entities/char_2009.gif) 2.3 to 1
2.3 to 1![[thin space (1/6-em)]](https://www.rsc.org/images/entities/char_2009.gif) :
:![[thin space (1/6-em)]](https://www.rsc.org/images/entities/char_2009.gif) 3.5. Compared with the PbI2
3.5. Compared with the PbI2![[thin space (1/6-em)]](https://www.rsc.org/images/entities/char_2009.gif) :
:![[thin space (1/6-em)]](https://www.rsc.org/images/entities/char_2009.gif) DMSO ratio in the intermediate phase (3
DMSO ratio in the intermediate phase (3![[thin space (1/6-em)]](https://www.rsc.org/images/entities/char_2009.gif) :
:![[thin space (1/6-em)]](https://www.rsc.org/images/entities/char_2009.gif) 2), the molar amounts of DMSO are generally excessive in the preparation of perovskite precursors. Thus, the substrates are typically still wet after AST (we denote the substrates in this state as “wet films”) because of the excess DMSO and intermediate phases.
2), the molar amounts of DMSO are generally excessive in the preparation of perovskite precursors. Thus, the substrates are typically still wet after AST (we denote the substrates in this state as “wet films”) because of the excess DMSO and intermediate phases.
We examined the effects of the EKD at stages 1 and 2 (Scheme 1) on the film morphology and optoelectronic properties. We controlled the EKD at an early stage (stage 1) by simply covering the substrate with a Petri dish for a short time, until the DMSO was removed from the wet films (stage 1) (Scheme 1). To focus on the early stage of DMSO evaporation and exclude other effects, the Petri dish was promptly removed when the DMSO was evaporated from the wet films, followed by further annealing without a Petri dish (stage 2). In many previous studies involving the use of Petri dishes, the substrate was covered for the entire annealing time. Keeping the Petri dish even after the removal of DMSO from the substrates (stage 2) may affect the characteristics of the perovskites through solvent annealing and Ostwald ripening effects. Hence, it is difficult to understand the early-stage effect of the EKD, which is beyond the scope of this work.26
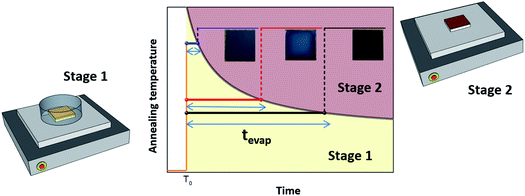 | ||
| Scheme 1 Fabrication process for perovskite films and XRD data for the wet film and completed perovskite for MAPbI3. | ||
In stage 1, the wet films were thermally treated for tevap (annealing time), which was defined as the time taken for the DMSO to evaporate from the surface of the wet film, observed with the naked eye. Thus, tevap was determined by the annealing temperature at stage 1 and the size of the Petri dish. The evaporation of DMSO from the substrates at stage 1 was easily detected, as the evaporation was observed from the edge to the centre, and tevap tended to decrease when the temperature at stage 1 was increased or a larger Petri dish was used, because of the increased evaporation of DMSO.
Fig. 1a shows photographs and scanning electron microscopy (SEM) images of FA0.8MA0.2Pb(I0.9Br0.1)3 on glass processed with different tevap values by varying the annealing temperature at stage 1 (covered with a Petri dish) followed by annealing at 120 °C for 30 min at stage 2, as illustrated in Scheme 1. The colour of substrates with large tevap values was whitish, owing to the strong scattering of light from the surface (Fig. 1b). As confirmed by the SEM images, the films processed with larger tevap values had larger grains.
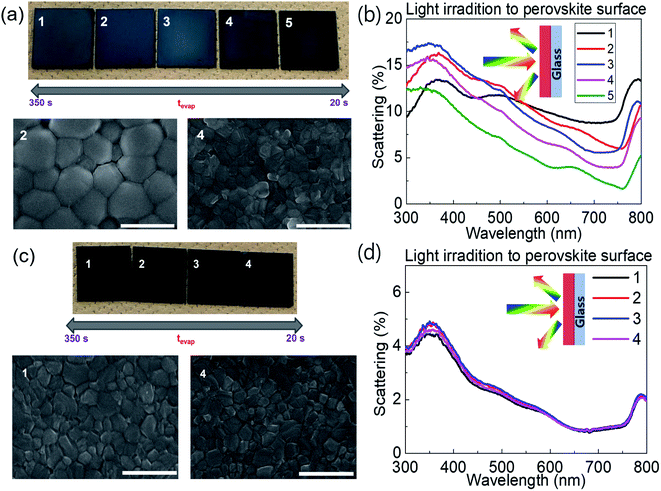 | ||
| Fig. 1 (a and c) SEM images and (b and d) light-scattering spectra for (a and b) FA0.8MA0.2Pb(I0.9Br0.1)3 and (c and d) MAPbI3 on glass with different tevap values. | ||
Interestingly, this difference in the final morphology of the films when the annealing was controlled at stage 1 strongly depended on the perovskite composition. In contrast to the mixed cation (or halide) perovskites introduced above, no significant variation in colour (Fig. 1c) or grain size (SEM images, Fig. 1c) was observed for the single cation/halide perovskite MAPbI3 (Fig. 1c). In this case, the light-scattering spectra (Fig. 1d) of samples prepared with different tevap values overlapped each other over the entire wavelength range, implying that the surface conditions were similar regardless of the evaporation kinetics of DMSO at the early stage (Fig. 1d). This phenomenon was also observed for FAPbI3, which is insensitive to tevap (ESI 2†). Hence, the sensitivity to tevap clearly depends on the perovskite composition.
To better understand the crystallisation process in different systems, we performed a crystal-structure analysis at different stages. The XRD patterns of the wet films of FA0.8MA0.2Pb(I0.9Br0.1)3 generally exhibited two phases simultaneously, i.e. the intermediate phases (denoted as # in 2θ) and black phases (denoted as * in 2θ), while for the wet film of MAPbI3, only intermediate phases were detected (Fig. 2a). Generally, a shorter tevap was observed with higher annealing temperatures and larger Petri dishes at stage 1, owing to the acceleration of the evaporation of DMSO from the substrate surface (k2) and deceleration of the adsorption (k1) of DMSO back onto the substrates. Thus, a significant number of nucleation sites of the black perovskite phase that can coexist with weak intermediate phases on the wet films of FA0.8MA0.2Pb(I0.9Br0.1)3 are initiated at a shorter tevap at stage 1 owing to the low solubility at higher temperatures and the rapid increase in the concentration of cations and anions on the wet film resulting from the higher k2. As a result, the grain size remained smaller. In contrast, the wet films of MAPbI3 hardly formed nucleation sites of black phases during the evaporation of DMSO, owing to the strong and dominant intermediate phases or the lack of an initiator of nucleation sites.
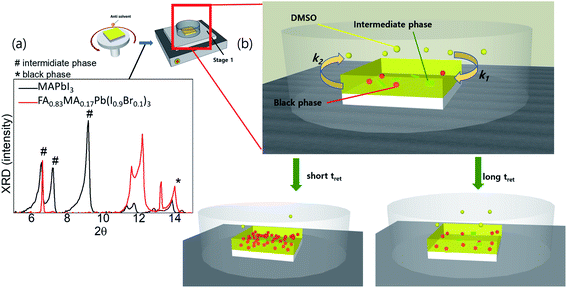 | ||
| Fig. 2 (a) XRD of wet films (before annealing) for MAPbI3 and FA0.8MA0.2Pb(I0.9Br0.1)3; (b) illustrations of tret-sensitive films at stage 1. | ||
The concentration of precursors at stage 1 can directly influence the nucleation of mixed cation/halide perovskites in wet films; an instant rise in concentration with a short tevap leads to the generation of numerous nucleation sites, which grow into a large number of small grains instead of a small number of large grains. It must be noted that tevap, rather than the annealing temperature, is a direct quantity that influences the reproducibility of the results. This is because at the same annealing temperature, a difference in tevap can occur depending on the environmental factors around the wet substrates, causing a variation in the results. We observed that similar optoelectronic properties of perovskite films can always be obtained even with different annealing temperatures if tevap is kept constant by controlling the size of the Petri dishes. Hence, under varying environmental conditions due to different seasons and regions, reproducibility can be significantly improved once the optimum tevap is achieved by changing either the annealing temperature or the size of the Petri dishes.
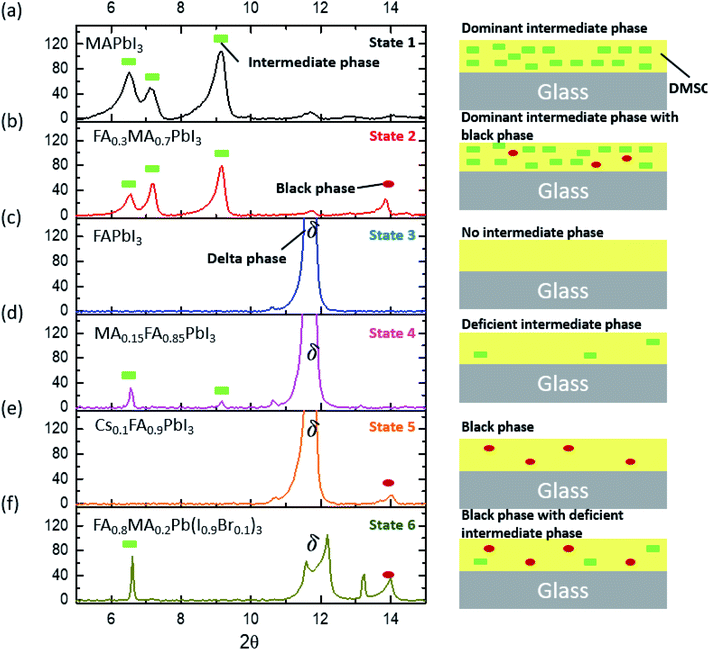
As the number of compositions of perovskites can be large, determining the sensitivity of many compositions toward tevap is time-consuming. Therefore, we provide a roadmap that can determine which compositions are sensitive to stage 1 and should be prepared with a control. Through an XRD analysis of wet films with different compositions, we realised that most wet films of lead-based organic–inorganic perovskites can be categorised into one of six different states (Fig. 3; for detailed information regarding chemical compositions see the ESI†): (a) dominant intermediate phase (state 1); (b) dominant intermediate phase with black perovskite phase (state 2); (c) no intermediate phase (state 3); (d) deficient intermediate phase (state 4); (e) black perovskite phase (state 5); and (f) black phase with deficient intermediate phase (state 6). These wet films are mesophase states in which matured perovskite films are not formed having conspicuous intermediate phases or delta phases.
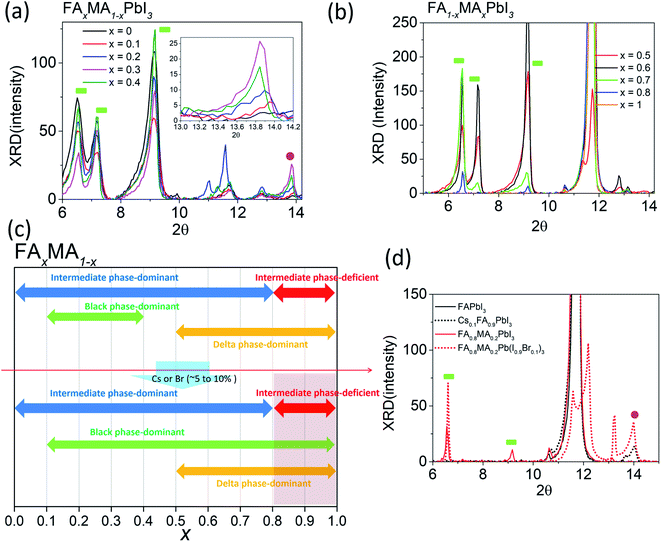
Although mixed cation/halide perovskites appear to be more sensitive to tevap than single cation/halide perovskites such as MAPbI3, not all mixed cation/halide perovskites exhibit this property. For example, in a similar manner to MAPbI3, mixed cation/halide perovskites such as FA0.2MA0.8PbI3 and Cs0.1MA0.9PbI3 are unaffected by changes in tevap at stage 1 (ESI 3a†). The wet films exhibited extreme sensitivity to tevap only under certain conditions. The corresponding states were states 5 and 6 (ESI 3b†). The dominance of black phases in the wet films, e.g. in states 5 and 6, is speculated to be the main reason for the sensitivity to tevap. For example, this was observed for the perovskite composition FAxMA1−xPbI3, which contained both intermediate and black perovskite phases in the wet film. We analysed the XRD results of wet films consisting of FAxMA1−xPbI3, revealing that the peaks assigned to intermediate phases at 2θ = 6.5°, 7.1°, and 9.2° gradually increased with increasing FA content (x) up to x = 0.7 and then started to decrease at x = 0.8 (Fig. 4a and b). In contrast, the black phase near 2θ = 14° appearing at x = 0.1 became increasingly pronounced up to x = 0.3, decreased beyond x = 0.3, and disappeared completely for x > 0.5, as shown in Fig. 4b. The shift of the black phase to a smaller angle was observed until x = 0.4, owing to the increase in the content of FA, which has a larger radius than MA (inset of Fig. 4a). The black phase of the wet films disappeared when x reached 0.5. According to the results, we define the region of 0 < x < 0.8 as the intermediate phase-dominant region and 0.1 < x < 0.4 as the black phase-dominant region. To identify the condition in which the wet films are sensitive to tevap, we should find the region where the black phase-dominant region overlaps with the intermediate-dominant region (state 5 or 6). For FAxMA1−xPbI3, in which Cs and Br are not used, there is no region where these two phases overlap over the entire x range, implying that regardless of how we change the ratio of FA and MA, perovskites consisting of FAxMA1−xPbI3 are not sensitive to tevap (Fig. 4c). We did not observe significant optoelectronic changes when varying tevap at stage 1 for FAxMA1−xPbI3 in a similar manner to MAPbI3 shown in Fig. 1c and d. Interestingly, we found that the black phase region was extended by adding Cs or Br (5–10 mol%) to FAxMA1−xPbI3, as shown in Fig. 4d, while other regions such as intermediate-dominant regions and delta phase-dominant regions remained similar. Other examples are presented in ESI 4.† The extension of the black phase of the wet film due to the addition of Cs or Br ranged from 0.2 < x < 0.5 to 0.2 < x < 1 (Fig. 4c), creating a region where the black phase-dominant region and the intermediate phase-deficient region overlapped (0.8 < x < 1), which belonged to either state 5 or state 6. As FA is a stable material compared with MA and the mixture of I and Br− at the X site in perovskites typically leads to high performance, many research groups use more FA than MA, along with Br and Cs. These conditions are usually categorised as either state 5 or state 6 (Fig. 4c). As previously mentioned (Scheme 1), placing a Petri dish at stage 1 is an efficient way to control the EKD when perovskites belong to states 5 and 6. As shown in Fig. 1a, the adequate condition of tevap is 180 s for most lead-based perovskite compositions, leading to homogeneous and large perovskite grains. To adjust the tevap to approximately 180 s, a trial-and-error method is required, because the tevap is affected by the environmental conditions, as mentioned previously. We observed that there is a threshold temperature (Tth) below which full evaporation of DMSO from the wet film does not occur (k1 = k2), implying that tevap approaches infinity below Tth. Under our experimental conditions, the Tth values of the wet films of Cs0.1FA0.9PbI3, Rb0.03Cs0.05(FA0.83MA0.17)0.95Pb(I0.83Br0.17)3, FA0.8MA0.2Pb(I0.9Br0.1)3, MAPbI3, and Cs0.1FA0.9PbI3 were recorded as 30, 60, 65, 70, and 65 °C, respectively (ESI 4ab†). The Tth of Cs0.1FA0.9PbI3 was lower than those of the other mixed cation/halide perovskites, implying that the EKD are significantly faster at a higher temperature, leading to a smaller grain size, which is consistent with the results of other groups. We observed that a temperature approximately 10 °C higher than Tth at stage 1 with a Petri dish resulted in a tevap of 180 s. The larger value of tevap, which was 5 °C higher than Tth, could convert perovskites but led to pin-holes. Adequate control of tevap, which was adjusted to 180 s, resulted in a larger grain size even for Cs0.1FA0.9PbI3, which is known for its small grain size (ESI 4a†). For perovskites not sensitive to tevap (MAPbI3 and Cs0.1FA0.9PbI3 in this case), the differences in morphology were not obvious, which is consistent with the results shown in Fig. 1c and d (ESI 4b†).
We fabricated OIHPs consisting of Rb0.03Cs0.05(FA0.83MA0.17)0.92Pb(I0.83Br0.17)3. Considering the roadmap (Fig. 4c), Rb0.03Cs0.05(FA0.83MA0.17)0.92Pb(I0.83Br0.17)3 is thought to be sensitive to tevap because of the amount of FA relative to MA (x > 0.8) along with Cs+ and Br−. According to the results shown in ESI 4a,† the optimal conditions for Rb0.03Cs0.05(FA0.83MA0.17)0.92Pb(I0.83Br0.17)3 were obtained with a tevap of 180 s at a temperature 10 °C higher than Tth with a Petri dish covered at stage 1. In the XRD analysis of the complete perovskite films after annealing (ESI 5†), all the perovskite films (with different tevap values) exhibited peaks assigned to black phases but had higher peak intensities at 2θ = 40.5° with a longer tevap than perovskite films with unoptimized tevap, implying that preferential crystal growth occurred with the slow evaporation kinetics of DMSO at stage 1. Typically, perovskite films with large grain sizes have a high surface roughness (Ra) owing to the deep valleys between grain boundaries, which is also observed for quadrupole cation perovskites with a long tevap of 350 s (Fig. 5b), as confirmed by atomic force microscopy (ESI 6†). However, the Ra was lower for tevap = 180 s than for tevap = 75 s despite the larger grains, which was due to the relatively shallow valleys between the grain boundaries and the flat grain surfaces. These superior grain conditions led to the improvement of the photoluminescence (PL) intensity (ESI 7†) and time-transient PL lifetime (TRPL) (Fig. 5b and c), suppressing nonradiative recombination inside the perovskite layers. In contrast, tevap-insensitive perovskites such as MAPbI3 did not exhibit significant differences in the PL intensity or TRPL at different tevap values (ESI 8†). This again emphasises the importance of adequate regulation of the annealing conditions—particularly for FA-rich cation perovskites.
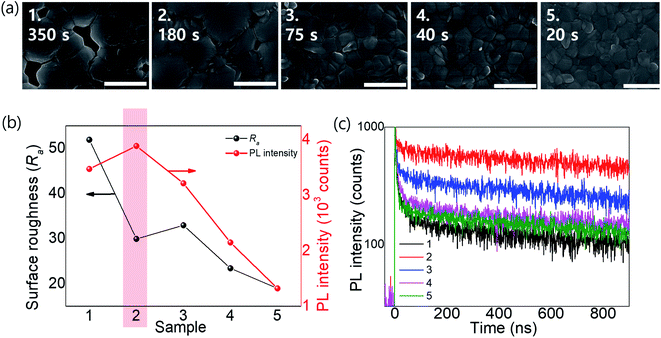 | ||
| Fig. 5 (a) SEM images, (b) Ra and PL intensity values, and (c) TRPLs of perovskite films of Rb0.03Cs0.05(FA0.83MA0.17)0.92Pb(I0.83Br0.17)3 with different tevap values (20–350 s). | ||
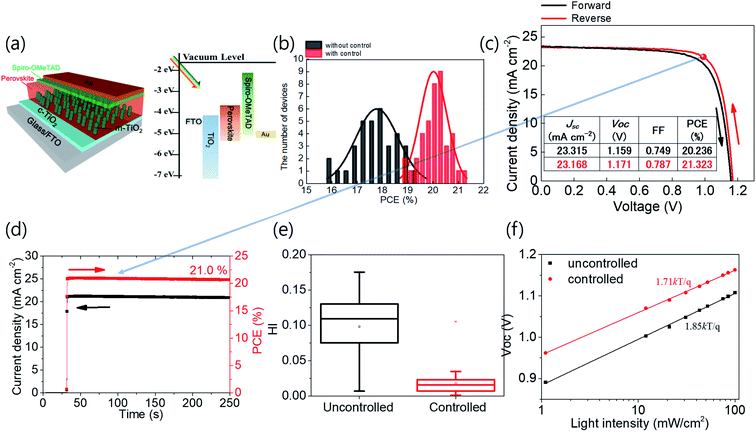
The complete structure of the cells and the energy diagram are shown in Fig. 6a. The controlled cells fabricated by optimizing tevap as 180 s exhibited better performance, with a smaller standard deviation, than the cells without adequate control of tevap (Fig. 6b). The best cell exhibited PCEs of 21.3% and 21.0% in the current density–voltage (j–V) curves and steady output, respectively (Fig. 6c and d). The hysteresis index (HI) (Fig. 6e) and ideality factor obtained from the relationship between Voc and the light intensity (Fig. 6f) were smaller for optimised cells resulting from optimised perovskite grain conditions by an optimized value of tevap, which is in accordance with the improvements in the PL.
We also attempted to fabricate large-area (1 cm2) cells on indium tin oxide substrates and obtained a maximum best PCE of 18.4% with the optimisation of tevap, which was higher than that of unoptimized cells (ESI 9†). The PCE of the large-area cell was sent to an official institution and certified, recording 18.27% from maximum power point tracking, which provides more reliable data than the j–V curve.
Conclusion
Typical methods for improving the performance of mixed cation/halide OIHPs involve optimisation of the temperature and humidity during processing. These methods are inadequate, because the optoelectronic properties of perovskites are affected by many environmental factors other than temperature and humidity. Focusing on adjusting tevap can improve the reproducibility, as all the environmental factors of wet films are determinants of tevap.Among the six different conditions for wet films depending on the perovskite composition, two states exhibited extreme sensitivity to tevap. Through the proposed method for determining these two states through the FA and MA ratios and the existence of Br and Cs, the sensitivity of perovskites to tevap can be easily determined. This is useful for ensuring good reproducibility and performance of OIHPs, regardless of the fabrication conditions.
Conflicts of interest
The authors declare no conflict of interest.Acknowledgements
This work was supported by the National Research Foundation of Korea (NRF) grant funded by the Korean government (MSIT) (No. 2021R1G1A101236211).References
- J. J. Yoo, G. Seo, M. R. Chua, T. G. Park, Y. Lu, F. Rotermund, Y.-K. Kim, C. S. Moon, N. J. Jeon and J.-P. Correa-Baena, Nature, 2021, 590, 587 CrossRef CAS PubMed.
- J.-W. Lee, H.-S. Kim and N.-G. Park, Acc. Chem. Res., 2016, 49, 311 CrossRef CAS PubMed.
- H. C. Liao, P. Guo, C. P. Hsu, M. Lin, B. Wang, L. Zeng, W. Huang, C. M. M. Soe, W. F. Su and M. J. Bedzyk, Adv. Energy Mater., 2017, 7, 1601660 CrossRef.
- Z. Xiao, Q. Dong, C. Bi, Y. Shao, Y. Yuan and J. Huang, Adv. Energy Mater., 2014, 26, 6503 CAS.
- J.-H. Im, H.-S. Kim and N.-G. Park, APL Mater., 2014, 2, 081510 CrossRef.
- H.-S. Ko, J.-W. Lee and N.-G. Park, J. Mater. Chem. A, 2015, 3, 8808 RSC.
- G. E. Eperon, V. M. Burlakov, P. Docampo, A. Goriely and H. J. Snaith, Adv. Energy Mater., 2014, 24, 151 CAS.
- W. Qiu, T. Merckx, M. Jaysankar, C. M. De La Huerta, L. Rakocevic, W. Zhang, U. Paetzold, R. Gehlhaar, L. Froyen and J. Poortmans, Energy Environ. Sci., 2016, 9, 484 RSC.
- G. Yang, C. Wang, H. Lei, X. Zheng, P. Qin, L. Xiong, X. Zhao, Y. Yan and G. Fang, J. Mater. Chem. A, 2017, 5, 1658 RSC.
- A. A. Asif, R. Singh and G. F. Alapatt, J. Renewable Sustainable Energy, 2015, 7, 043120 CrossRef.
- Y.-J. Jeon, S. Lee, R. Kang, J.-E. Kim, J.-S. Yeo, S.-H. Lee, S.-S. Kim, J.-M. Yun and D.-Y. Kim, Sci. Rep., 2014, 4, 1 Search PubMed.
- K. A. Bush, K. Frohna, R. Prasanna, R. E. Beal, T. Leijtens, S. A. Swifter and M. D. McGehee, ACS Energy Lett., 2018, 3, 428 CrossRef CAS.
- K. T. Cho, S. Paek, G. Grancini, C. Roldán-Carmona, P. Gao, Y. Lee and M. K. Nazeeruddin, Energy Environ. Sci., 2017, 10, 621 RSC.
- N. J. Jeon, J. H. Noh, W. S. Yang, Y. C. Kim, S. Ryu, J. Seo and S. I. Seok, Nature, 2015, 517, 476 CrossRef CAS PubMed.
- H.-S. Kim, A. Hagfeldt and N.-G. Park, Chem. Commun., 2019, 55, 1192 RSC.
- T. Matsui, T. Yamamoto, T. Nishihara, R. Morisawa, T. Yokoyama, T. Sekiguchi and T. Negami, Adv. Mater., 2019, 31, 1806823 CrossRef PubMed.
- J. Prakash, A. Singh, G. Sathiyan, R. Ranjan, A. Singh, A. Garg and R. K. Gupta, Mater. Today Energy, 2018, 9, 440 CrossRef.
- Y. Zhang, G. Grancini, Y. Feng, A. M. Asiri and M. K. Nazeeruddin, ACS Energy Lett., 2017, 2, 802 CrossRef CAS.
- S. Paek, P. Schouwink, E. N. Athanasopoulou, K. Cho, G. Grancini, Y. Lee, Y. Zhang, F. Stellacci, M. K. Nazeeruddin and P. Gao, Chem. Mater., 2017, 29, 3490 CrossRef CAS.
- M. Saliba, J.-P. Correa-Baena, C. M. Wolff, M. Stolterfoht, N. Phung, S. Albrecht, D. Neher and A. Abate, Chem. Mater., 2018, 30, 4193 CrossRef CAS.
- S. Aharon, A. Dymshits, A. Rotem and L. Etgar, J. Mater. Chem. A, 2015, 3, 9171 RSC.
- J. Ciro, R. Betancur, S. Mesa and F. Jaramillo, Sol. Energy Mater. Sol. Cells, 2017, 163, 38 CrossRef CAS.
- Y. Han, S. Meyer, Y. Dkhissi, K. Weber, J. M. Pringle, U. Bach, L. Spiccia and Y.-B. Cheng, J. Mater. Chem. A, 2015, 3, 8139 RSC.
- Y. Rong, Z. Tang, Y. Zhao, X. Zhong, S. Venkatesan, H. Graham, M. Patton, Y. Jing, A. M. Guloy and Y. Yao, Nanoscale, 2015, 7, 10595 RSC.
- Y. Rong, S. Venkatesan, R. Guo, Y. Wang, J. Bao, W. Li, Z. Fan and Y. Yao, Nanoscale, 2016, 8, 12892 RSC.
- Y. Numata, A. Kogo, Y. Udagawa, H. Kunugita, K. Ema, Y. Sanehira and T. Miyasaka, ACS Appl. Mater. Interfaces, 2017, 9, 18739 CrossRef CAS PubMed.
Footnote |
| † Electronic supplementary information (ESI) available. See DOI: 10.1039/d1ta08462c |
| This journal is © The Royal Society of Chemistry 2021 |

