 Open Access Article
Creative Commons Attribution 3.0 Unported Licence
Energy storage mechanisms in vacancy-ordered Wadsley–Roth layered niobates†
Kit
McColl
 a,
Kent J.
Griffith
 b,
Rebecca L.
Dally
 c,
Runze
Li
d,
Jason E.
Douglas
e,
Kenneth R.
Poeppelmeier
 b,
Furio
Corà
 a,
Igor
Levin
f and
Megan M.
Butala
 *df
*df
aDepartment of Chemistry, University College London, London, WC1H 0AJ, UK
bDepartment of Chemistry, Northwestern University, Evanston, IL 60208, USA
cNIST Center for Neutron Research, National Institute of Standards and Technology, Gaithersburg, MD 20899, USA
dDepartment of Materials Science and Engineering, University of Florida, Gainesville, FL 32611, USA. E-mail: mbutala@ufl.edu
eMaterials Science and Engineering Division, National Institute of Standards and Technology, Gaithersburg, MD 20899, USA
fMaterials Measurement Science Division, National Institute of Standards and Technology, Gaithersburg, MD 20899, USA
First published on 11th August 2021
Abstract
Wadsley–Roth (WR) crystallographic shear structures demonstrate high energy and power densities as Li-ion battery anode materials. We report the (de)lithiation behavior of two WR-derived layered niobates: NaNb3O8 and KNb3O8. Both demonstrate multi-electron (Nb5+/Nb3+) redox on the first discharge, reacting with ≈5 mol Li per mol ANb3O8. Li intercalation in NaNb3O8 is dominated by Li-diffusion kinetics and evolution of the interlayer structure, with Li initially filling octahedral sites near the interlayer space to draw the layers together to form a (2 × 2)∞ WR structure. This average structure change pushes Na ions into the square channels, blocking fast Li diffusion down the square channels that provide the fast Li-ion conduction in most WR materials. Upon charge, Li ions incorporated into the octahedral WR sites (ordered vacancies in the layered structure) are extracted, revealing a new, reversible Li site for additional capacity in WR-like materials. The behavior of KNb3O8 is similar, but has additional hysteresis associated with its larger counter-cation. While neither layered niobate matches the demonstrated performance of WR materials, by studying them, we identify a route for increased capacity in WR-like frameworks. Additionally, we identify the important role of Li diffusion kinetics and counter-cations in the cycling behavior of WR-derived structures.
1 Introduction
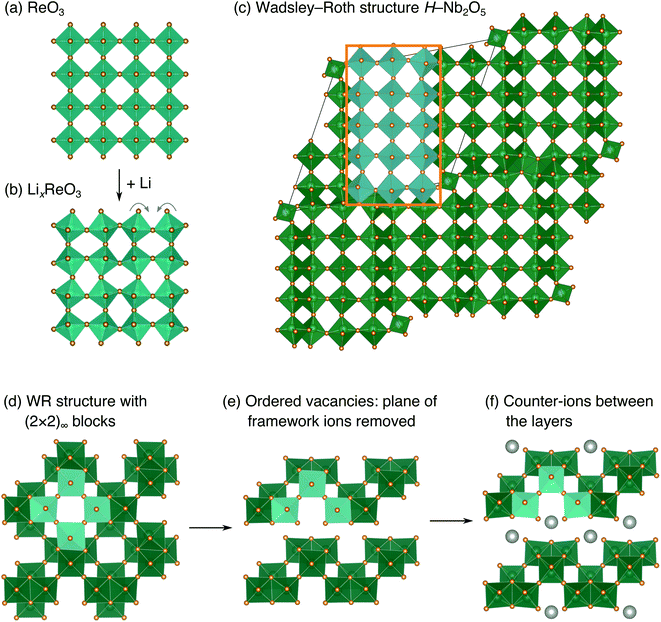
The development of high-power Li-ion batteries requires new anode materials to replace graphite, which fails catastrophically at high cycling rates.1,2 Transition metal oxides (TMOs) with intermediate potentials relative to Li+/Li (termed ‘high potential anodes’) provide fast, reversible Li-ion diffusion, high capacities, and excellent structural and chemical stability.3 Among candidate TMO anodes, Wadsley–Roth (WR) crystallographic shear materials, such as TiNb2O7, Ti2Nb10O29, H–Nb2O5, Nb16W5O55, and Nb18W8O69, exhibit some of the highest capacities and best power densities.4–11 WR materials are a broad structural family, primarily consisting of [MO6] octahedra (where M is a transition metal) forming ReO3-like units linked in various connectivities, and sometimes containing [MO4] tetrahedra.12,13 They are typically oxides based upon Ti, Nb, Mo, V, and/or W, but may be formed with other framework cation species, such as Hf, Fe, P, or Ge, and can exhibit partial occupancy of F on the anion sites.14–20 The wide composition space of WR materials offers opportunities to chemically and structurally tune Li intercalation behavior to optimize energy storage performance.The parent structure of WR phases, ReO3 [Fig. 1a, International Crystal Structure Database (ICSD) 16810 (ref. 21)], is formed of [ReO6] octahedra in a corner-sharing arrangement. ReO3 has poor charge storage properties due to correlated rotations of the [ReO6] octahedra that occur upon Li insertion (Fig. 1b).22 The rotations change the nature of Li-diffusion channels (Fig. 1a and b) and result in an electronically insulating material upon deep discharge.22–25 In WR materials, ReO3-like units form (m × n)∞ blocks [e.g., the (3 × 5)∞ in H–Nb2O5, Fig. 1c].12 The blocks terminate at shear planes where the octahedra in the ReO3-like units are linked through their edges to neighboring blocks. These shear planes provide rigidity to the framework, preventing correlated rotations of the octahedra upon lithiation, during which diffusion is predominantly 1D, down square channels in the centers of the blocks.7,8,23,26 As a result, structural changes across a wide operating composition range are mostly limited to subtle expansions and contractions of lattice parameters.7,8 Because the WR framework structure does not change significantly during lithiation, Li ions retain similar intercalation geometries across different states of charge that result in fast diffusion.26,27 Motivated by their excellent anode properties, we investigated the electrochemical energy storage behavior of variations on the WR structure using complex niobates with layered and ordered-cation-vacancy motifs (Fig. 1d–f).
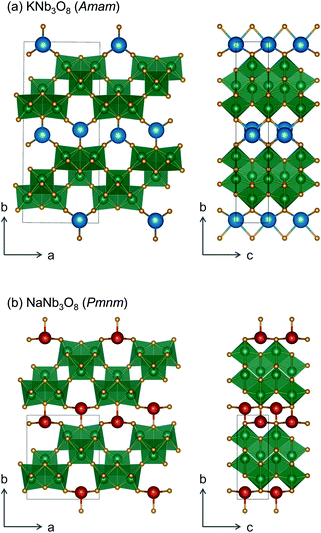
We report the lithiation mechanism, Li-ion diffusion pathways, and average structure evolution in layered niobates NaNb3O8 and KNb3O8. These are derived from a hypothetical body-centred tetragonal (2 × 2)∞ WR structure28 by replacing a plane of framework Nb atoms with ordered vacancies, resulting in Nb3O8 sheets with a combination of edge- and corner-sharing octahedra (Fig. 2a,b). Large K+ or Na+ counter-cations reside near the ordered vacancies and prop the sheets apart to form a layered framework [general example in Fig. 1f, specific cases in Fig. 2, ICSD 31994 (ref. 29) and ICSD 202400,30 respectively]. The counter-cation size and preferred coordination impact the layer stacking, both in terms of interlayer distance and stacking sequence. In KNb3O8, adjacent Nb3O8 layers are off-set from one-another by  , giving AB stacking, while NaNb3O8 has AA stacking, approximately halving the unit cell volume (Fig. 2).
Electrochemical cycling of KNb3O8 as an electrode has been previously reported for Na- and Li-ion-based energy storage.31–33 To the best of our knowledge, this is the first reported electrochemical cycling of NaNb3O8. In the previous electrochemical studies of KNb3O8, asymmetric cycling profiles indicate a different path upon discharge and charge, as has been observed for other K–Nb–O compounds.34,35 Incorporation of specialized carbon additives and reduction of particle dimensions have been reported and show improved rate capabilities and capacity retention,32,33 but the underlying intercalation mechanisms have not yet been discerned, and are our focus here.
The electrochemical energy-storage behavior of NaNb3O8 and KNb3O8 as Li-ion electrodes was analyzed using a combination of ex situ and operando X-ray diffraction (XRD), high-resolution transmission electron microscopy (HRTEM), solid-state nuclear magnetic resonance (NMR) spectroscopy of 93Nb, 23Na, and 7Li nuclei, and hybrid-exchange density-functional-theory (DFT) calculations. The work reveals new insights into Li diffusion kinetics, structural transformations, and charge-storage mechanisms in WR-derived materials with layered and vacancy-ordered modifications and counter-cations.
2 Results & discussion
2.1 Synthesis and initial structures
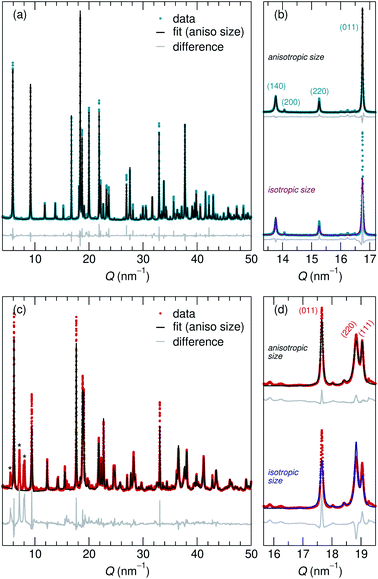
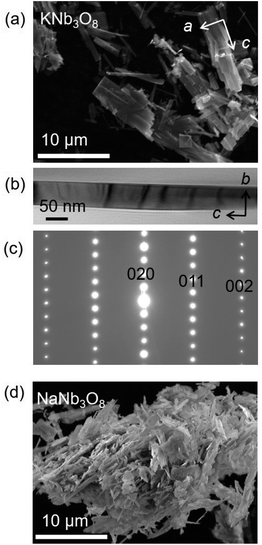
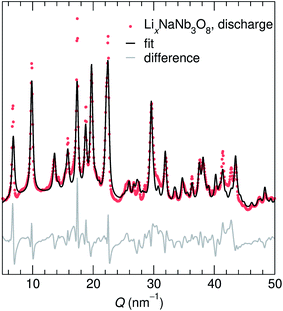
Adapting previously reported molten-salt syntheses,36,37 we produced KNb3O8 by heating K2CO3 and Nb2O5 in molten KCl at 800 °C for 5 h. High-resolution synchrotron XRD showed agreement with the published Amam structure.29 However, there appeared to be peak intensity mismatch for several reflections, including some at low momentum transfer, Q (Fig. 3a). TEM micrographs indicate rectangular platelets with particle dimensions varying as a function of crystallographic direction (Fig. 4a–c). SAED patterns show well-defined diffraction spots without streaking, consistent with a regular stacking arrangement and the absence of stacking faults.Rather than extended defects, the apparent peak intensity mismatch was in fact systematic index-dependent width mismatch for several reflections, which resulted from anisotropic particle size along crystallographic directions. Integrated intensity of synchrotron XRD data was overall well-captured using Rietveld refinement with an anisotropic size broadening model (based on linear combinations of spherical harmonics) and an isotropic strain parameter contributing to the Lorentzian line shape (Fig. 3). The dramatic shape anisotropy evident in micrographs is reflected in refined average dimensions for the principal axes of 263.9 nm (h00), 78.6 nm (0k0), and 6511 nm (00l). It is important to note that the method for extracting these quantitative results gives only the average value of particle size along each direction, and does provide information on the distribution of particle sizes. The relative refined particle dimensions are consistent with TEM micrographs, which together indicate the platelets' shortest dimension in the stacking direction (lattice parameter b) and their longest dimension along the chains of edge-sharing polyhedra (lattice parameter c) (Fig. 4). The XRD fit with isotropic size broadening and isotropic strain is shown for comparison in Fig. 3b, which highlights the index-dependent peak broadening.
A survey of other studies on KNb3O8 found their XRD data have a variation of maximum peak intensity of the same reflections across samples.38–40 While these studies did not model microstructure effects in their diffraction data, it is likely that the deviations resulted from anisotropic particle size, preferred orientation, or a combination thereof. These various distributions of peak intensities per reflection character suggest a dependence of morphology on synthesis route (e.g., molten salt, solid state, hydrothermal).
NaNb3O8 was prepared from KNb3O8 using soft chemical methods, with intermediate hydrate phases.30 In several repetitions of the synthesis, there were variations in the phase purity of intermediate hydrates that resulted in a minor fraction of unidentified phase(s) (≤ 5% by volume) in addition to NaNb3O8 (Fig. 3c). High-resolution XRD of NaNb3O8 revealed a similar index-dependent variation of peak width as that observed for KNb3O8, and the general features were modeled using a similar combination of isotropic strain and anisotropic particle size broadening. SEM (Fig. 4d) shows a larger dispersity of particle dimensions for NaNb3O8 than KNb3O8. This dispersity, as well as the impurity, leads to less confidence in the quantitative particle size from refinement due to the overall poorer fit. However, the particles once again had their shortest dimension in the stacking direction (lattice parameter b) and their longest in the direction of the polyhedral chains (lattice parameter c). Additional complexity in the analysis of NaNb3O8 may also arise from a higher degree of strain, which could be introduced during the low temperature ion-exchange process, though we are not able to quantitatively determine this with the dataset.
Further details about Rietveld analysis of KNb3O8 and NaNb3O8 are provided in the Methods and ESI† sections, including expanded plots of XRD data and fits (Fig. S1 and S2†).
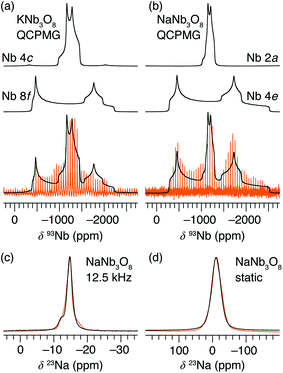
Average structure characterization is complemented by the local structure perspective from solid-state nuclear magnetic resonance (NMR) spectroscopy. Despite the change in stacking sequence upon ion-exchange from K+ to Na+, and associated decrease in interlayer spacing, the intralayer structure remains very similar, as reflected in the refined average structure as well as the similar features in the 93Nb NMR spectra (Fig. 5a and b). For KNb3O8 and NaNb3O8, the 93Nb central-transition spectra, collected using the quadrupolar Carr–Purcell–Meiboom–Gill (QCPMG) sequence, span about 2000 ppm at 9.4 T at room temperature (Fig. 5a and b). The two Nb sites in the structures can be fit using two quadrupolar lineshapes with numerical simulations guided by CASTEP PBE DFT calculations41–44 and fit to within 15% of the calculated quadrupolar coupling magnitudes. The local coordination is consistent with the structure models wherein the Nb(1) site in the double-width chain is considerably more distorted than Nb(2) in the single-width chain (see calculated and experimental NMR parameters in Tables S3 and S4,† respectively). For NaNb3O8, the observed 23Na quadrupolar coupling (0.52(5) MHz; the uncertainty value specified in parentheses refers to a single standard deviation associated with the fitting procedure) is far smaller (< 40%) than the calculated value (1.36 MHz), which suggests fast room-temperature Na-ion dynamics (Fig. 5c and d).45,46
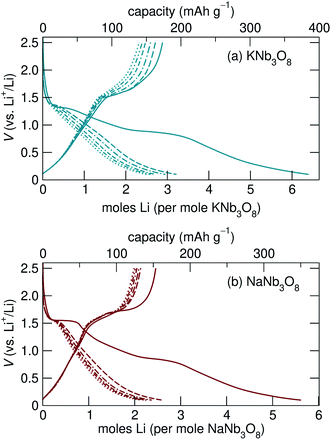
2.2 Cycling
Loose-powder electrodes of the active material mixed with conductive carbon additive (SuperP) were assembled into home-built Swagelok cells for electrochemical cycling against Li metal anodes. As structural evolution rather than absolute cycling performance is the focus of this work, cell construction and cycling parameters were not optimized. The assembled half cells were cycled at slow rates, reacting with 1 mol Li per mol ANb3O8 in 30 h; with ≈6 mol Li on the first discharge, this corresponds to roughly C/180; in later cycles reaction with ≈2 mol Li, this corresponds to roughly C/60. The cycling profiles of KNb3O8 and NaNb3O8 show similar features (Fig. 6). On the first discharge (Fig. 6), both have a plateau near 1.5 V corresponding to a chemical formula of approximately LiANb3O8. This high-potential plateau is followed by a sloped region, over which an additional ≈2 mol Li react. A second plateau near 1 V is followed by another sloped region where an additional ≈2 mol Li react.With the applied cycling conditions, both compounds react with about 6 mol Li per formula unit (or 2 mol Li per mol Nb) on the first discharge. However, as reported by See et al., conductive carbon additives have considerable contributions to capacity during cycling to low potentials.47 This effect, in combination with solid electrolyte interphase (SEI) formation, undoubtedly contributes to the measured capacity at low potentials. Future consideration of these materials in applied studies should certainly consider a higher minimum potential limit, but here we focus on identifying charge-storage mechanisms, including at low potentials.
Beyond the first cycle, there is a reversible capacity of ≈3 mol Li per mol KNb3O8 (or 1 mol Li per Nb) and ≈2 mol Li per mol NaNb3O8, which slowly fades with each cycle in these unoptimized cells (Fig. 6). Second and later discharge cycles have a small plateau and a long sloped region, with the majority of the capacity coming from the latter. Charge cycles begin with a sloped region, which contributes less than half of the reversible capacity, and the majority of the charge capacity takes place over a plateau near 1.5 V. The difference in charge distribution over slopes and plateaus between discharge and charge indicates asymmetric processes, as has been observed for other intercalation electrode materials, including compositionally-related KNb5O13,35 in which the order of Li sites filling and unfilling varies.
The most notable difference in the cycling of KNb3O8 and NaNb3O8 is the voltage hysteresis of the high potential plateau between charge and discharge. For KNb3O8, the high potential plateaus are separated by about 0.3 V, as opposed to about 0.1 V for NaNb3O8. This difference in potentials indicates a difference in the charge-storage processes between these two compounds despite their structural and chemical similarities. To understand this difference, the previously mentioned asymmetric cycling profiles, and generally how these compounds store charge, we detail below the structural evolution at various states of charge using ex situ and operando synchrotron X-ray scattering and DFT, complemented by ex situ NMR and electron microscopy.
2.3 NaNb3O8 structural evolution with cycling
| 010 position, (Q, nm−1) | d 010, (Å) | 002 position, (Q, nm−1) | d 002, (Å) | |
|---|---|---|---|---|
| NaNb3O8 (pre-cycle) | 6.2 | 10.2 | 33.1 | 1.9 |
| Operando partial discharge, to 1.35 V | 6.6 | 9.6 | 32.4 | 1.9 |
| Operando full discharge, to 0.1 V | 6.7 | 9.3 | 31.9 | 2.0 |
| Ex situ full discharge, to 0.1 V | 6.7 | 9.3 | 32.0 | 2.0 |
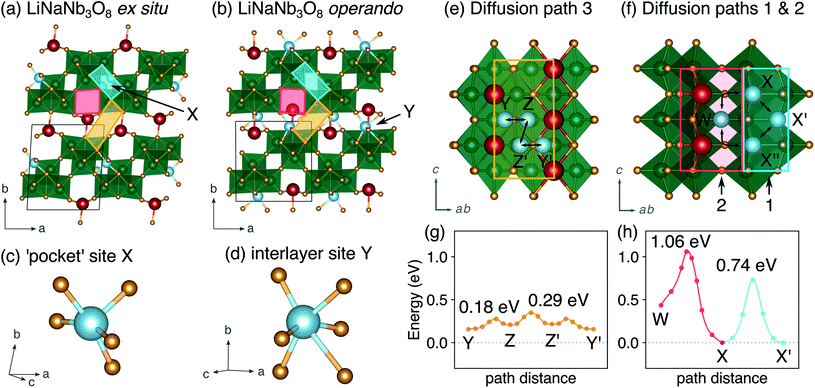
The difference between operando and ex situ XRD results for the intermediate discharge product (approximately LiNaNb3O8) are resolved by DFT calculations of the energetics and kinetics of Li site filling. The DFT calculations identify two low-energy sites for Li in NaNb3O8 under dilute conditions, labeled X and Y (Fig. 9c and d). Site X is a five-fold coordinated square-pyramidal ‘pocket’ in the Nb3O8 layers (Fig. 9a and c) and site Y is a distorted octahedral site in the interlayer space (Fig. 9b and d).
Li ions occupying ‘pocket’ sites are a common feature of WR materials, such as TiNb2O7 and Nb2O5–WO3 phases that contain ‘capped’ ReO3-like units (defined as type II WR cavities by Cava et al.).6–8,13 To the best of our knowledge, octahedral Li ion sites have not been reported previously in WR-like materials. In the WR phases studied for Li intercalation, framework transition metal (TM) ions typically occupy all of the possible octahedral sites in the defect fcc O2− sublattice.48
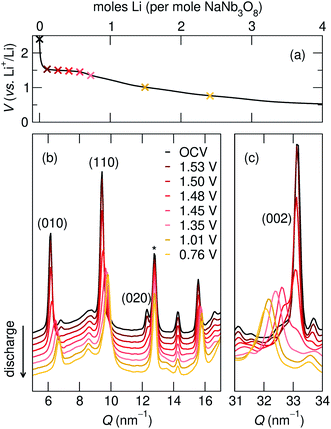
At a composition of LiNaNb3O8, the structure with Li ions filling site X is more stable than with Li ions filling site Y by 0.082 eV per formula unit (f.u.) NaNb3O8. The calculated lattice parameters (Table 2) show the framework structure is relatively unchanged with Li ions in the low-energy X sites, consistent with ex situ XRD (Fig. 8 and S3†). In contrast, filling metastable Y sites leads to a contraction of the interlayer space (lattice parameter b) (Fig. 9b), in agreement with operando XRD data (Fig. 7 and S3†). We find the interlayer contraction occurs because the Li ions in Y sites (tucked into voids behind Na+) bond to O ions across layers, drawing the Nb3O8 layers closer together and pushing Na ions into the square channels.
| x | Sites | a (Å) | b (Å) | c (Å) | α (°) | β (°) | γ (°) | E above hull (eV f.u.−1) |
|---|---|---|---|---|---|---|---|---|
| a Corresponding to ex situ XRD analysis. b Corresponding to operando XRD analysis. | ||||||||
| 0 | 8.853 | 10.393 | 3.790 | 90.000 | 90.000 | 90.000 | 0.000 | |
| 1 | Xa | 8.819 | 10.434 | 3.887 | 86.652 | 90.004 | 89.995 | 0.000 |
| Yb | 8.837 | 9.342 | 3.946 | 90.255 | 90.004 | 90.006 | 0.082 | |
| 3 | Y + Z | 8.612 | 9.254 | 4.240 | 90.000 | 90.006 | 90.255 | 0.454 |
| X + Y | 9.133 | 9.165 | 4.127 | 90.000 | 90.000 | 86.652 | 0.000 | |
| 5 | X + Y + X | 9.123 | 9.188 | 4.262 | 90.409 | 91.004 | 89.987 | 0.000 |
Using DFT, we compared the kinetics of Li diffusion to fill X and Y sites. Li diffusion in NaNb3O8 is one-dimensional and takes place along the c direction, either between or within the Nb3O8 layers (Fig. 9e and f). To fill X sites, Li ions must move within the Nb3O8 layers either via ‘cross-block’ hops (path 1), which have an activation barrier of 0.74 eV, or through the square channels via a metastable high-energy square-planar site ‘W’ (Fig. S13†), overcoming a barrier of 1.04 eV (path 2) (Fig. 9h). The high barrier for the ‘cross-block’ hop is due to Li–Nb repulsion, while the still higher barrier to move along the square channel results from Li–Na repulsion: Li+ must move past Na+ to migrate down the channels.
In the interlayer space, Li moves between Y sites following a zig-zag pathway (path 3) through two metastable distorted tetrahedral sites (denoted ‘Z’) (Fig. 9e and g). The activation barrier for mobility in the interlayer space is 0.29 eV, much lower than for paths 1 and 2 within the Nb3O8 layers. Diffusion in the interlayer space is therefore kinetically favorable, and leads to the formation of the metastable intermediate cycling product with a contracted interlayer distance and Li in higher energy Y sites, as was observed at the end of the first plateau in operando XRD. In ex situ experiments, Li ions relax to occupy the thermodynamically favorable X sites, allowing the interlayer separation to expand back to a similar distance in the pristine material. We note that Y and Z sites cannot be occupied simultaneously under dilute Li conditions, since the two sites face-share; occupation of a Y site will push an adjacent Li from a Z site into the next Y site. However, under non-dilute conditions, Z sites adjacent to Y sites can be filled, which is discussed in greater detail later.
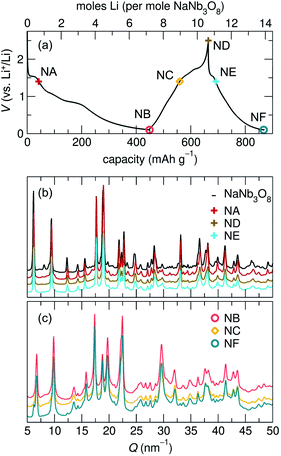
At the end of the first discharge, ex situ and operando XRD are consistent and indicate a final structure with Li in interlayer and intralayer sites. Rietveld refinement of the ex situ discharge product (NB) using DFT-predicted Li5NaNb3O8 (with all X, Y and Z sites filled) captures the major reflections (Fig. 10). This is in qualitative agreement with our first discharge capacity (≈6 mol Li) with some additional capacity resulting from side reactions at low potentials, a combination of reactions with carbon and solid electrolyte interphase formation.47 Additionally, NMR indicates the reduction of all Nb (discussed in detail later), which gives rise to electronic changes in the material and the resulting Nb spectra at the discharged state. Together, the XRD, DFT, and NMR results strongly suggest a complete reaction, or at least homogeneous reactivity, of NaNb3O8, even as loose-powder electrodes.
The remainder of the first charge takes place over a plateau at 1.5 V, after which ex situ XRD indicates a final average structure nearly identical to pristine NaNb3O8 (ND, Fig. 8) despite some Li remaining in the structure (from NMR, the estimated composition is Li2.2NaNb3O8, see ESI Table S5† for details). This suggests a recovery of the original, larger interlayer spacing, with the remaining Li predominantly occupying ‘pocket’ X sites. Based on our observations of the metastable intermediate discharge product, it is unclear if the ex situ charge product has again evolved between cycling and structural characterization. It is worth noting that operando XRD over only the high potential plateau shows electrochemical and structural reversibility of this interlayer contraction and expansion, as well as a more symmetric galvanostatic profile (Fig. S5†). While the high potential process appears to have symmetric (de)lithiation, the difference in the final composition between the two charge products does not allow for extrapolation of the nature of the charge product following a deeper discharge.
This assignment of X sites as the primary origin of irreversible capacity is supported by our observations for cycling over only the high potential features (using a minimum potential of 1.4 V). Operando XRD over this potential range shows contraction and expansion of the interlayer space, indicating Li (de)insertion into the interlayer Y site and only mild, gradual capacity fade without deep discharge. Likewise, we propose that the reversible capacity in second and later cycles for NaNb3O8 arises from the (de)insertion of Li in Z and Y sites.
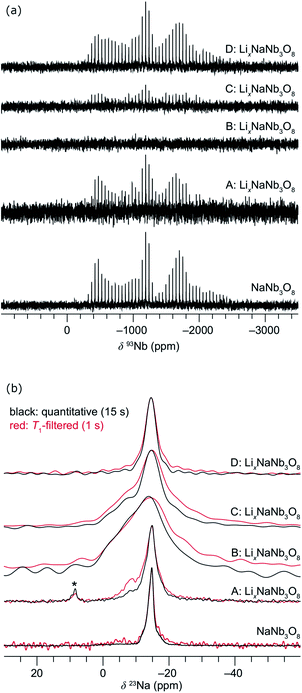 | ||
| Fig. 11 Evolution of the ex situ (a) QCPMG 93Nb MAS NMR and (b) 23Na MAS NMR of LixNaNb3O8 at various states of charge. Sample labels correspond to the ex situ cycling and XRD data in Fig. 8: NaNb3O8 before cycling, (A) after reaction with 1 mol Li, (B) end of first discharge, (C) halfway through first charge, and (D) at the end of the first charge. The y-axis corresponds to intensity, which is shown here on a relative scale. In (b), quantitative (black) and T1-filtered (red) spectra are overlaid, recycle delays are given in the legend, and maximum intensities are normalized to highlight the changes in lineshape. A small impurity from sample preparation is denoted with an asterisk. | ||
Upon reaction with Li, the 23Na resonance broadens and additional intensity is observed at higher frequencies (Fig. 11b, A and B). The full-width at half maximum (FWHM), 2 ppm in pristine NaNb3O8 (12.5 kHz MAS), increases to 16 ppm when fully discharged. Upon charge, the 23Na resonance does not return to its original narrow lineshape and, unlike the Nb local environment, is irreversibly altered from that of the pure compound. This suggests that some Li remains in the structure after charge, affecting the Na local environment.
Another insight from NMR is that no residual 93Nb signal, nor sharp 23Na signal, is present at the end of discharge, indicating a relatively homogeneous and complete reaction rather than the presence of unlithiated particles or an inhomogeneous distribution of composition across domains. Insights from 7Li are limited due to the broad lineshape and narrow shift range; however, two apparent features are (i) the broadened signal at deep discharge and (ii) a resonance that comes in at −7.5 ppm (Fig. S12†). The correlation between line broadening and Li concentration could be due to increased homonuclear dipolar coupling, an increase in the number of sites, or slower kinetics, which limit signal averaging. The negatively shifted resonance is outside the range for diamagnetic Li, but has been observed in other Nb-based oxides, such as WR structure LixTiNb2O7, where it was correlated with electron localization.8
2.4 Site-filling mechanisms in LixNaNb3O8
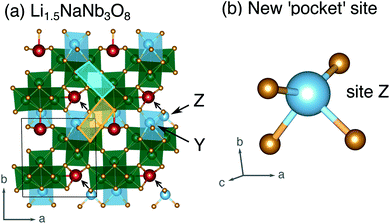 | ||
| Fig. 12 (a) Structure of Li1.5NaNb3O8 with Z sites filled, causing Li–Na repulsion and displacement of Na (red). (b) Geometry of the four-fold-coordinate Li ion in pocket site Z. | ||
In WR materials, rapid Li-ion diffusion typically occurs down the square channels, hopping from window-to-window site with low barriers of ≈0.3 eV to 0.4 eV.8,26 In pristine NaNb3O8, Li–Na repulsion results in a large barrier of 1.04 eV for Li diffusion down the square channels (Fig. 9h). Calculations for Li diffusion along the same path at a composition of LiNaNb3O8 with the interlayer sites filled show an increased barrier of 1.48 eV (Fig. S14†). The interlayer contraction causes the Na ions to be pushed into the square channels, further impeding the mobility of Li along this path. Li ions must instead diffuse along the channels at the edges of the blocks, by ‘cross-block’ hops. To fill X sites, Li must move along channels between [NbO6] octahedra (Fig. 9a, cyan channel), whereas to fill Z sites, the Li ions must move along channels between [LiO6] and [NbO6] octahedra (Fig. 9a, gold channel).
Previously published DFT calculations for TiNb2O7 revealed the activation barrier for cross-block hops increases as the charge of the framework cation increases, due to greater electrostatic repulsion.8 This observation follows a similar principle to the models of Li diffusion in disordered rocksalt compounds, where the activation barrier varies depending on the number of faces the mobile Li shares with Li vs. TMs.49,50 We therefore expect Li diffusion in LixNaNb3O8 to be easier between Z sites, down channels formed by [LiO6] and [NbO6] octahedra, in which the mobile Li will experience a smaller electrostatic repulsion moving past octahedra containing Li+ than Nb(4+/5+).
The thermodynamic ground-state hull results from filling X sites between 0 < x ≤ 1 (Fig. 9a), followed by Y sites between 1 ≤ x ≤ 2 (Fig. 13c, structure D), then the remaining X sites between 2 ≤ x ≤ 3 (Fig. 13c, structure G), and finally Z sites between 3 ≤ x ≤ 5 (Fig. 13c, structure I). The calculated voltage curve based on these ground-state hull structures (blue curve in Fig. 13b) shows a plateau at 1.6 V for 0 < x ≤ 2 with a slight step at x = 1, followed by a large step at x = 2 (to 0.7 V), a smaller step at x = 3 (to 0.5 V), and a plateau to x = 5. This is different than the experimental voltage curve, which shows a clear drop just before x = 1, followed by two solid-solution-type regions when 1 ≤ x ≤ 5.
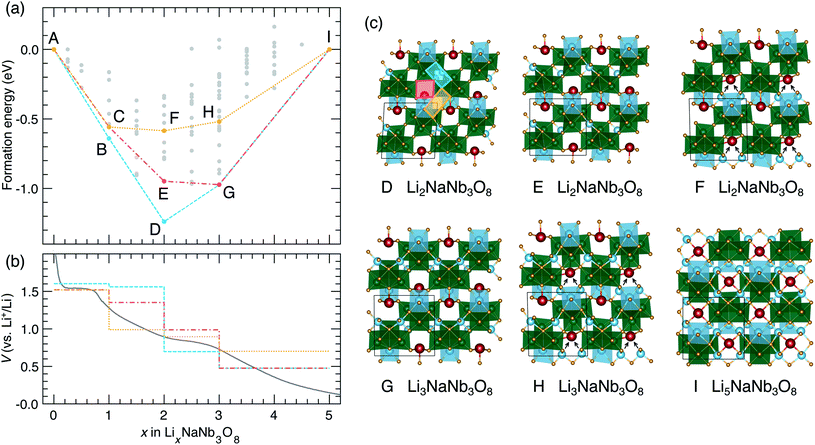 | ||
| Fig. 13 Lithiation of NaNb3O8 from DFT calculations. (a) Convex hull, showing the ground-state hull, and two convex hulls based on site filling determined by diffusion kinetics. Letters indicate structures along the hull. Structures B and C are presented in Fig. 9. (b) Experimental and calculated voltage curves, from the convex hulls in (a). (c) Structures along the convex-hulls from (a). | ||
Such a difference between the experimental and computed voltage from the ground-state hull is additional evidence that Li diffusion kinetics determine the site filling in NaNb3O8, with metastable Y sites filled before more stable X sites. Two alternative calculated voltage curves are presented in Fig. 13b (red and orange), based on filling Y sites to x = 1, corresponding to the operando XRD product, followed by filling of sites X and Z. From the metastable LiNaNb3O8 structure, filling X sites down alternate channels (Fig. 13c, structure E) results in a low-energy structure, however, the step in the computed voltage curve at x = 1 is relatively small. From LiNaNb3O8, filling Z sites instead involves Li ions moving down the block-edge channels bordered by [LiO6] and [NbO6]. This results in a higher-energy structure (Fig. 13c, structure F), but a larger drop in the voltage curve at x = 1 that better reproduces the experimental voltage.
Even so, none of the calculated voltage profiles match with experiment perfectly. The experimental voltage profile between 1 ≤ x ≤ 5 is sloping, indicating solid-solution-type behavior that cannot be captured in the DFT calculations, which are limited to enumerating configurations within a small unit cell. We speculate that the site-filling mechanism for 1 ≤ x ≤ 3 involves the preferential filling of Z sites, based on the step in the voltage curve and the easier diffusion along channels to access Z sites, but we cannot rule out some diffusion to fill X sites. For 3 ≤ x ≤ 5, a second solid-solution mechanism occurs, filling the remaining empty X or Z sites along the shear planes. At a composition of Li5NaNb3O8, Na ions are pushed into the center of the square channels, as all the pocket sites surrounding the central cavity are occupied by Li ions (Fig. 13c, structure I).
2.5 KNb3O8 structural evolution with cycling
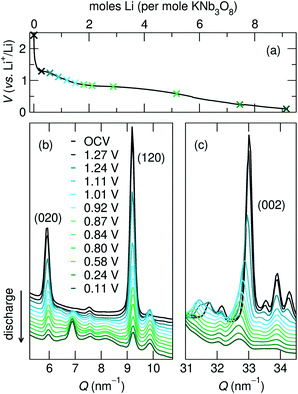
The structural evolution of KNb3O8 generally shows similarities to NaNb3O8, but a number of differences arise, which likely stem from the different stacking sequence for the two materials in their pristine state.During the first discharge of LixKNb3O8, operando XRD shows a decrease in intensity of the 020 reflection concurrent with the growth of a new reflection at slightly higher Q (≈7 nm−1) (Fig. 14a and b). The correlated exchange of intensity between these peaks suggests a two-phase transformation upon lithiation of KNb3O8. Based on our findings for NaNb3O8, we interpret the new reflection as corresponding to a smaller b lattice parameter arising from a reduction of the interlayer spacing. The position of this new reflection is similar to that of the final 010 reflection for LiNaNb3O8, in further support of this proposed change. Also similar to the Na analogue, we see a gradual shift of the 002 reflection to lower angle, indicating an expansion of the c lattice parameter. Similar trends in average structure evolution have been observed during electrochemical cycling of KNb3O8 as a Na-ion electrode.31
As was found for NaNb3O8, we find discrepancies between ex situ and operando characterization of KNb3O8 cycling products. From operando XRD, we observe a two-phase coexistence at the end of the first plateau (x ≈ 1) (Fig. 14). However, ex situ XRD shows an average structure nearly identical to the pristine niobate (KNb3O8 and KA, Fig. S6†). Likewise, electron diffraction reveals discrete 020 spots at this intermediate state of charge, showing no evidence of a second stacking sequence (Fig. S9†). However, we do find domains within crystallites, separated by low-angle boundaries (≈14°, Fig. 15a and b). The domains themselves maintain crystalline order and a single, well-ordered stacking sequence.
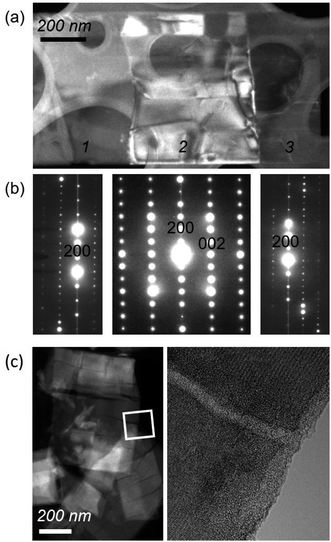 | ||
| Fig. 15 (a) Dark-field TEM image of a KNb3O8 crystallite after partial discharge (to about LiKNb3O8) shows segmentation into domains (labeled 1, 2, and 3). (b) As revealed by selected-area electron diffraction patterns from the three domains in (a), the domains share the same crystal structure and are separated by low-angle boundaries. Domain 2 is oriented with its [010] direction parallel to the beam, while domains 1 and 3 are tilted by about 14° from the in-plane [100] direction of domain 2. The contrast in domain 2 is consistent with the presence of twin-like domains. (b) Electron diffraction patterns show that each region is crystalline, with evidence of twin-like domains across region 2. (c, left) STEM high-angle annular dark-field imaging after several cycles shows crack-like channels across the platelets of LixKNb3O8. (c, right) High-resolution TEM (down the [010] zone axis) shows crystallinity is retained on either side of the ‘crack’ region, and reveals amorphous contrast within these features. EELS spectra in the amorphous channel and its adjacent crystalline areas each indicate K, Nb, and O are present (see Fig. S10†). | ||
Over the remainder of the discharge, operando XRD shows relatively minor average structure changes, and at the end of the discharge some intensity remains at the original 020 reflection position, while the new, higher Q reflection is more intense (Fig. 14). The ex situ discharge product shows three peaks in this low Q range (KB, Fig. S6†), suggesting different stacking sequences are present. The dominant stacking reflection in the operando discharge product supports a reduction of the b lattice constant, as seen for Li5NaNb3O8. TEM of the first discharge product shows lighter-contrast channels across crystallites and ordered stacking, with no sign of multiple stacking sequences within the crystallite (Fig. S9†). While this is inconsistent with XRD data for the discharge product, the two techniques differ by their statistical sampling (i.e., selected particles suitable for electron diffraction and imaging in TEM versus ensemble average in XRD). Thus, one possible interpretation of this discrepancy is that the various reflections associated with the stacking direction (and lithium composition) in XRD arise from variation between, rather than within, particles. Alternatively, such a phenomena could be the result of Li composition gradients within particles, as has been observed in V2O5.51
After several cycles, what appeared as channels after the first discharge resemble cracks in TEM micrographs (Fig. 15c, left). However, high-resolution TEM shows some of these regions have an amorphous structure, rather than being true cracks (Fig. 15c, right). The difference in density, rather than the atomic species present, results in the contrast between the channels and crystalline regions surrounding them. Electron energy loss spectroscopy (EELS) reveals that K, Nb, and O atoms are present in these amorphous channels (Fig. S10†). We propose these channels are the result of defect aggregation (e.g., dislocations) to alleviate strain associated with structure evolution upon (de)lithiation or as a result of relaxation from a higher energy metastable product. Given the similar crystallographic orientation of these channels and the low-angle boundaries in the partial discharge product, it is possible that those boundaries are the origins of the channels observed upon continued cycling.
Upon charge, operando XRD shows the initial average structure is partly recovered, albeit with a decrease of peak intensity and some of the discharge product (with a smaller interlayer spacing) remaining. The former is likely a consequence of reduced domain sizes, as observed in TEM for discharge products. The latter is consistent with ex situ XRD insofar as that various interlayer spacings (corresponding to different Li compositions) co-exist in the sample (KD, Fig. S6†). The multiple peaks in the XRD after discharge and charge indicate an incomplete reaction and heterogeneous products (chemically and structurally), in contrast to NMR and XRD indications of homogeneous NaNb3O8 cycling products. This could have several origins, e.g., the generation of phases with sluggish Li diffusion or a loss of electrical conductivity across amorphous channels, each of which could result in electrochemically inactive regions or particles.
Building upon the similarity of the initial structures and average-structure changes indicated by XRD reflections, especially the 0k0 and 002, we propose that the dominant structure evolution during (de)lithiation is the decrease (increase) of the interlayer spacing. There are several open questions regarding this change, for example, does such a change to the interlayer spacing involve a change of the stacking sequence (from AB to AA, Fig. 2a and b)? If so, this could involve staging or relaxation to intermediate stacking sequences, which would be supported by the multiple low Q reflections in ex situ XRD.
Stacking changes in NaNb3O8 are associated with Li between the layers, and result from the reduction of the interlayer spacing. In the pristine materials, we see that the counter-cation size and preferred coordination determine the interlayer spacing. Accordingly, it seems that intercalated Li between the layers has a similar effect in the cycling products of both compounds. In KNb3O8, however, the high potential plateau has more hysteresis between discharge and charge than NaNb3O8, suggestive of a more extensive atomic structure change over this feature during cycling, perhaps even a change of stacking sequence in addition to interlayer spacing. A similar reduction of interlayer spacing (indicated by a new reflection near 7 nm−1) is observed in operando XRD over only the high potential plateau, as is the relatively large voltage hysteresis (Fig. S8†). For KNb3O8, the average structure evolution is not as reversible as for the Na analogue, evidenced in the various low angle Bragg peaks in ex situ diffraction as well as the aggregation of defects to form amorphous channels within particles. However, we cannot confirm whether average-structure changes and their irreversibility are the cause or result of separate domains formed within particles during cycling.
3 Further discussion & context
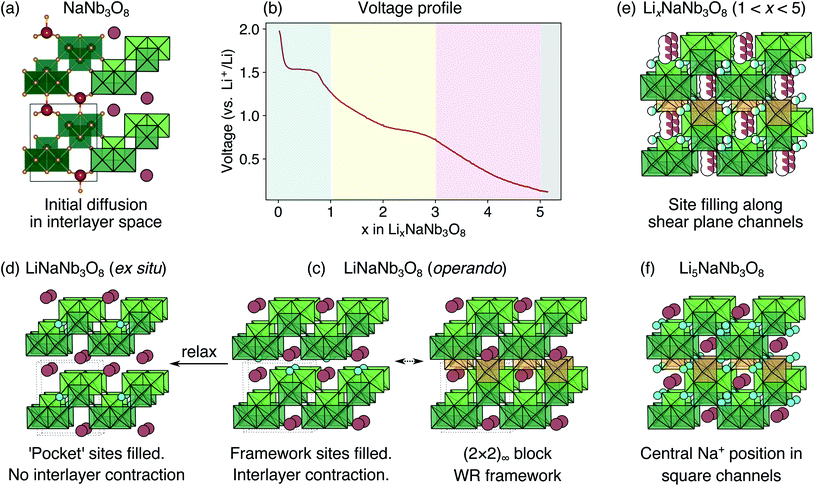
It is interesting to compare how Li intercalation proceeds in layered, vacancy-ordered NaNb3O8, summarized in Fig. 16 (and KNb3O8), and conventional WR materials. In TiNb2O7, H–Nb2O5 and Nb2O5–WO3, Li diffusion is quasi-1D, taking place almost exclusively along square channels in the blocks.6–8 Some coupling and correlation between Li in different channels, identified in Li8Nb12WO33 and Li8Nb14W3O44, changes the nature of the diffusion from purely 1D.26In NaNb3O8, diffusion does not occur down the square channels, which are blocked by Na ions. Instead, Li ions initially move down channels in the interlayer space, pathways that are absent in conventional WR phases. In the interlayer space, Li-ions fill the ordered octahedral framework vacancies, forming a WR framework with (2 × 2)∞ blocks. These octahedral ‘vacancy’ sites do not exist in conventional WR materials, where all octahedral sites not face-sharing with tetrahedral cations are occupied by framework cations (typically transition metals). Li-ion insertion sites in conventional WR materials are square-planar or square-pyramidal, except for some ‘in-tunnel’ sites for Li in TiNb2O7 under dilute conditions.8 Filling framework vacancies is a new charge-storage mechanism for WR-type materials. This results in high theoretical capacities for Li5NaNb3O8 and Li5KNb3O8 of ≈300 mA h g−1.
As the octahedral framework vacancies are filled upon Li intercalation in these layered niobates, the interlayer space contracts as Li ions bond to O in adjacent layers. The layer contraction pushes Na (or K) ions further into the square channels. With the Na ions further into the square channels, Li diffusion down these channels is even more strongly impeded. Li ions are forced to move down shear planes through ‘cross-block’ hops, which have high activation barriers. This is a different diffusion mechanism than in conventional WR materials, where diffusion via cross block hops is always prohibitively sluggish compared to diffusion down square channels.8,26 The low overall rate performance of NaNb3O8 is likely due to Li ions moving down these high-energy pathways. On charge, some Li remains in the structure, which our results suggest is in the X sites; this suggests a charge product similar to the ex situ LiNaNb3O8 structure in which Li moves from the metastable Y site to the more stable X site, resulting in an interlayer spacing resembling pristine NaNb3O8. We predict that Li is extracted first from the Z sites along shear-plane channels, followed by the Y sites. The Li stuck in the structure lowers the reversible cycling capacity, resulting in an operating range of about 2 ≤ x ≤ 4 in LixNaNb3O8.
A comparison of the cycling and structure evolution of LixNaNb3O8 and LixKNb3O8 shows the general intercalation mechanism and order of Li site filling are similar. However, some subtle differences that arise are associated with the different stacking sequence for KNb3O8 (AB) compared to NaNb3O8 (AA), and are likely associated with a change in the stacking sequence for LixKNb3O8 from AB to AA over the high-voltage plateau. We propose this change in stacking sequence is the source of the additional hysteresis of the high-potential feature for KNb3O8. The general similarities in the cycling for both compounds highlight the stability of the WR-type Nb3O8 layers, leaving the differences to arise from changes to the interlayer structure, dependent on the counter-cation.
The combination of relatively extensive average structure evolution and blocked square-channel diffusion pathways results in the poor rate capabilities of NaNb3O8 and KNb3O8 for Li transport. However, there may exist layered structures with larger block sizes that allow fast diffusion down square channels while also incorporating Li into framework vacancy sites to achieve high capacity. The incorporation of a lower valent ion (such as Li or Na) rather than high valent d0 TMs along the shear plane lowers the electrostatic repulsion for mobile Li ions along these pathways, benefiting ion diffusion, analogous to transport properties in cation-disordered rocksalt cathodes.49,50 Diffusion of Na ions down square channels in WR and structurally related materials is limited by high activation barriers.8,27 However, the dynamics of Na apparent in NMR of NaNb3O8, as well as the previously reported Na-ion storage in KNb3O8,31 indicate that Na is mobile between the layers in these materials. Accordingly, WR-derived structures, such as the layered compounds studied here, may also be applicable hosts for other large cation species.
4 Conclusions
In the search for high-rate Li-ion electrode materials and their design rules, we investigated ANb3O8 (A = Na, K), which are layered, vacancy-ordered derivatives of Wadsley–Roth materials, to see how these structural modifications influence electrochemical performance. Overall, the rate performance is lower than other WR materials, and not all Li is reversibly extracted after the first cycle. However, this work supports previous studies indicating polyhedral connectivity stabilizes the WR framework against significant structural changes upon cycling. Structure evolution during cycling is dominated by changes to the interlayer, rather than intralayer, structure. Li is incorporated into ordered framework vacancy sites between the layers, contracting the interlayer space and forming a WR framework with (2 × 2)∞ blocks. The size and preferred coordination of counter-cations (Na, K) is significant to average structure evolution and voltage, with a different hysteresis and suggestions of a stacking sequence change in KNb3O8 upon lithiation. While fast Li-ion diffusion takes place down square channels in conventional WR materials, in these niobates the square channels are blocked by the counter-cations and diffusion takes place initially in the interlayer space, and subsequently along the shear planes, leading to the overall moderate performance. These results offer perspective on key motifs for fast ion transport, as well as opportunities to further improve capacity and ion transport in WR-derived electrode materials and beyond.5 Methods
5.1 Synthesis
KNb3O8 powders were prepared using molten salt synthesis adapted from reported methods.36,37 K2CO3 (J. T. Baker, 99.9%), Nb2O5 (AlfaAesar, 99.9987%), and KCl (J. T. Baker 99.9%) were combined in a 1![[thin space (1/6-em)]](https://www.rsc.org/images/entities/char_2009.gif) :
:![[thin space (1/6-em)]](https://www.rsc.org/images/entities/char_2009.gif) 3
3![[thin space (1/6-em)]](https://www.rsc.org/images/entities/char_2009.gif) :
:![[thin space (1/6-em)]](https://www.rsc.org/images/entities/char_2009.gif) 12 molar ratio (about a 1
12 molar ratio (about a 1![[thin space (1/6-em)]](https://www.rsc.org/images/entities/char_2009.gif) :
:![[thin space (1/6-em)]](https://www.rsc.org/images/entities/char_2009.gif) 1 mass ratio of reactant and flux). Powders were ball-milled in ethanol and dried at ambient conditions. The resulting fine powder was heated in a new, covered alumina crucible, which went into a 700 °C furnace, was heated at 3 °C min−1 to 800 °C and held for 5 h, cooled at 3 °C min−1 to 700 °C, and then air-quenched to room temperature.‡ The product was isolated using hot distilled water and vacuum-assisted filtration (using Whatman Grade 50 hardened low-ash filter paper).
1 mass ratio of reactant and flux). Powders were ball-milled in ethanol and dried at ambient conditions. The resulting fine powder was heated in a new, covered alumina crucible, which went into a 700 °C furnace, was heated at 3 °C min−1 to 800 °C and held for 5 h, cooled at 3 °C min−1 to 700 °C, and then air-quenched to room temperature.‡ The product was isolated using hot distilled water and vacuum-assisted filtration (using Whatman Grade 50 hardened low-ash filter paper).
NaNb3O8 was prepared through soft chemical methods through several steps of ion-exchange reactions. KNb3O8 was stirred in a nitric acid solution (7 mol HNO3 per 1 L H2O) for 3 days, after which the powder was filtered and rinsed with room-temperature distilled water.52 While the structure is not known, this intermediate is reported to be HNb3O8·H2O.30,52 HNb3O8·H2O was then stirred in a NaOH solution (1 mol NaOH per 1 L H2O) for 3 h, the product was collected by filtration and rinsed with room temperature distilled water; again, while there is not a reported structure, this intermediate is described as NaNb3O8·2H2O based on thermogravimetric analysis.30 The hydrated sodium niobate was heated at 3° min−1 to 140°, held for 3 h, and furnace cooled to room temperature, resulting in NaNb3O8.30
5.2 Battery assembly & testing
For battery testing and ex situ characterization, layered niobates and SuperP (conductive carbon additive, Alfa Aesar, 99+%) in a 7![[thin space (1/6-em)]](https://www.rsc.org/images/entities/char_2009.gif) :
:![[thin space (1/6-em)]](https://www.rsc.org/images/entities/char_2009.gif) 3 mass ratio were ground using an agate mortar and pestle. Loose powders were the working electrodes in 1.27 cm (0.5 in.) diameter Swagelok cells against Li metal (Alfa Aesar, 99.9%, 1.5 mm thick), which served as counter and reference electrode. Cells were assembled in an argon-filled glovebox with two Whatman glass filter dryer (GFD) separators and an electrolyte solution of 1 M (mol L−1) lithium hexafluorophosphate (LiPF6) in an ethylene carbonate
3 mass ratio were ground using an agate mortar and pestle. Loose powders were the working electrodes in 1.27 cm (0.5 in.) diameter Swagelok cells against Li metal (Alfa Aesar, 99.9%, 1.5 mm thick), which served as counter and reference electrode. Cells were assembled in an argon-filled glovebox with two Whatman glass filter dryer (GFD) separators and an electrolyte solution of 1 M (mol L−1) lithium hexafluorophosphate (LiPF6) in an ethylene carbonate![[thin space (1/6-em)]](https://www.rsc.org/images/entities/char_2009.gif) :
:![[thin space (1/6-em)]](https://www.rsc.org/images/entities/char_2009.gif) dimethyl carbonate (EC
dimethyl carbonate (EC![[thin space (1/6-em)]](https://www.rsc.org/images/entities/char_2009.gif) :
:![[thin space (1/6-em)]](https://www.rsc.org/images/entities/char_2009.gif) DMC) (1
DMC) (1![[thin space (1/6-em)]](https://www.rsc.org/images/entities/char_2009.gif) :
:![[thin space (1/6-em)]](https://www.rsc.org/images/entities/char_2009.gif) 1 volume ratio) solvent (Sigma Aldrich). Galvanostatic cycling with potential limitations (GCPL) at various rates and potential limitations was carried out using a Bio-Logic VSP-300 potentiostat.
1 volume ratio) solvent (Sigma Aldrich). Galvanostatic cycling with potential limitations (GCPL) at various rates and potential limitations was carried out using a Bio-Logic VSP-300 potentiostat.
For ex situ samples, after cycling to a select state of charge, powders were collected from disassembled cells, rinsed with DMC in the glovebox, and dried under vacuum without air-exposure. Dried powders were ground using an agate mortar and pestle and loaded into 1.2 mm outer-diameter Kapton tubes sealed with epoxy. Sealed tubes were packed in glass vials under Ar, wrapped with Parafilm, and not exposed to air until just before X-ray scattering data was collected.
5.3 X-ray characterization
Lab diffraction was collected using a Panalytical X'Pert powder diffractometer. High-resolution synchrotron XRD of prepared KNb3O8 and NaNb3O8 was collected at beamline 11-BM-B (λ = 0.4127 Å) of the Advanced Photon Source (APS) at Argonne National Laboratory through the rapid-access mail-in program (GUP-59538). Finely ground powders were measured in 0.8 mm inner-diameter Kapton tubes sealed with epoxy at both ends. Data was analyzed using Rietveld refinement and Fullprof53 freeware. Additional details of the refinement are provided in the Results and discussion section as well as in the ESI.†Ex situ and operando X-ray total scattering of high-energy X-rays (λ = 0.2113 Å, E = 58.7 keV) was collected at beamline 11-ID-B of the Advanced Photon Source using a PerkinElmer amorphous Si-based area detector at a sample-to-detector distance of 995 mm for diffraction data suitable for average structure information and analysis. Ex situ cycled powders were loaded into 1.2 mm outer-diameter Kapton capillaries in an argon glovebox and sealed with epoxy at both ends. Capillaries were sealed in vials under argon until just prior to scattering measurements to minimize moisture effects. Ex situ experimental geometries were calibrated using CeO2 standards and integrated using Fit2D freeware,54 and Topas-Academic-v6 was used for ex situ XRD analysis.55
For operando data collection, AMPIX cells56 were assembled in an argon glovebox. Layered niobate powders were mixed with graphite, VulcanC, and polytetrafluoroethylene (6![[thin space (1/6-em)]](https://www.rsc.org/images/entities/char_2009.gif) :
:![[thin space (1/6-em)]](https://www.rsc.org/images/entities/char_2009.gif) 1
1![[thin space (1/6-em)]](https://www.rsc.org/images/entities/char_2009.gif) :
:![[thin space (1/6-em)]](https://www.rsc.org/images/entities/char_2009.gif) 1
1![[thin space (1/6-em)]](https://www.rsc.org/images/entities/char_2009.gif) :
:![[thin space (1/6-em)]](https://www.rsc.org/images/entities/char_2009.gif) 2 ratio by mass) and pressed into a free-standing cathode pellet. Between the cathode and Li metal anode were 1 M LiPF6 in EC
2 ratio by mass) and pressed into a free-standing cathode pellet. Between the cathode and Li metal anode were 1 M LiPF6 in EC![[thin space (1/6-em)]](https://www.rsc.org/images/entities/char_2009.gif) :
:![[thin space (1/6-em)]](https://www.rsc.org/images/entities/char_2009.gif) DMC (1
DMC (1![[thin space (1/6-em)]](https://www.rsc.org/images/entities/char_2009.gif) :
:![[thin space (1/6-em)]](https://www.rsc.org/images/entities/char_2009.gif) 1 volume ratio) electrolyte and one GFD separator. X-ray scattering of assembled AMPIX cells, with all but the cathode, was collected as a background to subtract from operando data. LaB6 standards were used to calibrate experimental geometries. Due to the time constraints of operando experiments, full potential window cells were cycled at faster rates than ex situ.
1 volume ratio) electrolyte and one GFD separator. X-ray scattering of assembled AMPIX cells, with all but the cathode, was collected as a background to subtract from operando data. LaB6 standards were used to calibrate experimental geometries. Due to the time constraints of operando experiments, full potential window cells were cycled at faster rates than ex situ.
5.4 NMR
Solid-state NMR spectra were recorded with a Bruker Avance III HD spectrometer in a Bruker narrow-bore 9.4 T superconducting magnet. The pulse–acquire sequence was used to record 7Li and 23Na spectra while both pulse-acquire and the quadrupolar Carr–Purcell–Meiboom–Gill (QCPMG) sequences were used to record 93Nb spectra. Quantitative relaxation delays (≥5 T1) were used for all spectra (0.5 s for 93Nb, 15 s for 23Na, 10 s for 7Li), with some additional T1-filtered measurements with shorter relaxation delays of 1 s for 7Li and 23Na to differentiate between sites experiencing rapid relaxation due to interactions with unpaired electrons. 7Li, 23Na, and 93Nb were referenced to 1.0 M LiCl (aqueous) [1 mol LiCl per L H2O] at 0 ppm, 1.0 M NaCl (aqueous) [1 mol NaCl per L H2O] at 0 ppm, and LiNbO3 at −1004 ppm, respectively. All spectra were recorded at ambient temperature.NMR chemical shielding and quadrupolar parameters were calculated with plane wave DFT in CASTEP41–43 (v19.11) after geometry optimization of the experimental structures from the Inorganic Crystal Structure Database (NaNb3O8, ICSD 202400;30 KNb3O8, ICSD 3199429). Vanderbilt ultrasoft pseudopotentials57 were generated on-the-fly in CASTEP. The Perdew–Burke–Ernzerhof (PBE) functional44 was used to approximate exchange–correlation effects. A plane wave basis set cut-off energy of 700 eV and Monkhorst–Pack k-point grids58 of 4 × 4 × 9 (NaNb3O8) and 4 × 2 × 9 (KNb3O8) were used in the calculations. The geometry optimization was performed with the limited Broyden–Fletcher–Goldfarb–Shanno (LBFGS) algorithm until the energy and force converged to less than 2 × 10⁻⁵ eV per atom and 1 meV Å−1 respectively. 93Nb calculated isotropic shieldings were converted to shifts using the absolute shielding value of 642 ppm taken from the calculated59vs. experimental value for LiNbO3, δiso = −σiso − 642 ppm.
5.5 Computational methods
First-principles calculations to investigate structures, energies and Li diffusion in LixNaNb3O8 (0 < x ≤ 5) were performed using the periodic density-functional-theory (DFT) code CRYSTAL17.60 Electronic exchange and correlation were approximated using the hybrid-exchange functional HSE06.61 All-electron, atom-centered Gaussian basis sets were used for all atoms, with details provided in the ESI.† The Coulomb and exchange series were truncated with thresholds of 10−7 10−7 10−7 10−7 10−14. Reciprocal space was sampled using a Pack–Monkhorst net,58 with a shrinking factor of IS = 8 along each periodic direction for a total of 125 k-points in the irreducible Brillouin zone of the orthorhombic unit cell of NaNb3O8. Modified k-point grids were used for supercell calculations for a consistent sampling of reciprocal space. Dispersion forces were included using Grimme's semiclassical D3 correction.62 The self-consistent field (SCF) procedure was performed up to a convergence threshold of ΔE = 10−8 Hartree per unit cell. Full geometry optimizations (lattice parameters and atomic positions) were performed using the default convergence criteria in CRYSTAL17. Activation barriers for ionic migration were determined using constrained geometry optimisations, with full details of the procedure described in the ESI.† Supercells obtained from a (1 × 1 × 2) expansion of the crystallographic unit cell were used for the calculations of activation barriers to ensure a distance of >7 Å between periodic images. The same (1 × 1 × 2) supercell was used to calculate the site filling and voltage profile. Intercalation voltages in LixNaNb3O8 between the limits x1 and x2 were determined relative to lithium metal using the following equation: ΔEinse = Etotal(Lix2NaNb3O8) − [(x2 − x1)Etotal(Lis) + Etotal(Lix1NaNb3O8)]. Hybrid-exchange functionals are unsuited for the calculation of metals. To evaluate the energy of lithium metal, we calculated the energy of a single isolated Li ion and added the experimentally determined energy of sublimation (Esub) and the first ionization energy (Ei(1)): E(Li(s)) = E(Li+) + Esub(Li(s)) + Ei(1)(Li). Crystal structures were visualized using VESTA software.635.6 Electron microscopy
SEM was performed with powder samples on carbon tape using a Helios NanoLab DualBeam microscope (Thermo Fisher Scientific, Waltham, MA, USA). TEM was performed in an FEI Titan (S)TEM operated at 300 kV and equipped with a high-angle annular dark field detector and EELS spectrometer. In same cases, a tomography sample holder was used to enable sufficiently large tilting angles.Pristine KNb3O8 powder samples were prepared for TEM by mixing the powder with a small amount of epoxy. The mixture was embedded in a slotted brass rod, which was placed inside a tightly fitting brass tube with an outer diameter of 3 mm. After curing the epoxy, the rod-in-tube sample was mechanically sectioned into thin disks, which were subsequently mechanically polished and dimpled to the final thickness of 25 μm, followed by Ar-ion thinning at 4 kV until perforation. Cycled materials were washed with DMC in an argon glovebox and dried under vacuum. The resulting powders were dispersed in ethanol and deposited on copper grids coated with lacey carbon for TEM.
Disclaimer
Any mention of commercial products is for informational purposes only; it does not imply recommendation or endorsement by the NIST.Author contributions
MMB: conceptualization and project administration; MMB, KM, KJG, JED, IL: investigation; MMB, KM, KJG, RLD: formal analysis; MMB, KM, KJG, IL, RL: visualization; MMB, KM, RLD: writing original draft; RL: data curation; MMB, KM, KJG, KRP, IL, FC: writing – review and editing; KRP, FC, IL: supervision and resources.Conflicts of interest
There are no conflicts to declare.Acknowledgements
This research was performed while M. M. B., R. L. D., and J. E. D. held NRC Research Associateship awards at the National Institute of Standards and Technology. K. M. and F. C. thank the EPSRC for funding the JUICED project (EP/R023662/1). This work used computational resources provided by the ARCHER UK National Supercomputing Service via K. M. and F. C.'s membership of the UK's HEC Materials Chemistry Consortium, funded by the EPSRC (EP/L000202, EP/R029431). Computational resources were also provided by the UK Materials and Molecular Modeling Hub (MMM Hub), which is partially funded by EPSRC (EP/P020194) and the UCL Kathleen High Performance Computing Facility (Kathleen@UCL). K. J. G. and K. R. P. were supported as part of the Joint Center for Energy Storage Research (JCESR), an Energy Innovation Hub funded by the U.S. Department of Energy (DOE), Office of Science, Basic Energy Sciences (BES). This work made use of the IMSERC NMR facility at Northwestern University, which has received support from the Soft and Hybrid Nanotechnology Experimental (SHyNE) Resource (NSF ECCS-2025633), Int. Institute of Nanotechnology, and Northwestern University. This research made use of the Advanced Photon Source, a U.S. Department of Energy (DOE) Office of Science User Facility operated for the DOE Office of Science by Argonne National Laboratory (Contract No. DE-AC02-06CH11357). Synchrotron XRD was collected at Argonne National Laboratory on beamline 11-BM through the general user proposal mail-in program (GUP59538). Ex situ and operando X-ray scattering experiments were performed at beamline 11-ID-B at the Advanced Photon Source at Argonne National Laboratory through the general user proposal (GUP58814). The authors are grateful to the support of all of the beamline staff who support on-site beamtime and operando experiments, especially Drs Antonin Grenier, Olaf Borkiewicz, and Karena Chapman.References
- P. Arora, R. E. White and M. Doyle, Capacity Fade Mechanisms and Side Reactions in Lithium-Ion Batteries, J. Electrochem. Soc., 1998, 145, 3647–3667 CrossRef CAS.
- J. Vetter, P. Novàk, M. Wagner, C. Veit, K.-C. Moller, J. Besenhard, M. Winter, M. Wohlfahrt-Mehrens, C. Vogler and A. Hammouche, Ageing mechanisms in lithium-ion batteries, J. Power Sources, 2005, 147, 269–281 CrossRef CAS.
- M. V. Reddy, G. V. Subba Rao and B. V. R. Chowdari, Metal Oxides and Oxysalts as Anode Materials for Li Ion Batteries, Chem. Rev., 2013, 113, 5364–5457 CrossRef CAS PubMed.
- J.-T. Han, Y.-H. Huang and J. B. Goodenough, New Anode Framework for Rechargeable Lithium Batteries, Chem. Mater., 2011, 23, 2027–2029 CrossRef CAS.
- Q. Cheng, J. Liang, Y. Zhu, L. Si, C. Guo and Y. Qian, Bulk Ti2Nb10O29 as long-life and high-power Li-ion battery anodes, J. Mater. Chem. A, 2014, 2, 17258–17262 RSC.
- K. J. Griffith, A. C. Forse, J. M. Griffin and C. P. Grey, High-Rate Intercalation without Nanostructuring in Metastable Nb2O5 Bronze Phases, J. Am. Chem. Soc., 2016, 138, 8888–8899 CrossRef CAS PubMed.
- K. J. Griffith, K. M. Wiaderek, G. Cibin, L. E. Marbella and C. P. Grey, Niobium tungsten oxides for high-rate lithium-ion energy storage, Nature, 2018, 559, 556–563 CrossRef CAS PubMed.
- K. J. Griffith, I. D. Seymour, M. A. Hope, M. M. Butala, L. K. Lamontagne, M. B. Preefer, C. P. Koçer, G. Henkelman, A. J. Morris, M. J. Cliffe, S. E. Dutton and C. P. Grey, Ionic and Electronic Conduction in TiNb2O7, J. Am. Chem. Soc., 2019, 141, 16706–16725 CrossRef CAS PubMed.
- N. Takami, K. Ise, Y. Harada, T. Iwasaki, T. Kishi and K. Hoshina, High-energy, fast-charging, long-life lithium-ion batteries using TiNb2O7 anodes for automotive applications, J. Power Sources, 2018, 396, 429–436 CrossRef CAS.
- K. J. Griffith, Y. Harada, S. Egusa, R. M. Ribas, R. S. Monteiro, R. B. Von Dreele, A. K. Cheetham, R. J. Cava, C. P. Grey and J. B. Goodenough, Titanium Niobium Oxide: From Discovery to Application in Fast-Charging Lithium-Ion Batteries, Chem. Mater., 2021, 33, 4–18 CrossRef CAS.
- K. J. Griffith and C. P. Grey, Superionic Lithium Intercalation through 2×2 nm2 Columns in the Crystallographic Shear Phase Nb18W8O69, Chem. Mater., 2020, 32, 3860–3868 CrossRef CAS.
- S. Andersson and A. D. Wadsley, Crystallographic Shear and Diffusion Paths in Certain Higher Oxides of Niobium, Tungsten, Molybdenum and Titanium, Nature, 1966, 211, 581–583 CrossRef CAS.
- R. J. Cava, D. W. Murphy and S. M. Zahurak, Lithium Insertion in Wadsley–Roth Phases Based on Niobium Oxide, J. Electrochem. Soc., 1983, 130, 2345–2351 CrossRef CAS.
- X. Zhu, J. Xu, Y. Luo, Q. Fu, G. Liang, L. Luo, Y. Chen, C. Lin and X. S. Zhao, MoNb12O33 as a new anode material for high-capacity, safe, rapid and durable Li+ storage: structural characteristics, electrochemical properties and working mechanisms, J. Mater. Chem. A, 2019, 7, 6522–6532 RSC.
- R. Zheng, S. Qian, X. Cheng, H. Yu, N. Peng, T. Liu, J. Zhang, M. Xia, H. Zhu and J. Shu, FeNb11O29 nanotubes: Superior electrochemical energy storage performance and operating mechanism, Nano Energy, 2019, 58, 399–409 CrossRef CAS.
- Q. Fu, H. Cao, G. Liang, L. Luo, Y. Chen, V. Murugadoss, S. Wu, T. Ding, C. Lin and Z. Guo, A highly Li+-conductive HfNb24O62 anode material for superior Li+ storage, Chem. Commun., 2020, 56, 619–622 RSC.
- M. B. Preefer, M. Saber, Q. Wei, N. H. Bashian, J. D. Bocarsly, W. Zhang, G. Lee, J. Milam-Guerrero, E. S. Howard, R. C. Vincent, B. C. Melot, A. Van der Ven, R. Seshadri and B. S. Dunn, Multielectron Redox and Insulator-to-Metal Transition upon Lithium Insertion in the Fast-Charging, Wadsley-Roth Phase PNb9O25, Chem. Mater., 2020, 32, 4553–4563 CrossRef CAS.
- F. Ran, X. Cheng, H. Yu, R. Zheng, T. Liu, X. Li, N. Ren, M. Shui and J. Shu, Nano-structured GeNb18O47 as novel anode host with superior lithium storage performance, Electrochim. Acta, 2018, 282, 634–641 CrossRef CAS.
- N. H. Bashian, M. B. Preefer, J. Milam-Guerrero, J. J. Zak, C. Sendi, S. A. Ahsan, R. C. Vincent, R. Haiges, K. A. See, R. Seshadri and B. C. Melot, Understanding the role of crystallographic shear on the electrochemical behavior of niobium oxyfluorides, J. Mater. Chem. A, 2020, 8, 12623–12632 RSC.
- K. E. Wyckoff, D. D. Robertson, M. B. Preefer, S. M. L. Teicher, J. Bienz, L. Kautzsch, T. E. Mates, J. A. Cooley, S. H. Tolbert and R. Seshadri, High-Capacity Li+ Storage through Multielectron Redox in the Fast-Charging Wadsley–Roth Phase (W0.2V0.8)3O7, Chem. Mater., 2020, 32, 9415–9424 CrossRef CAS.
- K. Meisel, Rheniumtrioxyd III. Mitteilung. Ueber die Kristallstruktur des Rheniumtrioxyds, Z. Anorg. Allg. Chem., 1932, 207, 121–128 CrossRef CAS.
- R. Cava, A. Santoro, D. W. Murphy, S. M. Zahurak and R. S. Roth, The Structures of the Lithium Inserted Metal Oxides Li0.2ReO3 and Li0.36WO3, J. Solid State Chem., 1983, 50, 121–128 CrossRef CAS.
- R. Cava, A. Santoro, D. W. Murphy, S. M. Zahurak and R. S. Roth, Structural Aspects of Lithium Insertion in Oxides: LixReO3 and Li2FeV3O8, Solid State Ionics, 1981, 5, 323–326 CrossRef CAS.
- R. Cava, A. Santoro, D. W. Murphy, S. M. Zahurak and R. S. Roth, The Structures of the Lithium-Inserted Metal Oxides LiReO3 and Li2ReO3, J. Solid State Chem., 1982, 42, 251–262 CrossRef CAS.
- N. H. Bashian, S. Zhou, M. Zuba, A. M. Ganose, J. W. Stiles, A. Ee, D. S. Ashby, D. O. Scanlon, L. F. J. Piper, B. Dunn and B. C. Melot, Correlated Polyhedral Rotations in the Absence of Polarons during Electrochemical insertion of Lithium in ReO3, ACS Energy Lett., 2018, 3, 2513–2519 CrossRef CAS.
- C. P. Koçer, K. J. Griffith, C. P. Grey and A. J. Morris, Lithium Diffusion in Niobium Tungsten Oxide Shear Structures, Chem. Mater., 2020, 32, 3980–3989 CrossRef PubMed.
- K. McColl and F. Corà, Fast lithium-ion conductivity in the ‘empty-perovskite’ n = 2 Ruddlesden–Popper-type oxysulphide Y2Ti2S2O5, J. Mater. Chem. A, 2021, 9, 7068–7084 RSC.
- R. S. Roth and A. D. Wadsley, Multiple phase formation in the binary system Nb2O5–WO3. IV. The block principle, Acta Crystallogr., 1965, 19, 42–47 CrossRef CAS.
- M. Gasperin, Structure du Triniobate (V) de Potassium KNb3O8, un Niobate Lamallaire, Acta Crystallogr., Sect. B: Struct. Crystallogr. Cryst. Chem., 1982, 38, 2024–2026 CrossRef.
- R. Nedjar, M. M. Borel, A. Leclaire and B. Raveau, The Sodium Niobate NaNb3O8: A novel lamellar oxide synthesized by soft chemistry, J. Solid State Chem., 1987, 71, 182–188 CrossRef CAS.
- H. Nakayama, M. Nose, S. Nakanishi and H. Iba, Electrochemical Reactions of Layered Niobate Material as Novel Anode for Sodium Ion Batteries, J. Power Sources, 2015, 287, 158–163 CrossRef CAS.
- Q. Deng, M. Li, J. Wang, K. Jiang, Z. Hu and J. Chu, Carbonized Polydopamine Wrapping Layered KNb3O8 Nanoflakes Based on Alkaline Hydrothermal for Enhanced and Discrepant Lithium Storage, J. Alloys Compd., 2018, 749, 803–810 CrossRef CAS.
- Z. Chen, X. Cheng, N. Long, H. Zhu, T. Liu and N. Peng, Lithium Storage Behaviors of KNb3O8 Nanowires for Rechargeable Batteries, Ceram. Int., 2018, 44, 5699–5704 CrossRef CAS.
- J.-T. Han, D.-Q. Liu, S.-H. Song, Y. Kim and J. B. Goodenough, Lithium Ion Intercalation Performance of Niobium Oxides: KNb5O13 and K6Nb10.8O30, Chem. Mater., 2009, 21, 4753–4755 CrossRef CAS.
- Y. Lu, J. B. Goodenough, G. K. P. Dathar, G. Henkelman, J. Wu and K. Stevenson, Behavior of Li Guest in KNb5O13 Host with One-Dimensional Tunnels and Multiple Interstitial Sites, Chem. Mater., 2011, 23, 3210–3216 CrossRef CAS.
- L. Li, J. Deng, R. Yu, J. Chen, X. Wang and X. Xing, Phase evolution in low-dimensional niobium oxide synthesized by a topochemical method, Inorg. Chem., 2010, 49, 1397–1403 CrossRef CAS PubMed.
- F. Madaro, R. Saeterli, J. R. Tolchard, M.-A. Einsarsrud, R. Holmestad and T. Grande, Molten salt synthesis of K4Nb6O17, K2Nb4O11, and KNb3O8 crystals with needle- or plate-like morphology, CrystEngComm, 2011, 13, 1304–1313 RSC.
- G. Zhang, J. Gong, X. Zou, F. He, H. Zhang, Q. Zhang, Y. Liu, X. Yang and B. Hu, Photocatalytic Degradation of Azo Dye Acid Red G by KNb3O8 and the Role of Potassium in the Photocatalysis, Chem. Eng. J., 2006, 123, 59–64 CrossRef CAS.
- Z. Y. Zhan, C. Y. Xu, L. Zhen, W. S. Wang and W. Z. Shao, Large-Scale Synthesis of Single-Crystalline KNb3O8 Nanobelts via a Simple Molten Salt Method, Ceram. Int., 2010, 36, 679–682 CrossRef CAS.
- X. Liu, W. Que and L. B. Kong, Hydrothermal Synthesis of Bamboo-Shaped Nanosheet KNb3O8 with Enhanced Photocatalytic Activity, J. Alloys Compd., 2015, 627, 117–122 CrossRef CAS.
- S. J. Clark, M. D. Segall, C. J. Pickard, P. J. Hasnip, M. I. J. Probert, K. Refson and M. C. Payne, First Principles Methods using CASTEP, Z. Kristallogr., 2005, 220, 567–570 CAS.
- C. J. Pickard and F. Mauri, All-electron Magnetic Response with Pseudopotentials: NMR Chemical Shifts, Phys. Rev. B: Condens. Matter Mater. Phys., 2001, 63, 245101 CrossRef.
- J. R. Yates, C. J. Pickard and F. Mauri, Calculation of NMR Chemical Shifts for Extended Systems Using Ultrasoft Pseudopotentials, Phys. Rev. B: Condens. Matter Mater. Phys., 2007, 76, 024401 CrossRef.
- J. P. Perdew, K. Burke and M. Ernzerhof, Generalized Gradient Approximation Made Simple, Phys. Rev. Lett., 1996, 77, 3865–3868 CrossRef CAS PubMed.
- A. A. Savina, V. A. Morozov, A. L. Buzlukov, I. Y. Prapova, S. Y. Stefanovich, Y. V. Baklanova, T. A. Denisova, N. I. Medvedeva, M. Bardet, J. Hadermann, B. I. Lazoryak and E. G. Khaikina, New Solid Electrolyte Na9Al(MoO4)6: Structure and Na+ Ion Conductivity, Chem. Mater., 2017, 29, 8901–8913 CrossRef CAS.
- R. L. Vold and G. L. Hoatson, Effects of jump dynamics on solid state nuclear magnetic resonance line shapes and spin relaxation times, J. Magn. Reson., 2009, 198, 57–72 CrossRef CAS PubMed.
- K. A. See, M. Lumley, G. D. Stucky, C. P. Grey and R. Seshadri, Reversible Capacity of Conductive Carbon Additives at Low Potentials: Caveats for Testing Alternative Anode Materials for Li-Ion Batteries, J. Electrochem. Soc., 2017, 164, A327–A333 CrossRef CAS.
- J. S. Anderson and R. J. D. Tilley, in Surface and Defect Properties of Solids: Volume 3, ed. M. W. Roberts and J. M. Thomas, The Royal Society of Chemistry, 1974, vol. 3, pp. 1–56 Search PubMed.
- J. Lee, A. Urban, X. Li, D. Su, G. Hautier and G. Ceder, Unlocking the Potential of Cation-Disordered Oxides for Rechargeable Lithium Batteries, Science, 2014, 343, 519–522 CrossRef CAS PubMed.
- R. J. Clément, Z. Lun and G. Ceder, Cation-disordered rocksalt transition metal oxides and oxyfluorides for high energy lithium-ion cathodes, Energy Environ. Sci., 2020, 13, 345–373 RSC.
- L. R. De Jesus, P. Stein, J. L. Andrews, Y. Luo, B.-X. Xu and S. Banerjee, Striping Modulations and Strain Gradients within Individual Particles of a Cathode Material upon Lithiation, Mater. Horiz., 2018, 5, 486–498 RSC.
- R. Nedjar, M. M. Borel and B. Raveau, H3ONb3O8 and HNb3O8: New protonic oxides with a layer structure involving ion exchange properties, Mater. Res. Bull., 1985, 20, 1291–1296 CrossRef CAS.
- J. Rodríguez-Carvajal, Recent Advances in Magnetic Structure Determination by Neutron Powder Diffraction, Physica B, 1993, 192, 55–69 CrossRef.
- A. P. Hammersley, S. O. Svensson, M. Hanfland, A. N. Fitch and D. Hausermann, Two-Dimensional Detector Software: From Real Detector to Idealised Image or Two-Theta Scan, High Pressure Res., 1996, 14, 235–248 CrossRef.
- A. A. Coelho, TOPAS and TOPAS-Academic: An optimization program integrating computer algebra and crystallographic objects written in C++, J. Appl. Crystallogr., 2018, 51, 210–218 CrossRef CAS.
- O. J. Borkiewicz, B. Shyam, K. M. Wiaderek, C. Kurtz, P. J. Chupas and K. W. Chapman, The AMPIX Electrochemical Cell: a Versatile Apparatus for in situ X-ray Scattering and Spectroscopic Measurements, J. Appl. Crystallogr., 2012, 45, 1261–1269 CrossRef CAS.
- D. Vanderbilt, Soft Self-consistent Pseudopotentials in a Generalized Eigenvalue Formalism, Phys. Rev. B: Condens. Matter Mater. Phys., 1990, 41, 7892(R) CrossRef PubMed.
- H. J. Monkhorst and J. D. Pack, Special points for Brillouin-zone integrations, Phys. Rev. B: Condens. Matter Mater. Phys., 1976, 13, 5188–5192 CrossRef.
- E. Papulovskiy, A. A. Shubin, V. V. Terskikh, C. J. Pickard and O. B. Lapina, Theoretical and Experimental Insights into Applicability of Solid-state 93Nb NMR in Catalysis, Phys. Chem. Chem. Phys., 2013, 15, 5115–5131 RSC.
- R. Dovesi, A. Erba, R. Orlando, C. M. Zicovich-Wilson, B. Civalleri, L. Maschio, M. Rérat, S. Casassa, J. Baima, S. Salustro and B. Kirtman, Quantum-mechanical condensed matter simulations with CRYSTAL, Wiley Interdiscip. Rev.: Comput. Mol. Sci., 2018, 8, e1360 Search PubMed.
- J. Heyd, G. E. Scuseria and M. Ernzerhof, Hybrid functionals based on a screened Coulomb potential, J. Chem. Phys., 2003, 118, 8207–8215 CrossRef CAS.
- S. Grimme, J. Antony, S. Ehrlich and H. Krieg, A consistent and accurate ab initio parametrization of density functional dispersion correction (DFT-D) for the 94 elements H-Pu, J. Chem. Phys., 2010, 132, 154104 CrossRef PubMed.
- K. Momma and F. Izumi, VESTA3 for three-dimensional visualization of crystal, volumetric and morphology data, J. Appl. Crystallogr., 2011, 44, 1272–1276 CrossRef CAS.
Footnotes |
| † Electronic supplementary information (ESI) available. See DOI: 10.1039/d1ta02992d |
| ‡ Products were phase pure when using a new crucible. Subsequent reactions in used crucibles resulted in increasing fractions of secondary products until eventually the crucible cracked. While we have not investigated the cause of this, we anticipate that KCl in combination with rapid cooling contributed to reactants being lost in cracks in the crucible and shifting to other nearby K–Nb–O phases, especially K4Nb6O17, K3Nb7O19, and ternary bronzes. |
| This journal is © The Royal Society of Chemistry 2021 |

