 Open Access Article
Infrared crystallography for framework and linker orientation in metal–organic framework films†
Bettina
Baumgartner
 a,
Ken
Ikigaki
a,
Kenji
Okada
a,
Ken
Ikigaki
a,
Kenji
Okada
 *ab and
Masahide
Takahashi
 *a
*a
aDepartment of Materials Science, Graduate School of Engineering, Osaka Prefecture University, Sakai, Osaka, 599-8531, Japan
bJST, PRESTO, 4-1-8 Honcho, Kawaguchi, Saitama 332-0012, Japan. E-mail: k_okada@mtr.osakafu-u.ac.jp; masa@mtr.osakafu-u.ac.jp
First published on 18th June 2021
Abstract
Pore alignment and linker orientation influence diffusion and guest molecule interactions in metal–organic frameworks (MOFs) and play a pivotal role for successful utilization of MOFs. The crystallographic orientation and the degree of orientation of MOF films are generally determined using X-ray diffraction. However, diffraction methods reach their limit when it comes to very thin films, identification of chemical connectivity or the orientation of organic functional groups in MOFs. Cu-based 2D MOF and 3D MOF films prepared via layer-by-layer method and from aligned Cu(OH)2 substrates were studied with polarization-dependent Fourier-transform infrared (FTIR) spectroscopy in transmission and attenuated total reflection configuration. Thereby, the degrees for in-plane and out-of-plane orientation, the aromatic linker orientation and the initial alignment during layer-by-layer MOF growth, which is impossible to investigate by laboratory XRD equipment, was determined. Experimental IR spectra correlate with theoretical explanations, paving the way to expand the principle of IR crystallography to oriented, organic–inorganic hybrid films beyond MOFs.
Introduction
In metal–organic frameworks (MOFs), organic linkers and metal-containing units are combined, forming porous materials with great variety and multiplicity regarding constituents' geometry, pore size and functionality.1 Their fields of applications are equally manifold and include photonics,2 energy-related applications such as solar or fuel cells,3,4 homogeneous and heterogeneous catalysis,5,6 gas and fuel storage,7,8 or (bio-)sensing.9–11 While MOFs are available in a great variety of shapes, such as nanocrystals, nanospheres, or hierarchical monoliths, MOF thin films hold tremendous potential to translate the structural properties of individual crystals to continuous, scalable materials. Scalability and processability are essential for the application of MOFs in numerous fields12,13 such as optics,9 photonics,2 catalytic coatings, sensing, solar cells or for batteries.14 The majority of these applications rely on the precise crystallographic orientation and uniform porosity of the MOF to allow for e.g. electron- or photoconduction. Hence, controlling and determining the crystallinity and orientation, including framework and linker orientation, of the MOF film with respect to the substrate is of prime importance for successful implementations.Typically, oriented MOF thin films are synthesized by the layer-by-layer (LbL) approach on substrates modified with self-assembled monolayers (SAM).15 Thereby, MOF films composed of 2D sheets (2D MOF) and coordinatively connected 2D sheets by pillar molecules (3D MOFs) with a multitude of different organic and metallic building blocks have been obtained.16–18 Although, this method allows to control the orientation of the lattice plane parallel to the substrate (out-of-plane orientation) by changing the terminated functional group of the SAM, these MOF films lack in-plane orientation.19 Recently, our group reported a synthetic method to obtain three-dimensionally oriented 2D and 3D Cu-based MOF films by epitaxial growth on copper hydroxide,20,21 yielding large scale films with controlled pore alignment.
The standard method to determine the crystallographic orientation, and thus the pore alignment, of MOF films is X-ray diffraction (XRD) in out-of-plane (OOP) and in-plane (IP) configuration, i.e. perpendicular and horizontal relative to the substrate. The degree of in-plane orientation of films can be quantified using azimuthal angle dependent intensity profiles (φ scan) in the in-plane XRD configuration, i.e. rotating the sample around the axis perpendicular to the substrate center (φ axis) at constant X-ray source and detector position.20–22 Besides dedicated diffractometer equipment and rather long measurement times of several hours, this method requires for considerably thick MOF films (typically >40 layers of LbL MOF films) to achieve sufficient signal-to-noise ratios.
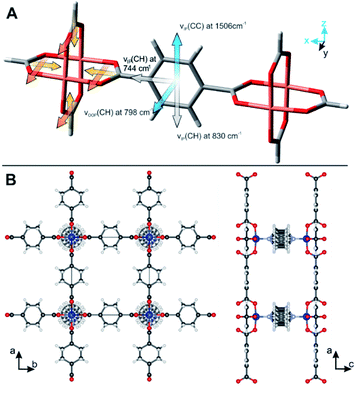
With respect to high surface sensitivity, infrared reflection absorption spectroscopy (IRRAS) has proven as powerful tool to determine the structure and orientation of molecular layers on planar surfaces,23,24 to study the initial growth of MOF films,25 or determine structural defects within MOF films.26,27 Polarized IR radiation is reflected from a thin film deposited on metallic surfaces under a grazing angle of incidence. In this configuration, parallel-polarized light is solely absorbed by molecules with chemical bands having their transition dipole moment perpendicular to the substrate's surface.28,29 Thus, IRRAS provides structural, chemical information on the axis perpendicular to the surface. This fact has been exploited by Terfort and co-works to differentiate between surface-attached MOF (SURMOF) films synthesized in different crystallographic orientations.19,30 The carboxylate bands originating from the coordination of the organic linker with the metal nodes are ideally suited to study the MOF orientation: four carboxylate bonds in their bridging configuration are oriented in a Cu-paddle wheel that directs the structure of all MOFs with bimetal building units (e.g. MOFs based on M = Cu, Cr, Mo, etc., compare Fig. 1).31 The perpendicular orientation of the carboxylate bonds to each other and also to the surface allowed Terfort and co-works to determine the out-of-plane orientation of MOF films with different preferred orientation synthesized by LbL synthesis on gold surfaces functionalized with SAMs.19,30 Although IRRAS is well suited to study MOF films prepared from SAMs, the technique is restricted to oriented films deposited on metal surfaces. Furthermore, information on the orientation of chemical bonds apart from perpendicular orientation, i.e. out-of-plane, is not accessible.
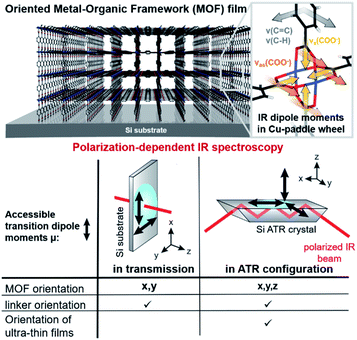
Polarization-dependent IR spectroscopy in transmission and attenuated total reflection (ATR) geometry is highly sensitive to structural changes and atomic interactions in x, y and x, y, z-direction (i.e. in-plane and out-of-plane, compare Fig. 1), respectively. Researchers mainly in the fields of macromolecular chemistry and structural biology have taken advantage of these sensitivity to study the degree of crystallinity and the orientation in (semi-)crystalline polymers32–34 or the conformational changes in biomolecules.35–37 In this context, the term infrared crystallography is commonly used, even though the method only provides information on the orientation of molecules and functional groups but not the crystal's periodicity.36
In this contribution, as outlined in Fig. 1, we employed polarization-dependent IR spectroscopy to study the in-plane and out-of-plane orientation of Cu-based 2D and 3D MOF films on Si substrates. Besides confirming the film orientation and comparing favorably with results from XRD measurements just obtained at shorter time scales, additional structural information was retrieved: the orientation of the aromatic linker in the 3D MOF Cu2(BDC)2DABCO (BDC: 1,4-benzenedicarboxylate, DABCO: 1,4-diazabicyclo[2.2.2]octane), to date inaccessible with conventional techniques such as XRD and IRRAS, and highly essential for the accessibility of the pores, was determined to be parallel to the 2D MOF sheets and perpendicular to the bridging carboxylate plane. Furthermore, the initial orientation of MOF films in the LbL synthesis, otherwise only feasible with synchrotron techniques due to the low amount of material, could be investigated.
Results and discussion
Degree of in-plane orientation from polarization-dependent IR spectroscopy in transmission
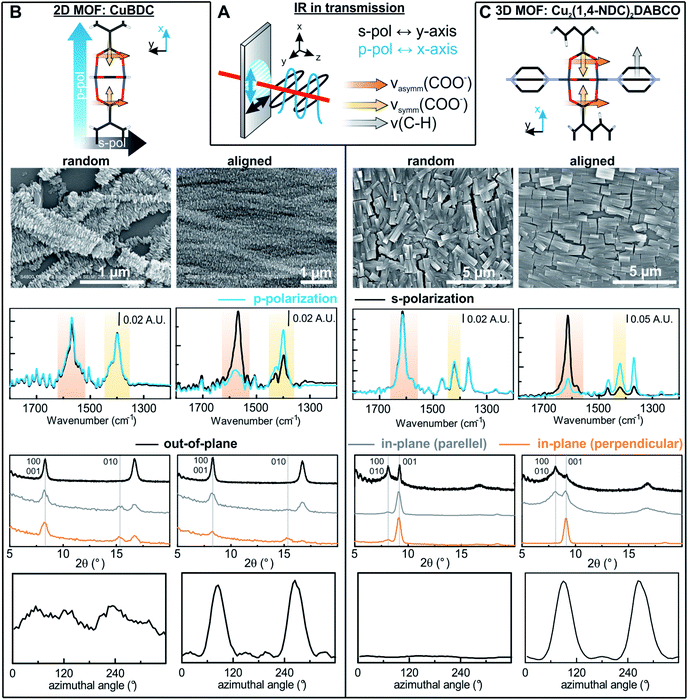
Oriented CuBDC and Cu2(1,4-NDC)2DABCO (1,4-NDC: 1,4-naphthalenedicarboxylate) films were grown from Cu(OH)2 nanobelt films via a heteroepitaxial growth approach.20,21 MOF films with high and low degrees of in-plane orientation were prepared on silicon substrates from aligned and randomly aligned Cu(OH)2 nanobelt films (see ESI† for Cu(OH)2 preparation and characterization). The corresponding SEM images and XRD patterns are given in Fig. 2. SEM observation indicates that MOF crystals grown from oriented Cu(OH)2 nanobelts are oriented in three dimensions (x, y and z direction), while randomly oriented Cu(OH)2 nanobelts yield MOF crystals only oriented perpendicular to the surface (z-direction) without in-plane orientation. This conclusion drawn from MOF morphologies in the SEM images was further confirmed with XRD. For MOF thin films prepared from randomly oriented Cu(OH)2, there is a clear difference between out-of-plane and in-plane XRD patterns, but no difference is observed between the two types of in-plane XRD patterns, confirming that the CuBDC and Cu2(1,4-NDC)2DABCO MOF films have only out-of-orientation as reported previously.38,39 In contrast, MOF films prepared from oriented Cu(OH)2 nanobelt films show strong dependence on X-ray incidence angle as visible in the IP XRD patterns, confirming the fabrication of three-dimensionally oriented MOF films. Collectively, in MOF thin films synthesized from oriented Cu(OH)2, the c axis in CuBDC and b axis in Cu2(1,4-NDC)2DABCO are along the z-direction and the b axis in CuBDC and c axis in Cu2(1,4-NDC)2DABCO are parallel to the longitudinal direction (y-direction) of the underlying Cu(OH)2 nanobelts (see Fig. S4† for visualization of MOF film structures). This alignment was further quantified by φ scan measurements, which are given in Fig. 2.From these profiles, the degree of in-plane orientation was determined using the full width at half maximum (FWHM) of the peaks and eqn (1):40
 | (1) |
FTIR spectra recorded with s- and p-polarized light of the same set of films with different degrees of orientation were acquired in transmission using blank silicon as background and are given in Fig. 2 The bands at 1570 cm−1 and 1616 cm−1 stem from the asymmetric carboxylate vibration, and the bands at 1390 cm−1 and 1423 cm−1 are assigned to the symmetric carboxylate vibration, which is consistent with previous reports.39,41 The bands at 1465 and 1370 cm−1 in the 3D MOF stem from C–H vibrations of DABCO with a transition dipole moment perpendicular to the N–N axis.42 No spectral differences between the polarized IR spectra were observed for the MOF films obtained from random Cu(OH)2 nanobelts, while a strong polarization-dependence is visible for three-dimensionally oriented MOF films.
The reason for this becomes clear if we set the orientation of the Cu-paddle wheel of CuBDC and Cu2(1,4-NDC)2DABCO in relation to the Si substrate as given in Fig. 2A: the transition dipole of the νsymm(COO−) band (yellow arrow) is oriented in x-direction, thus, this band can only interact with p-polarized light. Vice versa holds true for the asymmetric vibration that can only interact with s-polarized light. This polarization dependence is visible in the spectra of both aligned films. Furthermore, the transition dipole moments of the C–H vibrations of DABCO present in the 3D MOFs are oriented in x-direction and hence show the same polarization-dependence as the equally oriented dipole of the νsymm(COO−) band. Note that, even if DABCO can rotate freely around the N–N axis, this would not change the fact that it C–H groups only interacts with p-polarized light. For a perfectly aligned film, no bands for the symmetric and asymmetric vibration would be visible for p- and s-polarized light, respectively. However, the investigated MOF films show a degree of in-plane orientation of 0.80 and 0.82 determined from XRD data, respectively, hence, misaligned crystallites are present. This misalignment leads to vibrations of νsymm(COO−) in the s-polarized spectrum and νasymm(COO−) in the p-polarized spectrum. This fact allows to use the linear dichroism, i.e. the ratio of absorbance for s- and p-polarization, of each COO− vibration to calculate the degree of in-plane orientation FIR from IR transmission spectra. The respective band areas A were integrated, and FIR was retrieved using the following equations:
 | (2) |
 | (3) |
Thereby, FIR(νasymm(COO−)) values of 0.80 and 0.80 were obtained from the spectra of both aligned MOF films in Fig. 2, which is in excellent agreement with the degree of orientation obtained from XRD experiment. FIR(νsymm(COO−)) = 0.68 for CuBDC, which has less correlation with the corresponding FXRD value. We attribute this deviation of FIR to FXRD to crystallite tilting and a different structure, as we will discuss in the last section.
To demonstrate that this method is valid over the entire range of in-plane orientation values, we prepared CuBDC and Cu2(1,4-NDC)2DABCO films from Cu(OH)2 films with different degrees of orientation. The in-plane orientation of all films was determined with φ-scans in XRD and FTIR transmission spectroscopy. The results are compared in Fig. 3 and show similar values for FIR values >0.5. A lower correlation was found for the νsymm(COO−) band for CuBDC. Note that FIR = 0.5 corresponds to completely unoriented films, while FIR = 0 results only from films perfectly aligned perpendicular to films with FIR = 1 (see Fig. S6 in ESI† for graphical illustration). In contrast, FXRD is an arbitrarily defined ratio that allows comparison between oriented films.40 In addition, peak fitting and determining the FWHM becomes increasingly prone to errors for FXRD < 0.5 and yields −∞ for films without preferential orientation and flat φ-scans. For these reasons, a correlation between FIR and FXRD is physically not valid and shall only be used to compare films during material development for F > 0.5. Nevertheless, these findings show that the degree of in-plane orientation of 2D and 3D MOF films in the given boarders can be derived from simple FTIR transmission spectra on Si substrates, which allows for fast screening without the need of dedicated diffraction instrumentation or substrates with metallic coatings.
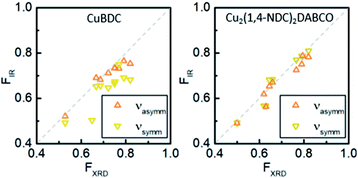 | ||
| Fig. 3 Correlation of degree of orientation F obtained from XRD and FTIR spectroscopy in transmission for CuBDC and Cu2(1,4-NDC)2DABCO films for νsymm(COO−) and νasymm(COO−) bands. | ||
Crystallographic orientation of MOF films in all three axes studied with ATR spectroscopy
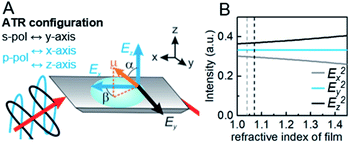
In contrast to spectra acquired in transmission, ATR spectroscopy provides two advantages: (i) higher interaction pathlengths, and hence higher sensitivity, can be achieved with multibounce ATR crystals, as used in this study; and (ii) ATR spectroscopy gives access to all three axes of the studied materials. This is due to the fact that the evanescent wave generated upon total reflection at the ATR crystal/sample interface has fractions of the field amplitude in all directions, namely Ex, Ey, Ez, which are polarization-dependent: s-polarized light only generates an evanescent wave in y-direction, while p-polarized light induces an evanescent wave in x and z-direction (compare Fig. 4). Ex, Ey, Ez are not equal in amplitude and depend on the refractive index of sample and ATR crystal material, n2 and n1, respectively, and the angle of incidence θ. The fractions of the field amplitudes at the ATR crystal's (z = 0) surface can be determined using eqn (4)–(6):43 | (4) |
 | (5) |
 | (6) |
A⊥ ∝ (μyEy)2 = (μ0![[thin space (1/6-em)]](https://www.rsc.org/images/entities/char_2009.gif) sin sin![[thin space (1/6-em)]](https://www.rsc.org/images/entities/char_2009.gif) α α![[thin space (1/6-em)]](https://www.rsc.org/images/entities/char_2009.gif) sin sin![[thin space (1/6-em)]](https://www.rsc.org/images/entities/char_2009.gif) βEy)2 βEy)2 | (7a) |
A∥ ∝ (μxEx)2 + (μzEz)2 = (μ0![[thin space (1/6-em)]](https://www.rsc.org/images/entities/char_2009.gif) sin sin![[thin space (1/6-em)]](https://www.rsc.org/images/entities/char_2009.gif) α α![[thin space (1/6-em)]](https://www.rsc.org/images/entities/char_2009.gif) cos cos![[thin space (1/6-em)]](https://www.rsc.org/images/entities/char_2009.gif) βEx)2 + (μ0 βEx)2 + (μ0![[thin space (1/6-em)]](https://www.rsc.org/images/entities/char_2009.gif) cos cos![[thin space (1/6-em)]](https://www.rsc.org/images/entities/char_2009.gif) αEz)2 αEz)2 | (7b) |
The simplified eqn (7a) and (7b) hold true for MOFs with the molecule axis aligned along the coordination system of the ATR crystal, as in the case for the studied MOF films (see ref. 44 and 45 for more complex systems), and only for aligned dipoles, not for dipole distributions. The νsymm(COO−) and νasymm(COO−) bands in the films investigated have dipole moments with a and β being either 0° or 90°, which simplifies interpretation of polarization dependent spectra. However, the trigonometric relationship allows also to study bands under a specific angle.
The ratio of absorbances A‖ and Anormal measured for p-polarized and s-polarized light, respectively, is called the dichroic ratio R:
 | (8) |
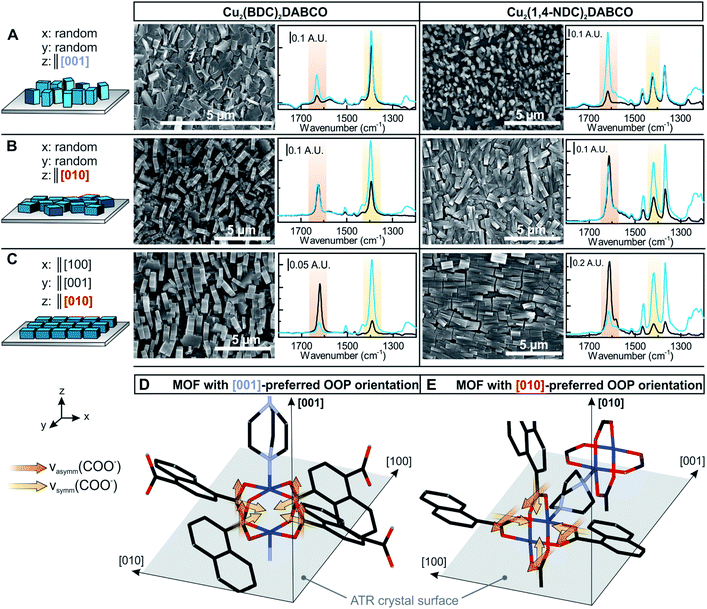
Experimentally, R can be determined by comparing the absorbance of a specific band in both polarizations. R = 2 for an angle of incidence of 45° (as used in this study) and isotropic bulk samples such as water (see Fig. S9† for spectra). Note that R is unity for isotropic media investigated in transmission. The calculated field amplitudes for varying refractive indices of the sample are depicted in Fig. 4 (see ESI† for further information). The fraction of Ey remains constant, while Ex and Ez are affected by the refractive index of the sample (see ESI† for further information on the determination of the refractive index of the films). With the relative intensities of the evanescent wave in each direction of Ex2 = 0.30, Ey2 = 0.33, Ez2 = 0.37 at hand, the orientation of MOF films can be determined. 3D MOFs with different crystallographic orientation were prepared on Si ATR crystals and the SEM images of the films and corresponding ATR-IR spectra of Cu2(BDC)2DABCO and Cu2(1,4-NDC)2DABCO films are given in Fig. 5. Their crystallographic orientations were confirmed by XRD (see Fig. S10 in ESI†) and the orientation of the MOFs in x, y and z-direction is shown schematically on the left in Fig. 5.
The Cu–Cu axis of Cu-paddle wheel unit and the N–N axis of the DABCO pillar are oriented perpendicular to the substrate in 3D MOF films with [001] preferred OOP orientation (compare Fig. 5D). Both MOF films with [001] preferred OOP orientation show no in-plane orientation (Fig. 5A). This gives rise to transition dipole moments of the νasymm(COO−) bands oriented in z-direction, while the dipole moments of the νsymm(COO−) band are aligned in the x–y plane, which is consistent with the recorded IR spectra: νasymm(COO−) is only visible in the p-polarized spectrum and only contributions of MOF crystallites deviating from the z-axis alignment contribute to this band in the s-polarized spectrum (compare Table 1 for R values). As MOF films with [001] preferred OOP orientation rotate freely around the z-axis and due to the fact that both νsymm(COO−) and νsymm(C–H) are oriented in the x–y plane, these bands show the same absorbance for both polarizations. Two types of MOFs films with [010] preferred OOP orientation (compare Fig. 5E) were prepared from random and aligned Cu(OH)2 nanobelts, yielding MOFs films with and without in-plane orientation (Fig. 5B and C). For 3D MOFs prepared from randomly oriented Cu(OH)2, the transition dipole moment of the νasymm(COO−) rotates freely around the z-axis, characterized by identical absorbance in p- and s-polarized spectra. For the transition dipole moment of the νsymm(COO−) and of ν(C–H) bands determining the dichroic ratio is more complex as contributions in all three axes have to be considered (see ESI† for full explanation).
| R (νasymm) predicted | R (νasymm) founda | R (νsymm) predicted | R (νasymm) founda | |
|---|---|---|---|---|
| a Top and bottom values correspond to Cu2(BDC)2DABCO and Cu2(1,4-NDC)2DABCO, respectively. | ||||
| x: random | ∞ | 5.0 | 0.9 | 1.1 |
| y: random | ||||
| 3.7 | 1.1 | |||
| z‖[001] | ||||
| x: random | 0.9 | 1.0 | 2 | 2.0 |
| y: random | ||||
| 0.9 | 2.0 | |||
| z‖[010] | ||||
| x‖[100] | 0 | 0.2 | ∞ | 5.5 |
| y‖[001] | ||||
| 0.3 | 5.0 | |||
| z‖[010] | ||||
A dichroic ratio of 2 was derived for this case as found in the spectra of both 3D MOFs. Lastly, 3D MOF films prepared from oriented Cu(OH)2 nanobelts show a high degree of IP and OOP orientation. The transition dipole moment of the νasymm(COO−) band is oriented in y-direction, thus yielding absorbance in the s-polarized spectra. The dipole moments of νsymm(COO−) and νsymm(C–H) bands are oriented in x- and z-direction and therefore interact with p-polarized light. Analogous to the previous section, φ scans were recorded and FXRD was determined to be 0.83 and 0.82 for Cu2(BDC)2DABCO and Cu2(1,4-NDC)2DABCO, respectively. FIR was determined from the ATR spectra (using eqn (2) and (3)) to be 0.84 and 0.83 for νsymm(COO−) band. For aligned films, FIR(νasymm(COO−)) = FIR,OOP and was determined to be 0.83 and 0.82 for the Cu2(BDC)2DABCO film and Cu2(1,4-NDC)2DABCO film, respectively.
Note that also transmission IR spectra show distinct differences that can be used to determine the MOF orientation (compare ESI† for explanation). This set of 3D MOF films demonstrates that different crystallographic orientations can be easily distinguished and the degree of in- and out-of-plane orientation can be determined using ATR-IR spectroscopy.
Initial orientation of MOFs prepared via layer-by-layer deposition
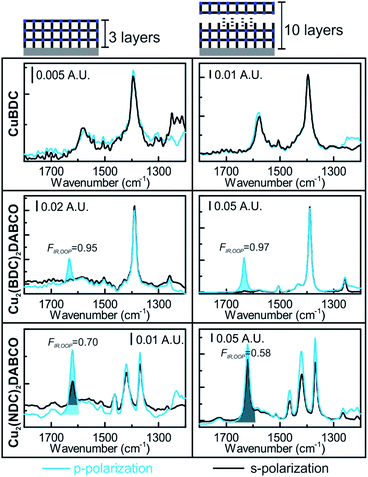
So far, MOF films obtained from Cu(OH)2 have been discussed, which have film thicknesses of 300–1200 nm (see Table S1 in ESI† for all films). The high thickness of the films allowed analysis in transmission and showed great absorbance values of up to 1 A.U. for spectra obtained in ATR configuration. The high sensitivity of the multibounce ATR crystals allows studying even thinner films as obtained by LbL synthesis. These films typically require a high number of deposited layers, typically >40 layers, to reach sufficient material enabling the characterization with laboratory XRD equipment. We studied the initial orientation of CuBDC, Cu2(BDC)2DABCO and Cu2(1,4-NDC)2DABCO films prepared on Si ATR crystals via LbL deposition methods (see ESI† for synthesis). In contrast to standard LbL deposition on SAM-modified Au surfaces, which would impede IR spectroscopy due to the high absorbance of Au, we followed a recent report on LbL on blank Si surfaces.46 The LbL method yields MOF film oriented in z-direction but without in-plane orientation. Therefore, the obtained XRD patterns of all films for >10 layers for 3D MOFs and >40 layers for CuBDC were in accordance with the XRD patterns obtained from films grown from randomly oriented Cu(OH)2 nanobelts (see Fig. S12 in ESI† for XRD data) and with patterns reported in literature.30,47Polarization-dependent ATR spectra of CuBDC, Cu2(BDC)2DABCO and Cu2(1,4-NDC)2DABCO with 3 and 10 layers, respectively, are given in Fig. 6. While due to the low film thickness of the films with three layers, no reflections in the XRD patterns were detected using standard integration times, the polarization dependence of the νasymm(COO−) is clearly visible for the 3D MOFs films. Spectra of CuBDC after 3 and 10 layer deposition are identical with the spectra of CuBDC films from random Cu(OH)2. Cu2(BDC)2DABCO fits the structure of the film with [001] preferred OOP orientation without in-plane orientation: the νasymm(COO−) band shows strong polarization dependence, as its transition dipole moment is aligned in z-direction, thus, this band is only visible in the p-polarized spectrum. Free rotation around the z-direction yield identical absorbance values for the νsymm(COO−) band. The νasymm(COO−) bands allow to determine the degree of out-of-plane orientation (FIR(νasymm(COO−)) = FIR,OOP) according to eqn (2) to be 0.95 and 0.97 for 3 and 10 layers, respectively. A similar behavior was found for Cu2(1,4-NDC)2DABCO for three deposited layers. However, the polarization-dependent spectra of the film with 10 layers show an increased absorbance for the p-polarized spectrum for all bands (FIR,OOP= 0.70 and 0.57 for 3 and 10 layers, respectively). This indicates that the preferential order in z-direction of the Cu2(1,4-NDC)2DABCO MOF decreases with increasing the number of deposition cycles. Although being less ordered, a dichroic ratio of R = 2 (for isotropic materials) is not observed. We attribute the deviation from R = 2 to the low film thickness that is known to decrease the field amplitude of Ez and thus the dichroic ratio for thin films converges to 1 for a film thickness of 0.48 Given these results, polarization-dependent ATR spectroscopy allows for quick inspection and in-depth investigations of the orientation of MOF ultrathin films that are otherwise only accessible with long integration times or in synchrotron facilities.
Orientation of aromatic linkers in MOF films
So far, the carboxylate vibrations have been used to study the orientation of the MOF film. By analyzing the vibrational modes of the aromatic rings in the MOF linkers, their orientation can be investigated as well. The skeletal ring vibrations of aromatic compounds are located between 1400 cm−1 and 1600 cm−1 with a transition dipole moment in-plane of the ring and perpendicular to the 1,4-C–C-axis (compare Fig. 7). Furthermore, the out-of-plane vibration of 1,4-substituted benzenes is found at 805 cm−1.49 We determined the direction of the transition dipole moments from a model compound using DFT calculations (see ESI† for details and Fig. 7A for orientation). The skeletal ring vibration is located at 1506 cm−1 for BDC. The film without in-plane orientation shows no polarization dependence because of the free rotation of the MOF film around the z-axis. In contrast, a strong polarization dependence is observed for three-dimensionally oriented Cu2(BDC)2DABCO films (see Fig. 5). The dichroic ratio A∥/A⊥ of the band at 1506 cm−1 was calculated for aligned and random MOFs films with [010] preferred OOP orientation and yielded 2 and 7.3, respectively. These ratios are almost identical to the A∥/A⊥ values of 2.1 and 6.4 found for the νsymm(COO−) band that has its transition dipole moment in the same direction. Based on this fact, we conclude that the aromatic ring is oriented perpendicular to its carboxylate plane (a–b lattice plane) as shown in Fig. 7B.This finding was further verified in polarization dependent IR transmission spectra of the out-of-plane vibration at 798 cm−1, which has its dipole moment oriented in y-direction and perpendicular to the band at 1506 cm−1. Strong absorbance of the Si-ATR crystal at wavenumber <1000 cm−1 prevents measurements in ATR configuration. With a single path through the substrate in transmission configuration, however, the vibrational modes around 800 cm−1 can be analyzed (see Fig. S14 in ESI† for spectra). The band at 798 cm−1 shows high absorbance in the s-polarized spectrum, which is in line with the dipole assignment for an aromatic ring oriented perpendicular to the carboxylate plane.
Here, IR spectroscopy provides for the first time information on the linker orientation in Cu2(BDC)2DABCO, which is not accessible with XRD measurements as the rotation of the aromatic linker causes no change in the MOF patterns (compare calculated patterns for crystal structures with different linker orientation in Fig. S16 in ESI†).
In contrast to Cu2(BDC)2DABCO, the aromatic linker vibration at 1515 cm−1 of Cu2(1,4-NDC)2DABCO shows no polarization dependence in the ATR spectra (compare Fig. 5). However, a strong polarization dependence, identical to Cu2(BDC)2DABCO, is found for the out-of-plane vibrations in the region around of 800 cm−1 for the aligned MOF film (compare spectra in Fig. S17 in ESI†). Although this confirms a preferential orientation of the aromatic linkers with similar linker orientation as found in the Cu2(BDC)2DABCO, the polarization dependence is less pronounced. This is most likely due to the fact that the 1,4-NDC linker can either rotate freely as it has been suggested for coordination polymers,50 or because the aromatic ring is not oriented parallel or perpendicular to the Cu-paddle wheel plane and is oriented under an angle of 48° as found in the reported crystal structure.51
Structure of CuBDC
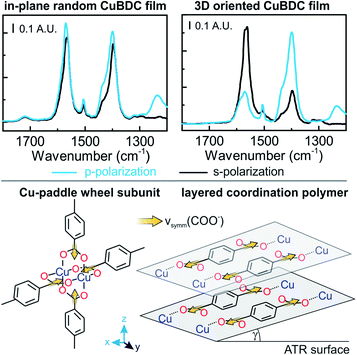
The in-plane orientation of CuBDC films synthesized from the oriented Cu(OH)2 nanobelts was confirmed by XRD patterns and transmission IR spectra, as shown in Fig. 1. Although the νasymm(COO−) band showed good correlation with φ scan data of XRD investigations, FIR(νsymm(COO−)) showed deviations from FXRD. In order to investigate this cause in more detail, polarization-dependent ATR spectra of CuBDC films were collected to investigate the three-dimensional molecular orientation. While the spectra of the three-dimensionally oriented CuBDC film only allow for retrieving the degree of orientation, information of the molecular orientation can be gained from the CuBDC film without in-plane orientation prepared from random Cu(OH)2 (compare Fig. 8): equal absorbance values for p- and s-polarized light were expected for the νasymm(COO−) band and were found in the spectra (R = 0.3/0.33 = 0.9, found: 1.2). Although the νsymm(COO−) band was expected to exhibit a dichroic ratio of 2, R = 1.15 was observed. The dichroic ratio from IR spectra in ATR and transmission configuration of the νsymm(COO−) band suggests that the BDC linkers are to a great extent oriented parallel to the surface; unlike in the Cu paddle wheel structure with 50% of the carboxylate bands in perpendicular orientation. The XRD pattern of CuBDC shown in Fig. 1 can be attributed to the structure consisting of Cu paddle wheels linked by four BDC with P4 symmetry, as found in previous reports.38 However, in general, there is less certainty in identifying the structure when there are few reflections in XRD patterns. It is also difficult to identify the local coordination structure in MOF by XRD. Our IR results indicate a different CuBDC structure constituting of different coordination bonds between Cu and carboxylic acids, similar to the structures observed in copper(II) terephthalate and copper(II) hydroxy-terephthalate coordination polymers (see Fig. S18 and S19 in ESI†).52–55We considered these structures and tested them against the IR spectra: for linkers parallel to the surface (γ = 0°), both carboxylate vibrations would show no contribution in z-direction. Thus, the transmission spectra and the ATR spectra would be identical. However, the band ratio νsymm(COO−)/νasymm(COO−) of 0.77 for transmission spectra of random CuBDC compared to 0.92 for the same film in ATR configuration suggests that the νsymm(COO−) band has a component in z-direction, which is not accessible in transmission. From this ratio, a percentage of 19% of linkers aligned perpendicular to the surface was derived. The fraction of CuBDC with linkers oriented perpendicular to the surface causes a 100 reflection in the out-of-plane XRD pattern at 2θ = ∼8.2°, while the parallel oriented fraction leads to the same reflection in the in-plane pattern. Typically, the occurrence of this reflection in both XRD configurations is used to confirm the presence of the Cu paddle wheel subunit connected by BDC linkers, and thus, the 2D MOF structure. Since XRD patterns obtained from different configurations cannot be compared quantitatively, we cannot assign the 100 reflection in the OOP pattern unambiguously to either the fraction of 19% of misaligned crystallites or the presence of a 2D MOF structure. However, the usually low porosity observed for CuBDC39 and the position of the COO− bands in the IR spectrum further point towards a more densely packed layered structure. While in 3D MOFs the νasymm(COO−) band is located between 1610–1640 cm−1,30 this band is located at 1570 cm−1 for CuBDC, which is the same position as reported for layered structures.25 Therefore, a different copper carboxylate connectivity, as reported for the layered structure, can be assumed in the CuBDC structure. Note that the methodology to calculate the degree of in-plane orientation FIR based on IR spectroscopy in transmission, as presented in the previous section, is still applicable for this structure: FIR derived from νasymm(COO−) is not affected by the tilting as its direction of the transition dipole moment is still in x–y plane. In summary, polarization-dependent IR spectroscopy provided information of the types of coordination bonds and their three-dimensional orientations in the CuBDC structure, which are difficult to reveal by XRD. It can be expected that the combination of XRD and polarization-dependent IR spectroscopy will contribute significantly to the complete clarification of the real structure of other coordination polymers and MOFs with unknown structures.
Conclusion
The orientation of 2D and 3D MOF films was studied using polarization dependent IR spectroscopy. MOF films were prepared on Si substrates and Si ATR crystals by layer-by-layer synthesis and from aligned Cu(OH)2 precursor films. Cu2(BDC)2DABCO and Cu2(1,4-NDC)2DABCO served as model systems as their established synthesis allowed to easily adjust their crystallographic orientation.21 However, we provide the theoretical underpinnings to extend the principle to MOFs with different subunits (compare eqn (7a) and (7b)). A new method to determine the degree of in-plane orientation of MOFs based on straight-forward IR transmission measurements was presented that bears comparison with conventional techniques based on XRD. The method is not suitable for investigations of ultrathin MOF films, as FTIR spectroscopy in transmission has a low sensitivity and the presented method thus relies on sufficient film thickness. In contrast, the high sensitivity of multibounce ATR crystals allowed us to study the orientation of the initial few layers of MOF films during LbL synthesis, usually requiring synchrotron irradiations or extensive integration times. We found a decrease in out-of-plane orientation with increasing number of layers only for Cu2(1,4-NDC)2DABCO, while Cu2(BDC)2DABCO remains oriented. For the first time, experimental evidence of the organic linker alignment perpendicular to the carboxylate plane in Cu2(BDC)2DABCO films was derived from the dichroic ratio of the ring vibrations of the aromatic linker. Information on the linker orientation is essential for applications that rely on mass transport along the pores that might be hindered by linkers extending into the pore channel. Finally, inexplicable polarization dependent IR spectra of the 2D MOF CuBDC made us revisit its structure. In contrast to data from XRD, IR crystallography revealed that the metal ions are not connected via a Cu-paddle wheel subunit as reported so far but in a layered structure.Future work will combine the experimental setup with adsorption studies of probe molecules, similar to ref. 56 and 57. These would not just allow to investigate the orientation of the MOF itself but the alignment of guest molecules during the adsorption process. Insights into the orientation and adsorption site of the probe molecules will deepen the understanding of interactions between adsorbent and adsorbate, which is key to exploit the full potential of MOF films.
The presented principles are not limited to MOF films but can be easily translated to other thin films, e.g. inorganic, organic and inorganic–organic hybrid thin films. For instance, the orientation of nanocrystal films based on heavy atoms can be easily studied by X-ray and electron diffraction. However, these nanocrystals are typically stabilized with organic ligands, which significantly influence the nanocrystal's properties. For organic ligands and the orientation of functional groups, diffraction techniques lack in sensitivity. In general, inorganic–organic composite materials account for the majority of nanomaterials with highly promising properties currently under intense investigations. Consequently, the potential of IR crystallography has yet to be fully exploited, allowing to fill the information gap left by diffraction techniques and giving access to key information of hybrid material structures.
Author contributions
B. B.: Design of methodology, MOF synthesis, curation, writing – original draft; K. I.: MOF synthesis; K. O.: validation, writing – review & editing, resources; M. T.: validation, resources, writing – review & editing, funding acquisition.Conflicts of interest
There are no conflicts to declare.Acknowledgements
The present work is partially supported by Grand-in-Aids from the Ministry of Education, Culture, Sports, Science and Technology (MEXT), administrated by Japan Society for the Promotion of Science (JSPS), and also by JST, PRESTO Grant Number JPMJPR19I3, Japan. B. B. acknowledges the support via JSPS Invitational Fellowships for Research in Japan (PE20025). K. O. acknowledges financial support from Izumi Science, Technology Foundation and the Cooperative Research Program of Institute for Catalysis, Hokkaido University (21B1019). The authors thank Paolo Falcaro and Jakob Hayden for fruitful discussions.Notes and references
- H. Furukawa, K. E. Cordova, M. O'Keeffe and O. M. Yaghi, Science, 2013, 341, 1230444 Search PubMed.
- Y. Cui, J. Zhang, H. He and G. Qian, Chem. Soc. Rev., 2018, 47, 5740–5785 Search PubMed.
- V. Bon, Curr. Opin. Green Sustain. Chem., 2017, 4, 44–49 Search PubMed.
- H. Wang, Q. L. Zhu, R. Zou and Q. Xu, Chem, 2017, 2, 52–80 Search PubMed.
- V. Pascanu, G. González Miera, A. K. Inge and B. Martín-Matute, J. Am. Chem. Soc., 2019, 141, 7223–7234 Search PubMed.
- D. Yang and B. C. Gates, ACS Catal., 2019, 9, 1779–1798 Search PubMed.
- Y. He, F. Chen, B. Li, G. Qian, W. Zhou and B. Chen, Coord. Chem. Rev., 2018, 373, 167–198 Search PubMed.
- H. Li, K. Wang, Y. Sun, C. T. Lollar, J. Li and H. C. Zhou, Mater. Today, 2018, 21, 108–121 Search PubMed.
- Z. Liao, T. Xia, E. Yu and Y. Cui, Crystals, 2018, 8, 338 Search PubMed.
- H. Y. Li, S. N. Zhao, S. Q. Zang and J. Li, Chem. Soc. Rev., 2020, 49, 6364–6401 Search PubMed.
- D. J. Wales, J. Grand, V. P. Ting, R. D. Burke, K. J. Edler, C. R. Bowen, S. Mintova and A. D. Burrows, Chem. Soc. Rev., 2015, 44, 4290–4321 Search PubMed.
- Y. Zhang and C. H. Chang, Processes, 2020, 8, 377 Search PubMed.
- Z. Fu and G. Xu, Chem. Rec., 2017, 17, 518–534 Search PubMed.
- X. Mu, W. Wang, C. Sun, J. Wang, C. Wang and M. Knez, Adv. Mater. Interfaces, 2021, 2002151 Search PubMed.
- O. Shekhah, H. Wang, S. Kowarik, F. Schreiber, M. Paulus, M. Tolan, C. Sternemann, F. Evers, D. Zacher, R. A. Fischer and C. Wöll, J. Am. Chem. Soc., 2007, 129, 15118–15119 Search PubMed.
- C. L. Ruiz-Zambrana, M. Malankowska and J. Coronas, Dalton Trans., 2020, 49, 15139–15148 Search PubMed.
- J. L. Zhuang, A. Terfort and C. Wöll, Coord. Chem. Rev., 2016, 307, 391–424 Search PubMed.
- C. Crivello, S. Sevim, O. Graniel, C. Franco, S. Pane, J. Puigmarti-Luis and D. Munoz-Rojas, Mater. Horiz., 2021, 8, 168–178 Search PubMed.
- J. L. Zhuang, M. Kind, C. M. Grytz, F. Farr, M. Diefenbach, S. Tussupbayev, M. C. Holthausen and A. Terfort, J. Am. Chem. Soc., 2015, 137, 8237–8243 Search PubMed.
- P. Falcaro, K. Okada, T. Hara, K. Ikigaki, Y. Tokudome, A. W. Thornton, A. J. Hill, T. Williams, C. Doonan and M. Takahashi, Nat. Mater., 2017, 16, 342–348 Search PubMed.
- K. Okada, M. Nakanishi, K. Ikigaki, Y. Tokudome, P. Falcaro, C. J. Doonan and M. Takahashi, Chem. Sci., 2020, 11, 8005–8012 Search PubMed.
- K. Ikigaki, K. Okada, Y. Tokudome, T. Toyao, P. Falcaro, C. J. Doonan and M. Takahashi, Angew. Chem., Int. Ed., 2019, 58, 6886–6890 Search PubMed.
- F. M. Hoffmann, Surf. Sci. Rep., 1983, 3, 107–192 Search PubMed.
- C. Yang and C. Wöll, Adv. Phys.: X, 2017, 2, 373–408 Search PubMed.
- G. Delen, Z. Ristanović, L. D. B. Mandemaker and B. M. Weckhuysen, Chem.–Eur. J., 2018, 24, 187–195 Search PubMed.
- K. Müller, N. Vankova, L. Schöttner, T. Heine and L. Heinke, Chem. Sci., 2019, 10, 153–160 Search PubMed.
- P. St. Petkov, G. N. Vayssilov, J. Liu, O. Shekhah, Y. Wang, C. Wöll and T. Heine, ChemPhysChem, 2012, 13, 2025–2029 Search PubMed.
- P. R. Griffiths and J. A. de Hasseth, Fourier Transform Infrared Spectrometry (FTIR), Wiley-Interscience, 2015, vol. 222 Search PubMed.
- R. G. Greenler, J. Chem. Phys., 1966, 44, 310–315 Search PubMed.
- X. J. Yu, Y. M. Xian, C. Wang, H. L. Mao, M. Kind, T. Abu-Husein, Z. Chen, S. B. Zhu, B. Ren, A. Terfort and J. L. Zhuang, J. Am. Chem. Soc., 2019, 141, 18984–18993 Search PubMed.
- M. Köberl, M. Cokoja, W. A. Herrmann and F. E. Kühn, Dalton Trans., 2011, 40, 6834–6859 Search PubMed.
- S. C. Park, Y. Liang and H. S. Lee, Macromolecules, 2004, 37, 5607–5614 Search PubMed.
- L. Bokobza, Polymers, 2019, 11, 1159 Search PubMed.
- S. K. Mallapragada and B. Narasimhan, in Encyclopedia of Analytical Chemistry, John Wiley & Sons, Ltd, Chichester, UK, 2006 Search PubMed.
- J. Heberle and T. Gensch, Nat. Struct. Biol., 2001, 8, 195–197 Search PubMed.
- J. T. Sage, Appl. Spectrosc., 1997, 51, 568–573 Search PubMed.
- R. D. B. Fraser, J. Chem. Phys., 1953, 21, 1511–1515 Search PubMed.
- J. Liu, B. Lukose, O. Shekhah, H. K. Arslan, P. Weidler, H. Gliemann, S. Bräse, S. Grosjean, A. Godt, X. Feng, K. Müllen, I. B. Magdau, T. Heine and C. Wöll, Sci. Rep., 2012, 2, 1–5 Search PubMed.
- Z. Wang, K. Rodewald, R. Medishetty, B. Rieger and R. A. Fischer, Cryst. Growth Des., 2018, 18, 7451–7459 Search PubMed.
- Polymer Morphology: Principles, Characterization, and Processing, ed. Q. Guo, Wiley, 2016 Search PubMed.
- K. I. Hadjiivanov, D. A. Panayotov, M. Y. Mihaylov, E. Z. Ivanova, K. K. Chakarova, S. M. Andonova and N. L. Drenchev, Chem. Rev., 2021, 121(3), 1286–1424 Search PubMed.
- V. I. Kovalenko, A. A. Akhmadiyarov, A. E. Vandyukov and A. R. Khamatgalimov, J. Mol. Struct., 2012, 1028, 134–140 Search PubMed.
- N. J. Harrick, J. Opt. Soc. Am., 1965, 55, 851 Search PubMed.
- U. P. Fringeli, Chimia, 1992, 46, 200–214 Search PubMed.
- F. M. Mirabella, Internal Reflection Spectroscopy: Theory and Applications, Marcel Dekker, 1993 Search PubMed.
- B. D. McCarthy, T. Liseev, A. M. Beiler, K. L. Materna and S. Ott, ACS Appl. Mater. Interfaces, 2019, 11, 38294–38302 Search PubMed.
- O. Shekhah, K. Hirai, H. Wang, H. Uehara, M. Kondo, S. Diring, D. Zacher, R. A. Fischer, O. Sakata, S. Kitagawa, S. Furukawa and C. Wöll, Dalton Trans., 2011, 40, 4954–4958 Search PubMed.
- E. Goormaghtigh, V. Raussens and J. M. Ruysschaert, Biochim. Biophys. Acta, Rev. Biomembr., 1999, 1422, 105–185 Search PubMed.
- G. Socrates, Infrared and Raman Characteristic Group Frequencies: Tables and Charts, Wiley, 3rd edn, 2004 Search PubMed.
- S. Horike, R. Matsuda, D. Tanaka, S. Matsubara, M. Mizuno, K. Endo and S. Kitagawa, Angew. Chem., Int. Ed., 2006, 45, 7226–7230 Search PubMed.
- S. Furukawa, K. Hirai, K. Nakagawa, Y. Takashima, R. Matsuda, T. Tsuruoka, M. Kondo, R. Haruki, D. Tanaka, H. Sakamoto, S. Shimomura, O. Sakata and S. Kitagawa, Angew. Chem., Int. Ed., 2009, 48, 1766–1770 Search PubMed.
- S. Abdelouhab, M. François, E. Elkaim and P. Rabu, Solid State Sci., 2005, 7, 227–232 Search PubMed.
- L. Deakin, A. M. Arif and J. S. Miller, Inorg. Chem., 1999, 38, 5072–5077 Search PubMed.
- T. Stassin, S. Rodríguez-Hermida, B. Schrode, A. J. Cruz, F. Carraro, D. Kravchenko, V. Creemers, I. Stassen, T. Hauffman, D. De Vos, P. Falcaro, R. Resel and R. Ameloot, Chem. Commun., 2019, 55, 10056–10059 Search PubMed.
- P. J. Kitson, R. J. Marshall, D. Long, R. S. Forgan and L. Cronin, Angew. Chem., Int. Ed., 2014, 53, 12723–12728 Search PubMed.
- B. Baumgartner, J. Hayden, J. Loizillon, S. Steinbacher, D. Grosso and B. Lendl, Langmuir, 2019, 35(37), 11986–11994 Search PubMed.
- F. Bonino, C. Lamberti and S. Bordiga, in The Chemistry of Metal-Organic Frameworks: Synthesis, Characterization, and Applications, Wiley-VCH Verlag GmbH & Co. KGaA, 2016, pp. 657–690 Search PubMed.
Footnote |
| † Electronic supplementary information (ESI) available. See DOI: 10.1039/d1sc02370e |
| This journal is © The Royal Society of Chemistry 2021 |

