 Open Access Article
Precise sequencing of single protected-DNA fragment molecules for profiling of protein distribution and assembly on DNA†
Zheng
Yuan
 ab,
Dapeng
Zhang
 ad,
Fangzhi
Yu
 ab,
Yangde
Ma
 b,
Yan
Liu
ab,
Xiangjun
Li
b and
Hailin
Wang
 *abcd
*abcd
aState Key Laboratory of Environmental Chemistry and Ecotoxicology, Research Center for Eco-Environmental Sciences, Chinese Academy of Sciences, Beijing, 100085, P. R. China. E-mail: hlwang@rcees.ac.cn; Fax: +86 10 62849600; Tel: +86 10 62849600
bUniversity of Chinese Academy of Sciences, Beijing, 100049, P. R. China
cInstitute of Environment and Health, Jianghan University, Wuhan, Hubei 430056, P. R. China
dInstitute of Environment and Health, Hangzhou, Institute for Advanced Study, UCAS, Hangzhou 310000, P. R. China
First published on 2nd January 2021
Abstract
Multiple DNA-interacting protein molecules are often dynamically distributed and/or assembled along a DNA molecule to adapt to their intricate functions temporally. However, analytical technology for measuring such binding behaviours is still missing. Here, we demonstrate the unique capacity of a supernuclease for a highly efficient cutting of the unprotected-DNA segments and with complete preservation of the protein-occluded DNA segments at near single-nucleotide resolution. By exploring this high-resolution cutting, an unprecedented assay that allows a precise sequencing of single protected-DNA fragment molecules (SPDFMS) was developed. As relevant applications, relevant information was gained on the respective distribution/assembly patterns and coordinated displacement of single-stranded DNA-binding protein and recombinase RecA, two model proteins, on DNA. Benefiting from this assay, we also for the first time provide direct measurement of the length of single RecA nucleofilaments, showing the predominant stoichiometry of 5–7 RecA monomers per RecA nucleofilament under physiologically relevant conditions. This innovative assay appears as a promising analytical tool for studying diverse protein–DNA interactions implicated in DNA replication, transcription, recombination, repair, and gene editing.
Introduction
Protein–DNA interactions (PDIs) occur in a myriad of biological processes,1e.g., DNA replication,2 transcription,3 and gene editing.4,5 An abnormal PDI may alter genetic and/or epigenetic information, triggering pathological signals.6–8 Informative PDI measurements are required for the understanding of normal physiology and pathology. In addition to drug discovery and clinical diagnosis, PDIs can also be utilized for the development of chemical tools.9–14 A number of methodologies and technologies have been extensively designed for the study of thermodynamics and dynamics of PDIs, including surface plasmon resonance, fluorescence microscopy, traditional slab gel electrophoresis and capillary electrophoresis.15–21 Meanwhile, a few technologies have been exploited for measuring the structure, conformation, and mechanics of protein–DNA complexes,13,22,23e.g., footprinting assays,24–29 electron microscopy, single molecule force microscopy,13,30 and high resolution fluorescence imaging.31–33In fact, many DNA-interacting proteins are considered to be dynamically distributed or assembled along a DNA strand rather than statically arrested just at specific positions of DNA.34,35 For example, the protein binding to a DNA molecule varies with stoichiometry,36 and upon movement (e.g., sliding, jumping),37 dynamic assembly and disassembly,38 and phase transition.39 In this sense, it is very important to assess the distribution and assembly of DNA-interacting proteins on DNA. Furthermore, in a biological process, multiple protein–DNA interactions may occlude on the same DNA patch in a sequential, competitive, independent, and/or cooperative manner.40–43 Therefore, it is also critical to measure the distribution/assembly of proteins on DNA for understanding sequential and coordinated interaction events. However, ensemble biochemical measurements typically look only at the average values of the final output from a PDI process, and may overlook kinetic details and binding diversity of individual molecules that are important for understanding the overall nature of a particular PDI.35 Therefore, to characterize the protein distribution and assembly on DNA, it is technically demanding to use single molecule technologies.
Canonical Förster resonance energy transfer (FRET) is a distance-dependent transfer of energy from a donor dye to an acceptor dye. Thus, FRET technologies are commonly used for measuring PDIs. However, as described above, the measurement of temporal protein distribution on DNA has to be achieved at the level of single molecules. Therefore, single molecule (sm) FRET technologies are necessary. However, many PDIs often occur for a DNA length far beyond the distance limit of canonical smFRET (10 nm).44 For example, conservative and important homologous recombination (HR) repair may take place over a DNA length of 50–200 nm.45 On the other hand, single DNA curtain technology can be used for visualizing protein distribution along DNA at the scale of 1–12 μm.34,35 To date, it is one of the most challenging issues to directly measure the distribution and assembly of multiple protein molecules on a DNA strand at a scale of 10 nm to 1 μm.
Instead of developing fluorescence-based technologies, we design a high-resolution cutting technology, and combine it with widely used TOPO cloning and DNA sequencing technologies to propose a novel analytical method: precise sequencing of single protected-DNA fragment molecules (SPDFMS) assay. The known DNA sequencing-involved footprinting assays are commonly used for measuring PDIs to infer protein binding-induced hypersensitive sites.24–27,29 However, the cutting activity of routinely used DNase I for footprinting assay is sensitive to inorganic salts,46 which are often required to support physiologically relevant PDIs. More importantly, because of the random cutting feature and poor cutting efficiency of DNase I,26,27 the footprints of protein-bound DNA are obtained at low resolution. Actually, hypersensitive sites must be distinguished from a set of irrelevant nicks. Chemically, potassium permanganate (KMnO4) can oxidize pyrimidine residues in single-stranded DNA. This reaction also provides a basis for footprinting studies of PDIs.47–49 However, it is established that KMnO4 might cause multiple-hit oxidation sites to DNA and oxidize targeted proteins, thus leading to a false interpretation of footprints.50 To our knowledge, there is no report of available footprinting technologies for the exquisite measurement of protein distribution and assembly on DNA. Furthermore, due to its low resolution and low efficiency, the cutting technology used in known footprinting assay is not suitable for the proposed SPDFMS assay. We need a new cutting nuclease and a new protocol.
Our proposed SPDFMS assay utilizes Sanger sequencing, which can read up to 900 bp.51 Considering the length equivalence of 3.4 nm for 10.5 bp,45 the corresponding measurable distance is about 300 nm. Therefore, ideally, the proposed SPDFMS can be applied to measure protein distribution on DNA at a distance scale up to 300 nm. Combined with data synthesis from the sequencing of about 83–287 single protected-DNA fragment molecules (amplified by clonal sequencing), the landscapes for the binding and distribution of proteins on a DNA strand can be explicitly inferred. Based on this innovative assay, we demonstrate the distribution, assembly and coordinated displacement of two model proteins on single-stranded DNA. This allows gaining new insights into protein–DNA interactions.
Results
Highly efficient cutting of DNA by supernuclease
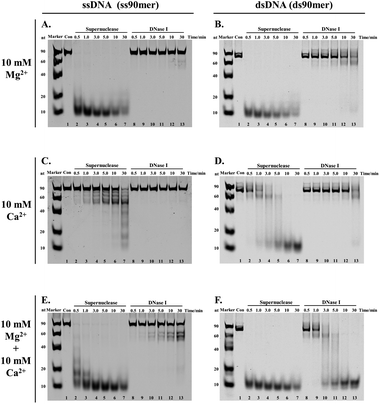
The development of the proposed SPDFMS assay necessitates as a first step an efficient and suitable nuclease. It was reported that supernuclease can cut the substrate into 5′-monophosphate-terminated oligonucleotides 2–5 nucleotides in length.52,53 This unique feature prompts us to assume that supernuclease is an excellent option to achieve highly efficient and high-resolution cutting of unprotected DNA. For this purpose, we first examined the capacity of two nucleases, supernuclease52,53 and DNase I,27 in DNA cutting. Of note, DNase I is routinely used in footprinting assays.27,29 These well-documented applications support that DNase I has the ability to cut unprotected DNA. Supernuclease is also used for assessing protein–DNA interactions,38 hinting at its ability to cut unprotected DNA. Therefore, the DNA-cutting efficiency of the two nucleases was assessed. The assessment was performed rationally using the same molar quantity. Two DNA probes used for this purpose were single-stranded and double-stranded DNA with respective lengths of 90 nucleotides (nt) and 90 base pairs (bp). The probes were fluorescently labelled with a Cy5 dye (Table S1†). Under all three sets of tested conditions, the supernuclease can digest DNA more efficiently than DNase I irrespective of whether the tested DNA substrate is present in the form of a double-stranded or single-stranded structure (Fig. 1). However, digestion of ssDNA (and to a lesser extent dsDNA) by supernuclease is significantly reduced in the presence of 10 mM Ca2+ (Fig. 1C and D). Interestingly, in the presence of 10 mM Mg2+ or 10 mM Mg2+ + 10 mM Ca2+, supernuclease could digest DNA in both forms (ds and ss) into 10 nt oligonucleotides within one minute (Fig. 1A, E, B and F, lane 3). In contrast, DNase I could digest dsDNA into 10 nt oligonucleotides only in the presence of both Mg2+ and Ca2+ and it requires 10–30 min (Fig. 1F, lanes 10–13). In the presence of only Mg2+ or Ca2+, it is hard for DNase I to digest dsDNA within 30 min. Interestingly, the co-existence of Mg2+ and Ca2+ can stimulate the cutting activity of DNase I on dsDNA. However, even under such conditions (10 mM Mg2+ + 10 mM Ca2+), DNase I only partially digested ssDNA. This is also consistent with a previous report showing a stronger digestion preference of DNase I toward dsDNA.27 These results support that supernuclease is a better choice to be used for highly efficient and rapid DNA cutting. Moreover, the results also suggest that the enzymatic activity of supernuclease is Mg2+ dependent, and that Ca2+ can induce moderate enzymatic activity of supernuclease. Therefore, in the following supernuclease-based assays, 10 mM Mg2+ was used.High resolution removal of unprotected DNA
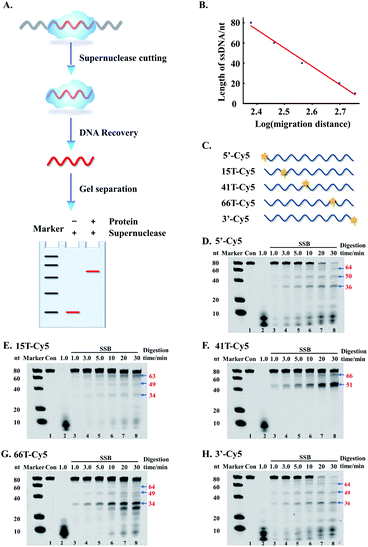
As described above, the supernuclease displays high cutting efficiency. Therefore, we further examined the cutting accuracy and efficiency of the supernuclease on unprotected-DNA segments in a PDI prototype. Since the unprotected-DNA segments are removed by supernuclease cutting, only the protected DNA fragments are expected to be preserved (Fig. 2A) and can be measured using polyacrylamide gel electrophoresis (PAGE) analysis. In this case, we used the interaction of E. coli single-stranded DNA-binding protein (SSB)54 and ssDNA as an example. A series of ss80(+) probes that carried a fluorophore label at a designated nucleotide site (Fig. 2C) were synthesized. These probes do not possess a predictable stable secondary structure according to fold analysis (ESI Fig. S1†). We observed a number of SSB-protected ssDNA fragments (see Fig. 2D–H). The estimated length of these protected fragments was derived from the corresponding electrophoretic shift by referring to the length standard curve (Fig. 2B). The estimated length is assumed to be equal to that of the fragment completely protected by the bound SSB in the SSB–ssDNA complexes. By this simplified assumption, we observed two major patterns, (SSB)65±2 and (SSB)50±1, for all five ss80(+) probes. We also observed an (SSB)35±1 pattern for four probes except that with a label at the 41st dT. These patterns are well preserved throughout supernuclease cutting (1–30 min) (Fig. 2D–H). The observation of (SSB)65 and (SSB)35 is exclusively consistent with previous reports.55,56 However, the observed (SSB)50 mode differs in length from the previously reported (SSB)56 mode56 and should be a transition of (SSB)35 to (SSB)56.57Noteworthily, the above mathematical consistence of the binding patterns ((SSB)65 & (SSB)35) also proves that supernuclease cutting can accurately remove the unprotected-ssDNA segments approximately at single-nucleotide resolution. On the other hand, this observation may also support that supernuclease cutting does not perturb the SSB–DNA interaction.
Strategy for a precise sequencing of single protected-DNA fragments
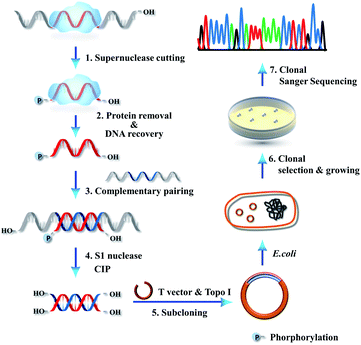
We further combined high-resolution supernuclease cutting with Sanger sequencing, aiming to establish an assay for sequencing of single protected-DNA fragments (SPDFMS). For this purpose, a detailed protocol was designed. We select an ssDNA-involved PDI to validate the approach (Scheme 1). First, the unprotected-ssDNA segment is completely removed using supernuclease from the protein-bound DNA. Second, the proteins are removed from the protected-DNA fragments by phenol/chloroform extraction, and then the protected ssDNA segment is recovered using ethanol precipitation. In the third step, the recovered ssDNA segment is hybridized with a complementary ssDNA, which has a sequence that fully and complementarily matches with the original ssDNA substrate along its whole length. This unique design satisfies the requirement of a complementary Watson–Crick base pairing with a protected-ssDNA segment of any length. Fourth, the unpaired overhang segment(s) of the hybridized dsDNA are cut away using S1 nuclease, and the residual terminal phosphate groups are removed using calf intestinal alkaline phosphatase (CIP). As a result, blunt and hydroxylated ends-containing dsDNA segments are obtained. Fifth, the obtained dsDNA segments are simply ligated to T vectors (plasmids) by vaccinia topoisomerase I (Topo-I), a subcloning step. Subsequently, the plasmids carrying the inserted sequences are transformed into DH5α E. coli competent cells, which are amplified as T-monoclonal strains. The T-monoclones are then selected using an anti-ampicillin gene residing in the un-ligated T-vector plasmid. At last, T-monoclones are randomly picked for Sanger sequencing. Based on this strategy, the inserted sequences of the plasmids represent the protected-ssDNA segment, and can be inferred from the measured sequences.We further extended the above strategy (illustrated in Scheme 1) for performing precise sequencing of randomly chosen 83–287 T-monoclones (Scheme 2). Essentially, each T-monoclone is grown from bacterial replication-based amplification of one plasmid molecule carrying one inserted single protected-DNA fragment molecule. Therefore, each obtained inserted-sequence that is inferred from a dedicated T-monoclone belongs to one single protected-DNA fragment molecule. Dealing with these sequencing data (data synthesis) from 83–287 single protected-DNA fragment molecules, the landscape for the distribution and assembly of one protein of interest on a DNA strand can be explicitly inferred (Scheme 2).
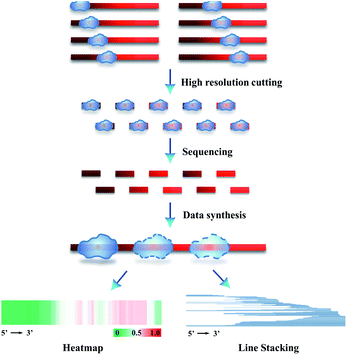 | ||
| Scheme 2 Schematic illustration of SPDFMS of randomly chosen single protected DNA fragments for measuring the distribution of protein on single-stranded DNA. | ||
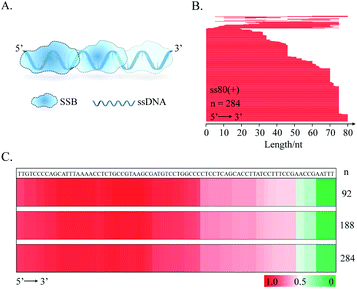
To present the inferred data concerning the protein distribution on the DNA strand, we created two figure formats. The first one deals with line stacking. Each protected segment is recorded as a line with a position representing its sequence, which is set along the full length of the DNA substrate (Scheme 2 & Fig. 4B). The second figure format, HeatMap, is drawn from the additive binding probability of every nucleotide in all protected DNA fragments. As an interesting feature this allows evaluating the panoramic protein distribution on DNA (Scheme 2 & Fig. 4C).
Correction of intermediate dsDNA templates
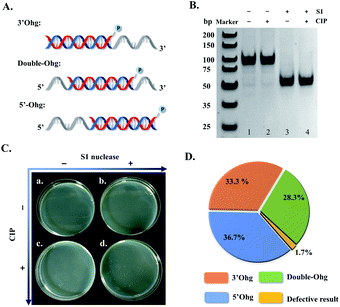
In the strategy proposed in Scheme 1, an action of dual enzymes, S1 nuclease/CIP, is applied for removing overhangs and terminal phosphate groups of generated intermediate dsDNA templates (fourth step, Scheme 1). To test this design, three types of hybridized dsDNA (50 bp) were synthesized with 3′-overhang (3′Ohg, 30 nt), 5′-overhang (5′Ohg, 30 nt), and double overhangs (double-Ohg, 15 nt on each side) (Fig. 3A), respectively. These DNA substrates were equally mixed and treated with S1 nuclease and/or CIP. Evidently, all three DNA substrates could be digested into 50 bp end-blunted dsDNA products (Fig. 3B, lanes 3 and 4). In addition, only a large number of the T-monoclones was observed when the DNA mixture was treated with both S1 nuclease and CIP (Fig. 3C and D). Thus 60 T-monoclones were randomly selected from dual S1 nuclease/CIP-treated DNA mixture for sequencing; interestingly 59 clones were found to show the correct sequences of inserted fragments (Fig. 3D). In fact, only one T-monoclone belonging to the hybridized dsDNA with double overhangs appeared to have a 4 bp-shortened sequence (46 bp vs. 50 bp). Furthermore, by counting clone abundance, it may be concluded that the dual enzymes (S1 nuclease and CIP) can accurately remove all three types of overhang with similar efficiencies (Fig. 3D).The distribution of SSB protein on single-stranded DNA
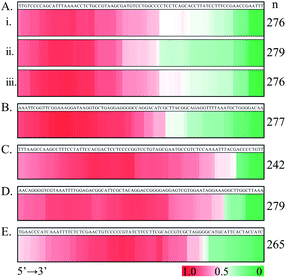
Following the above successful achievements attempts were made to extend the applications of the SPDFMS assay to the assessment of the distribution of proteins on DNA. We first investigated the distribution of SSB protein on ssDNA substrate ss80(+) (80 nt long). Upon sequencing 92–284 T-monoclones for the SSB-protected ss80(+) fragments, comprehensive sequencing data were obtained. With these accumulated data (Fig. 4B and C), the distribution of the bound SSB protein along the DNA strand can be derived. Strikingly, preferential binding of SSB on the 5′-flank of this ssDNA substrate was observed. This binding pattern can be clearly seen even by sequencing only 92 fragment molecules.Similar distribution patterns were also noted for seven examined ssDNA substrates (Fig. 5). Noteworthily, the observed 5′-flank binding preference can also be observed in the presence of three types of terminal phosphorylation (Fig. 5A). In this case, four phosphorylation scenarios for ss80(+) were examined: (1) no terminal phosphorylation (Fig. 4C); (2) 5′-phosphorylated (Fig. 5Ai); (3) 3′- phosphorylated (Fig. 5Aii); and (4) doubly phosphorylated at both 5′ and 3′ (Fig. 5Aiii). However, 3′-phosphorylation may further impair the binding of SSB on the 3′ flank of the single-stranded DNA (Fig. 5Aii).
We further examined the binding feature of SSB by testing a complementary sequence (ss80(−), Fig. 5B) and two mirror sequences (Fig. 5C and D). The two mirror sequences are the same as for ss80(+) and ss80(−), respectively, but with an opposite 5′ → 3′ to 3′ → 5' orientation. For the same purpose, another ssDNA substrate (ss80(++)), which had the same base composition as that for ss80(+) but a different sequence order (Fig. 5E), was also examined. Consistently, the same 5′-segment binding preference was observed. However, we observed some fluctuating distribution patterns. The sequence in Fig. 5B is more 5′ populated than that in Fig. 5C–E. Most notably, the sequences used in Fig. 5C–E appear to have a decrease in distribution at the very 5′-end, with the sequence in Fig. 5E being the most notable.
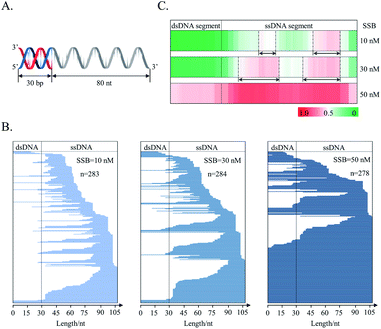
The distribution of SSB on a joint DNA substrate was also investigated. This substrate consisted of a double-stranded segment (30 bp) and a single-stranded segment (80 nt). The double-stranded segment was located at the 5′ flank of the single-stranded segment, and the substrate was called “5′ds30-ss80” (Fig. 6A). This design mimics the in vivo DNA substrates generated in the HR repair process.58 The primary function of SSB is to protect newly generated single-stranded DNA during DNA metabolism.40 As revealed by counting T-monoclones, the grown T-monoclones are rare for the naked DNA substrate due to its efficient removal by supernuclease. In the presence of SSB, the number of grown T-monoclones increases with increasing concentration of SSB, proving the dose-dependent protection of the substrate as a result of SSB binding (ESI Fig. S2†). The sequencing of randomly chosen T-monoclones (n = 278–284) allows comprehensive sequencing data on the protected-DNA fragments, from which the distribution of the bound protein along the DNA strand was inferred (Fig. 6C and B).
Both data treatments (Fig. 6B and C) show an increased protection for the single-stranded segment with increasing concentrations of SSB. These results suggest preferential distribution of SSB on the single-stranded segment of the joint DNA substrate. This is in agreement with the binding selectivity of SSB toward ssDNA.36 For the single-stranded segment of the joint DNA substrate, two preferentially protected regions were observed (Fig. 6C). Between the two regions, SSB was found to bind more strongly to the flank of 3′ extremity. Noteworthily, it is hard for both the 5′ and 3′ termini of the single-stranded region of the substrate to be occluded by SSB, suggesting a free energy barrier to prevent SSB from terminal binding. However, we also observed the protection of the double-stranded segment by SSB at a high concentration of the tetramer (50 nM). These results are suggestive of a weak interaction of SSB with the double-stranded segment of the joint DNA substrate.
RecA assembly on DNA
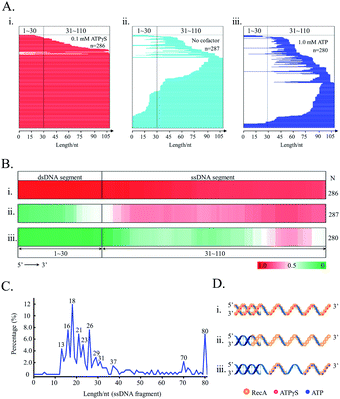
We further applied the SPDFMS assay for assessing the assembly of proteins on DNA. Recombinase RecA was used as the model protein. In general, RecA can be assembled on ssDNA to form active nucleofilaments, which are the core complexes used to search for the homologous template and to catalyse strand exchange in the HR pathway.30,34 Recently, we identified that unsaturated RecA nucleofilaments, that are stimulated by full RecA ATPase activity, are responsible for mediating HR.38 However, the exact distribution and assembly of RecA on physiological DNA substrates remains to be established.In the presence of unhydrolysable ATP analogue ATPγS, both single-stranded and double-stranded segments of the joint DNA substrate (5′ds30-ss80) are completely protected by the RecA assembly (Fig. 7Ai and Bii), accounting for 85.0% (n = 286). This is consistent with a previous study showing an extension of RecA assembly from single-stranded to double-stranded segments as stimulated by ATP binding.59 Our observation also confirms the extremely high cooperativity of RecA assembly as stimulated by ATP binding (Fig. 7Di).
In the presence of physiologically relevant cofactor ATP, that stimulates both ATP binding and ATP hydrolysis, RecA protein prefers binding to the flank of 3′ for the substrate 5'ds30-ss80 (Fig. 7Aiii and Biii). Moreover, an effective protection on the double-stranded segment of the substrate was not observed (the protected fraction of double-stranded segment: 11.1%, n = 280). It was also found that ATP hydrolysis impairs the cooperativity of RecA assembly on DNA (Fig. 7Diii).
In the absence of any nucleotide cofactor, RecA protein itself is assembled mainly on the single-stranded segment of the substrate (Fig. 7Aii and Bii). Essentially, the nucleotide cofactor is dispensable to the assembly of RecA on DNA (Fig. 7Dii). It is possible that the cofactor ATP is required to limit the length of active RecA nucleofilaments.
The assessment of the sequence data allows the calculation of the length of single RecA nucleofilaments. Since every three nucleotides binds one RecA monomer,60 the length of the protected fragments can be used to evaluate how many RecA monomers are involved in single nucleofilaments. In this case, it was assumed that each obtained protected-DNA fragment is occluded by one RecA nucleofilament, which is formed by contiguous RecA binding. This is reasonable because the unprotected DNA gaps between two nucleofilaments would be cut by the highly efficient supernuclease. As stimulated by physiologically relevant ATP (Fig. 7C), the major fragments with lengths of 16 nucleotides (nt), 18 nt, and 21 nt, that correspond to 5–7 RecA monomers per nucleofilament, could be observed. About 72.1% nucleofilaments consist of 4–10 RecA monomers (n = 280).
Sequential binding of SSB and RecA on the joint DNA substrate
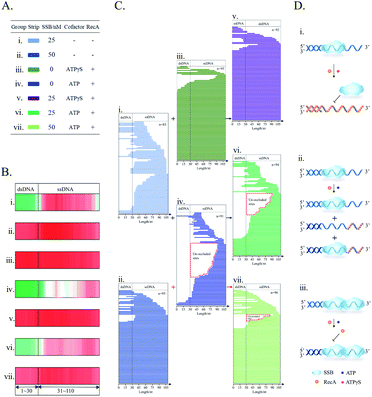
At last, still using the SPDFMS assay, the sequential interactions of the two model DNA repair proteins, SSB and RecA, with DNA were examined. As in the first step of in vivo HR, SSB protein binds and protects the newly generated ssDNA segment, and then recombinase RecA protein displaces the bound SSB via contiguous RecA binding.40 To simulate this sequential event, SSB was first added to interact with the substrate 5′ds30-ss80 for 10 min, then RecA was added for subsequent assembly and displacement.Following the above experimental design, the use of non-hydrolysable cofactor ATPγS, that only stimulates ATP binding,59 leads to a dramatic alteration in the protein distribution pattern (Fig. 8Bi, iii, and v, and Ci, iii, and v). The pattern of the SSB-unprotected dsDNA segment (Fig. 8Bi and Ci) is converted to the pattern of the protected dsDNA segment by RecA assembly (Fig. 8Bv and Cv). This alteration indicates the occurrence of the displacement of SSB binding by cooperative RecA assembly (Fig. 8Di). Thus, in the absence of RecA, SSB alone partly protects the single-stranded segments, but largely fails to protect dsDNA segments. Addition of recombinase RecA to the mixed solution of SSB and the joint DNA substrate (5′ds30-ss80) promotes the protection of both single-stranded and double-stranded segments. It may be noted that this protection pattern is similar to that generated by cooperative RecA assembly on the joint DNA substrate (Fig. 8Biii and Ciii) as stimulated by ATPγS. Through this displacement, cooperative RecA nucleofilaments are formed (Fig. 8Di) in agreement with previous reports.61,62 Under similar conditions (stimulated by nonhydrolysable ATPγS), it was found using smFRET that SSB was displaced from DNA by RecA.61,62
The use of physiological cofactor ATP allows the observation of a characteristic pattern of short protected-fragments contributed by ATP hydrolysis-impaired RecA assembly upon the sequential addition of SSB and RecA to the solution of the joint DNA substrate (Fig. 8Cvi and Dii). Under these conditions, ATP promotes binding of assembled RecA to ssDNA and ATP hydrolysis. Of note, ADP, the ATP hydrolytic product, stimulates the dissociation of assembled RecA from the RecA nucleofilaments,63,64 which leads to the formation of the unsaturated RecA nucleofilaments.38 Consistently, as shown by the line stacking (Fig. 8Cvi), short protected-DNA fragments (<30 nt long, 25/94) were observed. This is suggestive of the formation of characteristic low-density RecA nucleofilaments that possess long un-occluded segments (Fig. 8Cvi). This short-fragment characteristic pattern can be clearly observed from RecA alone (Fig. 8Civ) but rarely from SSB alone (Fig. 8Ci). On the other hand, an increase in the fully protected DNA molecule was also observed (18/94, Fig. 8Cvi). As reported in a previous study,61 SSB assists the elongation of RecA nucleofilaments through the melting of an expected secondary conformation. However, the tested DNA substrate does not have any stable secondary conformation (ESI Fig. S1†). Therefore, it appears more rational to propose that the co-binding of RecA and SSB would fully protect the DNA substrate. This did not receive confirmation from SPDFMS measurement. However, the observation of a tertiary complex between (RecA)n–(SSB)1–DNA (n, undefined number) by advanced capillary electrophoresis-laser-induced fluorescence (CE-LIF) analysis (ESI Fig. S3†) is highly supportive of this proposal.
The increase of SSB tetramer concentration from 25 nM (Fig. 8Ci) to 50 nM (Fig. 8Cii and vii) was found to fully protect more than 60% of substrate molecules, including both dsDNA and ssDNA segments (Fig. 8Cii and vii). One possibility is that high concentration of SSB may induce the change of SSB–ssDNA binding mode from (SSB)65 to (SSB)35. If so, the 80 nt ssDNA tail of the 5'ds30-ss80 substrate could accommodate the dual (SSB)35 binding mode. Noteworthily, the cooperative binding mode (SSB)35 limits the dynamic binding characteristic of single SSB on ssDNA,65 providing an enhanced DNA protection. In order to challenge this hypothesis, CE-LIF analysis was performed with the aim of assessing the stoichiometry of distinct SSB–ssDNA complexes. Through the reaction of the joint DNA substrate with SSB alone, CE-LIF analysis showed the predominance of the (SSB)65-related 1![[thin space (1/6-em)]](https://www.rsc.org/images/entities/char_2009.gif) :
:![[thin space (1/6-em)]](https://www.rsc.org/images/entities/char_2009.gif) 1 SSB–DNA complex over the minor (SSB)35-related 2
1 SSB–DNA complex over the minor (SSB)35-related 2![[thin space (1/6-em)]](https://www.rsc.org/images/entities/char_2009.gif) :
:![[thin space (1/6-em)]](https://www.rsc.org/images/entities/char_2009.gif) 1 SSB–DNA complex (ESI Fig. S4†). Upon further addition of 1.0 mM ATP and 3.0 μM RecA, the full protection pattern of SSB binding was found to be largely preserved (Fig. 8Bv). Meanwhile, CE-LIF analysis is also supportive of the predominance of the cooperative dual (SSB)35 binding mode (ESI Fig. S4†). Therefore, under these conditions, RecA assembly cannot displace SSB from the DNA substrate as a result of diminished cooperativity of RecA assembly (Fig. 8Biv) and increased cooperativity of SSB binding (Fig. 8Bvii and Diii). Noteworthily, even under such harsh conditions, a few short protected fragments were still observed (highlighted in Fig. 8Cvii).
1 SSB–DNA complex (ESI Fig. S4†). Upon further addition of 1.0 mM ATP and 3.0 μM RecA, the full protection pattern of SSB binding was found to be largely preserved (Fig. 8Bv). Meanwhile, CE-LIF analysis is also supportive of the predominance of the cooperative dual (SSB)35 binding mode (ESI Fig. S4†). Therefore, under these conditions, RecA assembly cannot displace SSB from the DNA substrate as a result of diminished cooperativity of RecA assembly (Fig. 8Biv) and increased cooperativity of SSB binding (Fig. 8Bvii and Diii). Noteworthily, even under such harsh conditions, a few short protected fragments were still observed (highlighted in Fig. 8Cvii).
Discussion
High-resolution cutting of unprotected DNA
High-resolution cutting of the protein-unbound DNA segment is the first and critical step in SPDFMS assay. Four conditions should be fulfilled by the chosen nuclease: (1) selective cut of unprotected DNA but not of protein-occluded DNA; (2) DNA has to be cut rapidly. In general, most protein–DNA complexes are labile in vitro and lose their activity within minutes to hours.62,66,67 Rapid cutting would allow completion of the process prior to activity loss or alteration of PDIs; (3) efficient cutting of long DNA into extremely short oligonucleotides is necessary. The shorter the cut oligonucleotide, higher resolution for discrimination of the protected and unprotected segments; (4) the target protein–DNA interactions should not be significantly perturbed. It was found that the supernuclease can satisfy all the four premises. Importantly, supernuclease cutting was found to allow the observation of two well-known (SSB)65 and (SSB)35 binding modes. This is suggestive of cutting of unprotected DNA at near single-nucleotide resolution. Moreover, the observation also proves that the cutting does not affect SSB–DNA binding significantly. In contrast, DNase I that is routinely used in footprinting assay displays a preferential cutting on dsDNA and also lower cutting efficiency.SPDFMS assay
The development of the new SPDFMS assay is aimed at facilitating the assessment of the distribution and assembly of the interacting proteins on DNA. This is achieved by combining high-resolution cutting and sequencing of single protected-DNA fragment molecules. Through the evaluation of the generated template DNA recovery, the reported data clearly show an excellent reproducibility (ESI Fig. S5†), what is suggestive of the reliability of the new assay. The footprinting assays can also provide relevant information on hypersensitive sites.25 However, the hypersensitive sites must be distinguished among a set of irrelevant nicks. The establishment of the SPDFMS assay allows access for the first time to comprehensive information on dynamic binding, distribution (caused by sliding or diffusion), and assembly on DNA in aqueous solutions. Therefore, SPDFMS assay is not only an extension of footprint analysis, but also provides novel analytical possibilities. Benefiting from this unique assay, a plethora of new information on SSB binding and recombinase RecA assembly was made available (see the following Discussion sections). Moreover, use of this technology also allows investigation of a sequential interaction event, e.g., the displacement of SSB binding by ATP binding – stimulated cooperative RecA assembly on DNA. Noteworthily, we can measure the length of single RecA nucleofilaments. At present, no method can be directly used to measure the length of RecA nucleofilaments.Although single-molecule based fluorescence and force technologies are bringing tremendous progress in protein–DNA interactions, immobilization of one of the binding partners (e.g., DNA) is required. This restricts the occurrence of protein–DNA interactions near heterogeneous and active solid–liquid interfaces, which may have nonspecific adsorption sites to bind interacting DNA or protein and thus alter the tested PDIs. Of note, single molecule force microscopy measures the mechanical properties of protein–DNA interactions. Such measurements need to be done with the assistance of very long DNA (at the scale of micrometers). The established SPDFMS assay does not require any modification of DNA and protein and can be extensively applied to the study of protein–DNA interactions that generally occur in physiologically relevant aqueous solutions. The measurable length of DNA using the established SDFMS assay is determined by the read length of modern sequencing technology. In our case, the length of the tested DNA substrate (80 nt + 30 bp long) is about 33 nm. Regarding every three nucleotides per RecA monomer binding, we are able to show the cooperative assembly of 35 RecA monomers on one joint DNA substrate. Evidently, canonical FRET cannot be applied for such analytical tasks due to its distance limit (≤10 nm). There are other benefits, such as the accurate sequencing of the protected-DNA fragments, which permits for the first time gaining panoramic and in-depth insights into the complicated interactions of SSB, RecA and DNA within a distance of 10–100 nm.
The protection of DNA by SSB binding
Application of the SPDFMS assay indicates that SSB binding and wrapping selectively protects the single-stranded segment but not the double-stranded segment. This is consistent with a previous report.36 Surprisingly, it was found that at an increased tetramer concentration (50 nM) SSB can protect both single-stranded and double-stranded segments. It was reported that the SSB tetramer displayed a 300-fold weaker interaction with double stranded DNA compared to single-stranded DNA.68 Our observation on the protection of both single-stranded and double-stranded segments of a joint DNA substrate by SSB indicates that the presence of a single-stranded DNA segment may facilitate the interaction of the joint double-stranded segment with SSB.Interestingly, we observed a terminal barrier to prevent SSB binding to both termini (5′ and 3′). Raghunathan suggested that the (SSB)56 mode has the 3′ terminal ssDNA end unraveled to the nearest hotspot.69 This hypothesized picture coincides with our observation (Fig. 6C). Suksombat et al. further extended the picture of the unravelled 3′ terminal ssDNA for other SSB binding states, (SSB)35 and (SSB)17.70 By single-molecule force and fluorescence spectroscopy, they have shown that the ssDNA exhibits discrete wrapping states.70 However, although the crystal structure and single molecule FRET and force technologies have been used, supportive data are still lacking. By using SPDFMS assay, we provide direct evidence and support that the termini of ssDNA are unravelled (Fig. 6C). This observation also explains a previous study, showing that SSB diffuses between the two termini.62
The regulation of RecA assembly on DNA by ATP hydrolysis
As shown in Fig. 7, stimulation of ATP binding only triggers the protection of both single-stranded and double-stranded segments by cooperative RecA assembly. This received confirmation from the use of unhydrolysable ATP analogous ATPγS. These results support that ATP binding enhances the cooperativity of RecA assembly on DNA to form active RecA nucleofilaments. Furthermore, the protection of single-stranded segments was supported in the presence of physiologically relevant ATP. Compared to ATPγS, the presence of ATP can stimulate the ATP hydrolytic activity of RecA nucleofilaments. Essentially, our data provide direct and compelling evidence that ATP hydrolysis would eliminate ATP binding-stimulated cooperative assembly of RecA on double-stranded DNA. According to a recent study,71 this would prevent the formation of double-stranded DNA-related toxic complexes.Application of SPDFMS assay allows direct measurement of the length of individual RecA nucleofilaments. Thus, a predominant stoichiometry of 5–7 RecA monomers per nucleofilament was estimated. These results are consistent with a recent study showing the predominance of low-density RecA–ssDNA filaments.38 Importantly, here for the first time a direct measurement of the stoichiometry of RecA–ssDNA filaments is provided. It was reported in a previous in vitro study that a curled conformation in ssDNA is required for homology search.72 From our results, it is reasonable to propose that the ATP hydrolytic activity would limit the presence of too many active but rigid RecA nucleofilaments and increase DNA curling to facilitate the subsequent homology search.
Although it is reported that RecA assembly can replace SSB binding from bound DNA,61 previous experiments were mainly performed using nonhydrolysable ATP analogs. It may be pointed out that in the present work such replacement was also observed using nonhydrolysable ATPγS. Surprisingly, it was difficult to observe the displacement of SSB on DNA by RecA assembly by the use of physiologically relevant ATP. This can be explained by the diminished cooperativity of RecA assembly and the increased cooperativity of SSB binding at adequate concentrations (Fig. 8Bv and Diii). Our observation of the nonreplacement of SSB binding by RecA assembly on DNA under physiological conditions is in agreement with an in vivo scenario, in which SSB binding can be displaced assisted by RecFOR.61,73
Accessible sites
E. coli SSB can control the accessible sites of single-stranded DNA by high affinity binding.62 By analysing line stacking figures (Fig. 6B), we found that the un-occluded regions could be observed at both 5′- and 3′-flanks of the single-stranded region of the joint substrate. Essentially, the un-occluded regions of SSB on DNA provide accessible sites to initiate RecA assembly. Therefore, RecA assembly can be initiated from both 5′ and 3′ flanks of the single-stranded region of the substrate to displace SSB binding (Fig. 8Ci, iii and v). In addition to its primary role to protect the ssDNA segment, E. coli SSB also plays a secondary major role in direct interactions with a large number of 14 proteins, e.g., DNA polymerase II, III, and V, primase, RecQ, RecO, RecJ, RecG, PriA, PriB, exonuclease I and IX, Uracil DNA glycosylase, and phage N4 RNA polymerase.74 These accessible sites are available for such potentially interacting proteins. Notably, for pure single-stranded DNA substrates with a lack of joint double-stranded segment, preferential binding of SSB was observed on the 5′-flank of the DNA substrates (Fig. 4 and 5).In our SPDFMS strategy, to accurately map the distribution and assembly of one protein, which lacks a specific DNA-binding sequence motif, a minimum of ∼100 clones could be used for Sanger sequencing. This may not be very economical. However, our assay does not require the knowledge or use of sophisticated equipment. On the other hand, if the proteins display specific binding motifs against DNA, which can be found in many instances, 10 or less clones can be used and thus is very economical. Taken together, our assay has its own goodness and broad range utility.
Importantly, we showed the fundamental concept of the high-resolution cutting of unprotected DNA fragments, which can be combined with any DNA sequencing technology (next generation sequencing, nanopore sequencing and real-time single molecule sequencing). This could further improve throughput and utility. For example, Ingolia et al. combined Rnase I cutting and deep sequencing to perform ribosomal footprinting.75 By this interesting technology, they observed uniform ∼28 nucleotide protected fragments of mRNA templates, indicating the exact position of translating ribosomes. It is possible to combine our technique with deep sequencing and expects to improve assay throughput but with a sacrifice in read length, which is limited by deep sequencing itself. On the other hand, Callahan et al. utilized the SMRTbell library and PacBio circular consensus sequencing to measure the full length of bacterial 16S RNA.76 By that targeted-amplicon high-throughput sequencing strategy, the sequencing throughput also increases greatly. Thus, another option is to combine our approach with the targeted-amplicon high-throughput sequencing strategy.
In summary, we have developed an unprecedented precise method for sequencing single protected-DNA fragments at near single nucleotide resolution. The development of the assay enables us to measure the distribution and the assembly of interacting proteins on DNA. The assay relies on the read length of DNA sequencing and is not restricted by optical limits. Essentially, this innovative assay provides new opportunities to gain insightful information on complex functions and metabolism of DNA. Moreover, this assay offers the possibility to elucidate the displacement of bound proteins on DNA. Collectively, further application of the method will shed new light on a multitude of protein–DNA interactions.
Conflicts of interest
There are no conflicts to declare.Acknowledgements
This work is supported by the National Natural Science Foundation of China [21927807, 91743201, 21621064, 22021003]; the Key Research Program of Frontier Sciences, CAS [QYZDJ-SSWDQC017]; the K. C. Wong Education Foundation, and the Sanming Project of Medicine in Shenzhen [No. SZM201811070]. Funding for open access charge: the National Natural Science Foundation of China. Thanks to Dr Jean Cade for reading through the manuscript.Notes and references
- G. D. Stormo and Y. Zhao, Nat. Rev. Genet., 2010, 11, 751–760 CrossRef CAS.
- M. O'Donnell, L. Langston and B. Stillman, Cold Spring Harbor Perspect. Biol., 2013, 5, a010108 Search PubMed.
- J. A. Goodrich and R. Tjian, Cell, 1994, 77, 145–156 CrossRef CAS.
- M. Jinek, K. Chylinski, I. Fonfara, M. Hauer, J. A. Doudna and E. Charpentier, Science, 2012, 337, 816–821 CrossRef CAS.
- S. H. Sternberg, S. Redding, M. Jinek, E. C. Greene and J. A. Doudna, Nature, 2014, 507, 62–67 CrossRef CAS.
- P. A. Jeggo, L. H. Pearl and A. M. Carr, Nat. Rev. Cancer, 2016, 16, 35–42 CrossRef CAS.
- K. D. Rasmussen and K. Helin, Genes Dev., 2016, 30, 733–750 CrossRef CAS.
- R. Tillotson, J. Selfridge, M. V. Koerner, K. K. E. Gadalla, J. Guy, D. De Sousa, R. D. Hector, S. R. Cobb and A. Bird, Nature, 2017, 550, 398–401 CrossRef CAS.
- Z. Chen, H. Yang and N. P. Pavletich, Nature, 2008, 453, 489–494 CrossRef CAS.
- F. Song, P. Chen, D. Sun, M. Wang, L. Dong, D. Liang, R. M. Xu, P. Zhu and G. Li, Science, 2014, 344, 376–380 CrossRef CAS.
- D. Zhang, M. Lu and H. Wang, J. Am. Chem. Soc., 2011, 133, 9188–9191 CrossRef CAS.
- S. H. Kim, K. Ragunathan, J. Park, C. Joo, D. Kim and T. Ha, J. Am. Chem. Soc., 2014, 136, 14796–14800 CrossRef CAS.
- K. C. Neuman and A. Nagy, Nat. Methods, 2008, 5, 491–505 CrossRef CAS.
- M. Berezovski and S. N. Krylov, J. Am. Chem. Soc., 2003, 125, 13451–13454 CrossRef CAS.
- J. Majka and C. Speck, Adv. Biochem. Eng./Biotechnol., 2007, 104, 13–36 CrossRef CAS.
- G. M. Perez-Howard, P. A. Weil and J. M. Beechem, Biochem, 1995, 34, 8005–8017 CrossRef CAS.
- A. T. H. Le, S. M. Krylova, M. Kanoatov, S. Desai and S. N. Krylov, Angew. Chem., Int. Ed., 2019, 58, 2739–2743 CrossRef CAS.
- H. Peng, X.-F. Li, H. Zhang and X. C. Le, Nat. Commun., 2017, 8, 14378 CrossRef.
- I. German, D. D. Buchanan and R. T. Kennedy, Anal. Chem., 1998, 70, 4540–4545 CrossRef CAS.
- T. M. Lohman, L. B. Overman, M. E. Ferrari and A. G. Kozlov, Biochem, 1996, 35, 5272–5279 CrossRef CAS.
- J. C. Bell, J. L. Plank, C. C. Dombrowski and S. C. Kowalczykowski, Nature, 2012, 491, 274–278 CrossRef CAS.
- N. Li, J. Wang, K. Ma, L. Liang, L. Mi, W. Huang, X. Ma, Z. Wang, W. Zheng, L. Xu, J. H. Chen and Z. Yu, Nucleic Acids Res., 2019, 47, e86 CrossRef CAS.
- H. Sánchez, M. W. Paul, M. Grosbart, S. E. van Rossum-Fikkert, J. H. G. Lebbink, R. Kanaar, A. B. Houtsmuller and C. Wyman, Nucleic Acids Res., 2017, 45, 4507–4518 CrossRef.
- G. G. Kneale, DNA-protein interactions: principles and protocols, Humana Press, 2009 Search PubMed.
- T. S. Furey, Nat. Rev. Genet., 2012, 13, 840–852 CrossRef CAS.
- L. Song and G. E. Crawford, Cold Spring Harbour Protoc., 2010, 2010, pdb.prot5384 Search PubMed.
- D. Suck, J. Mol. Recognit., 1994, 7, 65–70 CrossRef CAS.
- V. Brabec, S. E. Howson, R. A. Kaner, R. M. Lord, J. Malina, R. M. Phillips, Q. M. A. Abdallah, P. C. McGowan, A. Rodger and P. Scott, Chem. Sci., 2013, 4, 4407–4416 RSC.
- D. J. Galas and A. Schmitz, Nucleic Acids Res., 1978, 5, 3157–3170 CrossRef CAS.
- M. J. Jacobs and K. Blank, Chem. Sci., 2014, 5, 1680–1697 RSC.
- I. Heller, G. Sitters, O. D. Broekmans, G. Farge, C. Menges, W. Wende, S. W. Hell, E. J. Peterman and G. J. Wuite, Nat. Methods, 2013, 10, 910–916 CrossRef CAS.
- F. Liu, M. Yang, W. Song, X. Luo, R. Tang, Z. Duan, W. Kang, S. Xie, Q. Liu, C. Lei, Y. Huang, Z. Nie and S. Yao, Chem. Sci., 2020, 11, 2993–2998 RSC.
- A. Plochowietz, A. H. El-Sagheer, T. Brown and A. N. Kapanidis, Chem. Sci., 2016, 7, 4418–4422 RSC.
- Z. Qi, S. Redding, J. Y. Lee, B. Gibb, Y. Kwon, H. Niu, W. A. Gaines, P. Sung and E. C. Greene, Cell, 2015, 160, 856–869 CrossRef CAS.
- C. J. Ma, J. B. Steinfeld and E. C. Greene, Methods Enzymol., 2017, 582, 193–219 CAS.
- O. Yang and T. Ha, Methods Enzymol., 2018, 600, 463–477 CAS.
- C. Loverdo, O. Bénichou, R. Voituriez, A. Biebricher, I. Bonnet and P. Desbiolles, Phys. Rev. Lett., 2009, 102, 188101 CrossRef CAS.
- B. Zhao, D. Zhang, C. Li, Z. Yuan, F. Yu, S. Zhong, G. Jiang, Y. G. Yang, X. C. Le, M. Weinfeld, P. Zhu and H. Wang, Cell Discovery, 2017, 3, 16053 CrossRef CAS.
- G. M. Harami, Z. J. Kovács, R. Pancsa, J. Pálinkás, V. Baráth, K. Tárnok, A. Málnási-Csizmadia and M. Kovács, Proc. Natl. Acad. Sci. U. S. A., 2020, 117, 26206–26217 CrossRef CAS.
- J. C. Bell and S. C. Kowalczykowski, Annu. Rev. Biochem., 2016, 85, 193–226 CrossRef CAS.
- B. M. Byrne and G. G. Oakley, Semin. Cell Dev. Biol., 2019, 86, 112–120 CrossRef CAS.
- N. Doumpas, F. Lampart, M. D. Robinson, A. Lentini, C. E. Nestor, C. Cantù and K. Basler, EMBO J., 2019, 38, e98873 CrossRef.
- Y. Gao and W. Yang, Curr. Opin. Struct. Biol., 2019, 61, 25–32 CrossRef.
- M. Baibakov, S. Patra, J. B. Claude, A. Moreau, J. Lumeau and J. Wenger, ACS Nano, 2019, 13, 8469–8480 CrossRef CAS.
- H. Bui, S. A. Díaz, J. Fontana, M. Chiriboga, R. Veneziano and I. L. Medintz, Adv. Opt. Mater., 2019, 7, 1900562 CrossRef.
- W. Lai, C. Lyu and H. Wang, Anal. Chem., 2018, 90, 6859–6866 CrossRef CAS.
- F. Kouzine, D. Wojtowicz, L. Baranello, A. Yamane, S. Nelson, W. Resch, K. R. Kieffer-Kwon, C. J. Benham, R. Casellas, T. M. Przytycka and D. Levens, Cell Syst., 2017, 4, 344–356 CrossRef CAS.
- M. Wakasugi and A. Sancar, Proc. Natl. Acad. Sci. U. S. A., 1998, 95, 6669–6674 CrossRef CAS.
- D. S. Gilmour and R. Fan, Methods, 2009, 48, 368–374 CrossRef CAS.
- S. Spicuglia, S. Kumar, L. Chasson, D. Payet-Bornet and P. Ferrier, J. Biochem. Biophys. Methods, 2004, 59, 189–194 CrossRef CAS.
- O. Morozova and M. A. Marra, Genomics, 2008, 92, 255–264 CrossRef CAS.
- M. Nestle and W. K. Roberts, J. Biol. Chem., 1969, 244, 5219–5225 CrossRef CAS.
- P. Janning, W. Schrader and M. Linscheid, Rapid Commun. Mass Spectrom., 1994, 8, 1035–1040 CrossRef CAS.
- F. Chen, B. Gülbakan and R. Zenobi, Chem. Sci., 2013, 4, 4071–4078 RSC.
- J. C. Bell, B. Liu and S. C. Kowalczykowski, Elife, 2015, 4, e08646 CrossRef.
- W. Bujalowski and T. M. Lohman, Biochemistry, 1986, 25, 7799–7802 CrossRef CAS.
- W. Bujalowski, L. B. Overman and T. M. Lohman, J. Biol. Chem., 1988, 263, 4629–4640 CrossRef CAS.
- L. Ranjha, S. M. Howard and P. Cejka, Chromosoma, 2018, 127, 187–214 CrossRef CAS.
- G. M. Weinstock, K. McEntee and I. R. Lehman, J. Biol. Chem., 1981, 256, 8829–8834 CrossRef CAS.
- J. C. Bell and S. C. Kowalczykowski, Trends Biochem. Sci., 2016, 41, 491–507 CrossRef CAS.
- R. Roy, A. G. Kozlov, T. M. Lohman and T. Ha, Nature, 2009, 461, 1092–1097 CrossRef CAS.
- R. Zhou, A. G. Kozlov, R. Roy, J. Zhang, S. Korolev, T. M. Lohman and T. Ha, Cell, 2011, 146, 222–232 CrossRef CAS.
- R. M. Story and T. A. Steitz, Nature, 1992, 355, 374–376 CrossRef CAS.
- E. Del Val, W. Nasser, H. Abaibou and S. Reverchon, Biochem. Soc. Trans., 2019, 47, 1511–1531 CrossRef CAS.
- R. Roy, A. G. Kozlov, T. M. Lohman and T. Ha, J. Mol. Biol., 2007, 369, 1244–1257 CrossRef CAS.
- J. J. Parmar, D. Das and R. Padinhateeri, Nucleic Acids Res., 2016, 44, 1630–1641 CrossRef.
- H. Wang, M. Lu, M. S. Tang, B. Van Houten, J. B. Ross, M. Weinfeld and X. C. Le, Proc. Natl. Acad. Sci. U. S. A., 2009, 106, 12849–12854 CrossRef CAS.
- F. Grosse, H. P. Nasheuer, S. Scholtissek and U. Schomburg, Eur. J. Biochem., 1986, 160, 459–467 CrossRef CAS.
- S. Raghunathan, A. G. Kozlov, T. M. Lohman and G. Waksman, Nat. Struct. Biol., 2000, 7, 648–652 CrossRef CAS.
- S. Suksombat, R. Khafizov, A. G. Kozlov, T. M. Lohman and Y. R. Chemla, eLife, 2015, 4, e08193 CrossRef.
- D. V. Gataulin, J. N. Carey, J. Li, P. Shah, J. T. Grubb and d D. K. Bishop, Nucleic Acids Res., 2018, 46, 9510–9523 CrossRef CAS.
- A. L. Forget and S. C. Kowalczykowski, Nature, 2012, 482, 423–427 CrossRef CAS.
- J. Inoue, T. Nagae, M. Mishima, Y. Ito, T. Shibata and T. Mikawa, J. Biol. Chem., 2011, 286, 6720–6732 CrossRef CAS.
- R. D. Shereda, A. G. Kozlov, T. M. Lohman, M. M. Cox and J. L. Keck, Crit. Rev. Biochem. Mol. Biol., 2008, 43, 289–318 CrossRef CAS.
- N. T. Ingolia, S. Ghaemmaghami, J. R. S. Newman and J. S. Weissman, Science, 2009, 324, 218 CrossRef CAS.
- B. J. Callahan, J. Wong, C. Heiner, S. Oh, C. M. Theriot, A. S. Gulati, S. K. McGill and M. K. Dougherty, Nucleic Acids Res., 2019, 47, e103 CrossRef CAS.
Footnote |
| † Electronic supplementary information (ESI) available. See DOI: 10.1039/d0sc01742f |
| This journal is © The Royal Society of Chemistry 2021 |

