 Open Access Article
Experimental and theoretical evidence of charge transfer in multi-component alloys – how chemical interactions reduce atomic size mismatch†
Luis
Casillas-Trujillo
a,
Barbara
Osinger
 b,
Rebecka
Lindblad
 b,
Dennis
Karlsson
b,
Alexei I.
Abrikosov
b,
Dennis
Karlsson
b,
Alexei I.
Abrikosov
 c,
Stefan
Fritze
b,
Kristina
von Fieandt
 b,
Björn
Alling
a,
Ingrid
Hotz
c,
Ulf
Jansson
b,
Igor A.
Abrikosov
b,
Björn
Alling
a,
Ingrid
Hotz
c,
Ulf
Jansson
b,
Igor A.
Abrikosov
 ad and
Erik
Lewin
 *b
*b
aDepartment of Physics, Chemistry and Biology (IFM), Linköping University, SE-581 83 Linköping, Sweden
bInorganic Chemistry, Department of Chemistry – Ångström Laboratory, Uppsala University, Box 538, SE-751 21 Uppsala, Sweden. E-mail: erik.lewin@kemi.uu.se
cDepartment of Science and Technology, Linköping University, SE-581 83 Norrköping, Sweden
dMaterials Modelling and Development Laboratory, National University of Science and Technology “MISIS”, Moscow 119049, Russia
First published on 28th May 2021
Abstract
Ab initio simulations of a multi-component alloy using density functional theory (DFT) were combined with experiments on thin films of the same material using X-ray photoelectron spectroscopy (XPS) to study the connection between the electronic and atomic structures of multi-component alloys. The DFT simulations were performed on an equimolar HfNbTiVZr multi-component alloy. Structure and charge transfer were evaluated using relaxed, non-relaxed, as well as elemental reference structures. The use of a fixed sphere size model allowed quantification of charge transfer, and separation into different contributions. The charge transfer was generally found to follow electronegativity trends and results in a reduced size mismatch between the elements, and thus causes a considerable reduction of the lattice distortions compared to a traditional assumption based on tabulated atomic radii. A calculation of the average deviation from the average radius (i.e. the so-called δ-parameter) based on the atomic Voronoi volumes gave a reduction of δ from ca. 6% (using the volumes in elemental reference phases) to ca. 2% (using the volumes in the relaxed multi-component alloy phase). The reliability of the theoretical results was confirmed by XPS measurements of a Hf22Nb19Ti18V19Zr21 thin film deposited by sputter deposition. The experimentally observed core level binding energy shifts (CLS), as well as peak broadening due to a range of chemical surroundings, for each element showed good agreement with the calculated DFT values. The single solid solution phase of the sample was confirmed by X-ray diffraction (XRD) and transmission electron microscopy (TEM) including energy dispersive spectroscopy (EDS) with nm-resolution. These observations show that the HfNbTiVZr solid solution phase is non-ideal, and that chemical bonding plays an important part in the structure formation, and presumably also in the properties. Our conclusions should be transferable to other multi-component alloy systems, as well as some other multi-component material systems, and open up interesting possibilities for the design of material properties via the electronic structure and controlled charge transfer between selected metallic elements in the materials.
Introduction
Multi-component materials, and in particular alloys, are a group of materials that have generated a huge amount of interest over the past 15 years. They are generally understood to be materials that have at least five major components. The interest was sparked by the concept of high entropy alloys (HEAs), which was introduced in 2004 in two separate papers by Cantor et al.1 and Yeh et al.2 Cantor and co-workers studied cast samples of equiatomic alloys, and identified a single-phase material with a close-packed cubic (ccp) structure; Yeh and co-workers published a study on several arc-melted and annealed multi-component alloys, where they observed single-phase ccp or bcc (body-centred cubic) alloys. The formation of a single-phase alloy was explained by a stabilising effect by the entropy of mixing and the concept of high entropy alloys was introduced as a design route in metallurgy. The term high entropy alloys (and materials) is under some debate, concerning definitions, as well as the mechanisms behind the formation of solid solution phases where both entropy and kinetics are important. These points are well summarised in the review by Miracle and Senkov.3 In the following, the more general term multi-component alloys will be used for alloys with five or more principal components.One reason for the continued interest in multi-component materials is that many of them have attractive properties such as excellent high-temperature strength, high oxidation resistance, good corrosion properties, high radiation resistance etc., as well as new possibilities to combine functional properties; and that they offer a seemingly endless compositional space for materials design. There are several recent and substantial reviews published on the general concepts of high-entropy materials, and their properties, see e.g.ref. 3–7.
Several empirical design rules have been formulated to predict the formation of multi-component solid solution phases. One factor which has been shown to be important is the differences in atom radii between the elements in the multi-component phase. Too large size differences cannot be accommodated in a single lattice. The size difference is commonly quantified by the average deviation from the average atomic radius of the included metals, denoted as the δ-parameter and calculated as:
 | (1) |
![[r with combining macron]](https://www.rsc.org/images/entities/i_char_0072_0304.gif) is the concentration weighted average radius of all included elements. Empirically, it has been found that δ needs to be smaller than ca. 6.4% for a solid solution phase to form.8 Multi-component alloys with a higher δ-value tend to be amorphous. This rule is clearly related to both the traditional Hume–Rothery's rules for substitutional solid solutions in alloys,9 and the Inoue rules for the formation of metallic glasses.10 For the well-known so-called Cantor alloy the δ-value is 3.42%, while the here studied HfNbTiVZr with equimolar metal ratios yields a δ-value of 5.72%,‡ indicating a large mismatch of metallic radii.
is the concentration weighted average radius of all included elements. Empirically, it has been found that δ needs to be smaller than ca. 6.4% for a solid solution phase to form.8 Multi-component alloys with a higher δ-value tend to be amorphous. This rule is clearly related to both the traditional Hume–Rothery's rules for substitutional solid solutions in alloys,9 and the Inoue rules for the formation of metallic glasses.10 For the well-known so-called Cantor alloy the δ-value is 3.42%, while the here studied HfNbTiVZr with equimolar metal ratios yields a δ-value of 5.72%,‡ indicating a large mismatch of metallic radii.
In the literature of multi-component alloys, there are many references to a local lattice distortion, caused by differences in atomic radii of the included elements, and its suggested effect on mechanical and other properties. The value of the δ-parameter is commonly also used as a measure of the assumed local lattice distortion. Direct evidence of a local lattice distortion is, however, sparse, and it is technically difficult to attain, see e.g. the recent review by Owen.11 Actually, applying a hard sphere model is an over-simplification of the structure of alloys that ignores the chemistry: also in metallic alloys there is bonding and charge transfer between the elements. Nevertheless, there are local distortions where atoms are not located at the ideal lattice points of the underlying crystal structure (i.e. displacive disorder). Such local lattice distortions are clearly observed in ab initio simulations when structural relaxation is allowed. For example, it has recently been demonstrated that the distortions could be particularly large in bcc multi-component alloys and contribute to their stabilisation.12 Also, in a recent series of publications, Tong et al. investigated the local lattice distortions of multi-component alloys using experimental scattering methods, yielding pair distribution functions (PDF), and ab initio materials simulations.13–15 Their two main results are that there is a local lattice distortion, but it is significantly smaller than predicted from a hard sphere model; and that charge transfer between the atoms is responsible for reducing the size differences between the different elements and thus yielding a lattice distortion that is smaller than predicted from a hard sphere model. It is also noted that among the studied multi-component alloys, alloys containing Hf and Zr have larger distortions than the other alloys. Tong et al. however do not present any direct experimental evidence of the suggested charge transfer; their conclusions are based on the ab initio simulations.
An experimental method which is commonly used to evaluate chemical bonding and charge transfer in solid materials is X-ray photoelectron spectroscopy (XPS). The exact core level binding energy will be affected by the chemical surrounding of the photoionised atom, and thus the charge transfer between neighbouring atoms. However, this dependency is not simple and although a rule of thumb based on electronegativity can provide insights in many cases a more thorough approach is needed to attain reliable data. This must include simulation of the electronic state of the material, both in the initial and final state (i.e. before and after photo ionisation). Hence, ab initio simulations are required to predict XPS core level shifts.16
Interestingly, there is not much literature on multi-component alloys reporting XPS core levels. In a recent publication Xu et al. studied XPS core level shifts systematically for multi-component alloy nanoparticles based on group 6 to 11 transition metals.17 The main conclusion was that for the studied alloys there were core level shifts in the multicomponent alloys, compared to elemental literature references, thus indicating a charge transfer. The observed shifts were found to be consistent with the electronegativity rule of thumb. These conclusions were also supported by ab initio materials modelling of binary alloys, and the results were discussed in the view of fundamental understanding of bonding in the multi-component alloys, and possibilities to design the electronic structure. Some interesting data have also been published in studies focussing on the reactive sputter deposition from metallic targets in a nitrogen containing process gas to attain multi-component nitride coatings. In this literature XPS core level binding energies of multi-component alloys that differ from elemental reference positions have been reported.18,19 There is thus some experimental evidence in the literature for a charge transfer between different elements in multi-component alloys. This has however not been connected to the structure of the material, and in particular not to the concept of local lattice distortion.
The present study has investigated the matter of charge transfer, connected to the concept of local lattice distortion and XPS core level shifts in more detail, employing a combination of theory and experiment: detailed DFT simulations of relaxed and non-relaxed multi-component alloys and high-resolution XPS to experimentally validate the suggested charge transfer and its effect on the atomic structure. The HfNbTiVZr system was chosen as a demonstrator system, as it is a known entropy-stabilised phase,20 which can be produced as thin films.21 Furthermore, the presence of Zr and Hf suggests that a (comparably) large distortion and charge transfer is expected,15 making the system suitable for further studies.
Methods
Theoretical methods
The HfNbTiVZr multi-component alloy was modelled using a bcc underlying crystal lattice, equimolar concentrations, and a 3 × 4 × 5 supercell with 120 atoms, i.e. 24 atoms of each element. The supercell was created using the special quasirandom structure method (SQS).26 The supercell was first optimised with respect to volume using a fixed atomic position. An equilibrium structure was obtained by relaxing the supercell, allowing atomic displacements and supercell volume change. Both relaxed and non-relaxed supercells were used to determine the displacements of the individual atoms from their ideal positions in the bcc structure. This was quantified by determining the pair distribution function (PDF) which gives the observed atomic distances; and the angular distribution function (ADF) which provides the distribution of observed angles (θ) between three atoms. The calculations were performed using the same system as in a previous study on HfNbTiVZr, where theoretical simulations were confirmed by experimental scattering data from bulk samples.27 In addition, the pure elements were modelled for comparison, simulating both room temperature stable phases (bcc for Nb and V, and hcp for Hf, Ti and Zr), as well as bcc structure for all the metals.
Experimental methods
A multi-component thin film sample was synthesised by non-reactive DC-magnetron sputtering using an ultra-high vacuum system, base pressure < 1 × 10⁻⁷ Pa (<1 × 10⁻⁹ mbar). The system was equipped with four 2′′ magnetrons in a confocal sputter-down configuration. Elemental targets of Hf, Ti, and V were used on three of the magnetrons. The fourth magnetron was equipped with a segmented target, composed of one-half Zr and one-half Nb. An Ar+ plasma was ignited at 0.4 Pa (4 × 10⁻³ mbar), using a 42 sccm Ar gas flow. Prior to the deposition, the single-crystal Si(001) substrates were cleaned in an ultrasonic bath, first in acetone followed by ethanol, each time for 5 minutes, and then dried in a N2(g) flow. The substrates were pre-heated to 275 °C for at least 60 min before the deposition, to minimise the temperature gradient. Deposition was carried out at this substrate temperature, and a dc bias of −50 V was applied.The deposited thin film was analysed with a number of techniques to ensure the presence of a single solid solution phase. The crystal structure was studied by X-ray diffraction (XRD) using Cu Kα radiation. A Bruker D8 advance diffractometer was used for symmetrical (θ/2θ) scans using Bragg–Brentano geometry and a Johansson monochromator to attain pure Cu Kα1 radiation. A Philips MRD X’Pert was used for grazing incidence (GI) scans and determination of in- and out-of-plane lattice parameters. GI scans were performed with an incidence angle of 2°, using a Göbel mirror as primary optics and parallel plate collimator of 0.27° divergence as secondary optics. For determination of the lattice parameters in different spatial directions point focus with capillary lens optics on the primary side; and a parallel plate collimator of 0.18° divergence with a flat graphite monochromator on the secondary side were used.
Transmission electron cross-section samples were prepared using the in situ lift out technique in a FEI Strata DB235 focused ion beam (FIB) instrument. The transmission electron microscopy (TEM) analysis was conducted on a FEI Titan Themis 200 kV, equipped with a Cs probe corrector and SuperX Energy dispersive spectroscopy (EDS) system. Analysis was mainly performed in scanning mode, using a high angle annular dark field (HAADF) detector. EDS analysis was performed to attain spatially resolved compositional data, and evaluated using the metal K-lines, and Bruker Esprit software.
Bulk metal reference samples were attained from the backside of used elemental sputter targets. These all had a claimed purity of 99.9% or higher, and were supplied by Plasmaterials (Hf and V) and Kurt J. Lesker (Zr, Nb and Ti).
The chemical environment of both elemental references and the multi-component thin film was studied with X-ray photoelectron spectroscopy (XPS) using a PHI Quantera II XPS scanning microprobe with Al Kα radiation (hv =1486.7 eV) and an electron take off angle of 45°. The spectrometer was calibrated against reference samples of Ag, Au and Cu according to ISO 15472.34 For the present samples the Fermi levels were also measured, and all align to zero within an uncertainty of ±0.05 eV. Compositional analysis was performed using sputter depth-profiles with 1 keV Ar+ etching, and custom sensitivity factors calibrated using data from Rutherford backscattering (RBS) on similar samples.
The core levels were investigated by high-resolution XPS which was obtained after sputter etching with 4 keV Ar+ for 6 minutes to remove the surface oxide layer. For these analyses an X-ray spot size with a diameter of 50 μm and a low pass energy (6.5 eV) was used to attain the highest possible spectral resolution. This resulted in a full width half maximum (fwhm) for the Hf 4f7/2 of 0.29 eV, but also very long measurement times: about 2 h for each elemental reference, and 9 h for the multi-component alloy sample. These long measurement times, combined with a vacuum level of 2 × 10⁻⁶ Pa (2 × 10⁻⁸ mbar), unfortunately resulted in some in vacuo oxidation of the samples during analysis. In all cases, however, the contribution from oxide could be clearly separated from the pure metallic contribution by peak fitting.
XPS core level spectra were analysed by means of peak fitting to attain peak positions and widths of the metallic contributions of elemental references and the alloy sample. Igor Pro 6.37 software was used, and Shirley-type backgrounds were implemented. Doniach–Šunjić type asymmetric peak functions were used for metallic contributions, and Voigt type symmetric peak functions were used for the oxide contributions. For the metallic contributions, the Lorentzian (connected to the life time, and assumed constant) was set from ref. 35, and the Gaussian was allowed to vary. The Gaussian will be connected to both the instrumental broadening (also assumed constant), and any variation in the local chemical surrounding which can be expected in a multi-component alloy. By comparing the total fwhm of the fitted peak for reference metal samples and the multi-component alloy sample, the additional alloy broadening of the core levels was assessed.
Results and discussion
Simulation results
DFT simulations were performed on the alloy, using the equimolar Hf20Nb20Ti20V20Zr20 composition. The non-relaxed multi-component alloy with an (undistorted) bcc structure has a lattice constant of 3.40 Å, whereas the supercell relaxation yielded a slightly smaller lattice constant of 3.36 Å. Previous theoretical calculations on the ideal (undistorted) alloy have reported a 3.40 Å lattice constant,36 in excellent agreement with our calculations, whereas previous experimental results have reported values in the range of 3.37–3.46 Å.20,21,36–38 The values are plotted in Fig. 1 together with data for the pure elements.‡ Note that Vegard's law for a disordered bcc structure yields a lattice parameter of 3.33 Å for the equimolar alloy. It is noted that the present value and literature values are slightly larger than what Vegard's law predicts. This difference is usually explained with a non-ideal solid solution and indicates that a simple hard-sphere model is insufficient to explain the structure.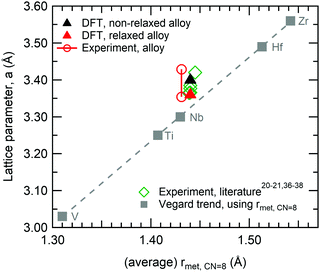 | ||
| Fig. 1 Illustration of the different lattice parameters obtained for the HfNbTiVZr multi-component alloy, as a function of (average) metallic radii, using the metallic radii for 8-coordination, see Table 1. The Vegard trend (square marker and dashed line) shows calculated lattice parameters, based on the ideal bcc structure; other series show observed lattice parameters. | ||
The results shown in Fig. 2 give further insight into the structural changes connected to the relaxation of the DFT supercell: (a) shows the pair distribution function (PDF); and (b) the angular distribution function for an undistorted perfect bcc structure (black) and the DFT relaxed multi-component alloy (red). Note that the reliability of the theoretical PDF for the relaxed alloy has been confirmed in explicit comparison with experiment.27 Inspecting the PDFs in Fig. 2, it is possible to observe that after relaxation the alloy still has a bcc structure, yet the distortions caused by different local chemical environments produce a range of neighbour distances. The first and second nearest neighbour distances are no longer easily distinguishable, and appear as a shoulder in the first peak. Likewise, the angular distribution also presents a range of values, but also confirms that the bcc structure is preserved.
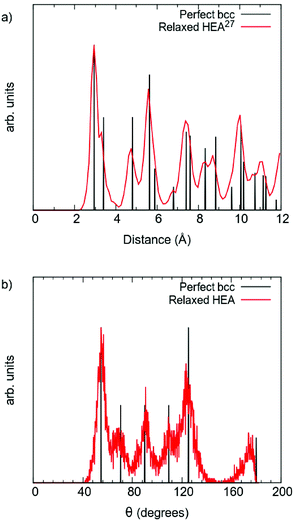 | ||
| Fig. 2 Comparison between perfect bcc structure multi-component alloy (black), and DFT relaxed multi-component alloy (red): (a) pair distribution function, and (b) angular distribution function. | ||
To further investigate the structural change, the distribution of the displacements from the ideal bcc positions for each element type in the multi-component alloy is plotted in Fig. 3. As can be seen, all atoms are displaced in the relaxation, and the average atomic displacement ranges from 0.25 to 0.31 Å, with standard deviations in the range of 0.09 to 0.15 Å. These values are in good agreement with what Samolyuk et al. attained for the similar HfNbTiZr alloy.12 This means that the average displacements of all the different elements are within the standard deviations, and therefore the magnitudes of the displacements seem more dependent on the local chemical environment, than on a particular element. The large spread in displacement also suggests that this dependence goes beyond the first nearest neighbour shell. Still, it may be worth noting that Nb and Hf are the elements with the smallest average displacement from ideal positions, and V is the element with the largest average displacement. The latter may be rationalised by V being the smallest in size. For all elements, except Ti, the distribution is ‘bottom heavy’ with the most frequent displacement smaller than the average displacement and generally decreasing frequencies for larger displacements. Due to the limited statistical base (24 atoms of each element), it is however difficult to draw any conclusions based on this.
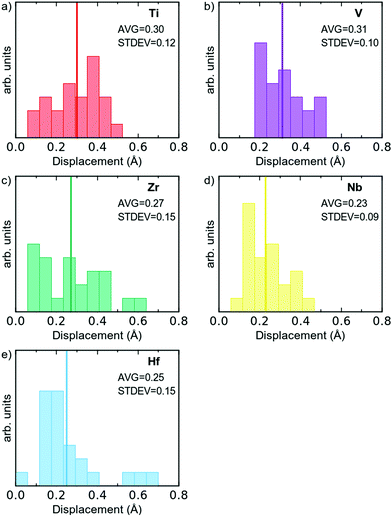 | ||
| Fig. 3 Distribution of the displacement from ideal bcc positions, per element type for all 120 atoms in the simulated supercell. Average displacement indicated by a solid line. | ||
This displacive disorder of the atoms clearly shows that there is a local lattice distortion. It is however important to note that this is not simply caused by atoms of different sizes, leading to stretched bonds and strain. DFT simulations do not apply a hard sphere model, but instead determine the total electron density (and the position of the nuclei). This means that also the chemical interaction of the elements is incorporated, and there is more knowledge to be gained from studying the electron density and atomic positions carefully.
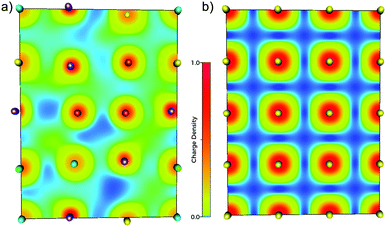
To visualise how the electronic structure is affected by the presence of different neighbouring elements (i.e. local chemical environments) and distortions, electronic density map slices are presented in Fig. 4, for both the HfNbTiVZr multi-component alloy (a) and a bcc metal (Nb) as a reference (b). From these maps one can clearly see that there is a large difference between the electronic structure of the multi-component alloy and an element with the same structure. The electronic density is delocalised to a much larger degree in the case of the alloy, indicating charge transfer between the elements. Also the displacive disorder is illustrated in Fig. 4, as the balls representing the nuclei are shifted in, and perpendicular to, the plane of the slice. The latter is seen by the different sizes of the balls.
The above noted delocalisation makes it hard to define clear borders between the atoms in the alloy, in contrast to the pure Nb metal where the borders are quite clear. The concept of assigning electrons (charge) to a specific atom and discussing charge transfer between atoms is thus not straightforward, as this is a grave simplification of reality. One may however approach this simplification by assigning the volume over which to integrate the charge that belongs to a specific atom. There is not one unique way to do this, but several approaches exist, see the Experimental section above.
The more complex Voronoi and Bader approaches are attractive as they go beyond the non-physical model of hard spherical atoms. However, in the present case where each atom has a unique local environment, each atom will also have a unique volume and the larger the volume, the larger the enclosed charge. The actual charge transfer between atoms depends thus on both the chemical environment and atomic displacements. An issue with both the Bader and Voronoi methods, which occurs in the studied system, is that it is difficult to separate between these two contributions. Additionally, charge transfer strongly depends on the reference state, the unrelaxed multi-component alloy super cell could be used as the reference state but carries the trouble of comparing the charge enclosed in different volumes.
To assess the redistribution of charge due to different local chemical environments and lattice distortions, we choose to count the number of electrons present in a fixed spherical volume around each atomic nucleus. Comparing the electrons enclosed in this volume for a given atom in the alloy and in its elemental reference gives a picture of the change in charge distribution in the same region of space due to the different chemical environments. We believe this approach is a good descriptor to assess charge transfer and core level shifts. The used “charge transfer” (Δq) is defined in eqn (2), where q denotes the elemental charge enclosed in the fixed spherical volume. One must note that this is not a space filling approach and therefore not all the electrons in the system are encompassed, and the summation of charge differences does not achieve charge neutrality. We have included a comparison between the Bader and fixed sphere model in the ESI.†
Δq = qalloy − qelemental![[thin space (1/6-em)]](https://www.rsc.org/images/entities/char_2009.gif) ref. ref. | (2) |
However, this approach is also challenging, since there is a distribution of enclosed charges over the 24 atoms of each element in the simulation supercell, and there are several contributing factors when comparing directly with the elemental references, such as change of lattice parameter and local chemical environment that influence the enclosed charge of each atom. For the latter, a step-wise analysis can be helpful; and in a first evaluation, the distributions of charge transfer for the different atoms can be assessed with the help of averages. In Table 1 the average charge transfer for each element is analysed in steps: from the elemental reference to the relaxed alloy. The analysis was made using the fixed sphere model and the Wigner–Seitz radii provided in the VASP pseudopotentials to probe charge transfer. The charge transfer (Δq) has been defined as a difference in elemental charges, and an atom gaining electrons will thus show a negative Δq value. As Hf, Ti and Zr have no stable low temperature bcc phases, DFT simulations were used to determine how charge would be distributed in the bcc phase, with a relaxed lattice parameters denoted a0. Thus, the first column showing charge transfer (average Δq) gives the change in enclosed charge due to the difference in structure, from hcp to bcc (elemental ref. – bcc a0). This only leads to minor charge transfer, 0.02 to 0.08 elemental charges.
![[thin space (1/6-em)]](https://www.rsc.org/images/entities/char_2009.gif) tab)39 metallic radii for 8-coordination (rmet,
tab)39 metallic radii for 8-coordination (rmet,![[thin space (1/6-em)]](https://www.rsc.org/images/entities/char_2009.gif) CN=8) implementing a coordination number compensation factor40 for the elements not found in the bcc structure. Average charge transfer (Δq) in elemental charge for the fixed sphere model, comparing different DFT simulated phases. a with different subscripts denotes the lattice parameter
CN=8) implementing a coordination number compensation factor40 for the elements not found in the bcc structure. Average charge transfer (Δq) in elemental charge for the fixed sphere model, comparing different DFT simulated phases. a with different subscripts denotes the lattice parameter
| Average Δq (elemental charge) | ||||||||
|---|---|---|---|---|---|---|---|---|
| Structure | Lattice const. | Chem. env. | Atomic displac. | Sum | ||||
| E.N. |
r
met,![[thin space (1/6-em)]](https://www.rsc.org/images/entities/char_2009.gif) tab (Å) tab (Å) |
r
met,![[thin space (1/6-em)]](https://www.rsc.org/images/entities/char_2009.gif) CN=8 (Å) CN=8 (Å) |
Element ref. – bcc a0 | bcc anon-relax – bcc a0 | Alloy anon-relax – bcc anon-relax | Alloy arelax – Alloy anon-relax | Alloy arelax – elemental ref. | |
| Ti | 1.5 | 1.45 | 1.41 | −0.03 | 0.14 | −0.06 | −0.05 | 0.00 |
| V | 1.6 | 1.31 | 1.31 | n/a | 0.43 | −0.16 | −0.15 | 0.11 |
| Zr | 1.4 | 1.59 | 1.54 | −0.08 | −0.28 | 0.15 | 0.10 | −0.11 |
| Nb | 1.6 | 1.43 | 1.43 | n/a | 0.08 | −0.03 | −0.05 | −0.01 |
| Hf | 1.3 | 1.56 | 1.51 | −0.02 | −0.32 | 0.14 | 0.11 | −0.10 |
In the second column for charge transfer (average Δq), the elements are compared in the bcc structure but with the same lattice constant as in the multi-component alloy (bcc anon-relax – bcc a0), thus probing the result of different lattice constants. This step creates the largest contributions to the charge transfer, with absolute values of 0.08 to 0.43 elemental charges. This can be rationalised in the following: Hf and Zr possess larger lattice constants than the alloy, one could imagine the atoms are squeezed to fit into a smaller structure, therefore having more electrons in the enclosed volume, while the opposite happens for the smaller Nb, Ti, and V that will have less enclosed electrons in the fixed volume.
In the third column for charge transfer (average Δq), the unrelaxed alloy phase is compared with the elemental bcc phases with the lattice constant of the alloy (alloy anon-relax − bcc anon-relax). This can give an estimate of the charge transfer due to the local chemical environment. From the data in Table 1 it is clear that the transfer due to local chemical environment is in line with electronegativity, with the larger and less electronegative atoms (Hf and Zr) losing electrons to the smaller and more electronegative atoms (Ti, V, Nb), thus yielding a positive Δq for Hf and Zr, see Table 1.
In the fourth column of charge transfer (average Δq) the unrelaxed and relaxed alloy phases are compared (alloy arelax – alloy anon-relax), thus giving the charge transfer contribution due to the atomic displacement. This contribution is very similar to the previous one, and can be interpreted as that the relaxation allows for an increased charge transfer that is driven by the chemical environment.
The final column shows the sum of the previous columns, which thus becomes the comparison between the relaxed alloy phase and the elemental references in their room temperature phase. As can be seen, this average Δq does not follow any clear trend as it contains contributions from several factors.
In summary, the DFT simulations show that there is a re-arrangement of the electron density of a multi-component alloy compared to the pure elements, i.e. a charge transfer between the elements. These results are also consistent with the previous results of Tong et al.15
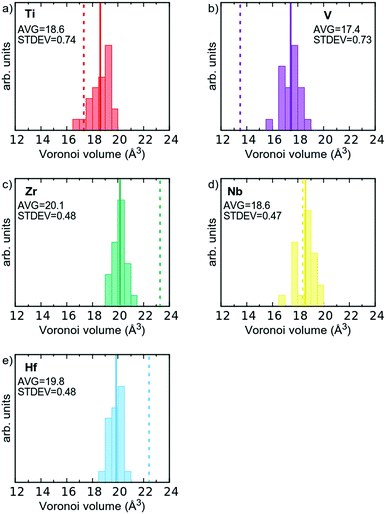
From the discussion above, it is also clear that the volume required for each atom is unique in the alloy, where a distribution exists, compared to the elemental references where the elements have a well-defined volume. This is illustrated in Fig. 5, where the Voronoi volumes are plotted for each element, and compared to Voronoi volumes for the elemental reference phases (dashed vertical lines). As can be seen the large Hf and Zr atoms shrink (Fig. 5c and d), and the smaller V and Ti atoms expand (Fig. 5a and b). Nb, which has a metallic radius in-between the four other elements, exhibits a small spread of values around that of the elemental reference (Fig. 5d). This observation is also consistent with the suggestion from Tong et al.15 that charge transfer in multi-component alloys reduces the size mismatch between the elements and thus reduces the proposed local lattice distortions.
As stated in the Introduction the δ-value of HfNbTiVZr based on eqn (1) is 5.72% if one uses the metallic radii for 8-coordination (see Table 1). If the Voronoi volumes in Fig. 5 are equated to a spherical volume, a sort of atomic radii can be attained. If the Voronoi volumes from the elemental reference phases are used, a slightly different value of 6.52% is obtained for the HfNbTiVZr alloy. The slightly higher value comes from the space filling nature of the Voronoi approach when compared to the hard sphere approach. If, however, the average volume for each element in the multi-component alloy is used, a δ-value of only 1.76% is attained for the alloy. One could also refrain from using the average radii, and let the sum in eqn (1) be over all 120 individual atoms in the supercell, which gives a δ-value of 2.07%. Both these values are significantly lower than when employing the hard sphere model with tabulated metallic radii. This shows that the concept of local lattice distortion based on tabulated radii is not generally valid to estimate actual local lattice distortions, as chemical interaction between the elements reduces the size mismatch of the atoms.
The above-described conclusions are purely based on ab initio materials simulations using DFT. There are however experimental possibilities to probe the electronic structure of alloys, and compare them to the electronic structure from modelling. Using XPS one can probe the binding energy of different core electrons, the value of which is sensitive to the local chemical surrounding. If the electronic structure of the alloy has changed, compared to the pure elements, one would expect a change in the core level binding energies, i.e. a core level shift (CLS).
Based on DFT models it is possible to simulate the XPS process, and attain binding energies for core electrons.33 The absolute values of these binding energies will not be directly comparable to experimental values, due to the work function, which is not considered, and other systematic errors. However, one can successfully compare differences in binding energy between different environments, to calculate the CLS. Here the room temperature stable elemental phases of the respective element were used as the reference, and the CLS of the multi-component alloy was calculated for direct comparison to experimental data. The attained CLS for all the 120 atoms in the multi-component alloy supercell are presented in Fig. 6 as histograms; and the averages and fwhm of the distribution are given in Table 2. As can be seen, practically all atoms show a shift (CLS values different from 0), consistent with the changed electronic structure. Furthermore, there is for all elements a spread in the observed CLS, which is the result of the varying chemical surroundings. Electrons from the Hf 4f and Zr 3d orbitals show the largest negative CLS, with average values of −0.26 and −0.53 eV, respectively. V 2p shows the largest positive CLS with an average of 0.27 eV. Nb 3d shows a slight positive shift, with an average of 0.07 eV. The CLS of Ti 2p is in the middle of the group.
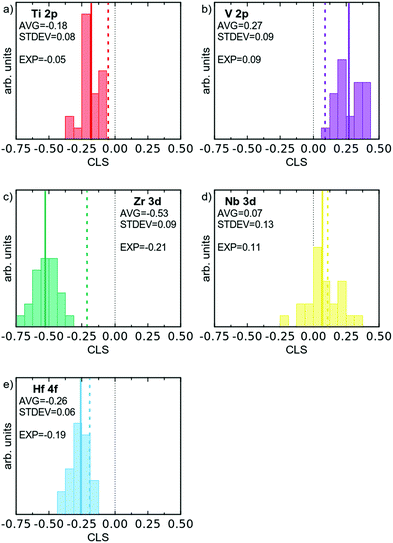 | ||
| Fig. 6 Histograms of simulated XPS CLS for the 120 atoms of the DFT supercell, divided according to element. Average CLS indicated by a solid line, and experimental value by a dashed coloured line. | ||
| Core level | Method | Elemental reference | Multi-component alloy | CLS (eV) | Broadening (eV) | ||
|---|---|---|---|---|---|---|---|
| E B (eV) | fwhm (eV) | E B (eV) | fwhm (eV) | ||||
| Ti 2p3/2 | Experiment | 453.87 | 0.54 | 453.82 | 0.92 | −0.05 | 0.38 |
| Theory | 0 | 0.18 (0.23) | −0.18 (0.17) | 0.18 (0.23) | |||
| V 2p3/2 | Experiment | 512.08 | 0.60 | 512.17 | 0.94 | 0.09 | 0.34 |
| Theory | 0 | 0.22 (0.26) | 0.27 (0.78) | 0.22 (0.26) | |||
| Zr 3d5/2 | Experiment | 178.72 | 0.39 | 178.51 | 0.60 | −0.21 | 0.21 |
| Theory | 0 | 0.21 (0.39) | −0.53 (−0.54) | 0.21 (0.39) | |||
| Nb 3d5/2 | Experiment | 202.27 | 0.48 | 202.38 | 0.65 | 0.11 | 0.17 |
| Theory | 0 | 0.30 (0.38) | 0.07 (0.44) | 0.30 (0.38) | |||
| Hf 4f7/2 | Experiment | 14.15 | 0.29 | 13.96 | 0.43 | −0.19 | 0.14 |
| Theory | 0 | 0.15 (0.35) | −0.26 (−0.73) | 0.15 (0.35) | |||
The spread of CLS values for each element can be expected to correlate to an experimentally observed alloy broadening, and the theoretical CLS data gives broadenings of 0.15 to 0.30 eV. In the theoretical values we have included results from relaxed and non-relaxed structures in order to assess the importance of structural relaxation (see below).
The above presented data also gives the possibility to discuss the origin of the observed CLSs in the multi-component alloy. Attempts to correlate average CLS with average charge transfer do not yield any good correlations (see filled markers in Fig. 7), illustrating the difficulty of using averages in the context of a large amount of different chemical environments for each element. However, the individual values of charge transfer for each atom when using the fixed sphere approach (i.e. the individual values giving the averages presented in the last column of Table 1) give a high degree of correlation with the CLS for the respective atoms in the simulation supercell. This is shown in Fig. 7 (open markers), where individual CLS values are plotted against the individual charge transfer in the relaxed alloy compared to the elemental references. The observed relationship between CLS and charge transfer shows that, for the present multi-component alloy, the main contribution to the CLS is an initial state effect based on the local chemical environment. This initial state relationship between photoelectron CLS and charge transfer is a well-established model and has been studied previously.16,41–43 In principle, this correlation would (at least for this group of disordered alloys) allow the estimation of charge transfer from experimentally measured properties such as XPS core level binding energies. To what extent these correlations can be used for other systems remains to be determined.
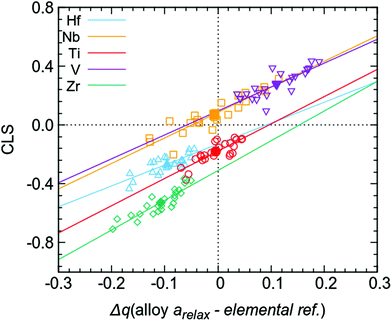 | ||
| Fig. 7 Calculated core level shifts for all 120 atoms (open markers) in the supercell versus charge transfer compared to elemental references, calculated using the fixed sphere model, i.e. all individual values giving the average Δq (alloy arelax – elemental ref.) in the last column of Table 1 (also shown here as filled markers). | ||
Experimental results
To verify the theoretical modelling results, a multi-component alloy sample deposited within the framework of a previous study21 was studied further, together with elemental references. XPS analysis showed that the coating had a near equimolar composition: Hf22Nb19Ti18V19Zr21. Only trace amounts of oxygen were found in the bulk of the coating. The purity of the metallic references was also confirmed by XPS, where no contaminants could be observed in the survey spectra.The θ/2θ-XRD pattern from the alloy coating is shown in Fig. 8. As can be seen there are only two observed peaks. These can be indexed to a simple bcc structure, which thus exhibits a 〈110〉 preferred orientation. No indication of additional phases was observed. Also grazing incidence XRD was performed, but did not show any other crystalline phases. The lattice parameter of the alloy was determined both in- and out-of-plane, and found to vary between 3.35 Å (in-plane) and 3.43 Å (out-of-plane) due to compressive residual stresses. This range is indicated in Fig. 1 (red circular markers), and is in agreement with the value attained by DFT for the relaxed structure (3.36 Å). Experimental values are offset in X due to the slightly different composition, and thus different average metallic radius.
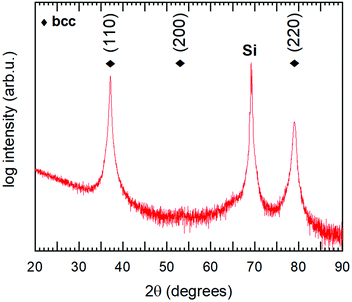 | ||
| Fig. 8 θ/2θ diffractogram of the studied Hf22Nb19Ti18V19Zr21 coating. Diamond markers show positions for the observed bcc phase. The peak at 2θ ∼ 69° originates from the Si substrate. | ||
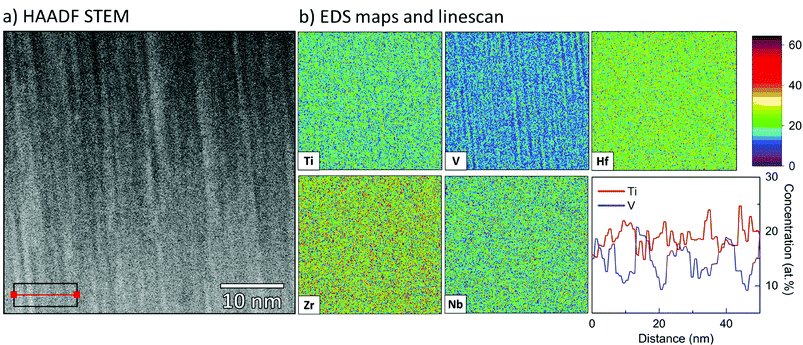
The multi-component alloy sample was further studied with TEM, and a scanning transmission electron microscope (STEM) bright field micrograph is shown in Fig. 9, giving an overview of the prepared TEM lamella. A fine-grained columnar and dense microstructure is clearly observed. This is in good agreement with the strong (110) texture, observed by θ/2θ-XRD. In general, the sample is found to be homogeneous with no indications of secondary or minority phases, the difference in brightness between the top and the bottom of the film is due to a variation in thickness of the TEM lamella. Selected area electron diffraction (not shown) gave rise to spot patterns, consistent with the highly textured bcc phase observed in XRD. To confirm the assumed random solid solution of the alloy coating, STEM EDS was performed on a representative part of the sample. Fig. 10 shows a HAADF STEM image (a) of the columnar microstructure at higher magnification, together with the corresponding EDS maps (b). As can be seen, Hf, Zr and Nb appear homogenously and randomly distributed on the nanometre scale. However, for V and Ti the outlines of the columnar microstructure can be observed just above the noise level. This indicates a partial segregation of these two elements. The result of a line-scan across several columns is shown in Fig. 10(b), where one can see that the segregation is indeed partial with a variation of about ±5 at% (15–22 at% for Ti, and 10–21 at% for V).§ This could be connected to results reported by Pacheco et al.,20 where Calphad calculations show that a multi-component HfNbTiVZr alloy is enriched in Ti and depleted in V in the lower temperature range as secondary phases start to appear. It is thus concluded that a five-component solid solution phase with a bcc structure exists throughout the sample. There is however in some regions a partial segregation of Ti and V to the extent of a few at%. The sample is hence relevant to study the chemical bonding in a multi-component alloy, and for direct comparison with the above presented DFT simulations.
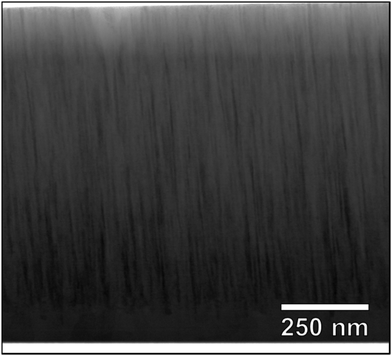 | ||
| Fig. 9 STEM bright field cross section overview micrograph. The top region of the lamella is thinner than the bottom region, which leads to the observed contrast. | ||
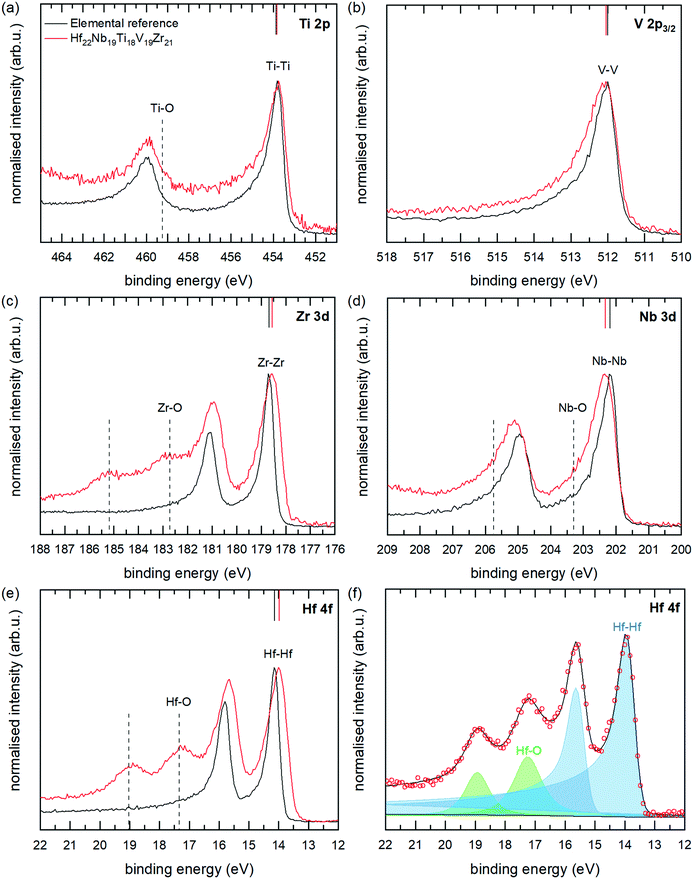
High-resolution core level XPS spectra of the multi-component alloy (red spectra) and the corresponding reference metals (black spectra) are presented in Fig. 11(a)–(e). As can be seen, there are differences between the spectra of the alloy and the elemental references, which is the main interest of this paper. Apart from the metallic contributions, there are for Nb, Zr and Hf clearly also contributions at higher binding energies from metal atoms in an oxygen environment (positions marked with dashed lines in Fig. 11). These originate from the in vacuo oxidation which occurred in the analysis chamber of the electron spectrometer, and the effect is larger for the alloy sample as the measurement time for this sample was about four times longer. The oxide contributions can however easily be separated from the metallic contributions by peak-fitting procedures, which have been employed. An example of the peak fitting (for Hf 4f of the multi-component alloy) is shown in Fig. 11(f), and all fits are found in the ESI.† Peak positions and widths of the main, metallic, contributions are summarised in Table 2. The lowest energy spin–orbit component (2p3/2, 3d5/3 or 4f7/2) was used for fittings determining the CLS as this component is more well-defined due to a higher intensity, smaller Lorenzian broadening and lesser overlap with oxide components. We also note small changes in the spin–orbit splitting in the alloy compared to the metal references. Such a change is indicative of a small change in chemical environment.44
Coming back to the differences between the spectra of the multi-component alloy and the elemental references, the following can be observed: a significant shift of −0.2 eV for the Hf 4f7/2 and Zr 3d5/2 peaks of the alloy, compared with the elemental references; whereas Nb 3d5/2 and V 2p3/2 are shifted to 0.1 eV higher binding energies. The binding energy of Ti 2p3/2 remains unchanged, within the uncertainty of the determination. These core level shifts clearly show that the electronic structure of the multi-component alloy is different from the pure elements, thus indicating charge transfer between the elements and a non-ideal solid solution, in agreement with the theoretical modelling presented above.
The sign and magnitude of the CLS of Ti 2p, V 2p, Nb 3d, and Hf 4f all agree well with the CLS values from theory and the relaxed alloy simulation. As can be seen from Table 2 and Fig. 6 (experimental values indicated by dashed coloured lines) V 2p and Nb 3d exhibit a positive CLS with experimental values of 0.09 and 0.11 eV, respectively; while the Ti 2p, Zr 3d and Hf 4f all exhibit a negative CLS with experimental values in the range of −0.05 to −0.21 eV. The largest deviation from theoretical values is observed for Zr 3d, which exhibits a smaller CLS experimentally (−0.21 eV) than predicted from theory (−0.53 eV), although both values put Zr in the group with distinct negative CLS.
All the core levels of the alloy also exhibit an increased broadening compared to that of the elemental references, with 0.14 to 0.38 eV larger fwhm, see Table 2. The observed broadening is in excellent agreement with the CLS variation from the relaxed alloy simulation (0.15 to 0.30 eV), see Table 2. This indicates that the range of chemical environments modelled in the relaxed DFT simulations reflect the variation in the experimental sample.
This agreement between experimental and theoretical values, for both CLS and disorder broadening, is experimental confirmation that the electronic structure in the DFT simulation is a reasonable representation of reality. It thus confirms that there exists a re-distribution of electrons (i.e. charge transfer between the atoms) that will reduce the size mismatch of the atoms, reducing the suggested local lattice distortion, and that there is a range of chemical environments for each element.
It is interesting to note that there is a substantial difference between theoretical CLS from non-relaxed and relaxed simulations, with the latter values distinctly closer to the experimental results. This stresses the importance of performing structure relaxation in simulations; as well as the strong effect the displacive disorder has on the CLS values for this alloy, in contrast to alloys with similar sized elements.33,45
The observed discrepancies between theory and experiment however also indicate that the DFT-based modelling has not fully captured the structure of the multi-component alloy. One part of this could be due to the limited size of the supercell, resulting in an incomplete sampling of local order. It should however be noted that part of the discrepancies may be due to a mismatch between the experimental sample and the theoretical model, as TEM analysis shows a non-homogeneous distribution of Ti and V in the analysed sample.
Concluding remarks
The here presented results combine theoretical (DFT-based ab initio simulations) and experimental (thin film synthesis and characterisation using XPS) results to show that multi-component alloys form non-ideal solid solutions where each atom has a unique chemical environment, and that the chemical interactions (i.e. charge transfer) cause a reduction of the atomic size differences assumed based on the metallic radii of the elements. The results show that there exists local lattice distortion (displacive disorder), but to a smaller extent than assumed from the metallic radii.This has been demonstrated for a system based on early transition metals (HfNbTiVZr), and the same phenomena should be present in other multi-component alloy systems. In cases where the differences between the elements in the multi-component alloy are smaller, the effects will of course be smaller; and conversely one can also envision systems with larger differences and even larger effects. The latter can be an interesting approach for the design of multi-component alloys, by using the here observed charge transfer to influence e.g. the bonding character or other functional properties connected to the electronic structure.
A general validity of the here observed charge transfer, and reduction of atomic size differences, will have further implications. This size compensation mechanism may be the reason that the suggested lattice distortion effect has been difficult to confirm experimentally – the real mismatch of atomic radii in the multi-component alloy is, due to the chemical bonding, smaller than assumed from elemental radii. Thus, the often used δ-parameter, which is based on tabulated radii, may not be relevant to assess the amount of local lattice distortion in multi-component alloys. One could ask the question if some of the properties of multi-component alloys that have been attributed to the so-called lattice distortion effect, via the δ-parameter, may instead be the effect of the chemical bonding within the non-ideal solid solution, which will be different than just an average of the included metals.
An additional interesting point is that the presence of charge transfer between the atoms in multi-component alloys may also be transferred to some other multi-component materials. In, e.g., transition metal carbides and nitrides there is metallic bonding between the metal atoms, and it is probable that a charge transfer similar to what has been studied here is present also in the related multi-component carbides and nitrides. Thus, using the here observed charge transfer to design material properties could also be an applicable design route for transition metal carbides and nitrides.
In conclusion, the confirmation of the charge transfer between atoms in multi-component alloys, and connection to (the smaller) lattice distortion, proposed by Tong et al.,13–15 opens up new interesting possibilities for materials design for multi-component materials, and may be part of the explanation for non-linear properties observed in some multi-component materials.
Author contributions
The study was conceptualised by EL; investigation was performed by LCT, BO, DK, SF and KvF; formal analysis was performed by LCT, IAA, BO, RL, and AIA; writing of the original draft was performed by LCT, BO, EL, and AIA; reviewing and editing by EL, RL, BA, IAA and UJ; BA, IAA, IH, UJ, and EL were responsible for supervision; UJ, IAA, IH, and BA contributed to funding acquisition.Conflicts of interest
There are no conflicts of interest to declare.Acknowledgements
The authors wish to acknowledge financial support from a number of sources. UJ acknowledges the Swedish Research Council (VR), grant 2018-04834. BA and IAA acknowledge financial support from the Swedish Government Strategic Research Area in Materials Science on Functional Materials at Linköping University, Faculty Grant SFO at LiU 2009 00971 and from the Knut and Alice Wallenberg Foundation (Wallenberg Scholar Grant KAW-2018.0194). BA acknowledges support from the Swedish Foundation for Strategic Research through the Future Research Leaders 6 program, FFL 15-0290 and from the Swedish Research Council (VR) through the grant 2019-05403. The computations were enabled by resources provided by the Swedish National Infrastructure for Computing (SNIC) at NSC partially funded by the Swedish Research Council through grant 2018-05973. Theoretical analysis of the results of electronic structure calculations under the leadership of IAA was funded by RFBR, Project No. 20-02-00178. AIA and IH acknowledge support from the Swedish e-Science Research Centre (SeRC) and Swedish Research Council (VR) grant 2019-05487.Notes and references
- B. Cantor, I. T. H. Chang, P. Knight and A. J. B. Vincent, Microstructural development in equiatomic multicomponent alloys, Mater. Sci. Eng. A, 2004, 375–377, 213–218, DOI:10.1016/j.msea.2003.10.257.
- J. W. Yeh, S. K. Chen, S. J. Lin, J. Y. Gan, T. S. Chin, T. T. Shun, C. H. Tsau and S. Y. Chang, Nanostructured High-Entropy Alloys with Multiple Principal Elements: Novel Alloy Design Concepts and Outcomes, Adv. Eng. Mater., 2004, 6, 299–303, DOI:10.1002/adem.200300567.
- D. B. Miracle and O. N. Senkov, A critical review of high entropy alloys and related concepts, Acta Mater., 2017, 122, 448–511, DOI:10.1016/j.actamat.2016.08.081.
- Y. Zhang, T. T. Zuo, Z. Tang, M. C. Gao, K. A. Dahmen, P. K. Liaw and Z. P. Lu, Microstructures and properties of high-entropy alloys, Prog. Mater. Sci., 2014, 61, 1–93, DOI:10.1016/j.pmatsci.2013.10.001.
- A. D. Pogrebnjak, A. A. Bagdasaryan, I. V. Yakushchenko and V. M. Beresnev, The structure and properties of high-entropy alloys and nitride coatings based on them, Russ. Chem. Rev., 2014, 83, 1027, DOI:10.1070/RCR4407.
- Y. Ikeda, B. Grabowski and F. Körmann, Ab initio phase stabilities and mechanical properties of multicomponent alloys: A comprehensive review for high entropy alloys and compositionally complex alloys, Mater. Charact., 2019, 147, 464–511, DOI:10.1016/j.matchar.2018.06.019.
- W. Steurer, Single-phase high-entropy alloys – A critical update, Mater. Charact., 2020, 162, 110179, DOI:10.1016/j.matchar.2020.110179.
- S. Guo, Q. Hu, C. Ng and C. T. Liu, More than entropy in high-entropy alloys: Forming solid solutions or amorphous phase, Intermetallics, 2013, 41, 96–103, DOI:10.1016/j.intermet.2013.05.002.
- E. J. Mittemeijer, Fundamentals of Materials Science, Springer-Verlag, Berlin Heidelberg, 2011 Search PubMed.
- A. Inoue, Stabilization of metallic supercooled liquid and bulk amorphous alloys, Acta Mater., 2000, 48, 279–306, DOI:10.1016/S1359-6454(99)00300-6.
- L. R. Owen and N. G. Jones, Lattice distortions in high-entropy alloys, J. Mater. Res., 2018, 33, 2954–2969, DOI:10.1557/jmr.2018.322.
- G. D. Samolyuk, Y. N. Osetsky, G. M. Stocks and J. R. Morris, Role of Static Displacements in Stabilizing Body Centered Cubic High Entropy Alloys, Phys. Rev. Lett., 2021, 126, 025501, DOI:10.1103/PhysRevLett.126.025501.
- Y. Tong, K. Jin, H. Bei, J. Y. P. Ko, D. C. Pagan, Y. Zhang and F. X. Zhang, Local lattice distortion in NiCoCr, FeCoNiCr and FeCoNiCrMn concentrated alloys investigated by synchrotron X-ray diffraction, Mater. Des., 2018, 155, 1–7, DOI:10.1016/j.matdes.2018.05.056.
- Y. Tong and F. Zhang, Critical Review of Chemical Complexity Effect on Local Structure of Multi-principal-Element Alloys, JOM, 2019, 71, 3419–3423, DOI:10.1007/s11837-019-03705-3.
- Y. Tong, S. Zhao, H. Bei, T. Egami, Y. Zhang and F. Zhang, Severe local lattice distortion in Zr- and/or Hf-containing refractory multi-principal element alloys, Acta Mater., 2020, 183, 172–181, DOI:10.1016/j.actamat.2019.11.026.
- I. A. Abrikosov, W. Olovsson and B. Johansson, Valence-Band Hybridization and Core Level Shifts in Random Ag–Pd Alloys, Phys. Rev. Lett., 2001, 87, 176403, DOI:10.1103/PhysRevLett.87.176403.
- X. Xu, Y. Guo, B. P. Bloom, J. Wei, H. Li, H. Li, Y. Du, Z. Zeng, L. Li and D. H. Waldeck, Elemental Core Level Shift in High Entropy Alloy Nanoparticles via X-ray Photoelectron Spectroscopy Analysis and First-Principles Calculation, ACS Nano, 2020, 14, 17704–17712, DOI:10.1021/acsnano.0c09470.
- X. Feng, K. Zhang, Y. Zheng, H. Zhou and Z. Wan, Chemical state, structure and mechanical properties of multi-element (CrTaNbMoV)Nx films by reactive magnetron sputtering, Mater. Chem. Phys., 2020, 239, 121991, DOI:10.1016/j.matchemphys.2019.121991.
- K. von Fieandt, L. Riekehr, B. Osinger, S. Fritze and E. Lewin, Influence of N content on structure and mechanical properties of multi-component Al–Cr–Nb–Y–Zr based thin films by reactive magnetron sputtering, Surf. Coat. Technol., 2020, 389, 125614, DOI:10.1016/j.surfcoat.2020.125614.
- V. Pacheco, G. Lindwall, D. Karlsson, J. Cedervall, S. Fritze, G. Ek, P. Berastegui, M. Sahlberg and U. Jansson, Thermal Stability of the HfNbTiVZr High-Entropy Alloy, Inorg. Chem., 2019, 58, 811–820, DOI:10.1021/acs.inorgchem.8b02957.
- S. Fritze, C. M. Koller, L. von Fieandt, P. Malinovskis, K. Johansson, E. Lewin, P. H. Mayrhofer and U. Jansson, Influence of Deposition Temperature on the Phase Evolution of HfNbTiVZr High-Entropy Thin Films, Materials, 2019, 12, 587, DOI:10.3390/ma12040587.
- P. E. Blöchl, Projector augmented-wave method, Phys. Rev. B: Condens. Matter Mater. Phys., 1994, 50, 17953, DOI:10.1103/PhysRevB.50.17953.
- G. Kresse and J. Furthmüller, Efficiency of ab initio total energy calculations for metals and semiconductors using a plane-wave basis set, Comput. Mater. Sci., 1996, 6, 15–50, DOI:10.1016/0927-0256(96)00008-0.
- G. Kresse and J. Furthmüller, Efficient iterative schemes for ab initio total-energy calculations using a plane-wave basis set, Phys. Rev. B: Condens. Matter Mater. Phys., 1996, 54, 11169–11186, DOI:10.1103/PhysRevB.54.11169.
- J. P. Perdew, K. Burke and M. Ernzerhof, Generalized Gradient Approximation Made Simple, Phys. Rev. Lett., 1996, 77, 3865, DOI:10.1103/PhysRevLett.77.3865.
- A. Zunger, S. H. Wei, L. G. Ferreira and J. E. Bernard, Special quasirandom structures, Phys. Rev. Lett., 1990, 65, 353–356, DOI:10.1103/PhysRevLett.65.353.
- L. Casillas-Trujillo, U. Jansson, M. Sahlberg, G. Ek, M. M. Nygård, M. H. Sørby, B. C. Hauback, I. A. Abrikosov and B. Alling, Interstitial carbon in bcc HfNbTiVZr high-entropy alloy from first principles, Phys. Rev. Mater., 2020, 4, 123601, DOI:10.1103/PhysRevMaterials.4.123601.
- R. F. Bader, Atoms in Molecules: A Quantum Theory, Clarendon Press, New York, 1990 Search PubMed.
- W. Tang, E. Sanville and G. Henkelman, A grid-based Bader analysis algorithm without lattice bias, J. Phys.: Condens. Matter, 2009, 21, 084204, DOI:10.1088/0953-8984/21/8/084204.
- G. Henkelman, A. Arnaldsson and H. Jónsson, A fast and robust algorithm for Bader decomposition of charge density, Comput. Mater. Sci., 2006, 36, 354–360, DOI:10.1016/j.commatsci.2005.04.010.
- C. H. Rycroft, VORO++: A three-dimensional Voronoi cell library in C++, Chaos, 2009, 19, 041111, DOI:10.1063/1.3215722.
- B. Johansson and N. Mårtensson, Core-level binding-energy shifts for the metallic elements, Phys. Rev. B: Condens. Matter Mater. Phys., 1980, 21, 4427–4457, DOI:10.1103/PhysRevB.21.4427.
- T. Marten, W. Olovsson, S. I. Simak and I. A. Abrikosov, Ab initio study of disorder broadening of core photoemission spectra in random Cu–Pd and Ag–Pd alloys, Phys. Rev. B: Condens. Matter Mater. Phys., 2005, 72, 054210, DOI:10.1103/PhysRevB.72.054210.
- M. P. Seah, Summary of ISO/TC 201 Standard: VII ISO 15472:2001 – surface chemical analysis – X-ray photoelectron spectrometers – calibration of energy scales, Surf. Interface Anal., 2001, 31, 721–723, DOI:10.1002/sia.1076.
- J. L. Campbell and T. Papp, Widths of the Atomic K–N7 Levels, At. Data Nucl. Data Tables, 2001, 77, 1–56, DOI:10.1006/adnd.2000.0848.
- É. Fazakas, V. Zadorozhnyy, L. K. Varga, A. Inoue, D. V. Louzguine-Luzgin, F. Tian and L. Vitos, Experimental and theoretical study of Ti20Zr20Hf20Nb20X20 (X = V or Cr) refractory high-entropy alloys, Int. J. Refract. Met. Hard Mater., 2014, 47, 131–138, DOI:10.1016/j.ijrmhm.2014.07.009.
- D. Karlsson, G. Ek, J. Cedervall, C. Zlotea, K. T. Møller, T. C. Hansen, J. Bednarčík, M. Paskevicius, M. H. Sørby, T. R. Jensen, U. Jansson and M. Sahlberg, Structure and Hydrogenation Properties of a HfNbTiVZr High-Entropy Alloy, Inorg. Chem., 2018, 57, 2103–2110, DOI:10.1021/acs.inorgchem.7b03004.
- M. Feuerbacher, T. Lienig and C. Thomas, A single-phase bcc high-entropy alloy in the refractory Zr–Nb–Ti–V–Hf system, Scr. Mater., 2018, 152, 40–43, DOI:10.1016/j.scriptamat.2018.04.009.
- G. Aylward and T. Findlay, SI chemical data, Jacaranda Wiley Ltd, Milton, Australia, 4th edn, 1998 Search PubMed.
- D. F. Shriwer and P. W. Atkins, Inorganic chemistry, Oxford University Press, 3rd edn, 1999 Search PubMed.
- U. Gelius, Binding Energies and Chemical Shifts in ESCA, Phys. Scr., 1974, 9, 133–147, DOI:10.1088/0031-8949/9/3/001.
- R. J. Cole, N. J. Brooks and P. Weightman, Madelung Potentials and Disorder Broadening of Core Photoemission Spectra in Random Alloys, Phys. Rev. Lett., 1997, 78, 3777, DOI:10.1103/PhysRevLett.78.3777.
- R. J. Cole, N. J. Brooks and P. Weightman, Determination of charge transfer in the CuxPd1−x alloy system, Phys. Rev. B: Condens. Matter Mater. Phys., 1997, 56, 12178–12182, DOI:10.1103/PhysRevB.56.12178.
- M. C. Biesinger, L. W. M. Lau, A. R. Gerson and R. S. C. Smart, Resolving surface chemical states in XPS analysis of first row transition metals, oxides and hydroxides: Sc, Ti, V, Cu and Zn, Appl. Surf. Sci., 2010, 257, 887–898, DOI:10.1016/j.apsusc.2010.07.086.
- T. Marten, I. A. Abrikosov, W. Olovsson, B. Johansson, R. J. Cole, G. Beamson, S. R. Haines and P. Weightman, Suppression of disorder broadening of core-level photoelectron lines in CuAu alloys by inhomogeneous lattice distortion, Phys. Rev. B: Condens. Matter Mater. Phys., 2009, 79, 012201, DOI:10.1103/PhysRevB.79.012201.
Footnotes |
| † Electronic supplementary information (ESI) available: Comparison of different charge assignment approaches, and plots of curve fittings for XPS core level spectra. See DOI: 10.1039/d1qm00380a |
| ‡ Using the metallic radii for 8-coordination, see Table 1. |
| § N.B. these concentration values are directly from the EDS analysis, not calibrated XPS values. |
| This journal is © the Partner Organisations 2021 |

