 Open Access Article
Nontoxic photoluminescent tin oxide nanoparticles for cell imaging: deep eutectic solvent mediated synthesis, tuning and mechanism†
Laboni
Das
 ab,
Linmariya Devassy
Koonathan
c,
Amit
Kunwar
 ab,
Suman
Neogy
d,
Anil K.
Debnath
e and
Soumyakanti
Adhikari
 *a
*a
aRadiation & Photochemistry Division, Bhabha Atomic Research Centre, Mumbai 400 085, India. E-mail: asoumya@barc.gov.in; Fax: +91-22-25505331; Tel: +91-22-25590301
bHomiBhabha National Institute, Training School Complex, Anushaktinagar, Mumbai-400094, India
cChrist College (Deemed to be University), Bangalore, India
dMaterials Science Division, Bhabha Atomic Research Centre, Mumbai 400 085, India
eTechnical Physics Division, Bhabha Atomic Research Centre, Mumbai 400 085, India
First published on 10th May 2021
Abstract
Non-toxic and photoluminescent (PL) tin oxide nanoparticle synthesis in Deep Eutectic Solvents (DESs) is being reported herein. Both radiation (electron beam and γ radiation) and solvothermal methods were employed for the synthesis. An electron beam radiation technique proved to be more appropriate in tuning the size and morphology compared to the solvothermal process. Addition of any external oxido-reductive or stabilizing agent could be avoided by the use of Reline (choline chloride![[thin space (1/6-em)]](https://www.rsc.org/images/entities/char_2009.gif) :
:![[thin space (1/6-em)]](https://www.rsc.org/images/entities/char_2009.gif) urea; 1
urea; 1![[thin space (1/6-em)]](https://www.rsc.org/images/entities/char_2009.gif) :
:![[thin space (1/6-em)]](https://www.rsc.org/images/entities/char_2009.gif) 2) as the host matrix. Detailed analysis of the PL behaviour of the nanoparticles is another important aspect of this study. The oxygen vacancies and tin interstitials responsible for photoluminescence have been identified from the de-convoluted PL spectra of the nanoparticles. Time dependent PL kinetics depicts PL decay at ∼1.2 ns due to near band edge emission and at ∼3.15 ns due to defect state emission. The synthetic process has been standardized focusing on the size of the particles by varying all possible experimental parameters such as the temperature, concentration of the precursors, reaction time, dose of irradiation and dose rate. Synthesized nanoparticles have been characterized using XRD, XPS and EDX. TEM images illustrate nanomorphological differences obtained in the two methods. The probable mechanism of synthesis (both radiation and thermal) has been proposed based on the results obtained from transient studies using electron pulses and FTIR experiments. Cytotoxicity data demonstrate that the nanoparticles are suitable for application in biological studies involving cells up to a concentration of 10 μM. Imaging experiments with these photoluminescent nanoparticles exhibit their ubiquitous distribution including the nucleus of the tumour cells, which signifies potential application of these NPs for targeted drug delivery in cancer chemotherapy. Furthermore, the nanoparticles exhibited excellent antioxidant properties in vitro. The findings herein can open up enormous possibilities for more advanced and dedicated research towards using this cheap and versatile nanomaterial in a variety of biomedical applications.
2) as the host matrix. Detailed analysis of the PL behaviour of the nanoparticles is another important aspect of this study. The oxygen vacancies and tin interstitials responsible for photoluminescence have been identified from the de-convoluted PL spectra of the nanoparticles. Time dependent PL kinetics depicts PL decay at ∼1.2 ns due to near band edge emission and at ∼3.15 ns due to defect state emission. The synthetic process has been standardized focusing on the size of the particles by varying all possible experimental parameters such as the temperature, concentration of the precursors, reaction time, dose of irradiation and dose rate. Synthesized nanoparticles have been characterized using XRD, XPS and EDX. TEM images illustrate nanomorphological differences obtained in the two methods. The probable mechanism of synthesis (both radiation and thermal) has been proposed based on the results obtained from transient studies using electron pulses and FTIR experiments. Cytotoxicity data demonstrate that the nanoparticles are suitable for application in biological studies involving cells up to a concentration of 10 μM. Imaging experiments with these photoluminescent nanoparticles exhibit their ubiquitous distribution including the nucleus of the tumour cells, which signifies potential application of these NPs for targeted drug delivery in cancer chemotherapy. Furthermore, the nanoparticles exhibited excellent antioxidant properties in vitro. The findings herein can open up enormous possibilities for more advanced and dedicated research towards using this cheap and versatile nanomaterial in a variety of biomedical applications.
1. Introduction
Deep Eutectic Solvents (DESs) are a newly emerging class of solvents consisting of hydrogen bonded structures of halide salts and hydrogen bond donors, and having a considerably lower melting point compared to their constituent components.1 They are appropriately being referred to as versatile alternatives to Room Temperature Ionic Liquids (RTILs) for their prominent advantages over the latter. Practically DESs possess all the remarkable properties of RTILs like negligible vapor pressure, tunable physical properties, nonflammability, wide electrochemical window etc., but excel over RTILs due to some added significant features like their easy and simple waste-free synthesis procedure, wherein no further purification is necessary. Furthermore, the initial raw materials for DES synthesis are much less expensive thereby making their large-scale production viable and cost effective. Also they are considered to be nontoxic and biodegradable compared to RTILs by nature.2 All these aforementioned features follow the principles of green chemistry and so preferably DESs are appropriate solvents for green synthesis of nanomaterials. Their low surface tension (∼52 mN in reline) leads to a high rate of nucleation and makes generation of small particles feasible (since Ostwald ripening is very weak).2 DESs are able to solubilize a large number of organic and inorganic compounds, which helps in overcoming the difficulty of working with several water insoluble precursors used in nanoparticle synthesis such as tin chloride used in the present study. However, compared to RTILs these are less explored in the field of nanosynthesis. Utilizing DESs as solvents for the synthesis of semiconductor nanomaterials has huge scope and possibilities.Tin oxide is an important category of wide band gap (3.6 eV) n-type semiconductor material with proven potential for applications3 such as in electronics,4,5 optoelectronics,6 photovoltaics and dye sensitized solar cells,7 photocatalysis,8 rechargeable lithium ion batteries,9–11 gas sensors,12,13 and electrocatalysis.14 Due to its immense significance in nanotechnology, a large number of research reports have already appeared and innumerable methods are available in the literature for its synthesis.15–19 Among the metal oxide nanoparticles (MONPs) those of cadmium, arsenic, lead and mercury are observed to be toxic, whereas TiO2, ZnO, CuO, Fe3O4, and Fe2O3 are considered to be relatively safer for bio-applications.20 SnO2, In2O3 and Al2O3 are less studied but they are expected to have low toxicity.21 Biogenically synthesized tin oxide NPs have shown significantly less cytotoxic and genotoxic effects.22,23 Design of green methodologies for the synthesis of MONPs has a significant effect on lowering the toxicity so that they can be considered for bio-applications.24 However, tin oxide NPs are less explored in the area related to bio-applications.
Keeping in view the principles of green chemistry, herein a facile low-cost green synthesis method has been strategized by which we were successfully able to produce highly photoluminescent and biocompatible tin oxide nanoparticles.
Defect-related photoluminescence as observed in the present case is known to enhance photocatalytic, electro-catalytic and antibacterial effects due to trapping of electrons and holes in defect states.25 However; here we have utilized the photoluminescence properties of the tin oxide NPs for a different purpose. To the best of our knowledge, photoluminescent tin oxide NPs have rarely been probed for cell imaging applications to date. Yan et al. have reported a multifunctional SnO2 nanoprobe for targeted cell delivery, and imaging and detection of microRNA.26 Of course, several metal oxide nanoparticles have been employed as biomedical agents in diagnostic, therapeutic and sensing platforms.27 For instance, nanosized TiO2 has shown its application in imaging;28 superparamagnetic iron oxide and manganese oxide have been used for molecular imaging.29 Nevertheless, photoluminescent bare tin oxide nanoparticles have not been employed for bio-imaging purposes, even though tin oxide has been seen to be less toxic than most other metal oxides. From cytotoxicity experiments, herein, we have established that the synthesized NPs are tolerated or less toxic. Accordingly, a cell imaging study has been carried out in both normal and cancer cells, wherein the obtained results are quite encouraging. This significant breakthrough for tin oxide NPs can open enormous possibilities for more advanced and dedicated research towards their use as biomedical materials.
A low-cost biodegradable solvent, Reline (DES), has been used as a green host matrix which itself acts as a stabilizing agent as well as a source of oxidizing radicals during radiation assisted synthesis. The possibilities, drawbacks and mechanistic details of both the thermo-chemical and radiation induced techniques in reline as a solvent have been studied in detail and a comparative analysis is presented herein.
2. Experimental section
2.1 Chemicals
High purity chemicals choline chloride – ChCl (≥ 98%), urea – NH2CONH2 (99.5%), tin(II)chloride dihydrate – SnCl2·2H2O (≥98%) and 2,2′-azinobis(3-ethylbenzothiazoline-6-sulfonic acid)diammonium salt (ABTS) were obtained from Sigma Aldrich and used as received. The organic solvents, absolute ethanol and acetone, were purchased from SD Fine-Chem Ltd, Mumbai, with the highest purity available. Nanopure water (conductivity, 0.06 μS cm−1) wherever used was obtained from the Millipore water purifying system. The water content in the DES was measured by the Karl–Fischer titration method (using a Metrohm 831 KF Coulometer) and found to be ∼1000 ppm.2.2 Synthesis
Prior to synthesis of reline, choline chloride and urea were separately vacuum dried at 90 °C and 60 °C respectively, for 48 hours. Reline was prepared by mixing ChCl and urea in a molar ratio of 1![[thin space (1/6-em)]](https://www.rsc.org/images/entities/char_2009.gif) :
:![[thin space (1/6-em)]](https://www.rsc.org/images/entities/char_2009.gif) 2 followed by continuous heating and stirring at 80 °C (water bath) until a homogeneous colorless liquid was formed. The hydrogen bonded molecular structure of reline consisting of ChCl and urea in 1
2 followed by continuous heating and stirring at 80 °C (water bath) until a homogeneous colorless liquid was formed. The hydrogen bonded molecular structure of reline consisting of ChCl and urea in 1![[thin space (1/6-em)]](https://www.rsc.org/images/entities/char_2009.gif) :
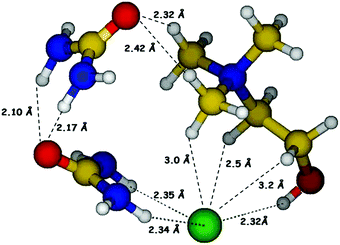
:![[thin space (1/6-em)]](https://www.rsc.org/images/entities/char_2009.gif) 2 molar ratio is shown in Fig. 1.
2 molar ratio is shown in Fig. 1.
For the synthesis of tin oxide nanoparticles, SnCl2.2H2O in measured quantity (∼10 mM) was added to the previously prepared solvent, reline. In the thermo-chemical method, the reaction medium (along with the dissolved precursor) was subjected to continuous heating and stirring (700 rpm) for 90 minutes in a pre-heated water bath at 50 °C, 80 °C and 98 °C, respectively, for three different reaction set ups. White cloudiness started to appear after 15 minutes of reaction indicating the formation of nanoparticles; however, the reaction was further left for 90 minutes to attain completion. At 98 °C, the appearance of a white cloudy precipitate was highest, and it was lowest at 50 °C. Experiments have been carried out by increasing the reaction time up to 3 hours and obtaining the absorbance at different time intervals which shows a decrease in absorption intensity of the nanoparticles after 2 hours (Fig. S1, ESI†); henceforth the reaction time was optimized to 90 minutes. The concentration of the added precursor was increased from 10 mM to 40 mM; however, no noticeable change in absorbance was observed. Colloidal suspension of the nanoparticles was precipitated using absolute ethanol. Ultrasonication and centrifugation of the solution yielded white precipitates. The precipitates were washed with ethanol 2–3 times and vacuum dried at 230 °C for 4–5 hours followed by calcination at 400 °C and 800 °C for 2–5 hours for further characterization.
For synthesis by the electron beam irradiation method, the precursor in measured quantity (∼20 mM) was dissolved in reline by magnetic stirring only (600 rpm) for approximately 2 hours (no heating was done). It has to be noted that although SnCl2·2H2O forms a white precipitate of basic salt Sn(OH)Cl in water, it is solubilized to a clear solution in reline by stirring only. Furthermore, the clear solutions were irradiated by an electron beam with specific doses. However, no cloudiness or change in the color of the samples was observed after irradiation, which indicates that the nanoparticles formed are much smaller in size compared to those synthesized by a thermo-chemical route. On addition of ethanol to the irradiated medium, a white precipitate appeared which was centrifuged and calcined for further characterization as has been done in the case of the thermally synthesized particles.
2.3 Antioxidant studies by ABTS radical scavenging assays
ABTS free radical scavenging activity for the as synthesized NPs was experimentally determined according to the method reported in the literature.30 Stock solution was prepared by mixing ABTS (7 mM) and potassium persulfate (2.5 mM) and incubated at room temperature in the dark for 12–16 hours, to form ABTS˙+. The working solution was prepared by dilution of the stock solution by nanopure water (labelled as Solution A) such that it has an absorbance in the range of 0.70–0.80 at 734 nm. The NP stock solution prepared had a concentration of 12.74 mg ml−1 (6.37 mg of NPs dispersed in 0.5 ml nanopure water). Different volumes (microliter) of the stock solution of NPs were added to 2 ml of solution A and observed for 1 hour. With time, the blue-green color of solution A bleached. After 1 hour the solutions were centrifuged to remove the un-dissolved NPs and the absorbance was observed at 734 nm. The results obtained from UV-Vis absorption studies were plotted to determine the IC50 values of the NPs (i.e., concentration of the sample required to scavenge/inhibit 50% of radicals). For comparison of antioxidant activity of the NPs with a standard, the IC50 value of ascorbic acid (a standard antioxidant) was also determined by following the same procedure and it was found to be ∼7.5 μg ml−1.2.4 Cytotoxicity analysis by MTT assays
Cytotoxicity studies were carried out in Chinese hamster ovary (CHO) cells, suspended in Dulbecco's modified Eagle's medium (DMEM) with 10% fetal calf serum seeded in a 96 well plate at a density of 3 × 10³ cells per well and incubated at 37 °C in a 5% CO2 humidified atmosphere. After the attachment of cells (12–16 hours), they were treated with increasing concentrations of test compounds for 24 hours, and the cell viability was determined by a colorimetric MTT (3-(4,5-dimethylthiazol-2-yl)-2,5-diphenyltetrazolium bromide) assay as described previously.31 The results have been presented as % cytotoxicity calculated from the decrease in the characteristic absorbance of formazan crystals at 570 nm with respect to untreated cells i.e. control (100%).2.5 Cell imaging
The cellular imaging of nanoparticles was performed in normal Chinese Hamster Ovary (CHO) epithelial and human lung epithelial carcinoma (A549) cells maintained at Bhabha Atomic Research Centre. The cells were cultured in DMEM medium containing 10% FBS, 100 U ml−1 penicillin and 100 μg ml−1 streptomycin and incubated at 37 °C in a humidified atmosphere with 5% CO2. For imaging, ∼5 × 10³ cells were grown on a cover slip, treated with 10 μM concentration of nanoparticles for 24 h in cell culture medium, washed twice with 10 mM phosphate buffered saline (PBS) and imaged using a fluorescence microscope (magnification, 10×, Olympus) after excitation with an UV filter.2.6 Characterization
Optical absorption measurements were carried out by using a JASCO V-650 absorption spectrophotometer. Photoluminescence studies have been carried out using a JASCO FP-8500 Spectrofluorometer. X-Ray diffraction (XRD) measurements were recorded on a Phillips X-ray diffractometer, model PW 1710 system, using a monochromatic Cu Kα source (λ = 1.54 Å). The observed diffraction data were analyzed using the Fullprof-2000 Rietveld refinement program32 in which the peak profile was fitted with the pseudo-Voigt profile function and U, V, and W parameters were refined. In the initial stage the background parameters were adjusted with sixth order polynomial and an appropriate scale factor. The high-resolution transmission electron microscopy (HRTEM) images were acquired on a Libra 200FE instrument. Samples for TEM measurements were prepared by re-dispersing the extracted powdered samples in ethanol and depositing a drop of this solution on a thin carbon coated copper grid followed by drying under an infrared lamp. The compositional analysis for the samples was performed with an energy dispersive X-ray spectrometer (EDX). X-Ray photoelectron spectroscopy (XPS) measurements were carried out using Mg-Kα (1253.6 eV) source and DESA-150 electron analyzer (StaibInstruments, Germany). The binding-energy scale was calibrated to an adventitious C-1s line of 284.8 eV. The analyzer was operated at 40 eV pass energy. The pressure in the chamber during analysis was ∼7 × 10⁻⁹ torr. The anode voltage of the X-ray source was 15.5 kV, the filament current was 2.25 A and the emission current was 15.5 mA. PL lifetime measurements were carried out by using a time correlated single photon counting (TCSPC) instrument (model: IBH, UK). The instrument response function (IRF) of the setup was measured by collecting the scattered light from a TiO2 suspension in water. The samples were excited by a DELTA LED of an output wavelength of 280 nm with an IRF of approximately 150 ps. The electron beam irradiation performed employing 7 MeV electrons has been described elsewhere.33 For a 2 μs pulse, the measured dose was 145 Gy. Dosimetry was carried out using an air-saturated aqueous solution containing 5 × 10⁻² M KSCN (Gε = 2.59 ± 0.05 m2 J−1 at 475 nm).34 The FTIR spectra were recorded using a diamond single reflectance ATR probe in an IR Affinity-1 FTIR spectrometer. KF titration was carried out in an 831 KF Coulometer.3. Results and discussion
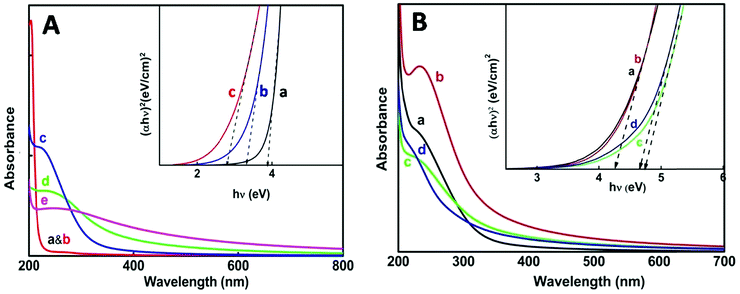
For the thermo-chemically synthesized nanoparticles the color of the resulting solution was transparent at 50 °C and it turned cloudy white at a reaction temperature of 80 °C and the white color intensified at 98 °C. The enhancement of cloudiness at higher temperatures obviously is due to an increase in nanoparticle concentration and agglomeration within the medium. Fig. 2A illustrates the appearance of an excitonic peak with the formation of nanoparticles at different temperatures. Blank absorption was taken before and after heating reline, which does not show any peak in the 200–300 nm wavelength region (Fig. 2A, a & b).The onset and mean position of the excitonic peak obtained at different reaction temperatures were red shifted, from 225 nm at 50 °C to 238 nm at 80 °C and 257 nm at 98 °C. A bathochromic shift of the excitonic peak is mainly attributed to the increase in particle size.35 Furthermore, with an increase in reaction temperature considerable broadening of the excitonic peak was noticed, which corresponds mainly to the increase in the polydispersity of the nanoparticles.35–37 The direct band gap energy values were determined from the Tauc plot (Fig. 2A, inset) of (αhv)nvs. hv (eqn (1)). The value of n for a direct band gap semiconductor is 2. The symbol ‘α’ represents the absorption coefficient multiplied with the concentration of the nanoparticles, which was obtained from the relation (2.303A/l), where ‘A’ is the absorbance and ‘l’ is the optical path length of the cell (1 cm). The term ‘hv’ represents the photon energy.
| (αhν)n = K(hν − Eg) | (1) |
The estimated direct band gap energies have been tabulated (Table 1), where a large blue shift with respect to a bulk band gap value of 3.6 eV (direct band gap for SnO2) clearly indicates that the as grown nanoparticles belong to the strong confinement regime. Comparison of band gap values of the nanoparticles from table1 below shows that there is decrease in band gap with the increase in synthesis temperature.38 A concomitant decrease in band gap values with an increase in reaction temperature indicates the formation of larger particles at higher reaction temperature. The inverse relation of the band gap and particle size is well described using the following eqn (2)
| Eeffg = Eg + ħ2π2/2μR2 − 1.8e2/εR | (2) |
| Direct band gap (eV) | ||
|---|---|---|
| Temperature | 50 °C | 3.9 |
| 80 °C | 3.3 | |
| 98 °C | 2.8 | |
| Radiation dose | 35 kGy | 4.2 |
| 72 kGy | 4.2 | |
| 107 kGy | 4.7 | |
| 143 kGy | 4.6 | |
Further experiments varying the reaction time of thermal synthesis and initial precursor concentration showed no change in the band gap of the NPs (Fig. S1, ESI†).
In the case of nanoparticle synthesis via electron beam irradiation, the dose was varied from 35 kGy to 143 kGy. The appearance of an excitonic peak after irradiation is shown in Fig. 2B. However, compared to the chemical synthesis peak broadening was not observed here, indicating uniform distribution of particle size. Even at a dose of 35 kGy the particles produced were having a greater band gap (∼4.2 eV) (Table 1) than that obtained via thermo-chemical synthesis.
On increasing the dose above 100 kGy particles of an even larger band gap were produced i.e., ultra-small particles could be obtained with the direct band gap as high as ∼4.6 eV. Ye et al. have reported ultrathin nanorods with a direct band gap of ∼4.72 eV.39 However, the excitonic peak obtained at 72 kGy dose shows a better defined and sharper peak compared to the other doses which explains that the NPs obtained at this particular dose are confined to a very narrow size distribution range. Considering this we can conclude that ∼72 kGy can be an optimum dose for the e-beam irradiation method under our experimental conditions. From the absorbance studies so far, we can infer that e-beam irradiation is a better method for the synthesis of ultra-small particles with minimum polydispersity.
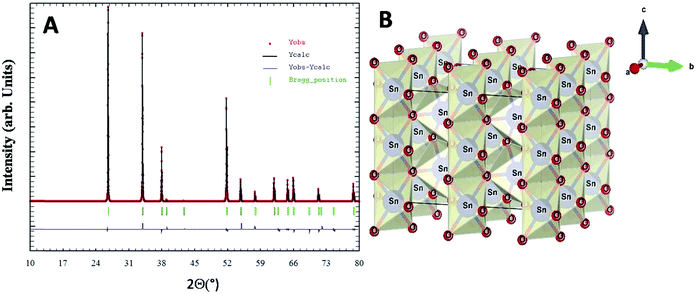
X-Ray diffraction studies combined with Rietveld refinement were performed to define the crystal structure and chemical composition of the as synthesized nanoparticles. The extracted NPs in the powder form showed broad unresolved peaks (Fig. S2, ESI†) which became more defined with an increase in calcination temperature up to 800 °C and the diffraction pattern of the nanoparticles was found to be in agreement with the standard JCPDS card no. 01-071-5323.40 No other XRD peak due to impurity phases including starting materials could be observed. Rietveld refined XRD data for compound SnO2(s) are shown in Fig. 3A. The derived cell parameters and residual parameters obtained from the refinement of XRD data for the compound is given in Table 2. Fig. 3B gives the crystal structure of SnO2(s) which was drawn using the VESTA program41 using Rietveld refinement data. Calcination at higher temperatures (400 °C and 800 °C) yields sharper peaks indicating the long-range ordering in the crystal. The prominent broad peaks obtained in XRD corresponding to (110), (101), (200) and (211) planes were considered for nanoparticle size determination.
| Parameters | Calculated values after refinement | Parameters | Calculated values after refinement |
|---|---|---|---|
| a (Å) | 4.73793 | U | 0.004123 |
| b (Å) | 4.73793 | V | 0.007359 |
| c (Å) | 3.18709 | W | 0.007132 |
| α (°) | 90 | χ 2 | 1.63 |
| β (°) | 90 | R exp | 11.23 |
| γ (°) | 90 | Space group | P42/mnm |
| V (Å3) | 71.53260 |
Primarily the peak broadening in XRD depends upon two factors i.e., lattice strain and crystallite size, which are obtained from Williamson–Hall analysis. 4ε![[thin space (1/6-em)]](https://www.rsc.org/images/entities/char_2009.gif) tan
tan![[thin space (1/6-em)]](https://www.rsc.org/images/entities/char_2009.gif) θ gives the strain broadening and Kλ/Dcos
θ gives the strain broadening and Kλ/Dcos![[thin space (1/6-em)]](https://www.rsc.org/images/entities/char_2009.gif) θ gives the broadening due to small crystallite size (Scherrer equation). Combining the two equations and rearranging gives eqn (3)
θ gives the broadening due to small crystallite size (Scherrer equation). Combining the two equations and rearranging gives eqn (3)
β![[thin space (1/6-em)]](https://www.rsc.org/images/entities/char_2009.gif) cos cos![[thin space (1/6-em)]](https://www.rsc.org/images/entities/char_2009.gif) θ = Kλ/D + 4ε θ = Kλ/D + 4ε![[thin space (1/6-em)]](https://www.rsc.org/images/entities/char_2009.gif) sin sin![[thin space (1/6-em)]](https://www.rsc.org/images/entities/char_2009.gif) θ θ | (3) |
β![[thin space (1/6-em)]](https://www.rsc.org/images/entities/char_2009.gif) cos
cos![[thin space (1/6-em)]](https://www.rsc.org/images/entities/char_2009.gif) θ was plotted against 4
θ was plotted against 4![[thin space (1/6-em)]](https://www.rsc.org/images/entities/char_2009.gif) sin
sin![[thin space (1/6-em)]](https://www.rsc.org/images/entities/char_2009.gif) θ wherein the slope and y-intercept of the fitted line represent the strain and size of the nanoparticle, respectively. The plot shows a negative strain of −2.1% which probably is due to compressive strain or lattice shrinkage within the nanomaterial. From the intercept of the Williamson–Hall plot (Fig. S3, ESI†) the particle size was calculated to be ∼8 nm.
θ wherein the slope and y-intercept of the fitted line represent the strain and size of the nanoparticle, respectively. The plot shows a negative strain of −2.1% which probably is due to compressive strain or lattice shrinkage within the nanomaterial. From the intercept of the Williamson–Hall plot (Fig. S3, ESI†) the particle size was calculated to be ∼8 nm.
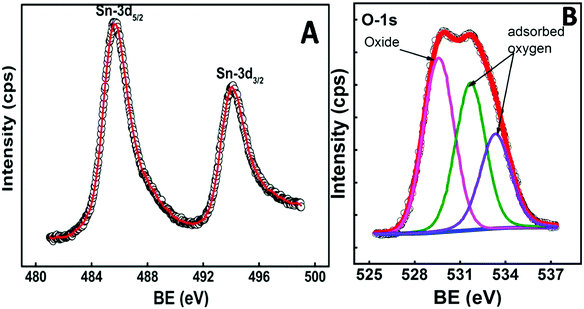
To confirm the stoichiometry of the synthesized compound and to get a clear view of the oxidation state of tin and oxygen, XPS analysis was carried out. Fig. 4 shows the XPS spectra of Sn-3d and O-1s peaks. The Sn-3d5/2 peak (Fig. 4A) at ∼486.0 eV and ΔE = 8.4 eV confirm the formation of SnO2. The O-1s depicts a broad peak (Fig. 4B), which indicates the presence of an oxide peak (∼530.0 eV), and adsorbed oxygen peaks at 531.6 eV (–COOH) and 533.3 eV (–C–OH). Broadening of the O-1s peak on the higher energy side indicates the presence of oxygen deficient tin oxide.42 From the XPS data, the O/Sn ratio was calculated using eqn (4)43
 | (4) |
The TEM images for the NPs obtained via e-beam irradiation depict self-assembling of the initially formed small spherical globules into larger sized ones, which further gets interconnected to form an entangled structure (Fig. 5). The interconnected structures formed were about micrometers in length (up to 1.5 μm). The globules obtained at doses up to 72 kGy typically have a wide range of diameters (Fig. 5A and B), with maximum particles within 80–90 nm. At higher dose (>100 kGy) the spheres were smaller in size with the diameter mostly within 55–65 nm (Fig. 5C and D). This was earlier indicated in absorbance studies where a higher band gap was obtained in NPs synthesized at dose >100 kGy. Finally, it can be inferred that though the overall morphology is the same at all the four different e-beam doses, smaller particles could be obtained at doses >100 kGy. Energy dispersive X-ray spectroscopy (EDS) carried out alongside the TEM imaging to confirm the composition of the synthesized nanomaterial (Fig. S4, ESI†), depicting that the NPs are composed of Sn and O.
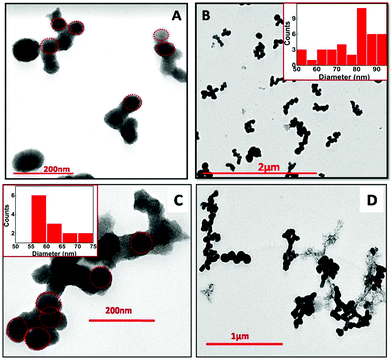 | ||
| Fig. 5 TEM images of SnO2 NPs at different magnification, synthesized via electron beam irradiation. (A) 35 kGy, (B) 72 kGy, (C) 107 kGy and (D) 143 kGy in the reline matrix. | ||
It is to be noted that although by electron beam radiation we were able to achieve a specific morphology, gamma radiation failed to provide definite structures (Fig. S5, ESI†). It is pertinent to emphasize here that the dose rate involved in the electron beam irradiation technique was estimated to be ∼1.6 kGy s−1, while that in the case of γ-irradiation was ∼0.4 Gy s−1. Consequently, the high dose rate in the case of an electron beam leads to the instant deposition of a large amount of energy in a very short time. This aspect of the electron beam most likely is responsible for the difference in morphology compared to γ-irradiation as had been pointed out in an earlier report.44
The NPs synthesized by a solvothermal route exhibit elongated structures having a length of ∼50 nm (Fig. 6). The NPs synthesized at different reaction temperatures showed no difference in their morphology. Energy dispersive X-ray spectroscopy (EDS) has been carried out alongside the TEM imaging to confirm the composition of the synthesized nanomaterial. EDX data shown in Fig. 6B depict that the NPs are composed of Sn and O.
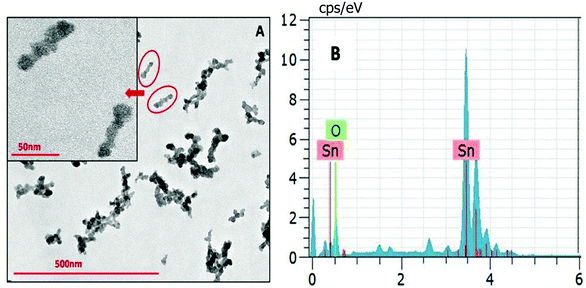 | ||
| Fig. 6 (A) TEM image of SnO2 NPs obtained via a solvothermal route in the reline matrix. (B) The EDX spectrum of the SnO2 nanoparticles. | ||
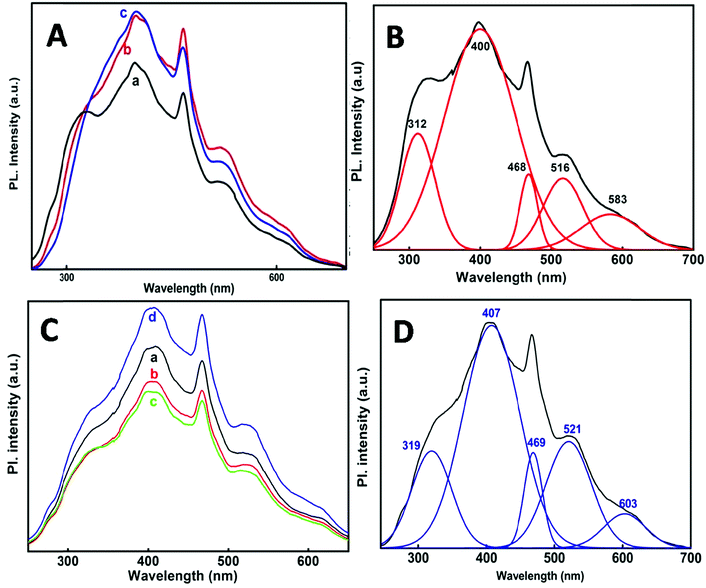
Fig. 7A and C shows the PL spectra of the SnO2 nanoparticles at 220 nm excitation wavelength. The emission spectra obtained at each individual temperature and at different e-beam radiation doses have been de-convoluted into five main peaks (Fig. 7B and D) which are presented in Table 3. It is observed that one emission band is in the UV-region and the other four are in the visible region. Comparatively the emission in the visible region is much stronger than that in the UV region. A PL spectrum gives indication of the size and crystallinity of the SnO2 NPs. Earlier studies have shown that SnO2 NPs with larger size and perfectly crystalline structures show stronger UV emission.45–48 In the present case the NPs show stronger visible emission indicating that these are quite small in size and not perfectly crystalline as described from XRD.
| Synthesis | Peak position λ (nm) | ||||
|---|---|---|---|---|---|
| 50 °C | 312 | 400 | 468 | 516 | 583 |
| 80 °C | 318 | 404 | 468 | 519 | 589 |
| 98 °C | 327 | 401 | 468 | 519 | 609 |
| via e-beam (35, 72, 107, 143 kGy) | 319 | 407 | 469 | 521 | 603 |
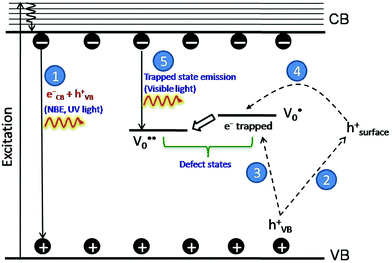
The PL bands were found to be independent of excitation wavelength and found to have been originated from the “band gap” and “trapped state” or “defect level” emission. Upon excitation of the SnO2 NPs there is generation of an electron–hole pair (e−CB and h+VB). The first peak in the UV region ranging between 312 to 327 nm (considering different temperatures and different doses) can be ascribed to the near band-edge emission (NBE) of SnO2 (path 1, Scheme 1). The electrons first get excited to the highest level of the conduction band (CB); with time non-radiative relaxation (vibrational, without photon emission) occurs to the lowest energy level of the CB (e−CB) and then recombines with the holes in the valence band (h+VB) to give NBE (path 1 Scheme 1). Patra et al. have observed a similar type of near band edge emission for SnO2 nanorods and nanoparticles.45 This type of emission which is not exactly “band gap emission” but has a lower energy than BG is known as “near band edge emission” and has already been reported by several other researchers.48–51 Mostly the visible light emission is known to be related to the defects arising from oxygen vacancies and Sn interstitials. The SnO2 host matrix as in the case of other metal oxides consists of oxygen vacancies which are created due to the escape of O2− ions from the lattice.  states can be defined as electrons trapped within defects that are generated by the escape of oxygen atoms (O2−); these are paramagnetic in nature having monopositive charge with respect to the O2−. h+VB generated in the VB due to excitation can further progress through the reaction (5) (path 2, Scheme 1) trap at the surface of the particle and the (6) trap at the earlier generated
  centre to form a
  centre (path 3, Scheme 1) (2 electron deficient w.r.t O2−). h+surface can further return back and recombine with an electron in
  to give
  (path 4, Scheme 1)
| h+VB → h+surface | (5) |
 | (6) |
e−CB can recombine with  with emission in the visible region (path 5, Scheme 1).52 In the present study the emission in the visible region is due to such a recombination of conduction band electrons with a shallow and deep h+ trap (i.e.
 ). These electrons which are trapped in the deep e− trap can return back to the CB and get captured by deep h+ traps to give visible emission.50 This type of trapped state emission from shallow or deep traps is delayed emission and has longer lifetimes than the NBE. Time dependent PL studies have been carried out to explain it further and are discussed in the following section. The peaks above 500 nm are of low intensity and can be due to O vacancies or Sn interstitial defects. First principles calculations have already shown that the formation of O vacancies and Sn-interstitials is energetically favorable in the SnO2 lattice; so their existence in huge numbers is expected.51,53 All the visible region peaks are grossly denoted to the trapped states, O vacancies or Sn interstitials, but to identify the origin of each particular peak a more thorough and detailed investigation is required.
Noticeably the emission peaks (see Table 3) at three different reaction temperatures show a considerable red shift from 312 nm to 327 nm, which can be due to the subsequent decrease in the band gap with an increase in particle size with temperature as has been observed from UV-Vis spectra and the Tauc plot for the band gap (Fig. 2A and Table 1).
A time resolved study of PL decay has been carried out at all the emission wavelengths using a 280 nm excitation source. All the PL decay curves shown in Fig. 8 exhibited multiexponential behavior (tri-exponential) which were analyzed and fitted according to eqn (7)
| I(t) = a1e1−t/τ + a2e2−t/τ + a3e3−t/τ | (7) |
| 〈τ〉 = (a1τ1 + a2τ2 + a3τ3)/(a1 + a2 + a3) | (8) |
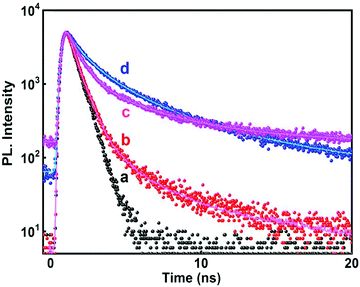 | ||
| Fig. 8 Time resolved PL decay curve (λexc = 280 nm) of SnO2 nanoparticles at different emission wavelengths (a) IRF; (b) 320 nm; (c) 467 nm; and (d) 400 nm. | ||
The average lifetimes obtained after fitting and analyzing the decay traces have been presented in Table 4. For both the radiation assisted and thermally synthesized NPs, the NBE emission at 320 nm in the UV-region had fast decay kinetics. This fast PL decay had an average lifetime of ∼1.2 ns (although it consisted of major contribution from the source itself, see Table 4) and is attributed to the NBE.
| λ (nm) | T 1 (ns) | B 1 (%) | T 2 (ns) | B 2 (%) | T 3 (ns) | B 3 (%) | χ 2 | 〈t〉 (ns) |
|---|---|---|---|---|---|---|---|---|
| 320 | 1.8 | 13 | 0.03 | 73 | 6.9 | 14 | 1.2 | 1.2 |
| 400 | 2 | 28 | 6.6 | 36.3 | 0.74 | 35.6 | 1.1 | 3.2 |
| 467 | 1.2 | 8.5 | 4.8 | 26 | 0.02 | 65 | 1.1 | 1.48 |
For the 400 nm emission, the decay is comparatively slower than the NBE emission and the average lifetime was found to be ∼3.15 ns indicating that these emissions are generated from defect states. Mostly the electrons recombine with the hole, de-trapping from the defect states as has already been discussed earlier. This is in agreement with most of the earlier reports which have mentioned decay times of binary semiconductor nanomaterials containing band gap and trapped state emission.46,47,54
A detailed analysis of the mechanism of NP synthesis carried out both for the solvothermal method and e-beam assisted method is described as follows. The water content of reline after preparation was measured to be ∼1000 ppm by KF titration. The presence of water in the ppm level probably catalyzes the synthesis. Earlier reports suggest that the disruption of the reline structure only occurs above 41% of water addition.55 To confirm the presence of water molecules and their role in nanoparticle synthesis in the present case, FTIR analysis was carried out. FTIR spectra of neat reline (with ∼1000 ppm moisture) and thermally treated reline containing SnCl2·2H2O is shown in Fig. 9. The water molecules present within reline remain mostly associated with urea.56 And in the present study this is inferred due to the following two reasons. Firstly, the bands at 3259 cm−1, 1681 cm−1 and 1606 cm−1 observed in the present sample are characteristically found in urea–water mixtures56,57 and indicate the presence of water molecules near urea. However, the presence of vibrational bands at 785 cm−1 (ω C![[double bond, length as m-dash]](https://www.rsc.org/images/entities/char_e001.gif) O), 865 cm−1 (νs N–CH3), 955 cm−1 (νas CCO), 1006 cm−1 (ν C–O), 1084 cm−1 (ρ CH2), 1164 cm−1 (νas CN), and 3023 cm−1 (δas OH) indicates the formation of a eutectic between choline chloride and urea molecules. Secondly, shifting of vibrational bands occurs from a higher wave number (in reline without moisture) to lower wave numbers (in experimental samples) such as from 1669 cm−1 to 1664 cm−1 (δs NH2), 1446 cm−1 to 1430 cm−1 (ρs NH2), 3349 cm−1 to 3323 cm−1 (νs NH2) and 3421 cm−1 to 3415 cm−1 (νas NH2). All the earlier mentioned bands correspond to NH2 vibrations and their shift indicates the presence of hydrogen bonds between H2O molecules and NH2 which weakens NH2 bonds thus resulting in a red shift of vibrational bands. There is generation of ammonia on heating of the solvent and it remains mostly as ammonium hydroxide and catalyses the hydrolysis of SnCl2 to tin hydroxide. This is further transformed into tin oxide on calcination in air.
O), 865 cm−1 (νs N–CH3), 955 cm−1 (νas CCO), 1006 cm−1 (ν C–O), 1084 cm−1 (ρ CH2), 1164 cm−1 (νas CN), and 3023 cm−1 (δas OH) indicates the formation of a eutectic between choline chloride and urea molecules. Secondly, shifting of vibrational bands occurs from a higher wave number (in reline without moisture) to lower wave numbers (in experimental samples) such as from 1669 cm−1 to 1664 cm−1 (δs NH2), 1446 cm−1 to 1430 cm−1 (ρs NH2), 3349 cm−1 to 3323 cm−1 (νs NH2) and 3421 cm−1 to 3415 cm−1 (νas NH2). All the earlier mentioned bands correspond to NH2 vibrations and their shift indicates the presence of hydrogen bonds between H2O molecules and NH2 which weakens NH2 bonds thus resulting in a red shift of vibrational bands. There is generation of ammonia on heating of the solvent and it remains mostly as ammonium hydroxide and catalyses the hydrolysis of SnCl2 to tin hydroxide. This is further transformed into tin oxide on calcination in air.
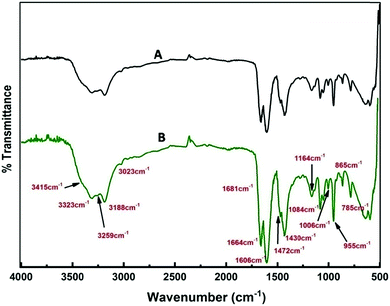 | ||
| Fig. 9 FTIR spectra of (A) only reline and (B) reline containing dissolved SnCl2·2H2O and heated at 80 °C. | ||
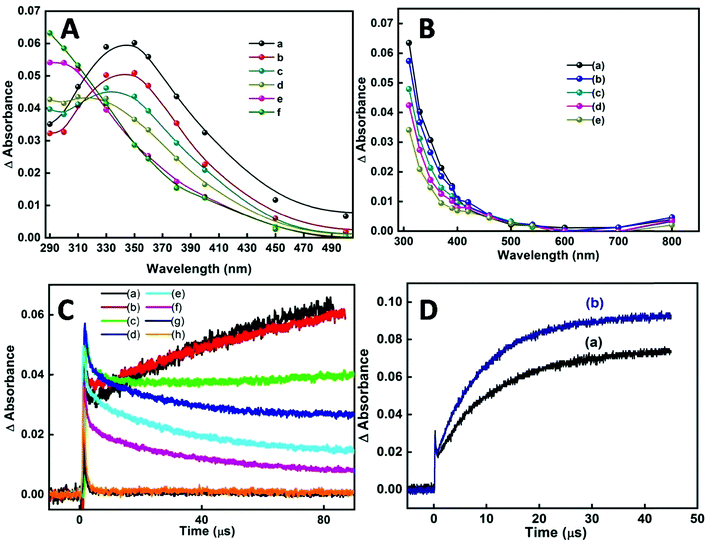
In our earlier transient absorption studies in argon purged neat reline,58 formation of solvated electrons at 760 nm and holes or hole generated species at 340 nm was observed. In the present study both argon purged and N2O saturated reline containing dissolved SnCl2 has resulted in the formation of SnO2 nanoparticles. In both these solutions, pulse radiolysis studies indicate the appearance of a transient peak at around 290 nm (Fig. 10A). Also studies in N2O saturated aqueous solution of tin chloride have shown the appearance of a similar transient peak, probably indicating the formation of the same transient species as that in the SnCl2–reline mixtures (Fig. 10B). At around 100 μs after the electron pulse, an increase in peak intensity at 290 nm with a subsequent decrease of the transient peak at 340 nm occurs in reline containing tin chloride. This is more evident from the decay traces and the formation traces of the new transient in Fig. 10C. This indicates that due to the interaction of reline with radiation initially the hole generated species is formed, which is absorbed at 340 nm. These are responsible for producing the transient absorption at 290 nm, which consequently evolves into the final compound. Furthermore, it was experimentally observed that the hole generated species oxidize in nature as they react with ABTS to form oxidized radical, the ABTS˙+ (Fig. 10D) radical.
Thus, essentially the mechanism of tin oxide nanoparticle generation by electron beam radiation in the reline host matrix is through oxidation caused by the hole generated species. A possible mechanism of formation by both the methods is shown in Scheme 2.
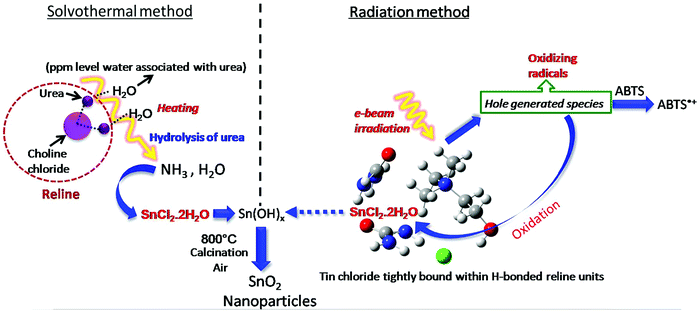 | ||
| Scheme 2 Possible mechanism of formation of tin oxide nanoparticles by solvothermal and radiation methods. | ||
The cytotoxic effect of NPs was evaluated in CHO cells. The results (Fig. 11) indicated a concentration dependent marginal increase in cytotoxicity up to 25 μM while the cells were treated with NPs. A further increase in the concentration of NPs up to 100 μM showed saturation with an overall cytotoxicity of merely ∼30%. From this analysis, it was inferred that lower concentrations of NPs up to 10 μM have negligible toxicity and are suitable for imaging studies.
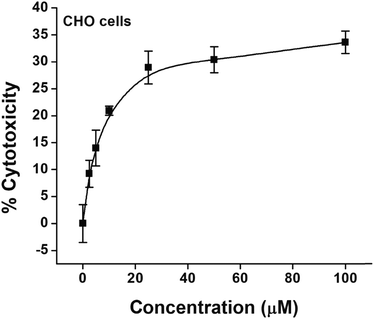 | ||
| Fig. 11 Cytotoxic effects of increasing concentrations of the colloidal solution of SnO2 nanoparticles in CHO cells as determined by the MTT assay. Values are mean ± SEM of three experiments. | ||
To explore the possibility of a highly photoluminescent nature of the synthesized NPs in drug delivery and nanobiomedicines,27,59 cell imaging studies have been carried out. In comparison to untreated control cells, those treated with NPs showed bright blue fluorescence upon excitation using an UV filter (Fig. 12). Notably CHO cells showed only cytoplasmic localization of NPs, whereas A549 cells showed both cytoplasmic and nuclear localization of NPs. The reasons for the differential localization of NPs in tumour versus normal cells are not known. Nevertheless, the localization of NPs in the nucleus of tumour cells gains a lot of significance in view of its probable interaction with genomic DNA. DNA being the most critical target for anticancer drugs, it will be worth examining NPs for anticancer effects in future studies.
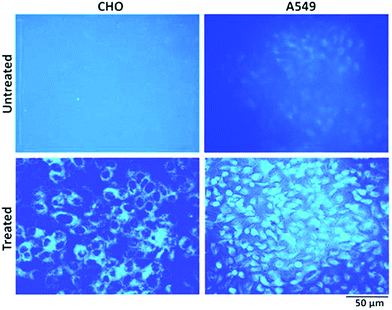 | ||
| Fig. 12 Representative fluorescence images of CHO and A549 cells with and without NP (10 μM) treatment for 24 hours. The images were acquired after excitation using an UV filter. Magnification (10×). | ||
Several metal oxide NPs are found to possess intrinsic antioxidant activity due to their redox active nature.60 Herein free radical scavenging activity of the synthesized tin oxide NPs has been assayed using ABTS. The radical cation ABTS˙+ is blue green in color which gets bleached in the presence of the nanoparticles, indicating the antioxidant activity of NPs.61 The antioxidant properties are mainly either due to hydrogen atom transfer (HAT) or single electron transfer (SET). In the present case there are chances of single electron transfer due to the excess surface electrons or the electrons trapped in defect states present in the NPs. Fig. 13A shows an IC50 value of the NPs of ∼430 μg ml−1. For comparison with a standard antioxidant, the ABTS˙+ scavenging activity of pure ascorbic acid was estimated and its IC50 value was found to be ∼7.5 μg ml−1 (Fig. 13B) following the same procedure. Philip et al. have shown the antioxidant activity of SnO2 by scavenging free radicals of DPPH.62 Selenium nanoparticles (Se NPs) are known to be good antioxidants. Comparing the IC50 value of SnO2 NPs with that of amorphous Se NPs63 shows that the presently synthesized SnO2 performs better.
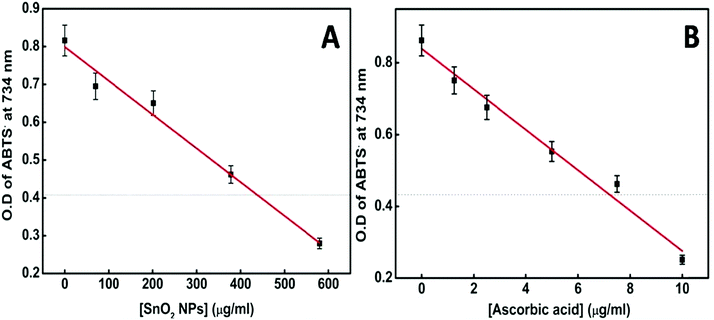 | ||
| Fig. 13 (A) Plot of [SnO2 NPs] vs. OD of the ABTS radical at 734 nm. (B) Plot of [ascorbic acid] vs. OD of the ABTS radical at 734 nm. | ||
4. Conclusions
In summary, DESs can be considered as low-cost versatile green solvents, as well as stabilizing media for the synthesis of nanoparticles. Both e-beam and gamma radiation can be employed to synthesize photoluminescent tin oxide NPs in reline. However, the results have shown that with gamma irradiation no specific morphology is achievable, whereas in the case of e-beam the NPs can attain definite spherical structures. In the e-beam irradiation technique it is preferable to work within the dose range of 70–100 kGy, where both the size and polydispersity of the NPs would be optimum. The solvothermal route also produces photoluminescent SnO2 NPs, however, the morphology consisted of elongated structures. The shape and size of the NPs are very important aspects in most of the biological applications where cellular uptake is necessary.64 Thus, depending on the field of application of the NPs one has to decide whether the e-beam irradiation or solvothermal method would be the method of preference.The photoluminescent SnO2 NPs showed marginal cytotoxicity even up to a concentration of 100 μM, which rendered them safe for cell imaging studies, wherein exciting results could be obtained in tumor cells. Preferential interactions of the NPs with DNA (within nucleus) of cancer cells pave the way for exploring possibilities of their application in anticancer effects or imaging of deep tissues and tumor cells. Recently, nanoantioxidants have been gaining popularity due to their effective performance as therapeutic nanomedicines mainly in neuronal damage caused by oxidative stress, where conventional antioxidants are unable to cross the blood brain barrier.65 The results of antioxidant studies involving the as synthesized SnO2 NPs reveal excellent properties to inhibit oxidative damage by reactive radical species.
Author contributions
Laboni Das conceived the idea, designed and performed the experiments and wrote the manuscript. Linmariya Devassy Koonathan performed the experiments and helped in the literature survey. Amit Kunwar conducted the cytotoxicity and cell imaging experiments and analysed and wrote the results and discussion part of cytotoxicity and cell imaging. Suman Neogy carried out the TEM imaging and EDX analysis of the samples. Anil K. Debnath performed XPS experiments and wrote the XPS portion. Soumyakanti Adhikari supervised the overall project, provided critical feedback and helped with the analysis of the manuscript.Conflicts of interest
There are no conflicts of interest to declare.Acknowledgements
The authors are thankful to the members of the RPCD LINAC facility for their help in the irradiation work, and Mr Amit Kanjilal for the FTIR experiments. The authors thank Mr Sumanta Mukherjee for his help in XRD studies and Rietveld analysis. The authors thank Dr Awadhesh Kumar, Head, RPCD and Dr A. K. Tyagi, Associate Director, Chemistry Group, BARC, for their constant support and encouragement.References
- E. L. Smith, A. P. Abbott and K. S. Ryder, Chem. Rev., 2014, 114, 11060–11082 Search PubMed.
- D. V. Wagle, H. Zhao and G. A. Baker, Acc. Chem. Res., 2014, 47, 2299–2308 Search PubMed.
- D. Mohanta and M. Ahmaruzzaman, RSC Adv., 2016, 6, 110996–111015 Search PubMed.
- R. Medhi, C.-H. Li, S. H. Lee, M. D. Marquez, A. J. Jacobson, T.-C. Lee and T. R. Lee, ACS Appl. Nano Mater., 2019, 2, 6554–6564 Search PubMed.
- S. D. Ponja, B. A. D. Williamson, S. Sathasivam, D. O. Scanlon, I. P. Parkin and C. J. Carmalt, J. Mater. Chem. C, 2018, 6, 7257–7266 Search PubMed.
- K. C. Pradel, Y. Ding, W. Wu, Y. Bando, N. Fukata and Z. L. Wang, ACS Appl. Mater. Interfaces, 2016, 8, 4287–4291 Search PubMed.
- G. Shang, J. Wu, S. Tang, M. Huang, Z. Lan, Y. Li, J. Zhao and X. Zhang, J. Mater. Chem., 2012, 22, 25335–25339 Search PubMed.
- D. Zhao and X. Wu, Mater. Lett., 2018, 210, 354–357 Search PubMed.
- Z. Liu, Z. Cao, B. Deng, Y. Wang, J. Shao, P. Kumar, C. R. Liu, B. Wei and G. J. Cheng, Nanoscale, 2014, 6, 5853–5858 Search PubMed.
- S. Li, Y. Wang, C. Lai, J. Qiu, M. Ling, W. Martens, H. Zhao and S. Zhang, J. Mater. Chem. A, 2014, 2, 10211–10217 Search PubMed.
- S. Ding and X. Wen Lou, Nanoscale, 2011, 3, 3586–3588 Search PubMed.
- Y. Cao, Y. Li, D. Jia and J. Xie, RSC Adv., 2014, 4, 46179–46186 Search PubMed.
- R. Ghosh, A. K. Nayak, S. Santra, D. Pradhan and P. K. Guha, RSC Adv., 2015, 5, 50165–50173 Search PubMed.
- L. Jiang, G. Sun, Z. Zhou, S. Sun, Q. Wang, S. Yan, H. Li, J. Tian, J. Guo, B. Zhou and Q. Xin, J. Phys. Chem. B, 2005, 109, 8774–8778 Search PubMed.
- G. Cheng, J. Wang, X. Liu and K. Huang, J. Phys. Chem. B, 2006, 110, 16208–16211 Search PubMed.
- V. Juttukonda, R. L. Paddock, J. E. Raymond, D. Denomme, A. E. Richardson, L. E. Slusher and B. D. Fahlman, J. Am. Chem. Soc., 2006, 128, 420–421 Search PubMed.
- K. P. Gattu, K. Ghule, A. A. Kashale, V. B. Patil, D. M. Phase, R. S. Mane, S. H. Han, R. Sharma and A. V. Ghule, RSC Adv., 2015, 5, 72849–72856 Search PubMed.
- M. Lai, J. A. Gonzalez Martinez, M. Grätzel and D. J. Riley, J. Mater. Chem., 2006, 16, 2843–2845 Search PubMed.
- Y. Wang, J. Y. Lee and T. C. Deivaraj, J. Mater. Chem., 2004, 14, 362–365 Search PubMed.
- R. Augustine, A. P. Mathew and A. Sosnik, Appl. Mater. Today, 2017, 7, 91–103 Search PubMed.
- A. M. C. Ng, M. Y. Guo, Y. H. Leung, C. M. N. Chan, S. W. Y. Wong, M. M. N. Yung, A. P. Y. Ma, A. B. Djurišić, F. C. C. Leung, K. M. Y. Leung, W. K. Chan and H. K. Lee, J. Photochem. Photobiol., B, 2015, 151, 17–24 Search PubMed.
- S. M. Roopan, S. H. S. Kumar, G. Madhumitha and K. Suthindhiran, Appl. Biochem. Biotechnol., 2015, 175, 1567–1575 Search PubMed.
- M. J. Khan and Q. Husain, Prep. Biochem. Biotechnol., 2014, 44, 558–571 Search PubMed.
- A. B. Seabra and N. Durán, Metals, 2015, 5, 934–975 Search PubMed.
- M. Zimbone, M. A. Buccheri, G. Cacciato, R. Sanz, G. Rappazzo, S. Boninelli, R. Reitano, L. Romano, V. Privitera and M. G. Grimaldi, Appl. Catal., B, 2015, 165, 487–494 Search PubMed.
- H. Dong, J. Lei, H. Ju, F. Zhi, H. Wang, W. Guo, Z. Zhu and F. Yan, Angew. Chem., Int. Ed., 2012, 51, 4607–4612 Search PubMed.
- M. P. Nikolova and M. S. Chavali, Biomimetics, 2020, 5, 27 Search PubMed.
- K. T. Thurn, E. Brown, A. Wu, S. Vogt, B. Lai, J. Maser, T. Paunesku and G. E. Woloschak, Nanoscale Res. Lett., 2007, 2, 430–441 Search PubMed.
- P. Padmanabhan, A. Kumar, S. Kumar, R. K. Chaudhary and B. Gulyás, Acta Biomater., 2016, 41, 1–16 Search PubMed.
- A. Guleria, S. Chakraborty, S. Neogy, D. K. Maurya and S. Adhikari, Chem. Commun., 2018, 54, 8753–8756 Search PubMed.
- T. Mosmann, J. Immunol. Methods, 1983, 65, 55–63 Search PubMed.
- Rodriguez-Carvajal, J. Fullprof 2000 Version 1.6, Laboratoire Leon Brillouin, Gifsur Yvette, France, 2000.
- S. N. Guha, P. N. Moorthy, K. Kishore, D. B. Naik and K. N. Rao, Proceedings of the Indian Academy of Sciences - Chemical Sciences, 1987, 99, 261–271 Search PubMed.
- G. V. Buxton and C. R. Stuart, J. Chem. Soc., Faraday Trans., 1995, 91, 279–281 Search PubMed.
- L. Das, A. Guleria, S. Neogy and S. Adhikari, Colloids Surf., A, 2018, 555, 781–786 Search PubMed.
- A. Guleria, S. Singh, M. C. Rath, A. K. Singh, S. Adhikari and S. K. Sarkar, J. Lumin., 2012, 132, 652–658 Search PubMed.
- A. K. Ganguli, A. Ganguly and S. Vaidya, Chem. Soc. Rev., 2010, 39, 474–485 Search PubMed.
- T. Yang, M. Zhu, K. Gu, C. Zhai, Q. Zhao, X. Yang and M. Zhang, New J. Chem., 2018, 42, 13612–13618 Search PubMed.
- G. Xi and J. Ye, Inorg. Chem., 2010, 49, 2302–2309 Search PubMed.
- G. Xiao, Y. Wang, J. Ning, Y. Wei, B. Liu, W. Yu, G. Zou and B. Zou, RSC Adv., 2013, 3, 8104–8130 Search PubMed.
- K. Momma and F. Izumi, J. Appl. Crystallogr., 2011, 44, 1272–1276 Search PubMed.
- M. Periyasamy and A. Kar, J. Mater. Chem. C, 2020, 8, 4604–4635 Search PubMed.
- D. Schild, in Hydrogen Technology: Mobile and Portable Applications, ed. A. Léon, Springer Berlin Heidelberg, Berlin, Heidelberg, 2008, pp. 575–601 DOI:10.1007/978-3-540-69925-5_23.
- L. Das, A. Guleria, S. Neogy and S. Adhikari, RSC Adv., 2016, 6, 92934–92942 Search PubMed.
- A. Kar, S. Kundu and A. Patra, J. Phys. Chem. C, 2011, 115, 118–124 Search PubMed.
- M. Fang, L. Zhang, X. Tan, X. Hu, W. Yan and P. Liu, J. Phys. Chem. C, 2009, 113, 9676–9680 Search PubMed.
- M. A. Z. G. Sial, M. Iqbal, Z. Siddique, M. A. Nadeem, M. Ishaq and A. Iqbal, J. Mol. Struct., 2017, 1144, 355–359 Search PubMed.
- M. Fang, X. Tan, B. Cheng and L. Zhang, J. Mater. Chem., 2009, 19, 1320–1324 Search PubMed.
- Y. Dai, Y. Zhang, Q. K. Li and C. W. Nan, Chem. Phys. Lett., 2002, 358, 83–86 Search PubMed.
- H. Kaur, H. Bhatti and K. Singh, J. Mater. Sci.: Mater. Electron., 2019, 30, 2246–2264 Search PubMed.
- M. Bhatnagar, V. Kaushik, A. Kaushal, M. Singh and B. R. Mehta, AIP Adv., 2016, 6, 095321 Search PubMed.
- F. Gu, S. F. Wang, M. K. Lü, G. J. Zhou, D. Xu and D. R. Yuan, J. Phys. Chem. B, 2004, 108, 8119–8123 Search PubMed.
- J. X. Zhou, M. S. Zhang, J. M. Hong and Z. Yin, Solid State Commun., 2006, 138, 242–246 Search PubMed.
- L. Das, A. Guleria and S. Adhikari, RSC Adv., 2015, 5, 61390–61397 Search PubMed.
- P. Kumari, Shobhna, S. Kaur and H. K. Kashyap, ACS Omega, 2018, 3, 15246–15255 Search PubMed.
- C. Du, B. Zhao, X.-B. Chen, N. Birbilis and H. Yang, Sci. Rep., 2016, 6, 29225 Search PubMed.
- Y. Zhang, J. Han and C. Liao, J. Electrochem. Soc., 2016, 163, D689–D693 Search PubMed.
- L. Das and S. Adhikari, J. Phys. Chem. B, 2018, 122, 8900–8907 Search PubMed.
- J. K. Patra, G. Das, L. F. Fraceto, E. V. R. Campos, M. d. P. Rodriguez-Torres, L. S. Acosta-Torres, L. A. Diaz-Torres, R. Grillo, M. K. Swamy, S. Sharma, S. Habtemariam and H.-S. Shin, J. Nanobiotechnol., 2018, 16, 71 Search PubMed.
- L. Valgimigli, A. Baschieri and R. Amorati, J. Mater. Chem. B, 2018, 6, 2036–2051 Search PubMed.
- R. Re, N. Pellegrini, A. Proteggente, A. Pannala, M. Yang and C. Rice-Evans, Free Radical Biol. Med., 1999, 26, 1231–1237 Search PubMed.
- V. K. Vidhu and D. Philip, Spectrochim. Acta, Part A, 2015, 134, 372–379 Search PubMed.
- A. Guleria, D. K. Maurya, S. Neogy, B. S. Raorane, A. K. Debnath and S. Adhikari, New J. Chem., 2020, 44, 4578–4589 Search PubMed.
- S. Dasgupta, T. Auth and G. Gompper, Nano Lett., 2014, 14, 687–693 Search PubMed.
- R. Sandhir, A. Yadav, A. Sunkaria and N. Singhal, Neurochem. Int., 2015, 89, 209–226 Search PubMed.
Footnote |
| † Electronic supplementary information (ESI) available. See DOI: 10.1039/d1ma00042j |
| This journal is © The Royal Society of Chemistry 2021 |

