Harvesting graphene oxide – years 1859 to 2019: a review of its structure, synthesis, properties and exfoliation
P. P.
Brisebois
and
M.
Siaj
 *
*
Department of Chemistry, Université du Québec à Montréal (UQÀM)/NanoQÀM-CQMF, 2101, Jeanne-Mance street, Montreal, QC H2X 2J6, Canada. E-mail: siaj.mohamed@uqam.ca; Fax: +1 (514) 987-4054; Tel: +1 (514) 987-3000 ext. 1921
First published on 10th December 2019
Abstract
In recent years, multilayered graphite oxide and graphene oxide (GO) have attracted considerable attention in fields such as physics, chemistry, biology and materials sciences in general, because they are important building blocks and promising routes towards the large-scale production of graphene, the “wonder material”. This review provides an exhaustive survey of the synthetic methods developed during the last 160 years for the preparation of GO and focuses especially on the work done more recently. The numerous state-of-the-art synthetic methods (>50) are reviewed and regrouped under eight (8) major categories: those which use oxidative (i) chemical, (ii) electrochemical and (iii) microbial exfoliation methods for graphite, for (iv) 3D-carbon structures and for (v) 2D-graphene. Other routes such as (vi) chemical vapor deposition (CVD) methods for hydrocarbon, (vii) hydrothermal methods for carbohydrate and finally, (viii) thermal decomposition methods for organic matter rich in carbon are also covered. Emphasis is placed on the molecular structure of graphene oxide, synthetic methods, impurities, properties, mechanistic insights, reagents, different carbon precursors, its purification, the exfoliation process and finally, its fractionation by size. This review will be a valuable guide (>200 references) for synthetic and materials scientists/engineers in the field of graphene oxide production.
1 Introduction
In 2019, planning to review the synthetic methods for the preparation of graphene oxide (GO) is quite challenging because excellent books1–3 and reviews4–8 have already been published in the last few years. A considerable amount of planning and literature search was necessary to avoid repeating the information so well retrieved by others who focused primarily on the history of the preparation of GO, the mechanism of the oxidative chemical exfoliation of graphite (Gr), the characterization of GO, its properties, its scope of applications and its chemical functionalization. Despite the efforts of other reviewers to describe and compare the early structural models of GO from a historical point of view, in our opinion, none of them were able to overview all the aspects of its structure with accuracy in accordance with the fundamental aspects of carbon chemistry because they failed to point out the fact that the models share a common flaw: according to the octet chemical rule of thumb, each carbon atom should make four bonds with its surrounding. Unfortunately, every structural model (Fig. 1) that has been proposed or reviewed over the last 80 years shows implicit CH and CH2 groups by omitting to draw the hydrogen atoms in the model and none of the reviews have reported any explanation or alternative to this omission or have reported inclusion of such C–H bonds in their model (Fig. 1-red circles). This fundamental aspect can be useful to clarify the chemical nature of GO, especially for multidisciplinary researchers in cross-disciplines who are not experts in chemistry, therefore it needs an explication. Perhaps, the answer to this is that researchers just don't know if hydrogen attached to carbon atoms are present in GO. Hydrogen content is very low in GO and most of the characterization techniques are not sensitive enough to detect it directly with accuracy. Also, the presence of carbon radicals (seven-electron species) stabilized by conjugation with the π system could also give some part of the explanation for the missing elements. Considering these aspects, herein, we present a useful complement to the fundamental aspects of GO concerning its structure and chemistry.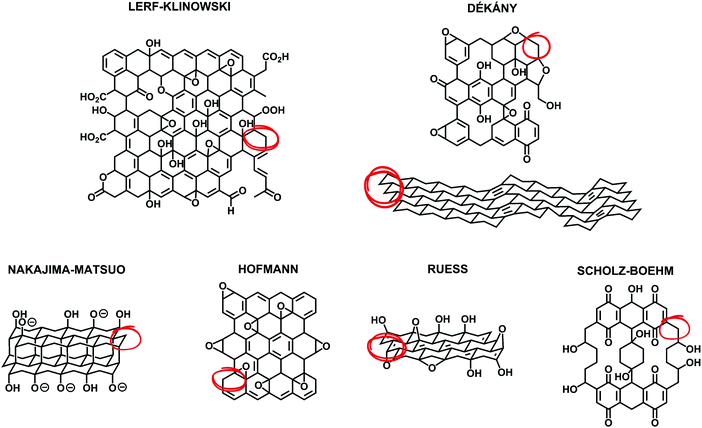 | ||
| Fig. 1 Summary of structural models of GO that have been proposed, including modern examples (top: Lerf–Klinowski and Dékány models) as well as earlier examples (bottom: Nakajima–Matsuo, Hofmann, Ruess, and Scholz–Boehm models). Reproduced (adapted) from ref. 6 with permission from the Royal Society of Chemistry. | ||
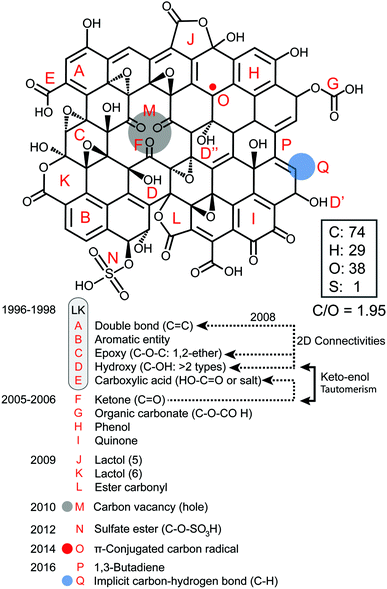
First, we present a structural account for a nanosheet of graphene oxide (Fig. 2) based on earlier and more modern models1–12 and updated with new claims that have been supported more recently with strong experimental evidence from other top researchers.13–22 Our account illustrates most of the acknowledged observations made on the structure of GO with a C/O ratio of ∼2, including the presence of carbon vacancies,17 sulfate esters,18,19 carbon radicals,20 C–H bonds,21 and allylic alcohols,22 regardless of the fact that most of these aspects (A–P) were not intended initially to explain the same model. GO is a complex macromolecule and different models are used to explain its structure with contradictions, a dazzling confusion. Our structural account is proposed to facilitate the integration of knowledge because all the possible functionalities are fitted in the same frame composed of 74 atoms of carbon, 38 atoms of oxygen, 29 atoms of hydrogen and 1 sulfur atom.
In the core of this review, we present the principal chemical and physical characteristics of GO with a focus on the fundamentals of stacking and interactions of GO in the solid state and in colloidal suspensions. Also, we adopt a benchmark approach by highlighting the relationships between methods–chemical composition–properties of GO, with special attention given to oxygen atoms, heteroatoms and metallic impurities. The methods are regrouped into two useful lists of chemicals. The first for covering the aspects of the oxidative exfoliation of graphite that have been published in the literature in the last 160 years, with special attention to the ones that have not been included by other reviewers.1–8 Then, the second list is to cover the synthesis from other carbon precursors besides graphite and novel methods towards GO that have been developed recently, mostly in the last decade. Overall, we present a total of more than 50 original ways to prepare graphene oxide-based materials from the nanogram to the multigram scale. The data are presented in two (2) tables that report some physical properties of GO such as the morphological shape, the number of layers (#), the lateral size of the sheets and the C/O ratio of the materials (when available). Characterization data such as solid state nuclear magnetic resonance (SS-NMR), scanning and transmission electron microscopy (TEM, SEM), thermogravimetric analysis (TGA), X-ray photo emission spectroscopy (XPS) and atomic force microscopy (AFM) are presented, not in a separate section, but in integration all along the review as a way to illustrate and to support scientifically the claims made on GO case by case. The final section is devoted to bringing the most recent advances in the post-synthesis physical treatments used for complete exfoliation of GO to monolayers, for its purification and its fractionation by size. Moreover, techniques such as acoustic cavitation/sonication, shearing stress, freeze-drying, micro bubbling, sedimentation, centrifugation, filtration and fractionation of GO by size are described to help the chemist harvesting monolayers of GO with yield, purity. This guide is very valuable from a synthetic point of view, especially for tailoring GO and targeting specific applications.
2 Structural accounts for graphene oxide
2.1 Lerf–Klinowski model
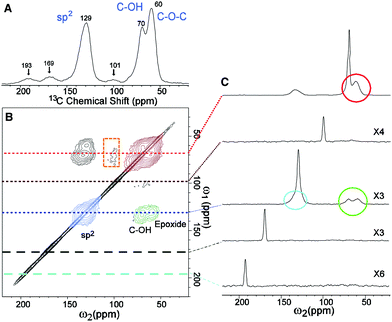
The popular model that accounts for most of the experimental observations about GO prepared from the oxidative chemical exfoliation of graphite using potassium permanganate as an oxidizer was proposed by Lerf–Klinowski (LK) in the late 1990s (Fig. 1).9–12 Using mostly carbon-13 and hydrogen-1 solid state nuclear magnetic resonance (SSNMR), Fourier transform infrared spectroscopy (FTIR) and chemical derivatization of graphite oxide with reagents having a well-known mechanism of action, LK concluded that the structure of GO contains two kinds of regions: regions with aliphatic six-membered rings and aromatic regions with non-oxidized benzene rings. The relative size of the two regions depends on the degree of oxidation of the compound. As shown in Fig. 2, the surface of the monolayer is composed mainly of double bonds (A), aromatic entities (B) and epoxide groups (C) which give rise to a nearly flat carbon grid; only carbon atoms attached to hydroxy groups have a slightly distorted tetrahedral configuration, resulting in some wrinkling of the monolayer. The oxo functionalities lie above and below the carbon grid forming a layer of oxygen atoms of variable concentrations with a large number of epoxide (1,2-ether) (C) and C–OH (D, D′, D′′) groups (more than two types) very close to one another. It is not necessary for the distribution of functional groups in every oxidized aromatic ring to be identical, and both the oxidized rings and aromatic entities are distributed randomly. The structure of GO terminates with C–OH (D') and COOH (E) groups, which could also explain the acidity of the compound. More recent experiments based on chemical derivatization using a Claisen-type rearrangement22 was also used to show the presence of allylic alcohol (D′′) on the surface of graphite oxide. 13C-labeled GO with modern multidimensional SS-NMR methods provided new information on the bonding arrangements of atoms and their 2D connectivities.13 Cai and collaborators observed a strong peak correlation (Fig. 3) between 13C-sp2 (131 ppm), 13C-epoxide (60 ppm) and 13C–OH (70 ppm) groups which gives more direct evidence that a large fraction of those atoms was chemically bonded to each other, in accordance with the LK model.2.2 Dékány model
Later on, other important aspects of the structure of GO were described by Dékány and collaborators14,15 who identified with no doubt the presence of other oxo functionalities such as a ketone (F), organic carbonate (G), phenol (H) and quinone (I). In their original reports, Dékány and collaborators proposed a modified version of the Scholz–Boehm model to support their new observations. Noteworthily, in their work, GO was prepared using a different method (potassium chlorate oxidation), and hence, had a different chemical composition. Both models are considered plausible, but Dékány's is more specific for GO with a higher level of oxidation, while LK's is more general and suitable for most types of GO.13,16 There are major discrepancies between the two models. But one is based on how GO terminates (hydroxy or ketone). Ketone and enol are said to be tautomers of each other and their interconversion involves the movement of an α-hydrogen and the shifting of bonding electrons, which depends on many factors such as the pH, the amount of water trapped inside GO and the temperature. Carbon-13 (13C) solid state nuclear magnetic resonance spectra (13C-SS-NMR/MAS) of GO (Fig. 4) have poor signal-to-noise ratios, which can explain why LK, back in the 1990s, did not explicitly detect the presence of minor constituents like ketone or enol. In that context, it is plausible to include both (F, D′′) in the model to terminate GO. Furthermore, Cai and collaborators observed no visible cross peaks between 13C-sp2 (129 ppm) and the other minor components at 169 and 193 ppm (13COOH, 13C![[double bond, length as m-dash]](https://www.rsc.org/images/entities/char_e001.gif) O). These results imply that carboxyl (E) and carbonyl (F) groups are spatially separated from a majority of the carbon atoms attributed to the functionalities (A, C, D) found on the surface. Therefore, in Fig. 2, carboxylic acid (E) and ketone (F) groups are located on the periphery of GO, terminating the edge of the flake or the grid-hole (M). Important insights into the GO structure were revealed also by Gao and collaborators.16 Based on SS-NMR and cross polarization techniques, they were able to identify the presence of other minor components: non-protonated carbon species around 100 ppm. According to them: “appropriately substituted five (5)- and six (6)-membered-ring lactols (J, K) along the periphery are the most likely structures in GO to be responsible for this signal.” In addition, they were also able to identify ester carbonyl (L) signals at 167 ppm. They explain their origin from the presence of numerous tertiary alcohols in GO that allows for the possibility of some of them to react with nearby carboxylic acids to form ester groups on the periphery, either on the same GO sheet or an adjacent sheet. The full chemistry of GO is not fully understood, and the general LK model should also be updated with important aspects previously unknown in the structure of GO such as carbon vacancies (M), sulfate ester (N), π-conjugated carbon radicals (O), implicit C-H bonds (P) and 1,3 butadiene systems (Q), which would better describe its chemical reactivity.
O). These results imply that carboxyl (E) and carbonyl (F) groups are spatially separated from a majority of the carbon atoms attributed to the functionalities (A, C, D) found on the surface. Therefore, in Fig. 2, carboxylic acid (E) and ketone (F) groups are located on the periphery of GO, terminating the edge of the flake or the grid-hole (M). Important insights into the GO structure were revealed also by Gao and collaborators.16 Based on SS-NMR and cross polarization techniques, they were able to identify the presence of other minor components: non-protonated carbon species around 100 ppm. According to them: “appropriately substituted five (5)- and six (6)-membered-ring lactols (J, K) along the periphery are the most likely structures in GO to be responsible for this signal.” In addition, they were also able to identify ester carbonyl (L) signals at 167 ppm. They explain their origin from the presence of numerous tertiary alcohols in GO that allows for the possibility of some of them to react with nearby carboxylic acids to form ester groups on the periphery, either on the same GO sheet or an adjacent sheet. The full chemistry of GO is not fully understood, and the general LK model should also be updated with important aspects previously unknown in the structure of GO such as carbon vacancies (M), sulfate ester (N), π-conjugated carbon radicals (O), implicit C-H bonds (P) and 1,3 butadiene systems (Q), which would better describe its chemical reactivity.
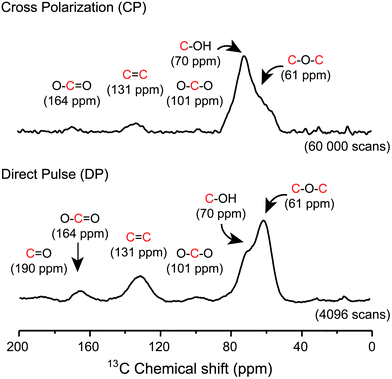 | ||
| Fig. 4 1H–13C cross-polarization (CP) and direct pulse (DP) 13C–1H decoupled SS-NMR spectra of graphene oxide. 13C-SS-NMR/MAS spectra were recorded at frequencies of 150.874 MHz for 13C and 599.84 MHz for 1H using a 4 mm magic-angle spinning (MAS) double resonance probe and a zirconium oxide rotor for NMR analysis. Magic angle spinning was performed at a spinning frequency of 12.5 kHz. Typically, 80 mg of dry GO material was used in the sample and 60 000 and 4096 scans were recorded respectively for CP and DP to achieve the desired spectral resolution. All spectra were collected at room temperature (23 °C). Data were analyzed using the Mestrenova® software (Mestrelab research). Exponential line broadening functions of 50 Hz were applied to the MAS spectra and chemical shifts were referenced relatively to adamantane (38.25 ppm). Cross-polarization-13C-SS-NMR/MAS experiments were carried out using a spectral width of 75 kHz, radio-frequency fields of 75 kHz for 13C and 87.5 kHz for 1H with a 30% ramp, a 500 μs contact time, a 3 s recycle delay and an acquisition time of 20 ms. Direct pulse-13C-SS-NMR/MAS spectra were recorded using a broadband proton decoupling at a RF field of 87.5 kHz during acquisition, with a spectral width of 75 kHz, a 90° pulse length of 3.3 μs, a 20 s recycle delay and an acquisition time of 20 ms. Reproduced from ref. 21 with permission from Wiley-VCH. | ||
2.3 Structural holes
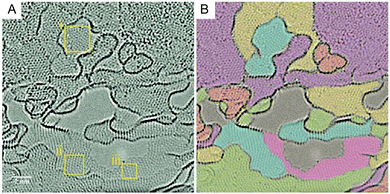
Using high resolution transmission electron microscopy (TEM) with a quasi-atomic resolution, experimental observations showed not only that its local chemical structure is composed of two kinds of regions (graphitic and oxidized regions), the way LK described, but also that holes (M) under 5 nm2 are found throughout the sheet (Fig. 5 and 6). This is explained from the release of CO and CO2 during the aggressive oxidation and sheet exfoliation. Supported by XPS analysis, observations showed that carbonyl (F) groups likely form at the edges of the observed holes within the GO sheet.17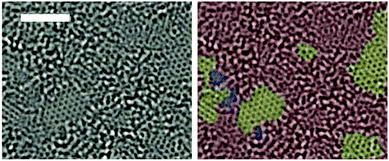 | ||
| Fig. 5 Aberration-corrected TEM images of a single suspended sheet of GO. Scale bar, denoting two (2) nanometers, is valid for all images. On the right, holes are indicated in blue, graphitic areas in yellow, and high contrast, disordered regions, indicating oxygen functionalities, in red. Reproduced (adapted) from ref. 17 with permission from Wiley-VCH. | ||
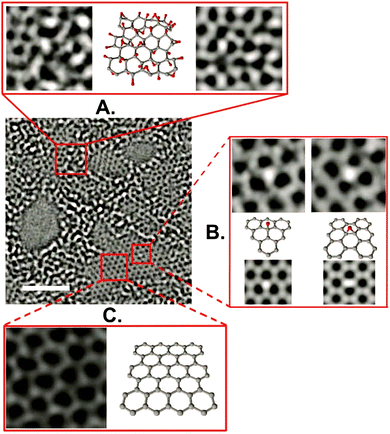 | ||
| Fig. 6 Aberration-corrected TEM image of a single sheet of suspended GO. The scale bar is 2 nm. Expansion (a) shows, from left to right, a 1 nm2 enlarged oxidized region of the material, then a proposed possible atomic structure of this region with carbon atoms in gray and oxygen atoms in red, and finally the average of a simulated TEM image of the proposed structure and a simulated TEM image of another structure where the position of oxidative functionalities has been changed. Expansion (b) focuses on the white spot on the graphitic region. This spot moved along the graphitic region but stayed stationary for 3 frames (6 seconds) at a hydroxyl position (left portion of expansion (b)) and for 7 frames (14 seconds) at a (1,2) epoxy position (right portion of expansion (b)). The ball-and-stick figures below the microscopy images represent the proposed atomic structure for such functionalities. Expansion (c) shows a 1 nm2 graphitic portion from the exit plane wave reconstruction of a focal series of GO and the atomic structure of this region. Reproduced from ref. 17 with permission from Wiley-VCH. | ||
2.4 Organosulfates
Also, Tour and collaborators have shown that covalent sulfate groups are formed by the nucleophilic attack of sulfuric acid or hydrogen sulfate at newly formed epoxide groups (C) in the course of graphite oxidation using Hummers' method (Scheme 1). Because sulfate ester groups (N) hydrolyze only very slowly, they remain in the chemical structure of GO.18,19 TGA-MS data show that a weight loss of about 15% that is due to SO2 formation and the low formation temperature (200–300 °C) of SO2 is consistent with the decomposition of organosulfates (Fig. 7).19 | ||
| Scheme 1 Organosulfates present in GO prepared via the Hummers’ method have been shown to be susceptible to hydrolysis, leading to the formation of acidic sulfate species in the final product. Reproduced from ref. 6 with permission from the Royal Society of Chemistry. | ||
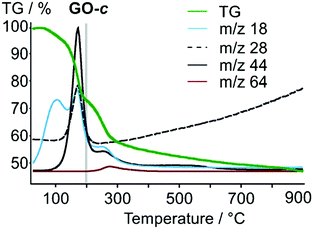 | ||
| Fig. 7 TGA-MS analysis of GO; m/z 18, H2O; m/z 28, CO; m/z 44, CO2; m/z 64, SO2. Reproduced from ref. 19 with permission from Wiley-VCH. | ||
2.5 Radicals
Although these functionalities (A–N) reasonably interpret the individual physical properties of GO such as its acidity and basicity, and its electric, reductive and hydrophilic features, they cannot provide an appropriate understanding of some experimental results, such as the ability of GO to trigger chemiluminescence of luminol for example. Using electron paramagnetic resonance (EPR), Yang and collaborators were able to detect a large number of π-conjugated carbon radicals (O) at the π-network plane when GO was freshly prepared. They explained it by the action of hydrogen peroxide used to neutralize the excess of permanganate ions during the work-up. H2O2 also reacts with GO by the addition of hydroxyl radicals to the double bonds of the disrupted π-network plane. The carbon radicals are temporarily stabilized by conjugation, giving a strong non-splitting EPR signal (Fig. 8).20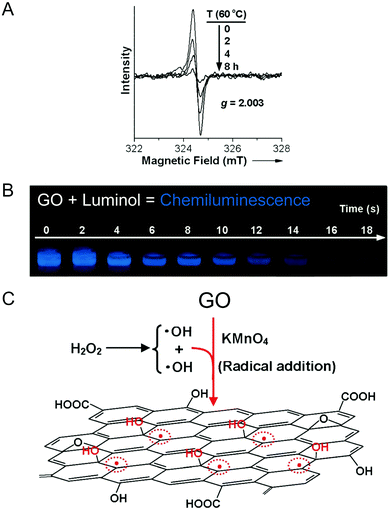 | ||
| Fig. 8 (A) The time-dependent evolution of the EPR spectrum of GO (0.24 mg mL−1) at an elevated temperature of 60 °C, (B) the strong and long-lasting visible chemiluminescence produced by the addition of luminol to a GO solution and (C) the proposed mechanism for the formation of π-conjugated carbon radicals by the addition of hydroxyl radicals. Reproduced (adapted) from ref. 20 with permission from Wiley-VCH. | ||
2.6 Conjugated double bonds
Using chemical derivatization (Diels–Alder (DA) reaction) and 13C-SS-NMR, good experimental evidence was obtained for a [4+2] cycloaddition between GO and maleic anhydride (Scheme 2).21 This reopens the fundamental question of LK, about the presence or not of conjugated double bonds in the structure of GO.9 According to experimental data, only 1,3-butadiene systems (P) substituted with implicit hydrogen atoms (C–H bonds) (Q) located at the edge of the flake or close to a grid-hole (M) can explain the new signal observed in the alkane region at 30 ppm in the 13C-SS-NMR spectrum after the DA reaction. This indirectly proves the existence of protonated carbons in the structure of GO. Therefore, an updated LK model of GO should include this new aspect that explains in a better way how GO terminates in accordance with the octet rule.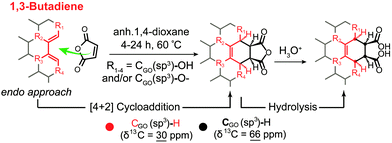 | ||
| Scheme 2 Proposed mechanism and product structures for the Diels–Alder reaction between a 1,3-butadiene system located at the edge of GO and maleic anhydride. Reproduced from ref. 21 with permission from Wiley-VCH. | ||
2.7 Allylic oxygen
The covalent functionalization of soluble, exfoliated graphite oxide through a Claisen rearrangement (Scheme 3)22 shows the evidence of the allylic alcohol functional groups found on the surface of GO. Allylic alcohol groups are converted into vinyl allyl ethers when heated with the vinyl transfer reagent N,N-dimethylacetamide dimethyl acetal (DMDA), and allylically transposed in a sigmatropic-type fashion to form new carbon–carbon bonds. As a direct result, robust carboxylate groups are installed on the surface by saponification, which can undergo subsequent synthetic manipulations.22 | ||
| Scheme 3 Allylic oxygen to carbon bond transposition on graphite oxide (additional substrate oxygen groups have been removed for clarity). Reproduced from ref. 22 with permission from Wiley-VCH. | ||
3 Chemical and physical properties of graphene oxide
3.1 Oxygen groups
Graphene oxide is a carbon-based amorphous compound with a two-dimensional (2D) structure containing oxo functionalities and hydrogen atoms. GO has a non-stoichiometric general formula of the type CxHyOz. On average, the amount of hydrogen in the formula is estimated to be y = 0.8 and the carbon-to-oxygen (C/O) atomic ratio (x/z) can vary generally from 1.5–2.5 (z = 1).23 However, some authors have reported lower and higher values.24,25 The atomic composition of GO can be determined by energy dispersive spectroscopy (EDS), combustion elemental analysis and high-resolution X-ray photoelectron spectroscopy (XPS). XPS deconvolution is also used to calculate the amount of individual oxygen functionalities of GOs.26 To evaluate the C/O ratio and to compare the GO materials obtained from different synthetic methods and conditions, XPS survey scan is used to provide information about the presence of any element on the materials. Based on Fig. 9,25 the XPS survey spectra indicated obvious peaks of carbon (282–292 eV) and oxygen (529–539 eV) elements on graphite, GO-ST (Staudenmaier), GO-HO (Hofmann), GO-HU (Hummers) and GO-TO (Tour). The low atomic C/O ratios (∼2) observed for all the GO materials indicated successful and extensive oxidative treatments. Overall, the permanganate (GO-HU and GO-TO) oxidation methods showed a higher extent of oxidation compared with the chlorate (GO-ST and GO-HO) oxidation. Elemental analysis of GO-ST and GO-HO has also indicated that sulfur and nitrogen were not detected for the two materials. However, GO-HU showed the presence of these two elements.24 More details about each method are given in Section 4.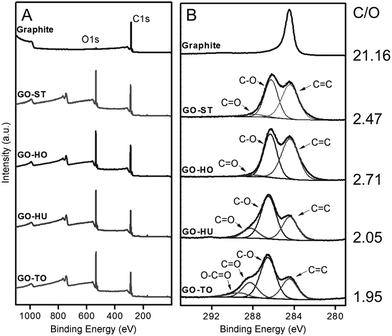 | ||
| Fig. 9 X-ray photoelectron spectra of graphite, GO-ST, GO-HO, GO-HU, and GO-TO. (A) Survey and (B) C1s core-level spectra. Reproduced from ref. 25 with permission from Wiley-VCH. | ||
Thermogravimetric analysis (TGA) of GO shows major weight losses between 150 and 300 °C, which corresponds to CO, CO2, and steam release from the most labile functional groups. Between 400 and 950 °C, a slower mass loss was observed and is attributed to the removal of more stable oxygen functionalities. By TGA, GO-HU has a smaller weight loss than GO-TO. 13C-SS-NMR suggests that the order of overall oxidation in GO-HU is smaller than in GO-TO. The simplest measure of oxidation is the ratio between the alcohol/epoxide signal and the graphitic sp2 carbon signal. This ratio is the highest for GO-TO and lowest for GO-HU. It is also noteworthy that GO-TO appears to have more epoxide functionalities than either of the other GOs.27 The use of permanganate oxidants generates distinctive oxygen functionalities that do not arise from other sources. Specifically, the increased presence of carbonyl and carboxyl groups on GO, which is a unique phenomenon for the materials prepared through the Hummers’ and Tour methods, affects directly the pKa of GO and the pH of its suspension in water. Furthermore, the oxygen functionalities are electrochemically active and have different reduction potentials. Those differences in oxygen composition give a distinct electrochemical behavior for GO prepared through the permanganate oxidant routes (Hummers and Tour) compared with those prepared using chlorate oxidants (Staudenmaier and Hofmann).28 The C/O ratio of GO is an important parameter that affects directly the number of oxygen atoms attached to the carbon, through modifying its hydrophobicity, the way it interacts in colloids, its chemical reactivity, its sheet resistance (MΩ), and the way it stacks over itself in the solid state (interlayers).4–7,29
3.2 Reduced form of GO
For tailoring materials with properties as close to pristine graphene as possible, exhaustive research has been done to remove the oxygen functional groups from GO.30 This reduction can be accomplished by means of microorganisms,31 chemicals,23 electrochemistry,7,32 heat,4,7 UV,2,4 microwave irradiation33 or ion bombardments34 to get tunable properties mostly for applications in electronics.5,6,35 The key designs include the C/O ratio of the end product (graphene-rGO), selective removal of a single type of oxygen group (hydroxyl vs carboxylic acid vs epoxy, etc.), healing of the surface defects from oxidation, and choice of green and safe conditions, as well as maintaining or improving the desired chemical and physical properties of GO (mechanical strength, conductivity, optical properties, solubility/dispersibility of nanosheets, etc.).36After the reduction process using thermal (T) exfoliation, TEM micrographs of TrGO-ST, TrG-HO and TrG-HU display wrinkles, single-to-few layer rGO sheets which are typical of graphene, indicating an effective exfoliation of GO. Scanning electron microscopy (SEM) and transmission electron microscopy (TEM) analyses show no major differences in the morphologies between methods.24 From the Raman measurements, it can be concluded that TrGO-ST is capable of producing GO with the lowest density of defects.24 When the classical reductive agent hydrazine is used, there is larger variability in composition and properties of rGO obtained from GO prepared by various oxidation methods. The C/O ratios for chemically reduced GO (CrGO) are in the range between ∼4 and ∼11. On the other hand, the ratios for thermally reduced GO (TrGO) are much higher ranging from ∼22 to ∼50. CrGO also contains higher amounts of nitrogen (N) and hydrogen (H) compared to TrGO. This originates from unintentional doping by nitrogen using hydrazine as a reducing agent. Electron spectroscopy chemical analysis of CrGO shows lower nitrogen content for CrGO-HU compared to CrGO-TO. The highest C/O ratio was found for TrGO-HU and TrGO-TO synthesized from highly oxidized graphite oxides. GO prepared by permanganate methods contains high concentration of thermally labile ketone and carboxylic acid functionalities which easily undergo decomposition under the formation of CO2 and suppression of oxygen concentration. In comparison, the chlorate-based GO contains predominantly hydroxyl functional groups which have significantly higher thermal stability. Low surface areas were also observed on CrGO-BR and CrGO-HO prepared by the chlorate methods. CrGO originating from GO prepared by permanganate methods exhibits surfaces that are comparable to TrGO. The exfoliation of CrGO is significantly higher for the samples originating from GO prepared by permanganate routes compared to chlorate methods. The main exception from all trends is rGO-ST showing a lower degree of oxidation leading to a markedly lower degree of exfoliation and subsequently to higher differences in the observed properties such as surface area, stability towards oxidation and others. Interestingly, all rGO have comparable HET rates using a [Fe(CN)6]−3 redox probe.37
The correlations between the oxygen content and the properties of GO and rGO are important benchmarks when utilizing GO in practical applications. Electronic conductivity is one of the important properties of graphene-like materials. It is evaluated using four-point probe measurements.27 The electrical conductivity of GO is dramatically decreased when the oxygen content exceeds 25 wt%. For a medium oxygen content (30–40 wt%), rGO shows better conductivity than GO. By contrast, for a low oxygen content (10–20 wt%), the conductivity of rGO is less than that of GO. Incomplete recovery of the sp2 domains and defects would inhibit the electron conductivity of rGO. As the oxygen content of the original GO increases, irreversible damage of the graphene structure occurs during the reduction and the electrical conductivity of the end-product (rGO) is affected. The surface area and electrical conductivity of a material are closely related to the capacitance. Because of its high surface area, moderate conductivity, and low oxidizing ability, rGO with 20–40 wt% oxygen content has practical applications such as in electric double-layer capacitors, thermoconductive films, reinforcing layers of polymers, support materials of catalysts, and biosensors.30
By comparing the electrical conductivity of CrGO and CrGO treated thermally (TCrGO) prepared from both the Hummers’ and Tour methods, Tour and collaborators showed that CrGO-HU-based devices exhibited conductivity values of 0.05 S cm−1, whereas CrGO-TO monolayers were about twice as conductive (0.1 S cm−1). Since hydrazine alone in the reduction is not sufficient to achieve high conductivities of the rGO flakes, CrGO is treated thermally by annealing in Ar/H2 at high temperatures. All TCrGO exhibit similar increases in conductivities up to 350–375 S cm−1 (TCrGO-HU), and 400 S cm−1 (TCrGO-TO).27 Furthermore, it was found that the type of GO precursor has a major influence on the level of doping. Due to the differences in the structures of GO-ST, GO-HO and GO-HU, GO-HU can be thermally doped in the presence of ammonia gas with the highest amount of nitrogen (7.2 at%) and GO-ST can be doped with the lowest amount of nitrogen (0.94 at%).38 A similar trend is also observed for sulphur-doped graphene in the presence of H2S, SO2 or CS2 gas.39 This has eminent implications for any application of graphene in electrochemical devices for energy storage and sensing applications.24
3.3 Impurities
Heating GO under a controlled atmosphere liberates not only simple molecules (CO2, CO, H2O) but also many volatile organic compounds (VOCs) and radicals that recombine to form more complex organic molecules. These emissions have an impact on the toxicity of the products of graphene on a larger scale and they are analysed and quantified by gas chromatography (GC) techniques coupled with a mass spectrometer (MS). The main differences in the composition of gaseous products can be seen for the GO-BR. The Brodie oxidation procedure is based on the oxidation of graphite by potassium chlorate in fuming nitric acid. In this case no significant amount of sulphur was detected in GO. All other methods (Hummers, Hofmann, and Staudenmaier, Tour), which also use sulfuric acid in addition to HNO3, led to GO containing S, mainly in the form of sulfuric acid esters, which decompose into SO2, CS2 and some organosulfur compounds such as thiophene, benzothiophene, and dibenzothiophene. Chlorine present in the GO is evolved in the form of chlorobenzene and nitrogen in the form of nitrile groups attached to hydrocarbons such as 2-propenenitrile and benzonitrile. Nitrogen originates from the nitrogen moieties introduced by the presence of nitric acid (or sodium nitrate in the case of the Hummers’ method).26
Metallic contamination with elements other than the heteroatoms associated with the oxidation methods is found in GO. Elements such as As, Co, Cr, Cs, Cu, Fe, Sb, and Sc are also introduced into the GO-HU sample after the oxidative treatment. The origin of most of these elements is likely the chemical reagents. For example, ICP and optical emission spectrometry (OES) data of KMnO4 and NaNO3 showed the presence of eight metallic elements (Ca, Co, Cr, Cu, Fe, Ni, Pb, and Zn). With regard to the oxidative methods, GO-ST shows only slight changes in the metallic contents when compared to the precursor graphite. However, substantial decreases in the metallic contents were observed with GO-HU from natural graphite. Atomic absorption spectroscopy (AA) of GO-ST revealed 11 different trace metallic elements similar to those in GO-HU, with a total of 15 metallic elements. The decreased amounts of impurities in GO-ST compared with GO-HO can be attributed to the use of fuming nitric acid much more corrosive and effective at removing metal in the Staudenmaier method than the concentrated nitric acid used in the Hofmann method.44 Other treatments for reducing the amount of metallic impurities are based on (i) soaking and refluxing in an aqua-regia mixture; (ii) sonication in a mixture of hydrogen peroxide and hydrochloric acid; and (iii) thermal treatment in a Cl2 atmosphere.45
3.4 Stacking
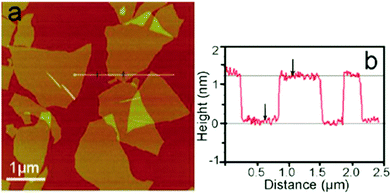 | ||
| Fig. 10 (a) A tapping mode AFM image of graphene oxide (GO) sheets on a mica surface, (b) the height profile of the AFM image. Reproduced from ref. 48 with permission from the Royal Society of Chemistry. | ||
Very similar in structure and chemical composition, graphite oxide, its multilamellar-parent compound, is composed of many layers of GO stacked one over the other with a sheet interlayer distance of approximately 0.7–1.0 nm. Oxidation methods showed a variation in the spacing between the graphene layers. The GO prepared using the Tour method (GO-TO) exhibits the largest distance between graphene layers (0.95 nm),27 followed by the Hummers’ method (GO-HU) with a value of 0.8133 nm, and the Hofmann method (GO-HU) at 0.7226 nm. The smallest spacing was found in the Staudenmaier method (GO-ST) at 0.7084 nm.24Fig. 11 shows how GO sheets stack one over the other to form thicker and thinner regions via hydrogen bonding mostly.49 Water molecules, reagents, inorganics, metals, ions34,50 and polar solvents can bind tightly to the structure of GO increasing the interlayer as well.51 When the stacking involves two (2) sheets of GO, the system is called a bi-layer and when three (3) sheets are involved, it's called a tri-layer. When the stacking involves four (4) to ten (10) sheets, the system is usually called few-layer; above ten (10) layers, it is referred to as a multilayer, multilamellar or graphitic system.7
3.5 Interactions
 | ||
| Scheme 4 Dissociation of GO in water. Reproduced from ref. 65 with permission from the Royal Society of Chemistry. | ||
 | ||
| Fig. 12 Scheme showing the chemical route to the synthesis of aqueous graphene dispersions. (1) Oxidation of graphite (black blocks) to graphite oxide (lighter colored blocks) with greater interlayer distance. (2) Exfoliation of graphite oxide in water by sonication to obtain GO colloids that are stabilized by electrostatic repulsion. (3) Controlled conversion of GO colloids to conducting graphene colloids through deoxygenation by hydrazine reduction. Reproduced from ref. 51 with permission from the NPG. http://creativecommons.org/licenses/by/4.0/. | ||
3.6 GO analogs with high degree of functionalization
Stoichiometric derivatives of graphene with other chemistries having a high degree of functionalization and a well-defined structure are of great interest to the 2D materials research. While GO contains a non-stoichiometric number of oxygenated groups with mixed compositions on its structure, graphene derivatives with exclusive existence of carboxyl or hydroxyl (graphol) are also reported (see Sections 3.6.1 and 3.6.2). Furthermore, graphene can covalently interact with other elements such as hydrogen (graphane), fluorine (fluorographene), sulfur (thiographene) and nitrogen (amino- and cyanographene), allowing their further transformation and device implementation.69A simple, high-yielding, one-step strategy for the preparation of graphol consists of reacting fluorographite78 or iodographene79 with sodium hydroxide under solvothermal conditions. Since the hydroxyl substituents are sufficiently hydrophilic, the solvent water molecules can easily enter into the layers, resulting in the complete exfoliation of the materials. Ball milling, in the solid state, of solid KOH powder and graphite flakes gives hydroxyl-functionalized graphene in one step. The resultant graphol shows good hydrophilicity, electroactivity and biocompatibility with human RPE cells.80 Hydroxyl in graphene is an important chemical group that influences the tribological properties of materials by creating H bonds in the layered lattice structure, hence, by modifying inter-sheet shear resistance. Methods to control its load are crucial to develop effective graphene-based lubricants.81
4 Synthetic routes for the preparation of bulk graphite/graphene oxide
4.1 Oxidative exfoliation of graphite
4.1.1.1 Chlorate.
Brodie method. The preparation of multilayered graphene oxide (graphite oxide) dates back to 1859 when Benjamin Brodie82 treated graphite with strong oxidizers, for the first time, with the goal to elucidate its structure. In the historical experiment, Brodie heated lamellar graphite (with distinction to amorphous) in a mixture of potassium chlorate (KClO3) and fuming nitric acid (HNO3) at 60 °C for a few days (3–4 d). The product he obtained (GO-BR) after multiple oxidative treatments (four to seven), washing and drying process showed a composition of carbon, hydrogen and oxygen and its averaged general formula was estimated to be C11H4O5 (C/O: 2.2). Also, Brodie observed that the product was soluble in pure or basic water, while it had a tendency to flocculate in more acidic media. Furthermore, the material had a feeble acid reaction when placed upon litmus paper. For this reason, Brodie coined the term “graphic acid” (GA) to describe his new discovery (Fig. 14).
Staudenmaier, Hofmann methods. Almost forty years later, L. Staudenmaier83 ameliorated Brodie's procedure by modifying the way potassium chlorate was added to the reaction mixture and by adding sulfuric acid portionwise during the course of the reaction. More specifically, KClO3 was added in small doses to eliminate the danger associated with the evolution of explosive by-products and heat. Also, H2SO4 was added to increase the acidity of the mixture which drove the oxidation of graphite and shortened the reaction time as well. More importantly, at lower pH, a smaller amount of fuming nitric acid was needed for the oxidation, though, avoiding large emission of toxic gases (NO2, N2O4) and the handling of a large quantity of corrosive and hazardous materials, which made the overall process safer. This way, he obtained materials (GO-ST) with similar properties to GO-BR. In 1937, Hofmann also developed a safe alternative using KClO3 and non-fuming nitric acid alone to prepare GO-HO with a lower level of oxidation (C/O > 2.5).84 KClO3 is a powerful oxidant and is used as an in situ source of molecule oxygen while nitric acid is known to react strongly with aromatic carbon surfaces, including carbon nanotubes.7 Although the conditions using KClO3 and HNO3 were developed at the beginning of the discovery of GO, they were among the most powerful oxidative methods known in that time and are still used today for the preparation of GO on the preparative scale.
4.1.1.2 Permanganate.
Hummers' method. The most important method in the field of oxidative chemical exfoliation of graphite was developed by Hummers and Offeman,85 almost one hundred years after the initial discovery of Brodie. Hummers and Offeman developed the fastest and safest conventional method of producing GO-HU with a C/O ratio (2.25) very similar to that of GO-BR (2.2). Their method was based on the action of an excess of potassium permanganate, sulfuric acid and a small amount of sodium nitrate over graphite. Their method was much safer than the chlorate-based methods because the evolution of explosive ClO2 was avoided. Also, the excess of KMnO4 was conveniently neutralized with a diluted solution of H2O2 to form non-toxic manganese sulfate salts and gaseous oxygen easily removed during the purification steps. Nevertheless, nitric acid was generated in situ upon acidification of sodium nitrate and some toxic gases (NO2, N2O4) were still produced. So far, the materials produced by the Brodie, Staudenmaier or Hummers’ method have shown more defects (holes, wrinkles, irregular shape, presence of contaminants, etc.) than those produced directly from micromechanical cleavage of graphite.7 Hummers' method remains a key point of interest because it is an easy reaction suitable for producing large quantities of graphite oxide (MlGO) that can be fully delaminated into GO using liquid exfoliation techniques (Section 5). However, it yields GO with traces of sulfur (up to 6%)19 and nitrogen likely due to the covalently bonded sulfates and nitrates or adsorbed sulfuric and nitric acids.24
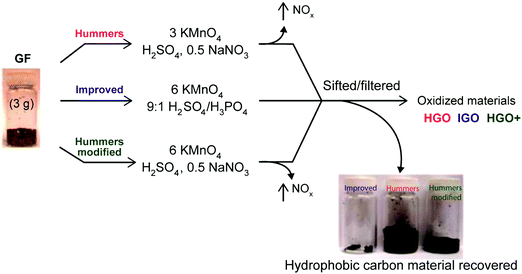
Tour's method. Noteworthily, an improved procedure for the preparation of GO with a high level of oxidation using a modified Hummers' method was developed in 2010.27 Phosphoric acid (H3PO4), a dispersive and etching agent, was used instead of sodium nitrate to assist the oxidative chemical exfoliation of graphite and to produce GO in higher yield. The GO prepared using the Tour method (GO-TO) has a higher level of oxidation and has a more regular structure with fewer defects in the basal plane compared to GO-BR, GO-ST and GO-HU. The more regular structure is explained by the formation of five-membered cyclic phosphate groups between the phosphoric acid and two vicinal diols formed on the graphite basal plane. This one pot approach is very popular and is often recognized as the “fourth” principal method to prepare GO after Brodie, Staudenmaier and Hummers (Fig. 15).1–3 A detailed study of the mechanism of the intercalation shows how sulfuric acid and potassium permanganate intercalate into the graphite's intergalleries (Fig. 16).86–88
Mechanism of the oxidative chemical exfoliation with KMnO4. Despite recent progress in GO chemistry and structure, the mechanism of its formation gained less attention and is still not fully understood. Tour has suggested that the formation of GO from Gr proceeds in three distinct and independent steps:86 The first step is the conversion of Gr to the sulfuric acid–graphite intercalation compound (GIC) which made the graphite more reactive to oxidation without any important change in its structure. The second step is the conversion of the GIC into the oxidized form of graphite (OGr) defined as “pristine graphite oxide” (PGO). PGO formation is a slow diffusion-controlled process and depends on the rate of replacement of the acid intercalate by the oxidant. The oxidation would be initiated on the active positions of the graphite sheets, i.e., on the edges and imperfect regions, then on the basal plane under strong oxidation conditions (Fig. 16).88 Most likely, in this step, the reduced form of the oxidizing agent remains in the interlayer galleries and is not removed until PGO exfoliates completely upon exposure to water (step 3). In the third step, PGO is converted to GO by the reaction of PGO with water. To exfoliate PGO, the hydration by water should overcome electrostatic attraction within the intercalated compound. Also, under acidic conditions, water should hydrolyze covalent sulfate and ester groups that possibly crosslink two neighboring GO layers stabilizing PGO structure against its exfoliation into single layer GO. Furthermore, hydration is driven by hydrogen bonding and by electrostatic interaction between GO and water. This results in the formation of a colloidal suspension of GO monolayers in water.
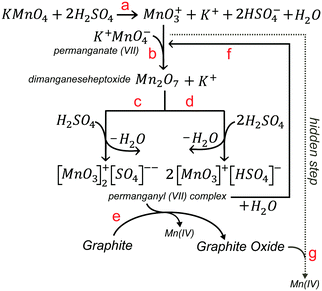
Others have proposed also a fourth hidden step based on the oxidation of GO by MnO4− ions after the addition of water.89 Although potassium permanganate is a common oxidant, the active chemical species responsible for the conventional step of the main oxidation (step 2) of the Hummers’ reaction in sulfuric acid are MnO3+ (Scheme 5a) and Mn2O7 (Scheme 5b).86–88 Manganese heptoxide (Mn2O7) is a dark oil formed upon contact of KMnO4 with H2SO4 and is explosive. It can detonate in the presence of organic molecules or upon heating to more than 55 °C.7 It is more likely, however in step 2, that Mn(VII)-H2SO4 exists in the form of planar permanganyl (MnO3+) cations bonded with sulfate ions and hydrogen sulfate in the form of (MnO3)2SO4 (Scheme 5c) or MnO3HSO4 (Scheme 5d).87 In the reaction mixture, the permanganyl Mn(VII) are reduced to Mn(IV) ions and graphite is oxidized to graphite oxide (Scheme 5e). In the presence of sulfuric acid, Mn(IV) ions react further to produce soluble manganese sulfate salts (not shown). After the addition of water (step 3), manganese (VII) oxo species mostly exist as permanganate (MnO4−) under the acidic aqueous conditions (Scheme 5f). Until their destruction with H2O2, MnO4− ions have a high oxidizing potential and coexist with GO, which further increase its oxidized domains (Schemes 5g and 6).
Specific advancements into the Hummers’ method. Nitrate-free: One of the disadvantages of the addition of sodium nitrate in the Hummers’ method is that it can enhance oxidation on the basal planes of the graphitic sheets, which caused enormous strain resulting in rupture and peeling off.90 For this reason, it is advantageous to opt for a process based on the complete removal of NaNO391–93 or by substituting it with K2S2O8,94,95 H3PO427 or K2FeO4.96 The elimination of nitrate is more environmentally friendly as it stops completely the production of toxic gases such as NO2 and N2O4. Furthermore, it prevents the uptake of nitrogen contamination in the structure of GO. It has been shown recently that the exclusion of NaNO3 does not affect the yield of the overall reaction and GO with nearly the same properties to that of conventional methods is obtained.91 Nitrate-free approaches are generally milder than the original Hummers’ method and a careful control of the amount of water and the temperature of the reaction leads to GO with either hydroxyl and epoxide-rich GO or more carbonyl-rich domains (Fig. 17), respectively.72
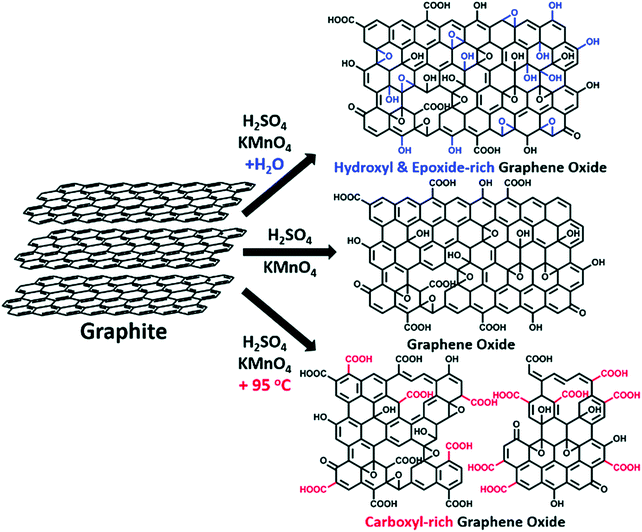 | ||
| Fig. 17 The synthesis of GOs with controlled species of oxygenated groups. Reproduced from ref. 72 with permission from the Royal Society of Chemistry. | ||
Two-step: First, graphite flakes may be pre-oxidized using a mixture of sulfuric acid, phosphorus pentoxide and persufate ions (S2O82−) to yield suspensions of individual graphite sulfate sheets (C24+HSO4−) very slightly oxidized. After this oxidative pretreatment, the material can be oxidized further in a second step using a nitrate-free version of the Hummers’ method. This 2-step approach is useful to prepare GO with a high level of oxidation, hence a lower C/O ratio (1.8).94,95
Co-oxidant: Alternatively, K2FeO4 of higher oxidability can enhance the intercalation and pre-oxidation of graphite and was used as a co-oxidant in combination with KMnO4. In this modified Hummers' method, a reduced amount of concentrated H2SO4 was used to increase the concentration of graphite and oxidants, which also improved the kinetics of the oxidation process.96
Physical promoters: Hummers' method has also been modified in some cases to produce GO through the use of physical means to assist the in situ oxidative chemical exfoliation of graphite. Effectively, when ultrasonication (sonochemical),97,98 microwave irradiation99 or ball milling techniques (mechanochemical)100 were applied directly to the reaction mixture, the delamination of Gr was favored and the yield of GO was increased compared to conventional stirring using a magnetic Teflon bar or rotary impeller to assist the exfoliation.
Safety: Tour and collaborators101 also notify that it is important to respect the mixing protocol in which, the graphite is added first to a mixture of sulfuric acid–phosphoric acid and finally, potassium permanganate is added in small portions to avoid any explosions or hazards caused by an excess of KMnO4 in the acid mixture. Also, a pre-cooling protocol (PCP) for mixing graphite at lower temperature (5 °C) in the acid mixture to avoid explosions associated with the exotherm of the reaction on a larger scale has been developed.102 Mechanochemical techniques using much less acid and dry ice addition during the course of the reaction to keep the temperature under control to stabilize the highly oxidative and explosive Mn2O7 intermediate are effective methods to avoid safety risk.103
Low- and room-temperature methods: For low-cost production of GO on a large scale, it is important to put low- and room-temperature oxidation into consideration due to the cost and risk for thermal input and less defective products obtained at lower temperatures.104–106 Eigler and collaborators have shown increasing advantages by performing the oxidation at temperatures below 10 °C for a longer time to minimize CO2 formation to yield highly intact GO with preserved structural integrity.104 However, this low-temperature process is time-consuming and suffers from low yield.105 A combination of a room-temperature oxidation procedure and a functionalization effect of water existing in commercial concentrated H2SO4 leads to GO with mainly hydroxyl and epoxy groups on the basal plane, helpful for exfoliation yield and dispersibility. This gives graphene material with fewer defects after reduction.105,106
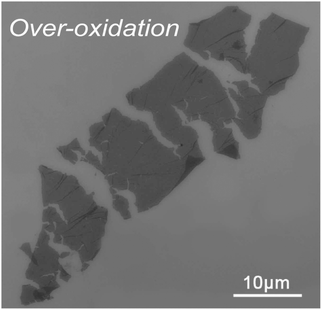
Size and defects: In general, controlling the size and defects of GO sheets can be achieved by modifying the reaction parameters of the classical method:87,107–114 the type of graphite (large natural flakes,99,111 sieved flakes of various sizes,91,107,108 microparticles,23 powders111), the temperature (from 5 to 65 °C),104,112 the time (from a few minutes to a few days) and the stoichiometric amount of oxidant.30,109,110,113,114 These parameters have an impact on the kinetics of the oxidation reaction, therefore they can be used to control the extent of oxidation which is in direct correlation with the size and defects of GO flakes. More precisely, because oxidative chemical exfoliation methods use harsh conditions acting like a ‘’molecular shreader’’, they have a tendency to breakdown the carbon backbone and to yield GO flakes with smaller particle size than the initial graphite.109 Hence, heating the reaction at a more elevated temperature, for a longer time in the presence of more reagents drives the oxidation and likely yields small GO flakes with cracks and a high oxygen content (Fig. 18).109 To obtain more intact sheets, it is advantageous to use large natural flakes of graphite with higher crystallinity as a starting material because they are more resistant to the attack of strong acids and yield larger GO sheets with fewer defects.90,111 When discussing the factors affecting the size of GO flakes, mechanical stirring is also a parameter that cannot be ignored because it promotes the homogeneous mixture of graphite with oxidizing agents but introduces fragmentation in the GO flakes. For example, ultra-large GO sheets can be obtained from an agitation-free modified Hummers’ oxidation.115–117
For GO papers and membranes, it is clear that large GO flakes induce stronger mechanical performance, higher electrical/thermal conductivity and stronger electromagnetic interference shielding performance. For example, by comparing the properties of GO papers made from small (S) and large (L) flakes, LGO papers exhibit 320% improvement in Young's modulus and 280% improvement in tensile strength. In addition, when made into a monolithic porous material, the LGO-based material performs better than SGO in terms of electrical conductivity, mechanical strength and ion-absorption. For electrochemical applications, increasing the lateral size is beneficial to the electrical conductivity and stability of graphene-based anodes, which contributes to the improved cycle stability of Li/Al-ion batteries. Further evidence comes from the fact that LGO-based networks perform better in Li/S batteries than their SGO counterparts.116
4.1.1.3 Novel oxidants. Beside chlorate and permanganate-based oxidizers, modern ways to oxidize graphite include the use of potassium chromate under the Jones conditions7,118 or in combination with nitric or perchloric acid.119 Also, GO can be prepared using less toxic potassium ferrate in sulfuric acid at room temperature,120 although it is not generally recognized that ferrate ions (Fe(VI)) are suitable for the oxidation of graphite because of their high instability in an acidic environment and low oxidation power in neutral and alkaline environments.121 Alternatively, Fe(VI) can oxidize graphite in water in the presence of H2O2 with heating at 50 °C.122 Interestingly, GO quantum dots (GO-QDs) can be prepared from the acid-free oxone oxidation of carbon structures such as graphite, carbon nanotubes, carbon fibers and charcoal in DMF.123 Similarly, benzoyl peroxide (BPO) can oxidize graphite at 110 °C.124 Noteworthily, BPO acts as the sole oxidant and reagent towards graphene oxide under these metal-free conditions. In general, the new state-of-the-art developments in the wet preparation of GO are purposed to replace the more toxic and hazardous methods such as the ones previously presented based on chlorate or permanganate oxidation. Those processes using novel oxidants are considered scalable, but the cooling and handling of large volumes of hot solutions still bring several manufacturing problems not easy to solve. In terms of quality, the GO produced through chemical methods suffers from the presence of impurities, and more importantly, from significant structural damage as a result of the harsh synthetic conditions. Both of these features cause alteration of its electrical properties, which limits its use for electronic devices. However, the presence of such defects can be beneficial for tailoring GO electrochemical behavior.
![[double bond, length as m-dash]](https://www.rsc.org/images/entities/char_e001.gif) O) on EGO can be tuned simply via the electrolyte concentration.129 Quinones, hydroxyls, aldehydes, epoxides, and peroxide functional groups are inherently electrochemically active, showing both oxidizability and reducibility at mild electrochemical potentials. At more extreme potentials and pH, it is also possible to reduce carboxyl groups (lower than −2 V). It is interesting to note that different preparation methods of GO, such as those of Staudenmaier, Hofmann, Hummers, or Tour, demonstrate contrasting reduction potentials. Specifically, GO-ST and GO-HO exhibit a single reduction wave at −1.2 V (vs. Ag/AgCl) and GO-HU shows three distinctive waves (−1.2, −1.4, and −1.8 V vs. Ag/AgCl). On the other hand, GO-TO exhibits superposed waves at −1.4 and −1.8 V.130
O) on EGO can be tuned simply via the electrolyte concentration.129 Quinones, hydroxyls, aldehydes, epoxides, and peroxide functional groups are inherently electrochemically active, showing both oxidizability and reducibility at mild electrochemical potentials. At more extreme potentials and pH, it is also possible to reduce carboxyl groups (lower than −2 V). It is interesting to note that different preparation methods of GO, such as those of Staudenmaier, Hofmann, Hummers, or Tour, demonstrate contrasting reduction potentials. Specifically, GO-ST and GO-HO exhibit a single reduction wave at −1.2 V (vs. Ag/AgCl) and GO-HU shows three distinctive waves (−1.2, −1.4, and −1.8 V vs. Ag/AgCl). On the other hand, GO-TO exhibits superposed waves at −1.4 and −1.8 V.130
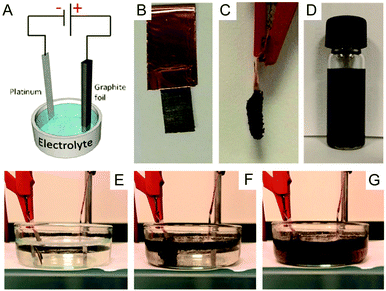 | ||
| Fig. 19 (A) Schematic illustration of the experimental setup. Photos of graphite foil (B) before and (C) after the exfoliation process. (D) Graphene dispersion in DMF solution (1 mg mL−1). Photos illustrating the exfoliation process at (E) time zero, (F) after 5 min, and (G) after 20 min. Reproduced from ref. 128 with permission from Wiley-VCH. | ||
| Reagents | Methods | Conditions | Products | # | Lat. size | C/O | Ref. |
|---|---|---|---|---|---|---|---|
| # = number of layers; GA = graphic acid; m = many; mod. = moderate; ml = multi lamellar; GO = graphene oxide; s = sheet; I = improved; Np = nanoplatelet; Ns = nanosheet; OGr = oxidized graphite; sl = single layer; FI = ferro-induced; QD = quantum dot; f = flake; d = dry; w = wet; n = new; UL = ultra large; NGF = natural graphite flake; Fgp = flexible graphite paper; BES = bioelectro system; BE = bioelectrochemically exfoliated; BC = biologically converted; M = microbial; B = bacteria-treated. | |||||||
| Chemical methods | |||||||
| Chlorate | Brodie (1859) | KClO3, fuming HNO3, 60 °C, 3–4 d | GA | m | — | 2.2 | 82 |
| Staudenmaier (1898) | KClO3, HNO3 + H2SO4, 60 °C, 1–2 d | mlGO | m | — | — | 83 | |
| Hofmann (1937) | KClO3, HNO3 (non-fuming) | mlGO | m | — | 2.5–3.5 | 84 | |
| Permanganate | Hummers (1958) | KMnO4 + NaNO3, H2SO4, 35 °C, 2 h | mlGO | m | — | 2.25 | 85 |
| Tour (2010) | KMnO4, H2SO4 + H3PO4, 50 °C, 12 h | IGO | 2 | 60–160 μm | <2.2 | 27 | |
| Nitrate-free | KMnO4, H2SO4, 40 °C, 0.5 h | GOs | 1 | nm to μm | >2 | 91 | |
| Two-step | (1) K2S2O8, H2SO4 + P2O5, 80 °C, 6 h | C24+HSO4− | — | — | — | 94 and 95 | |
| (2) KMnO4, H2SO4, 35 °C, 2 h | GOs | 1 | 0.9–9 μm | 1.8 | |||
| Co-oxidant | KMnO4 + K2FeO4, H2SO4, 35 °C, 3 h | GO | 2–3 | 10–20 μm | 2.12 | 96 | |
| Sonochemical | KMnO4 + NaNO3, H2SO4, r. t., 20 min | GONs | 8 | >200 nm | — | 97 | |
| Sono. two-step | (1) H2SO4, 300 W, r.t., 1–6 h | slGO | 1 | 3 mm | — | 98 | |
| (2) KMnO4, H2SO4, r.t., 2 h | |||||||
| Microwave-assisted | KMnO4, H2SO4, 250 W, 150 s | GOs | 1 | 5 μm | 1.89 | 99 | |
| Mechanochem. (dry) | KMnO4, ball mill, 500 rpm, 3 h | dGO | 1 | 30–50 nm | 7.3 | 100 | |
| Mechanochem. (wet) | KMnO4, H2SO4, b. m., 500 rpm, 3 h | wGO | 1 | 30–50 nm | 1.2 | 100 | |
| Mech. dry ice | KMnO4, H2SO4, b. m., 5–35 °C | slGO | 1 | >300 nm | 1.73 | 103 | |
| Pre-cooling protocol | KMnO4, H2SO4 + H3PO4, 5–65 °C, 24 h | slGO | 1–8 | 1–1.2 μm | — | 102 | |
| Low temperature | KMnO4, H2SO4, NaNO3, 0–10 °C, 16 h | nGO | 1 | 2–10 μm | — | 104 and 105 | |
| Room temperature | KMnO4, H2SO4, 10–25 °C, 4–8 h | slGO | 1 | 20–30 μm | — | 105 and 106 | |
| Agitation-free | KMnO4, H2SO4, 35 °C, 4 h | ULGO | 1 | 128 μm | >2.2 | 115 | |
| Chromate | Jones (1978) | H2CrO4, H2SO4 (patent) | OGr+–HSO4− | m | — | — | 118 |
| Cr(VI) | K2CrO4, HClO3, HNO3, 50 °C, 24 h | GO | 1–5 | 30–70 nm | — | 119 | |
| Ferrate | Fe(VI) | K2FeO4, H2SO4, r.t., 1 h (recycling) | slGO | 1 | 10 μm | 2.2 | 120 and 121 |
| Fe(VI) | K2FeO4 + H2O2, H2O, 50 °C, ∼4 h | FIGOf | 1 | <1 μm | 2.2 | 122 | |
| Oxone | Acid-free | KHSO5, DMF, heat | GQD | 1–3 | <8 nm | — | 123 |
| Peroxide | Organic | C14H10O4 (BPO), 110 °C, 10 min | GONp | 1 | < 1 μm | — | 124 |
| Electrochemical methods | |||||||
| Ammonium | Stirred-vessel NGF | (NH4)2SO4, H2SO4, Ti mesh, 24 h | EGO | 1 | 1–10 μm | 3.63 | 125 |
| Graphite rod (Pt) | [N(CH3)3]Br (surfact), H2O, 0–1 V, 2 h | GONs | 3–5 | 1–30 μm | — | 131 | |
| Chloride | Graphite sulfate (Pt) | KCl, H2O, 4 V, 10 h | GOs | 1–3 | — | — | 132 |
| Pencil graphite | HCl, H2O, 7 V, 10 h | GOs | Few | — | — | 133 | |
| Hydroxide | Pencil graphite | NaOH, H2O, 7 V, 10 h | GOs | Few | — | — | 133 |
| Phosphate | Pencil graphite | PBS, H2O, pH 7.4, 7 V, 10 h | GOs | Few | — | — | 134 |
| Nitrate | Nat. gr. flakes | HNO3, H2O, 2–24 h | mlGO | m | — | — | 135 |
| Perchlorate | Nat. gr. flakes | HClO4 8 M, 1.4 V | mlGO | m | >100 μm | 9.8 | 128 |
| Graphite foil (Pt) | LiClO4 0.5 M, 2–10 V | GOf | 6–8 | 3–10 μm | 4.0 | 135 | |
| Sulfate | Water-electrolytic Fgp | (1) H2SO4 98%, 1.6 V | slGO | 1 | 1–10 | 1.7 | 126 |
| (2) H2SO4 50%–water 50%, 5 V | |||||||
| Packed-bed react. NGP | 3D-printed graphite press, 2 V, 2 min | EGO | 1 | 2.15 μm | 3 | 127 | |
| Graphite foil (Pt) | H2SO4 0.5 M, 2–10 V | GOf | 6–8 | 3–10 μm | 8.1 | 128 | |
| Graphite foil (Pt) | Na2SO4 0.5 M, 2–10 V | GOf | 6–8 | 3–10 μm | 8.8 | 128 | |
| Pseudomonas (genus) | Graphite rod (BES) | Anaerobic sludge, −0.6 V, 30 d | BEGO | 1–3 | 300–500 nm | Mod. | 136 |
| Permanganate | Tour reagent | H2SO4 + H3PO4, KMnO4, 60 °C, 6 h | GO | 1 | 10 μm | 1.88 | 137 |
| Quartz | Device | Reversible oxi-red Au/Pd (2 V) | MLGO/rGO | 30–60 | 1 μm | 2–10 | 138 |
| Microbial methods | |||||||
| Acidithiobacillus ferrooxidans CFMI-1 | FeSO4·7H2O buffer, 30 °C, 3 d | BCGONs | 3–4 | 150–900 nm | 12.9 | 139 | |
| Nitrifying bacteria 2011.2 | Nitration buffer, 30 °C, 5 d | MGONs | 2–3 | 50–300 nm | Mod. | 140 | |
| Pseudomonas | Naphthalene buffer, 14 d | BOGrs | 2–7 | < 1 μm | 5.7 | 141 | |
Electrochemical methods have gained attention recently because they are performed in water and they are based on a fast and simple process easy to execute. Electrochemistry consists of driving electrons into the graphite electrode (foil, rod or flakes, flexible paper) under anodic or cathodic conditions to force the intercalation of aqueous electrolyte ions in the interlayer galleries of graphite, hence, driving its exfoliation as a consequence.125,128 Several different electrolytes such as ammonium,131 chloride,132,133 hydroxide,133 phosphate,134 nitrate,135 perchlorate,128,135 sulfate128 and genus Pseudomonas in anaerobic sludge136 have been tested for the preparation of mono and few-layer EGO. Water (W) electrolytic oxidation of graphite sulfate126 is an extremely clean and fast process. After absolute control of the experimental set-up, using a lifting platform to move slowly the graphite flexible paper (GFP) pre-intercalated electrochemically with sulfuric acid, W-EGO having a C/O ratio (1.7) lower than GO-TO (1.8) is obtained in high yield with few defects. It is worth noting that the intensity ratio of the D peak to G peak in W-EGO is higher than that in GO-HU, suggesting that the sp2 domains in W-EGO are smaller than those in GO-HU. With only two 250 mL beakers as reactors and a 0.5 mm-thick, 40 mm-wide FGP as the raw material, this method yields W-EGO at a rate of about 12 g h−1. Interestingly, the water electrolytic method involved minimum washing and re-using of the electrolytes, showing the great potential of this method for mass production of EGO sheets (Fig. 20).126
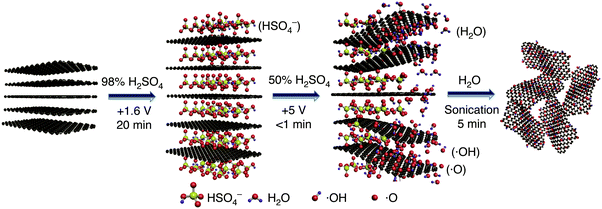 | ||
| Fig. 20 Synthesis of EGO by water electrolytic oxidation: schematic illustration of the synthesis process of EGO by water electrolytic oxidation. Reproduced from ref. 126 with permission from the NPG. http://creativecommons.org/licenses/by/4.0/. | ||
Another two-step approach for the synthesis of large graphene oxide (LGO) sheets with lateral dimensions of ≈10 μm or greater has been developed.137 The first step is a pre-treatment step involving electrochemical intercalation of H2SO4 and H3PO4, the mixture of acids used in the Tour method. This causes exfoliation of the graphene layer and increases the interlayer spacing between the sheets. The second step is the conventional oxidation step, where oxidation of exfoliated graphene sheets was performed using KMnO4 as the oxidizing agent. Electrochemistry is a powerful tool as it allows GO to be reversibly reduced and oxidized using electrical stimulus. Controlled reduction and oxidation in two-terminal devices containing multilayer GO films have shown to result in switching between partially reduced EGO and ErGO, a process which modifies the electronic and optical properties (Fig. 21).138
 | ||
| Fig. 22 (A) Photos of graphite foil after the exfoliation process. (B) Schematic diagram for bacterial degradation of GO. Reproduced from ref. 141 with permission from the Royal Society of Chemistry. | ||
4.2 Oxidative chemical methods for 3D carbon structures
The chemical methods used to oxidize and exfoliate pristine graphite or natural graphite flakes presented in Section 4.1 are approaches that are flexible and therefore can be generalized to a wider scope of carbon sources. Using the peroxide, persulfate or permanganate method, alone or in combination with a physical means to promote the delamination, GO can be prepared successfully from other carbon precursors with three dimensional structures such as carbon black,142 carbon fibers,143 carbon nanohorns,144,145 carbon nanotubes,14613C-labeled CVD-graphite grown on nickel13 and expanded graphite (Fig. 23).147–149 The advantages given by these methods are to allow a higher reactivity of the carbon source and to control the formation of GO with new morphological shape or with different isotopic compositions. For example, the hydrothermal oxidation of carbon black by hydrogen peroxide yields spherical quantum nanodots of GO with diameters of around 3 to 4.5 nm.142 Also, persulfate and permanganate oxidation of carbon fibers yields single layer GO sheets of up to 1 μm in length,143 while nanosheets of GO (2–50 nm) can be prepared from carbon nanohorns using modified Hummers' method144 and the unzipping of multiwalled (MW) carbon nanotubes by successive treatments with H2SO4 and KMnO4 yields GO nanoribbons with controllable size ranging from 100 nm to 4 μm.146 One important example shows that GO enriched with carbon-13 can be prepared from modified Hummers' method using 13C-graphite prepared using CVD techniques as the carbon source.13 Finally, expanded graphite is commercially available and is another convenient source of carbon more reactive than conventional graphite towards the oxidation using Hummers' method. In the presence of the intercalating agents (H2SO4), expanded graphite goes into a spontaneous expansion step and produces a foam-like intermediate more easily oxidized by the oxidant (KMnO4). This method becomes facile, safe, productive and practical for scalable production of larger flakes of GO (Table 2).147–149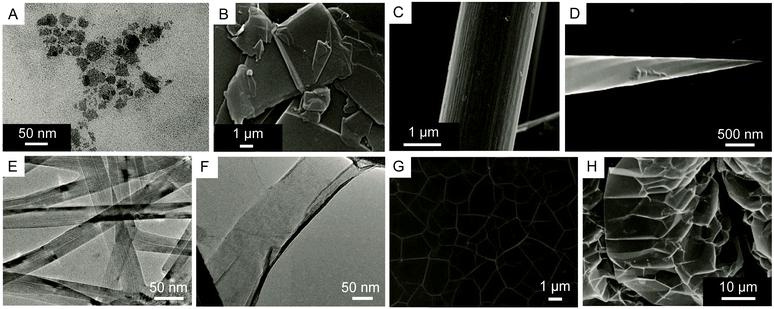 | ||
| Fig. 23 Electron microscopy images of (A) GO produced from amorphous carbon black. Reproduced (adapted) from ref. 142 with permission from the Royal Society of Chemistry. (B) Natural graphite flakes and (C) carbon fibers. Reproduced (adapted) from ref. 143 with permission from the NPG (http://creativecommons.org/licenses/by/4.0/). (D) Carbon nanohorns. Reprinted with permission from (Chem. Rev., 2016, 116, 4850–4883). Copyright (2016) American Chemical Society. (E) Carbon nanotubes and (F) GO nanoribbons from the unzipping of a carbon nanotube. Reproduced (adapted) from ref. 146 with permission from the NPG (http://creativecommons.org/licenses/by/4.0/). (G) 13C-graphite grown on nickel (CVD). From [Science, 2008, 321, 1815–1818]. Reprinted (adapted) with permission from AAAS. (H) Expanded graphite. Reproduced (adapted) from ref. 149 with permission from the Elsevier Science. | ||
| Carbon precursors | Methods | Conditions | Products | # | Lat. size | C/O | Ref. |
|---|---|---|---|---|---|---|---|
| # = number of layers; GO = graphene oxide; dot = quantum dot; sl = single layer; Ns = nanosheet; Nr = nanoribbon; ml = multi lamellar; OG = oxidized graphene; r.t. (RT) = room temperature; EG = expanded graphite; B = bacteria-treated; rGO = reduced graphene oxide; CVD = chemical vapor deposition; s = sheet; Np = nanoplatelet; m = many; mod. = moderate; GQG= graphene quantum dot. | |||||||
| Oxidative chemical methods for 3D-carbon structures | |||||||
| Carbon black | Peroxide | H2O2 1%, autoclave, 180 °C, 1.5 h | GO-dot | 3–8 | 3–4.5 nm | 1.84 | 142 |
| Carbon fibers | (1) Preoxidation | (1) K2S2O8, H2SO4 + P2O5, 80 °C, 5 h | slGO | 1 | 1 μm | — | 143 |
| (2) Mod. Hummers | (2) KMnO4, H2SO4, 35 °C, 2 h | ||||||
| Carbon nanohorns | Mod. Hummers | KMnO4, H2SO4, 70 °C, 40 min | GONs | 1–10 | 2–50 nm | — | 144 |
| Carbon nanotubes | Unzipping (MW) | (1) H2SO4, r.t., 24 h | GONr | 1–3 | 0.1–4 μm | 1.38 | 146 |
| (2) KMnO4, r.t., 1 h; 55–70 °C, 1 h | |||||||
| CVD 13C-graphite | Mod. Hummers | KMnO4, H2SO4, 35 °C, 2 h | 13C-mlGO | — | — | — | 13 |
| Expanded graphite | Mod. Hummers | KMnO4, H2SO4, r.t., 0.5 h | slGO | 1 | ∼15 μm | 2.5 | 147 |
| Microwave (3 steps) | (1) sealed tube, N2, <2 s | slGO | 1 | 11–14 μm | — | 148 | |
| (2) K2S2O8, H2SO4 + P2O5, 80 °C, 4.5 h | |||||||
| (3) KMnO4, H2SO4, 35 °C, 2 h | |||||||
| Oxidation methods for graphene | |||||||
| CVD graphene | Photochemical | UV light, O3, r.t., atm P | slOG | 1 | — | High | 150 |
| Rf Plasma | O2, 15 W, 20 mTorr | slOG | 1 | — | High | 151 | |
| AFM Anodic | Conductive silicon tip, 15–30 V | GONr | 1–2 | 25–800 nm | — | 152 | |
| Chemical vapor deposition methods for hydrocarbons | |||||||
| Methane | Catalytic growth | Cu foil, H2, Ar, moisture, 500 °C | GO film | 2–3 | — | 1.6–3.2 | 155 |
| Coronene | Catalytic growth | 316 SS, H2, N2, TCB, 800 °C | rGO film | 9–23 | — | Mod. | 156 |
| Ethanol | CVD-repair | GO, H2, 950 °C | rGO film | <5 | — | — | 157 |
| Ethylene | CVD-repair | rGO, 800 °C, 3 min | CVDGO | 1 | >0.1–10 μm | — | 158 |
| Isopropanol | CVD-repair | rGO, H2, Ar, 750 °C | rGO | 1 | ∼30 μm | — | 159 |
| Hydrothermal methods for carbohydrates | |||||||
| Glucose (fructose, sucrose) | Tang–Lau | H2O, autoclave, 160 °C, 30 min | GOs | 1–1500 | 20–100 μm | 2.8 | 160 |
| Glucose | Tang–Lau | H2O, microwave, 595 W, 1–9 min | GQDs | <5 nm (spheres) | 20.7 | 161 | |
| Thermal decomposition methods for organic matter rich in C | |||||||
| Bamboo | Two-steps pyrolysis | 673–973 K, N2 | OGNp | 25–60 | 5–100 μm | 7–32 | 171 |
| Rice straw biochar | (1) Pyrolysis | 450 °C, N2, 45 min | GONp | 1–3 | 60–100 nm | — | 172 |
| (2) Mod. Hummers | KMnO4, H2SO4, r.t., 20 min | ||||||
| Sugarcane | Catalytic pyrolysis | Ferrocene, 300 °C, 10 min | mlGO | m | — | — | 173 |
4.3 Oxidative methods for graphene
The development of practical methods appropriate for the production of graphene and GO with a high control of the atomic structure is mandatory for the fabrication of devices with sub-nanometer precision and is an important step toward the miniaturization as it should facilitate applications in the areas of nanoelectronics, molecular sensors, photonics, catalysis and composite materials. GO-based devices can be made directly from CVD graphene using nanopatterning techniques in combination with an oxidative method to change the level of oxidation at specific locations. Oxidized graphene with a low level of oxidation can be obtained by photochemical oxidation in the presence of UV and O2,150 oxygen plasma151 and local anodic oxidation using a conductive AFM (atomic force microscope) tip.152 However, a fully comprehensive, systematic study of the impact of those methods on graphene is still missing in the literature. The extent of oxygen functionalization (in terms of oxygen density) is controlled by careful tuning of the time duration of the treatments. In the case of AFM, a negative bias voltage of 15 to 30 V is applied on the silicone tip, creating an electric field large enough to induce electrochemical oxidation of the sample at room temperature in the presence of moisture. Lithography is capable of producing small features with sub-nanometer spatial resolution (25 nm). The process allows controlling the dimensions and electrical conductivity during the fabrication (Fig. 24).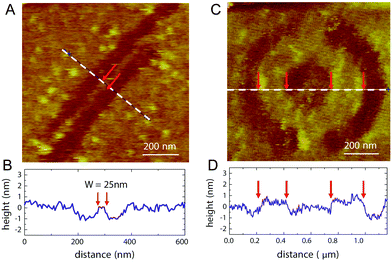 | ||
| Fig. 24 (A) AFM image of a nanoribbon fabricated on a graphene flake with thickness ∼1 nm. The width and length of the ribbon are 25 and 800 nm, respectively. (B) Height profile along the dashed line in (a). (C) A nanoring (inner radius ∼160 nm, outer radius ∼380 nm) patterned on a graphene flake. Two long trenches, not shown in the picture, were subsequently drawn from the circumference of the ring outward to the edges of the flake to electrically isolate the ring device. (D) Height profile along the dashed line in (c). Reproduced from ref. 152 with permission from the AIP Publishing. | ||
4.4 CVD methods for hydrocarbons
Recently developed chemical vapor deposition techniques have emerged as one of the most popular ways for the scalable production of large-area and high-quality carbon materials for various applications in electronics, because they are inexpensive, versatile and they produce materials of very high purity. CVD is extremely useful in the process of atomic layer deposition of monocrystalline, polycrystalline, amorphous, and epitaxial materials such as graphene, carbon nanofibers and nanotubes, diamond, fluorocarbons and more recently, graphene oxide and reduced graphene oxide.153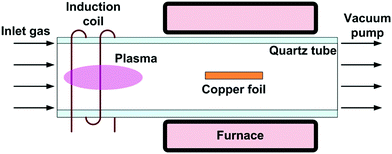 | ||
| Fig. 25 Layout of the PECVD system. Reproduced from ref. 154 with permission from the AIP Publishing. | ||
 | ||
| Fig. 26 SEM image of (A) GO flakes [highlighted in purple] on the SiO2 substrate with ca. 60% coverage before ethanol CVD treatment and (B) rGO flakes [highlighted purple] and the extended rGO growth [highlighted in yellow] with a total of ca. 75% coverage after a 30 min CVD treatment. (C) High-magnification image of the new growth bridging between two rGO flakes. Reproduced from ref. 157 with permission from the Royal Society of Chemistry. | ||
4.5 Hydrothermal methods for carbohydrates
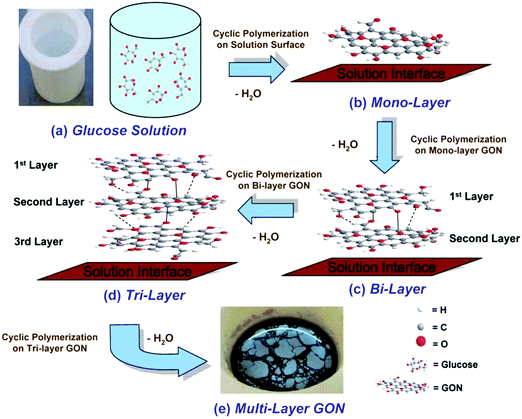 | ||
| Fig. 27 Schematic illustration of the layer-by-layer bottom-up synthesis mechanism of GON. Under hydrothermal conditions, glucose molecules (a) undergo cyclic polymerization to form monolayer GON (b) which floats on solution due to its hydrophobicity; the second layer of GON may be grown underneath the first GON layer forming a bi-layer GON (c); subsequently, tri-layer (d) and multilayer GONs (e) can be produced. Reproduced from ref. 160 with permission from the Royal Society of Chemistry. | ||
4.6 Thermal decomposition methods for organic matter rich in C
This section will focus on a class of reactions that uses natural, cheap, highly renewable and abundant organic wastes as a source of carbon. Using low-cost and less sophisticated techniques, oxidized-graphenic materials, monolayer and multilayer graphene oxide, have been synthesized using pyrolysis of bamboo pyroligneous acid,171 oxidative chemical exfoliation of rice straw biochar using a modified Hummers' method172 and catalytic pyrolysis of sugarcane organic wastes.173 By varying the carbonization temperature of bamboo pyroligneous acid (BPA), oxidized-graphenic nanoplatelets (OGNp) can be obtained with oxygen content below 20%. The disordered crystal structure is a mix of sp2 and sp3 characters (sp2 = 66%). Nanoplatelets synthesized at higher temperature (973 K) present lower oxygen content with short-range crystalline order and a carbon environment that is mainly sp2 (87%).171 Straw collected from rice biochar was sundried for several days, washed with water to remove dust, dirt and other impurities. Then, it was dried and carbonized. The material obtained was crushed and sieved, and then it was used as a substitute for graphite in the reaction with KMnO4 and H2SO4.172 Sugarcane bagasse is a type of agricultural waste (agro waste). After its juice was extracted, the remaining fiber was crushed, well ground and mixed with ferrocene. Then it was placed in a crucible and put directly into a muffle furnace at 300 °C for 10 min under atmospheric conditions.173 The produced materials presented a well-graphitized structure in comparison with those from the commonly used methods. Other structural properties were in terms of morphology, particle size and surface roughness, chemical composition and conductivity very similar to those of conventionally obtained rGO and GO materials.5 Post-synthesis treatments
5.1 Removal of the impurities from the bulk graphite/graphene oxide
GO prepared using one of the methods described previously (Section 4) is always recuperated as a crude brownish mixture (Fig. 28a) composed essentially of graphite/graphene oxide sheets and debris of different lateral sizes. Therefore, GO needs to be further purified for adequate characterization (Fig. 28b and d). As prepared, GO contains a large amount of impurities in the bulk such as the unreacted starting materials, hydrophobic carbon materials and carbonaceous materials,27 the reagents, the impurities contained in them (metallic elements)44–46 and finally, more importantly, Mn2+ when potassium permanganate is used in the Hummers’ method.35 Those elements have to be washed away appropriately in the purification steps in order to harvest GO with the desired elemental purity for device integration. The common way to get rid of most of the soluble contaminants (metal ions, sulfate, nitrate, phosphate, manganese(IV), mellitic acid,35etc.) is to wash GO with a diluted solution of hydrogen chloride (5–10% w/w) several times with shaking until the material goes completely into suspension. Between each wash, GO is recuperated either by vacuum filtration or by centrifugation. Then, the residues of HCl trapped inside GO are removed by washing with a copious amount of Nanopore water.174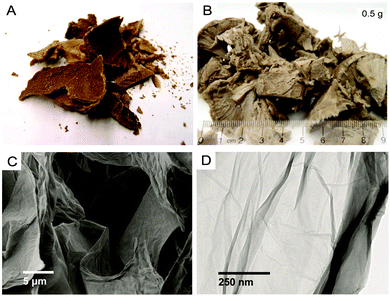 | ||
| Fig. 28 Optical images of (A) crude GO, (B) GO after centrifugation and lyophilization, (C) SEM and (D) TEM magnification of GO monolayers. Reproduced (adapted) from ref. 174 with permission from the UQÀM (PhD thesis, 2017). | ||
The remaining salt impurities can be removed by treating with resinous anion and cation exchangers.85 Alternatively, GO can be dialyzed for seven (7) days in the dark (with several changes of the dialyzing water) until the solution is free from GO debris particles, sulfate and chloride ions12 using typically a polyether sulfone membrane with a pore size of 1.2 μm175 or a membrane made of regenerative cellulose with a molecular cut-off of 1000164 to 3000 Da.162 GO can be rapidly purified from insoluble, graphitic, hydrophobic and carbonaceous materials by centrifugation at a low speed (5000 rpm)21 or by filtration using a metallic drum-sieve and polyester fibre,27 glass wool, ceramic paper, woven glass fibre, perlite, or Celite (diatomaceous earths).176 Mineral salts or reactive solids (calcium chloride, bentonite clay, kaolinite) are used to flocculate and precipitate GO. Particular solvents or solvent combinations (diethyl ether/ethanol,27 isopropyl alcohol, methanol, acetone)176 make GO product flocculate and precipitate, hence more easily filtered, or otherwise separated from its impurities. Furthermore, GO is very hygroscopic and has a high affinity for water. GO imparts a high water uptake capacity of up to 0.58 gram of water per gram of GO.177 After its isolation, it needs to be dehydrated at 40 °C, either under vacuum (1 × 10⁻² mbar)12 or over phosphorus pentoxide.85
5.2 Liquid exfoliation techniques
The most common way to apply acoustic waves to the GO solution is usually by the immersion of a borosilicate glass beaker containing a suspension of GO in a temperature-controlled sonication water-bath at a frequency of 40 kHz with a power of 40–200 W. Submersible sonication probes such as cell homogenizers with variable power are also very effective in quickly delaminating GO directly in the solution using a series of very short powerful bursts.178 This approach is to be used very carefully as these probes have a tendency to heat up the solution, which can be potentially damageable for GO. Also, because the submersible probes are subject to degradation during the high-power bursts, they release ceramic and metal particles in the GO solution, which have to be removed by centrifugation or filtration in an additional step. Briefly, in the laboratory, the crude mixture of GO is usually suspended in Nanopure water (1–5 mg mL−1) using a magnetic stirrer (24 h), then the suspension is sonicated for a short period of time (30 min). There is a specific sonication time for exfoliation because GO flakes are easily torn during the process. The exposure time of GO solution to ultrasound is critical as they quickly deteriorate the quality of GO resulting in smaller sheets.111 Typical size of GO sheets obtained from acoustic cavitation ranges from hundreds of nanometers to a few microns. To avoid overexposure and get more intact larger flakes, one way is to apply in sequence short periods of sonication followed by a separation technique (centrifugation or filtration). This way, GO is removed from the bulk to minimize further deterioration and to better control the desired size of the sheets, while the unexfoliated material is resubmitted to ultrasound treatments.181 AFM (atomic force microscopy) is one of the most powerful tools to investigate the exfoliation rate and to evaluate the lateral size and thickness of the graphitic flakes.87
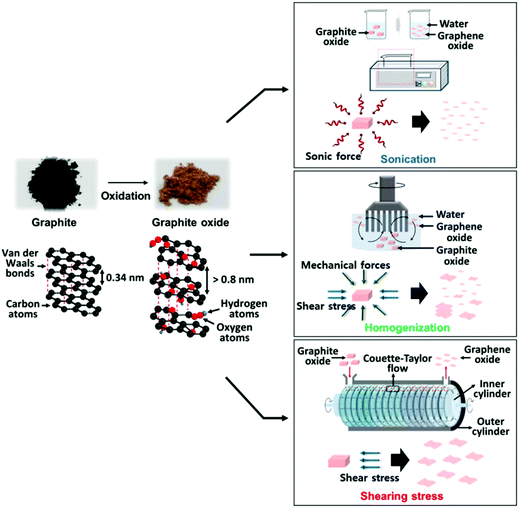 | ||
| Fig. 29 Schematic of various exfoliation methods of graphite oxide (sonication, homogenization, and shearing stress). Reproduced from ref. 186 with permission from the NPG. http://creativecommons.org/licenses/by/4.0/. | ||
5.3 Fractionation of GO sheets by size
It is a technique that relies on the fact that the sedimentation rate of a material is dependent on its shape, size, and buoyant density, as well as the density and viscosity of the centrifugal medium and the rotor speed.
As the rotor of centrifuge spins with a definite angular velocity, an apparent centrifugal force acts on the suspension and pushes radially outwards towards the side of the tube in the meantime. There is a correlation between the size and density of a particle and the rate at which the particle separates from a colloidal mixture, when the only force applied is that of gravity (sedimentation). The larger the size and the larger the density of the particles, the faster they separate from the mixture. By applying a larger effective gravitational force to the mixture, like a centrifuge does, the separation of the particles is accelerated.192
Gradient differential centrifugation (GDC). GDC is commonly performed using distilled water as the dispersive medium. Under centrifugation force, large GO sheets precipitate at a lower centrifugation speed (5000 rpm) and are recuperated from the solution, while smaller sheets remain in the supernatant and need stepwise speed increments (gradient differential) up to 25
![[thin space (1/6-em)]](https://www.rsc.org/images/entities/char_2009.gif) 000 rpm to settle in the tube with size differentiation (Fig. 31).174,193 Alternatively, the initial dispersion is centrifuged at a high centrifugation rate, separating small flakes in the supernatant from large flakes in the sediment. Redispersion of the sediment, followed by successive centrifugation, separation and redispersion cycles can be used to separate the flakes by size so long as the centrifugation rate is decreased with each cycle.194,195
000 rpm to settle in the tube with size differentiation (Fig. 31).174,193 Alternatively, the initial dispersion is centrifuged at a high centrifugation rate, separating small flakes in the supernatant from large flakes in the sediment. Redispersion of the sediment, followed by successive centrifugation, separation and redispersion cycles can be used to separate the flakes by size so long as the centrifugation rate is decreased with each cycle.194,195
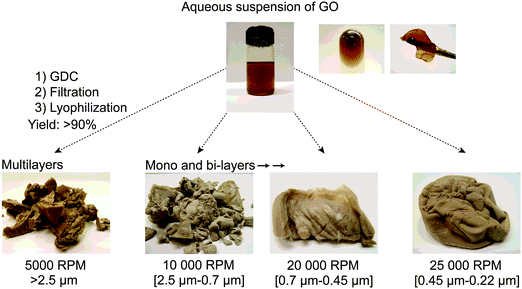 | ||
| Fig. 31 Fraction of GO obtained after gradient differential centrifugation (GDC) and membrane filtration of an aqueous suspension of GO. Reproduced (adapted) from ref. 174 with permission from the UQÀM (PhD thesis, 2017). | ||
Density gradient centrifugation (DGC). DGC196 is a variation where the components of a sample are separated on the basis of their density, which is theoretically independent of lateral area. After being centrifuged in a water–glycerol mixture,197 in sucrose,198 or in iodixanol solutions with density higher than water, GO will locate at a different height within the tube corresponding to its buoyant density (Fig. 32).199 Centrifugation of such density gradients causes the GO sheets to move to their isopycnic points – locations where the density of the medium matches the buoyant density of the GO. Compared to differential centrifugation, DGC requires significantly longer times to afford enough time to the slowest particles to reach their isopycnic points.192
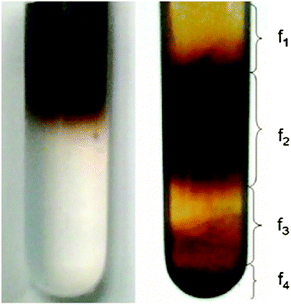 | ||
| Fig. 32 Photograph of a centrifuge tube (left) before and (right) after density gradient centrifugation (DGC). Reproduced from ref. 199 with permission from the Elsevier Science. | ||
 | ||
| Fig. 33 Typical SEM image of (A) conventional GO, (B) small GO sheets, (C) medium GO sheets and (D) large GO sheets; Scale bar: 20 μm. Reproduced (adapted) from ref. 200 with permission from Wiley-VCH. | ||
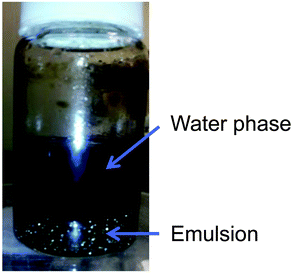 | ||
| Fig. 35 Image of fractionated GO. The upper phase contains GO suspended in water and the lower region contains GO at the interface of a chloroform-in-water emulsion. Reproduced from ref. 202 with permission from the Elsevier Science. | ||
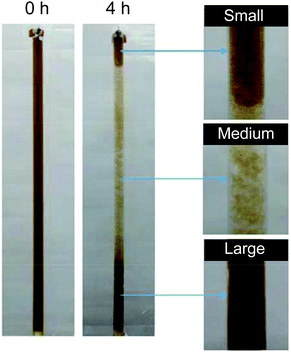 | ||
| Fig. 36 Digital images of GO separation results after 4 h using the circular flow technique. Reproduced (adapted) from ref. 203 with permission from the Royal Society of Chemistry. | ||
6 Conclusion and outlook
The amount of scientific research devoted to the preparation of graphite oxide and graphene oxide is tremendous and new approaches are constantly being explored. GO is composed of carbon, hydrogen and oxygen atoms, and independently of the way chosen to make it, its structure and reactivity are regulated by the concepts and principles of organic chemistry. At the current state of graphene research, the synthesis of GO via the Hummers’ and the electrochemical methods for graphite are the most promising approach towards large scale production of graphene materials. Although the resulting GO is imperfect as compared to graphene obtained from microcleavage, it is a useful platform for the fabrication of functionalized graphene-based devices that can potentially improve mechanical, thermal and electrical properties. GO can be shaped into paper-like membranes using filtration or casting techniques, scrolls by shear stress, tubes, monolithic foams and sponges by freeze-casting freeze-drying techniques and fibers using spinning methods. GO has potential use in transparent conductive layers, nanoelectronics, solar cells, chemical and biosensors, electrochemistry, brain implants, catalysis, coatings, paints/3D inks, polymer composites, textiles, concrete and construction, membranes for audio transducers, environmental remediation, drug delivery and energy storage (batteries). A cheaper cost of production and the ability to fine-tune the properties of GO could accelerate the integration of these start-up technologies in our daily life. While GO and related materials have been known for more than one century, they continue to attract the curiosity and remain the principal central point of interest of many fundamental and applied studies in nanotechnology.In summary, GO has its own history that can be traced back to 1859, independently of its relationship with graphene, which has attracted considerable attention since 2010 when Geim and Novoselov won a Nobel Prize for discovering graphene from graphite. In this review, we provided a historical perspective of its structure and preparation. So far, the GO materials have contained a significant amount of oxygen and, possibly, significant numbers of defects. CVD repairing of GO and rGO sheets have produced enhanced results and finding routes for complete restoration of the sp2 carbon network is of current interest. For the last decade (2007 to 2016), the annual global emission of CO2 was estimated to be 9.4 billion metric tons,204 which is more than 12 times greater than the world's inferred resources exceeding 800 million tons of recoverable graphite.205 If GO could be produced on a large scale from various precursors, including organic wastes or environmental carbon dioxide, the supply of GO might be enormously increased. More importantly, rational synthetic modifications could potentially provide novel procedures or even novel graphene-based materials for future practical applications, and at the same time, this would have a positive impact on the climate change for example. The progress of commercial applications of graphene is still at its beginning. At this moment, it is critical to highlight the most appropriate method for the preparation of graphene oxide to ensure its quality and supply. We hope that this review, multidisciplinary in nature, will be valuable and beneficial to find new ways to make GO and related materials on a global scale.
Authors contributions
P. P. B. performed the literature search and wrote the manuscript including the preparation of figures and tables. All authors reviewed the manuscript prior to submission.Funding
P. P. B. is grateful to FR-QNT (Fonds de Recherche Québécois Nature et technologies) for continuous postgraduate research funding (2013–2017: PhD (UQÀM) and PDF (UofToronto/McGill)). This work is financed in part by the Natural Sciences & Engineering Research Councils (NSERC) of Canada and NanoQAM.Conflicts of interest
There are no conflicts to declare.Acknowledgements
We thank all M. Siaj's laboratory members, interns and collaborators who have worked on the synthesis of graphene oxide and shared their passion for chemistry of materials.References
- S. Eigler and A. M. Dimiev, Graphene Oxide: Fundamentals and Applications, John Wiley and Sons, 1st edn, 2017 Search PubMed.
- W. Gao, Graphene Oxide: Reduction Recipes, Spectroscopy, and Applications, Springer Springer Cham, Heidelberg New York Dordrecht London, 2015 Search PubMed.
- J. Zhao, et al., Graphene Oxide: Physics and Applications, Heidelberg New York Dordrecht London, 2014 Search PubMed.
- S. Park and R. S. Ruoff, Nat. Nanotechnol., 2009, 4, 217–224 CrossRef CAS PubMed.
- D. Chen, et al. , Chem. Rev., 2012, 112, 6027–6053 CrossRef CAS PubMed.
- D. R. Dreyer, et al. , Chem. Soc. Rev., 2014, 43, 5288–5301 RSC.
- D. R. Dreyer, et al. , Chem. Soc. Rev., 2010, 39, 228–240 RSC.
- S. Eigler and A. Hirsch, Angew. Chem., Int. Ed., 2014, 53, 7720–7738 CrossRef CAS PubMed.
- A. Lerf, et al. , J. Phys. Chem. B, 1998, 102, 4477–4482 CrossRef CAS.
- A. Lerf, et al. , Solid State Ionics, 1997, 103, 857–862 CrossRef.
- H. He, et al. , Chem. Phys. Lett., 1998, 287, 53–56 CrossRef CAS.
- H. He, et al. , J. Phys. Chem., 1996, 3654, 19954–19958 CrossRef.
- W. Cai, et al. , Science, 2008, 321, 1815–1818 CrossRef CAS PubMed.
- T. Szabó, et al. , Chem. Mater., 2006, 18, 2740–2749 CrossRef.
- T. Szabó, et al. , Carbon, 2005, 43, 3186–3189 CrossRef.
- W. Gao, et al. , Nat. Chem., 2009, 1, 403–408 CrossRef CAS PubMed.
- B. K. Erickson, et al. , Adv. Mater., 2010, 22, 4467–4472 CrossRef PubMed.
- T. Dimiev, et al. , J. Am. Chem. Soc., 2012, 134, 2815–2822 CrossRef PubMed.
- S. Eigler, et al. , Chem. – Eur. J., 2013, 19, 9490–9496 CrossRef CAS PubMed.
- L. Yang, et al. , Angew. Chem., Int. Ed., 2014, 53, 10109–10113 CrossRef CAS PubMed.
- P. P. Brisebois, et al. , Chem. – Eur. J., 2016, 22, 5849–5852 CrossRef CAS PubMed.
- W. R. Collins, et al. , Angew. Chem., Int. Ed., 2011, 50, 8848–8852 CrossRef CAS PubMed.
- C. K. Chua and M. Pumera, Chem. Soc. Rev., 2014, 43, 291–312 RSC.
- H. L. Poh, et al. , Nanoscale, 2012, 4, 3515–3522 RSC.
- C. K. Chua, et al. , Chem. – Eur. J., 2012, 18, 13453–13459 CrossRef CAS PubMed.
- Z. Sofer, et al. , ACS Nano, 2015, 9, 5478–5485 CrossRef CAS PubMed.
- D. C. Marcano, et al. , ACS Nano, 2010, 4, 4806–4814 CrossRef CAS PubMed.
- A. Y. S. Eng, et al. , Chem. – Eur. J., 2013, 19, 12673–12683 CrossRef CAS PubMed.
- S. Park, et al. , Nano Lett., 2009, 9, 1593–1597 CrossRef CAS PubMed.
- N. Morimoto, et al. , Sci. Rep., 2016, 6, 21715 CrossRef CAS PubMed.
- E. C. Salas, et al. , ACS Nano, 2010, 4, 4852–4856 CrossRef CAS PubMed.
- O. O. Ekiz, et al. , ACS Nano, 2011, 5, 2475–2482 CrossRef CAS PubMed.
- D. Voiry, et al. , Science, 2016, 361, 1413–1416 CrossRef PubMed.
- P. Šimek, et al. , Adv. Funct. Mater., 2014, 24, 4878–4885 CrossRef.
- R. K. Singh, et al. , RSC Adv., 2016, 6, 64993–65011 RSC.
- A. T. Smith, et al. , Nano Mater. Sci., 2019, 1, 31–47 CrossRef.
- O. Jankovský, et al. , Appl. Mater. Today, 2016, 4, 45–53 CrossRef.
- L. Wang, et al. , J. Mater. Chem. C, 2014, 2, 2887–2893 RSC.
- H. L. Poh, et al. , ACS Nano, 2013, 76, 5262–5272 CrossRef PubMed.
- X. Li, et al. , J. Mater. Chem. C, 2013, 1, 7308–7313 RSC.
- L. M. Rivera, et al. , Catalysts, 2017, 7, 278 CrossRef.
- L. Wang, et al. , Angew. Chem., Int. Ed., 2013, 52, 13818–13821 CrossRef CAS PubMed.
- Y. Shi and L.-J. Li, J. Mater. Chem., 2011, 21, 3277–3279 RSC.
- C. H. A. Wong, et al. , Proc. Natl. Acad. Sci. U. S. A., 2014, 111, 13774–13779 CrossRef CAS PubMed.
- A. Ambrosi, et al. , Proc. Natl. Acad. Sci. U. S. A., 2012, 109, 12899–12904 CrossRef CAS PubMed.
- A. Ambrosi, et al. , Angew. Chem., Int. Ed., 2012, 51, 500–503 CrossRef CAS PubMed.
- L. Wang, et al. , Nanoscale, 2019, 11, 11083–11085 RSC.
- J. Zhang, et al. , Chem. Commun., 2010, 46, 1112–1114 RSC.
- S. H. Dave, et al. , ACS Nano, 2016, 10, 7515–7522 CrossRef CAS PubMed.
- S. Park, et al. , ACS Nano, 2008, 2, 572–578 CrossRef CAS PubMed.
- D. Li, et al. , Nat. Nanotechnol., 2008, 3, 101–105 CrossRef CAS PubMed.
- J. Ma, et al. , Membranes, 2017, 7, 52–81 CrossRef PubMed.
- S. Mura, et al. , ACS Appl. Nano. Mater., 2018, 1, 6724–6732 CrossRef CAS.
- X. Yang, et al. , RSC Adv., 2012, 2, 8821 RSC.
- K. H. Thebo, et al. , J. Mater. Sci. Technol., 2018, 34, 1481–1486 CrossRef.
- D. A. Dikin, et al. , Nature, 2007, 448, 457–460 CrossRef CAS PubMed.
- S. J. Kim, et al. , Sci. Rep., 2018, 8, 1959 CrossRef PubMed.
- R. Jalili, et al. , ACS Nano, 2013, 7, 3981–3990 CrossRef CAS PubMed.
- M. Khan, et al. , J. Mater. Chem. A, 2015, 3, 18753–18808 RSC.
- R. K. Singh, et al. , RSC Adv., 2016, 6, 64993–65011 RSC.
- Y. Wang, et al. , J. Phys. Chem. C, 2011, 115, 23192–23197 CrossRef CAS.
- X. Wang, et al. , J. Am. Chem. Soc., 2011, 133, 6338–6342 CrossRef CAS PubMed.
- W. Zhang, et al. , RSC Adv., 2015, 5, 146–152 RSC.
- B. Konkena and S. Vasudevan, J. Phys. Chem. Lett., 2012, 3, 867–872 CrossRef CAS PubMed.
- J. Zhao, et al. , Anal. Chem., 2011, 83, 9100–9106 CrossRef CAS PubMed.
- V. Nicolosi, et al. , Science, 2013, 340, 1226419 CrossRef.
- Y. Zhu, et al. , ACS Nano, 2010, 4, 1227–1233 CrossRef CAS PubMed.
- J. I. Paredes, et al. , Langmuir, 2008, 24, 10560–10564 CrossRef CAS PubMed.
- M. Pumera and Z. Sofer, Chem. Soc. Rev., 2017, 46, 4450–4463 RSC.
- D. Cheng, et al. , J. Electrochem. Soc., 2017, 164, H345–H351 CrossRef CAS.
- Z. Miao, et al. , RSC Adv., 2016, 6, 58561–58565 RSC.
- J. Chen, et al. , Chem. Sci., 2016, 7, 1874–1881 RSC.
- K. Klímová, et al. , J. Phys. Chem. C, 2016, 120, 24203–24212 CrossRef.
- Q. Yang, et al. , Ind. Eng. Chem. Res., 2012, 51, 310–317 CrossRef CAS.
- A. Bakandritsos, et al. , ACS Nano, 2017, 11, 2982–2991 CrossRef CAS PubMed.
- I.-Y. Jeon, et al. , Proc. Natl. Acad. Sci. U. S. A., 2012, 109, 5588–5593 CrossRef CAS PubMed.
- H. L. Poh, et al. , Chem. – Eur. J., 2015, 21, 8130–8136 CrossRef CAS PubMed.
- U. Rajeena, et al. , New J. Chem., 2018, 42, 9658–9665 RSC.
- J. Sun, et al. , ACS Appl. Mater. Interfaces, 2016, 8, 10226–10233 CrossRef CAS PubMed.
- L. Yan, et al. , J. Mater. Chem., 2012, 22, 8367–8371 RSC.
- B. Gupta, et al. , Sci. Rep., 2017, 7, 45030 CrossRef CAS PubMed.
- B. C. Brodie, Philos. Trans. R. Soc. London, 1859, 149, 249–259 CrossRef.
- L. Staudenmaier, Ber. Dtsch. Chem. Ges., 1898, 31, 1481–1487 CrossRef CAS.
- V. L. Hofmann and E. Konig, Z. Anorg. Allg. Chem., 1937, 31, 311–336 CrossRef.
- W. S. Hummers and R. E. Offeman, J. Am. Chem. Soc., 1958, 80, 1339 CrossRef CAS.
- A. M. Dimiev and J. M. Tour, ACS Nano, 2014, 8, 3060–3068 CrossRef CAS PubMed.
- G. Shao and Y. Lu, et al. , J. Mater. Sci., 2012, 47, 4400–4409 CrossRef CAS.
- S. Pan and I. A. Aksay, ACS Nano, 2011, 5, 4073–4083 CrossRef CAS PubMed.
- J. H. Kang, et al. , Chem. Mater., 2016, 28, 756–764 CrossRef CAS.
- D. R. Chowdhury, et al. , RSC Adv., 2014, 4, 15138–15145 RSC.
- J. Chen, et al. , Carbon, 2013, 64, 225–229 CrossRef CAS.
- S. Chen, et al. , Carbon, 2015, 81, 826–834 CrossRef.
- M. Zhang, et al. , Adv. Mater., 2015, 27, 6708–6713 CrossRef CAS PubMed.
- N. I. Kovtyukhova, et al. , Chem. Mater., 1999, 11, 771–778 CrossRef CAS.
- S. Eigler, Chem. Commun., 2015, 51, 3162–3165 RSC.
- H. Yu, et al. , Sci. Rep., 2016, 6, 36143 CrossRef CAS PubMed.
- A. Esmaeili and M. H. Entezari, J. Colloid Interface Sci., 2014, 432, 19–25 CrossRef CAS PubMed.
- C. Y. Su, et al. , Chem. Mater., 2009, 21, 5674–5680 CrossRef CAS.
- X. Wang, et al. , RSC Adv., 2014, 4, 60102 RSC.
- O. Y. Posudievsky, et al. , J. Mater. Chem. A, 2013, 1, 6658 RSC.
- D. C. Marcano, et al. , ACS Nano, 2018, 12, 2078 CrossRef CAS PubMed.
- P. Ranjan, et al. , Sci. Rep., 2018, 8, 12007 CrossRef PubMed.
- D. Luo, et al. , Mater. Today Phys., 2019, 9, 100097 CrossRef.
- S. Eigler, et al. , Adv. Mater., 2013, 25, 3583–3587 CrossRef CAS PubMed.
- H. Chen, et al. , Chem. Sci., 2019, 10, 1244–1253 RSC.
- J. Qin, et al. , J. Mater. Chem. A, 2019, 7, 9646–9655 RSC.
- G. Wang, et al. , Appl. Phys. Lett., 2011, 99, 53114 CrossRef.
- J. Chen, et al. , Carbon, 2016, 110, 34–40 CrossRef CAS.
- J. P. Zhao, et al. , ACS Nano, 2010, 4, 5245–5252 CrossRef CAS PubMed.
- L. Zhang, et al. , Carbon, 2009, 47, 3365–3380 CrossRef CAS.
- C. Botas, et al. , Carbon, 2013, 63, 562–592 CrossRef.
- D. Kang and H. S. Shin, Carbon Lett., 2012, 13, 39–43 CrossRef.
- J. Guerrero-Contreras and F. Caballero-Briones, Mater. Chem. Phys., 2015, 153, 209–220 CrossRef CAS.
- K. Krishnamoorthy, et al. , Carbon, 2013, 53, 38–49 CrossRef CAS.
- L. Dong, et al. , Chem. Mater., 2017, 29, 564–572 CrossRef CAS.
- L. Dong, et al. , Chem. Soc. Rev., 2017, 46, 7306–7316 RSC.
- A. T. Smith, et al. , Nano Mater. Sci., 2019, 1, 31–47 CrossRef.
- T. Ishikawa, et al., Composites of oxidized graphite material and expanded graphite material, Nippon Carbon Co., USPTO, USA, 1978 Search PubMed.
- M. Wojtoniszak and E. Mijowska, J. Nanopart. Res., 2012, 14, 1248–1255 CrossRef PubMed.
- L. Peng, et al. , Nat. Commun., 2015, 6, 5716–5725 CrossRef CAS PubMed.
- Z. Sofer, et al. , Angew. Chem., Int. Ed., 2016, 55, 11965–11969 CrossRef CAS PubMed.
- C. Yu, et al. , Sci. Rep., 2016, 6, 17071 CrossRef CAS PubMed.
- Y. Shin, et al. , Nanoscale, 2015, 7, 5633–5637 RSC.
- J. Shen, et al. , Chem. Mater., 2009, 21, 3514–3520 CrossRef CAS.
- P. Yu, et al. , Chem. Mater., 2016, 28, 8429–8438 CrossRef CAS.
- S. Pei, et al. , Nat. Commun., 2018, 9, 145 CrossRef PubMed.
- S. E. Lowe, et al. , ACS Appl. Nano Mater., 2019, 2, 867–878 CrossRef CAS.
- A. Ambrosi and M. Pumera, Chem. – Eur. J., 2016, 22, 153–159 CrossRef CAS PubMed.
- Z. Tian, et al. , Carbon, 2017, 112, 185–191 CrossRef CAS.
- A. Ambrosi, et al. , Chem. Rev., 2014, 114, 7150–7188 CrossRef CAS PubMed.
- K. Kakaei and K. Hasanpour, J. Mater. Chem. A, 2014, 2, 15428 RSC.
- X. You, et al. , J. Nanosci. Nanotechnol., 2011, 11, 5965–5968 CrossRef CAS PubMed.
- H. Imran, et al. , RSC Adv., 2015, 5, 63513–63520 RSC.
- N. E. Sorokina, et al. , Inorg. Mater., 2001, 37, 360–365 CrossRef CAS.
- B. Gurzȩda, et al. , Carbon, 2016, 100, 540–545 CrossRef.
- L. Lu, et al. , Sci. Rep., 2015, 5, 16242 CrossRef CAS PubMed.
- N. Kumar and V. C. Srivastava, ACS Omega, 2018, 3, 10233–10242 CrossRef CAS PubMed.
- O. O. Ekiz, et al. , ACS Nano, 2011, 5, 2475–2482 CrossRef CAS PubMed.
- C. Zhu, et al. , RSC Adv., 2014, 4, 55044–55047 RSC.
- C. Zhu, et al. , Nanoscale, 2013, 5, 8982–8985 RSC.
- L. Liu, et al. , Nanoscale, 2015, 7, 13619–13628 RSC.
- Y. Q. Lu, et al. , Green Chem., 2017, 19, 900 RSC.
- M. Lee, et al. , Sci. Rep., 2015, 5, 11707 CrossRef PubMed.
- M. Zhang, et al. , J. Mater. Chem. B, 2016, 4, 121–127 RSC.
- N. Karoukis, et al. , Chem. Rev., 2016, 116, 4850–4883 CrossRef PubMed.
- D. V. Kosynkin, et al. , Nature, 2009, 458, 872–876 CrossRef CAS PubMed.
- L. Sun and B. Fugetsu, Mater. Lett., 2013, 109, 207–210 CrossRef CAS.
- Z. Luo, et al. , J. Am. Chem. Soc., 2009, 131, 898–899 CrossRef CAS PubMed.
- T. Liu, et al. , Carbon, 2017, 119, 544–547 CrossRef CAS.
- S. Zhao, et al. , Nanotechnology, 2012, 23, 355703 CrossRef.
- A. Nourbakhsh, et al. , Nanotechnology, 2010, 21, 435203 CrossRef PubMed.
- L. Weng, et al. , Appl. Phys. Lett., 2008, 93, 9–11 CrossRef.
- H. C. Lee, et al. , RSC Adv., 2017, 7, 15644–15693 RSC.
- W. Choi, et al. , Crit. Rev. Solid State Mater. Sci., 2010, 35, 52–71 CrossRef CAS.
- Y. Liu and Y. Chen, J. Appl. Phys., 2016, 119, 103301, DOI:10.1063/1.4942999.
- L. Cardenas, et al. , Nanoscale, 2014, 6, 8664–8670 RSC.
- J. Huang, et al. , Nanoscale, 2013, 5, 2945–2951 RSC.
- V. López, et al. , Adv. Mater., 2009, 21, 4683–4686 CrossRef.
- S. Grimm, et al. , J. Phys. Chem. C, 2016, 120, 3036–3041 CrossRef CAS.
- L. Tang, et al. , J. Mater. Chem., 2012, 22, 5676–5683 RSC.
- L. Tang, et al. , Part. Part. Syst. Charact., 2013, 30, 523–531 CrossRef CAS.
- T. V. Tam, et al. , J. Mater. Chem. A, 2017, 5, 10537 RSC.
- L. Tang, et al. , J. Mater. Chem. C, 2013, 1, 4908–4915 RSC.
- L. Tang, et al. , ACS Nano, 2014, 8, 6312–6320 CrossRef CAS PubMed.
- F. Pan, et al. , ACS Appl. Mater. Interfaces, 2013, 5, 11108–11114 CrossRef CAS PubMed.
- L. Yang, et al. , RSC Adv., 2018, 8, 5902–5911 RSC.
- X. Li, et al. , Nanoscale, 2014, 6, 5323–5328 RSC.
- B. Zheng, et al. , Nanophotonics, 2017, 6, 259–267 CAS.
- N. Papaioannou, et al. , Sci. Rep., 2018, 8, 6559 CrossRef PubMed.
- D. Krishnan, et al. , ACS Nano, 2014, 8, 449–457 CrossRef CAS PubMed.
- J. J. Prías-Barragán, et al. , Phys. Status Solidi A, 2016, 213, 85–90 CrossRef.
- S. Goswami, et al. , Process Saf. Environ. Prot., 2017, 106, 163–172 CrossRef CAS.
- T. Somanathan, et al. , Nanomaterials, 2015, 5, 826–834 CrossRef CAS PubMed.
- P. P. Brisebois, Thesis, Montreal (Quebec, Canada), Université du Québec à Montréal, 2017, PhD Chemistry, http://archipel.uqam.ca/id/eprint/9864.
- F. J. Tölle, et al. , Carbon, 2014, 75, 432–442 CrossRef.
- G. Ceriotti, et al. , RSC Adv., 2015, 5, 50365–50371 RSC.
- B. Lian, et al. , Chem. Sci., 2018, 9, 5106–5111 RSC.
- J. T. Han, et al. , Sci. Rep., 2014, 4, 5133 CrossRef PubMed.
- C. Cai, et al. , J. Exp. Nanosci., 2017, 12, 247–262 CrossRef CAS.
- X. Qi, et al. , J. Mater. Sci., 2014, 49, 1785–1793 CrossRef CAS.
- U. Sierra, et al. , Carbon, 2014, 80, 830–832 CrossRef CAS.
- J. M. Tour, Nat. Mater., 2014, 13, 545–546 CrossRef CAS.
- M. Yi and Z. Sheng, J. Mater. Chem. A, 2015, 3, 11700–11715 RSC.
- T. S. Tran, et al. , RSC Adv., 2016, 6, 12003–12008 RSC.
- K. R. Paton, et al. , Nat. Mater., 2014, 13, 624–630 CrossRef CAS PubMed.
- W. K. Park, et al. , Sci. Rep., 2017, 7, 16414 CrossRef PubMed.
- J. Fu, et al. , Mater. Res. Innovations, 2015, 19, 278–280 Search PubMed.
- A. V. Talyzin, et al. , Carbon, 2011, 49, 1894–1899 CrossRef CAS.
- I. Ogino, et al. , Chem. Mater., 2014, 26, 3334–3339 CrossRef CAS.
- D. W. Kim, et al. , Carbon, 2015, 88, 126–132 CrossRef CAS.
- S. Tian, et al. , Sci. Rep., 2016, 6, 34127 CrossRef CAS.
- A. A. Green and M. C. Hersam, J. Phys. Chem. Lett., 2010, 1, 544–549 CrossRef CAS.
- J.-J. Huang and Y. J. Yuan, Phys. Chem. Chem. Phys., 2016, 18, 12312–12322 RSC.
- X. Lin, et al. , ACS Nano, 2012, 6, 10708–10719 CrossRef CAS PubMed.
- U. Khan, et al. , Carbon, 2012, 50, 470–475 CrossRef CAS.
- M. K. Brakke, J. Am. Chem. Soc., 1951, 73, 1847–1848 CrossRef CAS.
- E. Bidram, et al. , Carbon, 2016, 103, 363–371 CrossRef CAS.
- X. Sun, et al. , ACS Nano, 2010, 4, 3381–3389 CrossRef CAS.
- S. Li, et al. , J. Electroanal. Chem., 2013, 703, 135–145 CrossRef CAS.
- X. J. Chen, et al. , Adv. Mater., 2015, 27, 3654–3660 CrossRef.
- H. Geng, et al. , J. Am. Chem. Soc., 2017, 139, 12517–12523 CrossRef CAS.
- H. V. Kumar, et al. , Carbon, 2016, 98, 491–495 CrossRef CAS.
- S. Zhang, et al. , RSC Adv., 2016, 6, 74053–74060 RSC.
- C. Le Quéré, et al. , Earth Syst. Sci. Data, 2018, 10, 405–448 CrossRef.
- U.S. Geological Survey, 2017, Mineral commodity summaries 2017, U.S. Geological Survey, 74–75.
| This journal is © The Royal Society of Chemistry 2020 |


